Back to Journals » OncoTargets and Therapy » Volume 13
LncRNA TUG1 Regulates Cell Viability and Death by Regulating miR-193a-5p/Rab10 Axis in Acute Myeloid Leukemia
Received 16 October 2019
Accepted for publication 20 December 2019
Published 13 February 2020 Volume 2020:13 Pages 1289—1301
DOI https://doi.org/10.2147/OTT.S234935
Checked for plagiarism Yes
Review by Single anonymous peer review
Peer reviewer comments 2
Editor who approved publication: Prof. Dr. Takuya Aoki
Qun Li, Jianmin Wang
Department of PICU, First People’s Hospital of Shangqiu City, Shangqiu, Henan Province, People’s Republic of China
Correspondence: Jianmin Wang
Department of PICU, First People’s Hospital of Shangqiu City, No. 292, Kaixuan Road, Suiyang District, Shangqiu, Henan Province 476100, People’s Republic of China
Tel +86-370-3255865
Email [email protected]
Background: Acute myeloid leukemia (AML) is a serious threat to human health. Long non-coding RNA (lncRNA) Taurine-Upregulated Gene1 (TUG1) has been reported to participate in the development and progression of several cancers, including AML. Herein, we aimed to investigate the pathognomonic role of TUG1 in AML cells and its potential mechanistic pathway.
Methods: Quantitative real-time PCR (qRT-PCR) assay was applied to detect the expression levels of lncRNA TUG1, miR-193a-5p and Rab10 in AML bone marrow and cell lines. The CCK-8 assay was conducted to assess the cell viability of AML HL-60 and NB4 cells and cell apoptotic assay was performed to assess the cell death. Dual-luciferase reporter assay was carried out to clarify the relationships among TUG1, miR-193a-5p and Rab10. Also, the protein level of Rab10 was examined by Western blot assay.
Results: LncRNA TUG1 was up-regulated in AML bone marrow and cells. Functional analysis showed that the silencing of TUG1 suppressed cell viability, while promoted cell death in AML HL-60 and NB4 cells. TUG1 targeted miR-193a-5p and negatively regulated miR-193a-5p expression. Overexpressed miR-193a-5p resulted in the decrease of cell viability and the increase in the cell death in AML cells. Restoration experiments proved that TUG1 regulated the cell viability and death of AML cells through regulating the miR-193a-5p/Rab10 axis. Rab10 was a direct target of miR-193a-5p and was inversely regulated by miR-193a-5p. TUG1 regulated the cell viability and death of AML cells through upregulating Rab10.
Conclusion: Silencing of lncRNA TUG1 induces a cytotoxic effect on AML cell lines through sponging miR-193a-5p and the suppression of Rab10.
Keywords: lncRNA TUG1, miR-193a-5p, Rab10, acute myeloid leukemia
Introduction
With high mortality, acute myeloid leukemia (AML) is a devastating malignancy, mainly affecting older adults with a median age of 66 years.1 AML is characterized by high heterogeneity and fast proliferation of immature myeloid cells, leading to disturbance of normal blood cells generation.2 Current therapeutic methods for AML include intensive chemotherapy and allogeneic stem cell transplantation, which are only suitable for a small proportion of patients who are younger and fitter.3 Although the treatment of AML has improved, the prognosis of high-risk AML patients is still poor.4 Therefore, it is necessary to understand deeper about AML, so as to explore better curative methods.
Long non-coding RNAs (lncRNAs) are a group long non-coding transcripts with the length of more than 200 nucleotides (nts), play a crucial part in the development of certain cancers, including AML.5–7 The expression of LncRNAs was dysregulated in several tumors, like tongue squamous cell carcinoma (TSCC),6 gastric cancer,8 breast cancer9 and ovarian cancer.10 LncRNA Taurine-Upregulated Gene1 (TUG1), located on chromosome 22q12, has been proven to take part in the development and progression of certain cancers.11 For example, downregulated TUG1 caused the decrease of cell migratory and invasive abilities of prostate cancer cells in vitro.12 Downregulation of TUG1 inhibited cell viability and migration ability, as well as cytoskeleton rearrangement but promoted cell apoptosis of laryngocarcinoma cells in vitro.13 A former study manifested that the introduction of lncRNA TUG1 elevated cell proliferation but repressed cell apoptosis rate of several AML cell lines.14 Here, we intended to deep investigate the pathognomonic role of TUG1 in AML.
MicroRNAs (miRNAs) are another group of non-coding RNA molecules with approximately 18–25 nucleotides in length that can repress the target mRNAs posttranscriptionally.15 A growing body of evidence manifested that miRNAs play vital roles in various cancers, including AML. The expression of multiple miRNAs has been verified to be altered in AML, which was proven to have a functional correlation in leukemogenesis.16 MiR-193a-5p was a member of the miR-193 family, which involved in the cell proliferation, migration, invasion, and apoptosis of various tumors, such as breast cancer, lung cancer, colorectal cancer, hepatocellular carcinoma and AML.17,18
Rab10 is a member of the RAB family of small GTPases, which are crucial regulators of vesicular transporting.19 A former study suggested that Rab10 mediated the transport of Toll-like receptor 4, which is key for innate immune responses.20 In Esophageal squamous cell carcinoma (ESCC), Rab10 was reported to be a downstream gene of miR-378a-3p, so as to play the anti-tumor role.21
The mechanistic pathway of lncRNA TUG1 in the pathogenesis of AML was investigated in vitro.
Materials and Methods
Clinical Samples Collection
The current research was approved by the Ethics Committee of the First People’s Hospital of Shangqiu City. All experiments were conducted referring to recommendations of the Declaration of Helsinki and the written informed consent was provided by all patients and healthy volunteers or their guardians. Bone marrow samples were taken from 23 AML patients newly diagnosed by French-American-British (FAB) and World Health Organization (WHO) typing criteria combining with immunophenotyping and cytogenetic analysis, including the cases with low-percentage of bone marrow blasts (<20%) with the detection of cytogenetic aberrations, such as t (15; 17) (q22; q12). According to FAB classification, one patient had M0, two had M1, three had M2, seven had M3, six had M4, two had M5 and two had M6. The inclusion criteria were listed as follows: (1) between 4 and 18 years old (in the Department of PICU); (2) meet FAB diagnostic criteria of AML; (3) meet the WHO diagnostic criteria of AML; (4) patients with autoimmune diseases were excluded in the study; (5) without a history of toxic substance exposure; (6) without a history of radiation exposure; (7) without a history of other malignant tumors; (8) without a history of anti-leukemia treatment. Twenty-three healthy bone marrow donors who were the hematopoietic stem cell donors served as normal controls.
Cell Culture
Human AML cell lines (HL-60 and NB4) and normal marrow cells (HS-5) were purchased from American Type Culture Collection (ATCC, Manassas, VA, USA). Above cells were maintained in Roswell Park Memorial Institute 1640 Medium (RPMI1640; Gibco, Grand Island, NY, USA) with 10% fetal bovine serum (FBS, Invitrogen, Carlsbad, CA, USA). All cells were cultured at 37°C in a humidified atmosphere containing 5% CO2.
Transfection
Small interfering RNAs against TUG1 (si-TUG1#1, si-TUG1#2 and si-TUG1#3) and the scrambled negative control si-NC, miR-193a-5p mimics (miR-193a-5p), miR-193a-5p inhibitor (in-miR-193a-5p) and their matched negative controls (miR-NC, in-miR-NC), si-Rab10 and its negative control si-NC, as well as the pcDNA-TUG1 (TUG1) and pcDNA-Rab10 (Rab10), were synthesized by GenePharma Co., ltd (Shanghai, China). The pcDNA plasmid and transfection reagent Lipofectamine 3000 were purchased from Thermo Fisher Scientific (Waltham, MA, USA). The aforementioned oligonucleotides or plasmids were transfected into HL-60 and NB4 cells. In brief, cells were seeded in 24-well plates for 24 hrs. When cell confluence reached 70%, 100 μL RPMI1640 medium without serum mixed with constructed oligonucleotides (40 nM) + 2 μL Hiperfect transfection reagents QIAGEN (Dusseldorf, Germany) or plasmids (2 μg) + 3 μL Lipofectamine were incubated at 37°C for 10 mins. Then, the complexes were drop-wise added onto the cells in 24-well plates gently. Forty-eight-hour later, transfected HL-60 and NB4 cells were subjected for subsequent assays.
Quantitative Real-Time PCR (qRT-PCR) Assay
Total RNA was extracted from AML bone marrow or cells with the miRNeasy extraction kit (QIAGEN). For quantitative analysis of miR-193a-5p, TaqMan miRNA Reverse Transcription Kit (Applied Biosystems, Foster City, CA, USA) and all-in-one miRNA RT-qPCR Detection Kit (GeneCopoeia Inc., Rockville, MD, USA) were applied, with U6 small nuclear RNA as the internal control. For the detection of lncRNA TUG1 and Rab10 mRNA expression, total RNA was isolated using TRIzol LS Reagent (Ambion, Carsland, CA, USA), and then reversely transcribed into cDNA using PrimeScript RT Reagent kit (Takara Bio, Inc., Otsu, Japan). Next, real-time PCR assay was conducted with SYBR Green Real-Time PCR Master Mix (Roche Diagnostics, Basel, Switzerland). GAPDH acted as the endogenous control to normalize the expression of TUG1 and Rab10. The primers for miR-193a-5p, U6, TUG1, Rab10 and GAPDH were listed as below: miR-193a-5p, 5ʹ-TGGGTCTTTGCGGGC-3ʹ (forward) and 5ʹ-GAATACCTCGGACCCTGC-3ʹ (reverse); U6, 5ʹ-GCTTCGGCAGCACATATACTAAAAT-3ʹ (forward) and 5ʹ-CGCTTCAGAATTTGCGTGTCAT-3ʹ (reverse); TUG1, 5ʹ-TAGCAGTTCCCCAATCCTTG-3ʹ (forward) and 5ʹ-CACAAATTCCCATCATTCCC-3ʹ (reverse); Rab10, 5ʹ-CAAGGGAGCATGGTATTAGGTTT-3ʹ (forward) and 5ʹ-CTAACGTGAGGAACGCCTTTT-3ʹ (reverse); GAPDH, 5ʹ-GTCATCCATGACAACTTTGG-3ʹ (forward) and 5ʹ-GAGCTTGACAAAGTGGTCGT-3ʹ (reverse). The 2−ΔΔCt method was used to analyze the relative gene expression.
CCK-8 Assay
To evaluate the cell viability of AML HL-60 or NB4 cells, the CCK-8 assay was performed using Cell Counting Kit-8 (CCK-8; Dojindo Molecular Technologies, Gaithersburg, MD, USA) referring to the manufacturer’s instructions. In brief, after transfection, HL-60 or NB4 cells were seeded into 96-well plates (2 × 10³ cells per well). Cells were incubated in RPMI1640 Medium (containing 10% FBS). At 24, 48 and 72 hrs after transfection, 10 μL CCK-8 reagent was added into each well, followed by incubation at 37°C for another 3 hrs. The absorbance (A) value at 450 nm was measured using a Microplate Reader (Bio-Rad, Hercules, CA, USA). All assays were conducted three or more times.
Cell Apoptotic Assay
Cell death was examined utilizing Annexin V-fluorescein isothiocyanate (FITC) Apoptosis Detection kit (BD Biosciences, Franklin Lakes, NJ, USA) after 48-hrs transfection. Transfected HL-60 or NB4 cells were collected and resuspended in 500 μL 1 × Binding buffer. Then, cells were stained with 5 μL Annexin V-FITC and 5 μL PI (50 μg/mL) for 15 mins under dark conditions at room temperature. Finally, cell death was determined using a FACS Calibur™ flow cytometry (BD Biosciences).
Dual-Luciferase Reporter Assay
The online software LncBase Predicted v.2 (http://carolina.imis.athena-innovation.gr/diana_tools/web/index.php?r=lncbasev2%2Findex-predicted) was used to predict the target miRNAs of lncRNA TUG1 and found that there was a binding site between TUG1 and miR-193a-5p. What is more, the website (http://diana.imis.athena-innovation.gr/DianaTools/index.php?r=site/index) was used to predict the downstream target genes of miR-193a-5p and found the miR-193a-5p could also bind to the 3ʹUTR of Rab10. Then, segmental fragments of lncRNA TUG1 and Rab10 3ʹUTR containing the binding sites were subcloned into pGL3 luciferase promoter vector (pGL3-empty, Promega, Madison, WI, USA) to synthesize TUG1 WT and Rab10 3ʹUTR-WT reporters, respectively. Additionally, TUG1 MUT and Rab10 3ʹUTR-MUT reporters harboring the mutant binding sites were constructed. Then, these luciferase reporters were transfected into HL-60 or NB4 cells with miR-193a-5p or miR-NC using Lipofectamine 3000, respectively. Forty-eight hour later, co-transfected cells were collected and the relative luciferase activities were examined with Dual-Luciferase Reporter detection System (Promega).
Western Blot
The protein samples were extracted from transfected AML HL-60 or NB4 cells with Protein Extraction Kit (Bio-Rad). Then, the concentration of protein was measured by a bicinchoninic acid assay (BCA) protein assay kit (Pierce Biotechnology, Rockford, IL, USA). 30 μg protein samples was separated on 12% SDS-PAGE gels, then blotted onto polyvinylidene fluoride (PVDF) membranes (Millipore, Bedford, MA, USA). The membranes were firstly blocked with 5% nonfat milk at room temperature for 1 hr. Subsequently, the membranes were incubated primary antibody against Rab10 or β-actin at 4°C overnight. On the second day, the membranes were probed with horseradish peroxidase (HRP)-conjugated secondary antibody at room temperature for 1 hr. In the end, the bands were visualized using a chemiluminescence kit (Merck Millipore, Darmstadt, Germany) with the intensity analysis through chemiluminescence detection system (Thermo Fisher Scientific). All antibodies were purchased from Sigma (Saint Louis, Missouri, USA).
Statistical Analysis
All experiments were conducted independently at least three times under the same conditions. All data were shown as the mean ± standard deviation (SD) and analyzed utilizing GraphPad Prism 6 (GraphPad Inc., La Jolla, CA, USA). Student’s t-test was performed when comparing two groups, while one-way analysis of variance (ANOVA) was conducted to compare the differences among three or more groups. Pearson correlation analysis was performed to identify the correlation among the expression of TUG1, miR-193a-5p and Rab10 in AML bone marrow samples. The χ2 test was conducted to evaluate the correlation between expression of TUG1 in acute myeloid leukemia and the clinicopathological parameters. A value of P less than 0.05 manifested that the difference was statistically significant.
Results
Upregulated Expression Level of TUG1 Was Observed in AML Bone Marrow and Cells
Firstly, the expression level of TUG1 was analyzed in AML bone marrow samples and cell lines. QRT-PCR assay indicated that the TUG1 level was obviously upregulated in 23 cases of bone marrow samples of patients compared with the healthy control group (AML: 2.821 ± 0.654 VS Normal: 1 ± 0.2599, P<0.0001) (Figure 1A). Also, a remarkable upregulation of TUG1 expression was discovered in two AML cell lines (HL-60 and NB4) when compared with that in normal marrow cells (HS-5) (HL-60: 2.467 ± 0.251 VS HS-5: 1 ± 0.24, P=0.0019; NB4: 2.767 ± 0.252 VS HS-5: 1 ± 0.24, P=0.0009) (Figure 1B). The correlation between expression of TUG1 in acute myeloid leukemia and the clinicopathological parameters was analyzed, and the results revealed that the expression of TUG1 was correlated with Extramedullary disease in AML patients (P<0.001, Table 1).
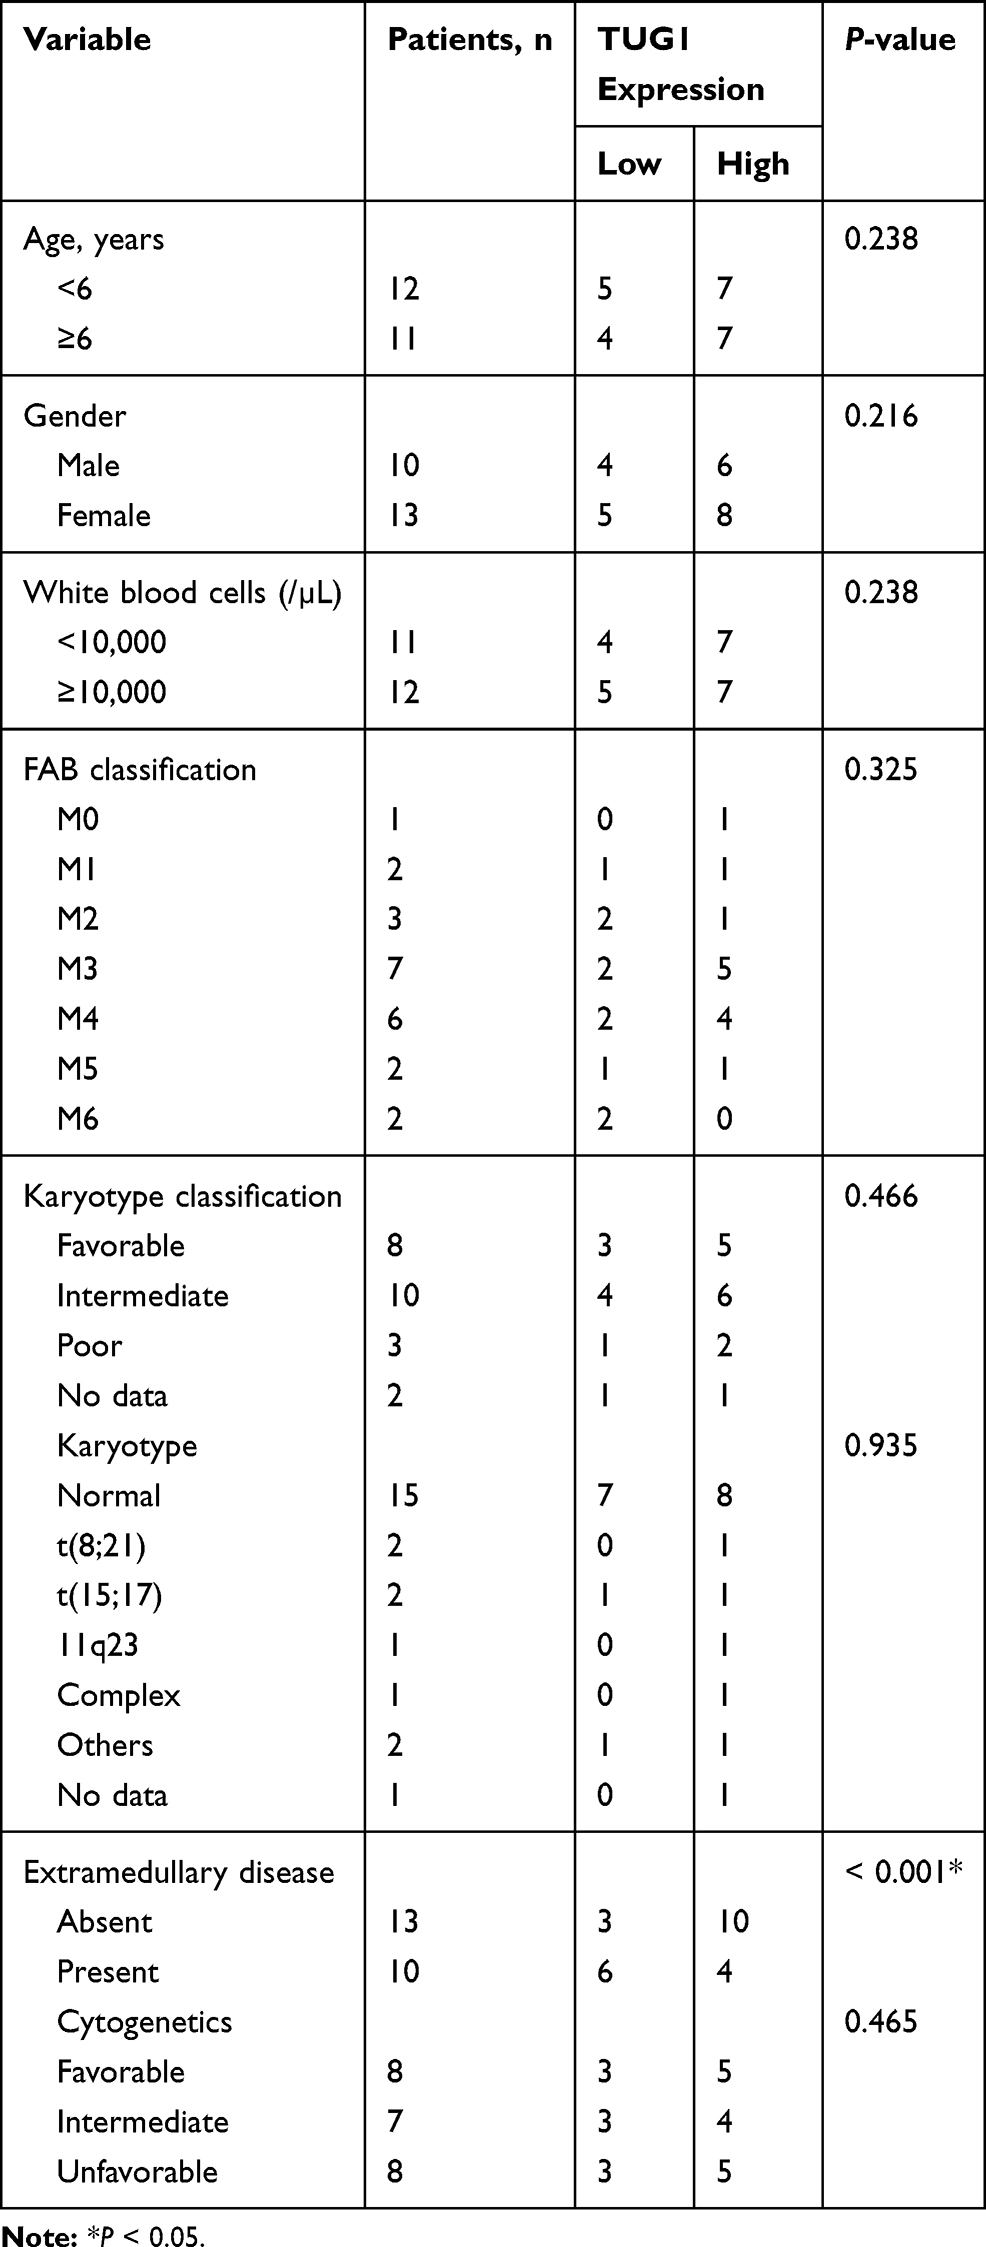 |
Table 1 Analysis of the Correlation Between Expression of TUG1 in Acute Myeloid Leukemia and the Clinicopathological Parameters |
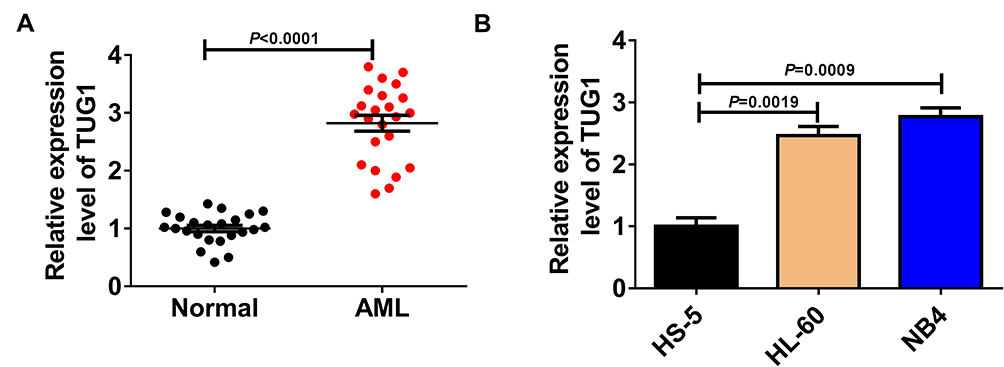 |
Figure 1 Upregulated expression level of TUG1 was observed in AML bone marrow or cells. (A) qRT-PCR analysis for TUG1 expression level in AML marrow samples and healthy controls. (AML: 2.821 ± 0.654 VS Normal: 1 ± 0.2599, P<0.0001) (B) TUG1 expression level in AML HL-60 and NB4, as well as normal marrow cells HS-5. (HL-60: 2.467 ± 0.251 VS HS-5: 1 ± 0.24, P=0.0019; NB4: 2.767 ± 0.252 VS HS-5: 1 ± 0.24, P=0.0009). |
Silencing of TUG1 Triggered a Cytotoxic Effect on AML Cells
SiRNAs against TUG1 (si-TUG1#1, si-TUG1#2 and si-TUG1#3) and si-NC were transfected into HL-60 and NB4 cells to construct TUG1-silenced AML cells to figure out the effect of TUG1 on the cell viability and death of AML cells. QRT-PCR assay confirmed that the transfection of the three siRNAs against TUG1 led to the distinct decrease of TUG1 expression level in HL-60 and NB4 cells (Supplementary Figure 1A). Si-TUG1 was a mixture of si-TUG1#1, si-TUG1#2 and si-TUG1#3, and it could also reduce the level of TUG1 in the two AML cells (Figure 2A). Then, CCK-8 assay showed that si-TUG1-mediated TUG1 silencing induced a striking reduction of cell viability of HL-60 and NB4 cells (Figure 2B and C). Notably, cell death was increased in HL-60 and NB4 cells with TUG1 knockdown (Figure 2D).
 |
Figure 2 Silencing of TUG1 triggered a cytotoxic effect on AML cells. HL-60 and NB4 cells were transfected with si-NC or si-TUG1 (mixture of si-TUG1#1, si-TUG1#2 and si-TUG1#3). (A) The relative expression level of TUG1 in HL-60 and NB4 cells. (HL-60: si-TUG1 VS si-NC, P=0.0148; NB4: si-TUG1 VS si-NC, P=0.0109) (B, C) The cell viability of transfected HL-60 and NB4 cells. (HL-60: si-TUG1 VS si-NC, P=0.0074; NB4: si-TUG1 VS si-NC, P=0.008) (D) Cell death of transfected HL-60 and NB4 cells at 48-hrs post-transfection. (HL-60: si-TUG1 VS si-NC, P=0.0004; NB4: si-TUG1 VS si-NC, P=0.0004). |
LncRNA TUG1 Directly Targeted miR-193a-5p
The binding site predicted by LncBase Predicted v.2 between miR-193a-5p and TUG1 and the mutant are shown in Figure 3A. To further confirm the prediction, TUG1 WT luciferase reporter containing the binding site and TUG1 MUT luciferase reporter containing the mutant binding site were constructed. Subsequent dual-luciferase reporter assay revealed that the transfection with miR-193a-5p mimics resulted in the evident downregulation of luciferase activity of TUG1 WT reporter in HL-60 and NB4 cells, while it had no effect on luciferase activity of TUG1 MUT reporter, which further validated the interaction between TUG1 and miR-193a-5p (Figure 3B and C). QRT-PCR assay was performed to evaluate the expression level of miR-193a-5p in AML bone marrow and cells, and indicated that miR-193a-5p was down-regulated in AML bone marrow and cells, compared with corresponding healthy controls (Figure 3D and E). QRT-PCR assay was also employed to clarify the effect of the silencing of TUG1 on the expression level of miR-193a-5p. The miR-193a-5p expression was significantly reduced in HL-60 and NB4 cells with TUG1 upregulation (Figure 3F). Pearson correlation analysis for the correlation between relative expression levels of TUG1 and miR-193a-5p in AML bone marrow manifested that there existed a negative correlation between TUG1 and miR-193a-5p (Figure 3G).
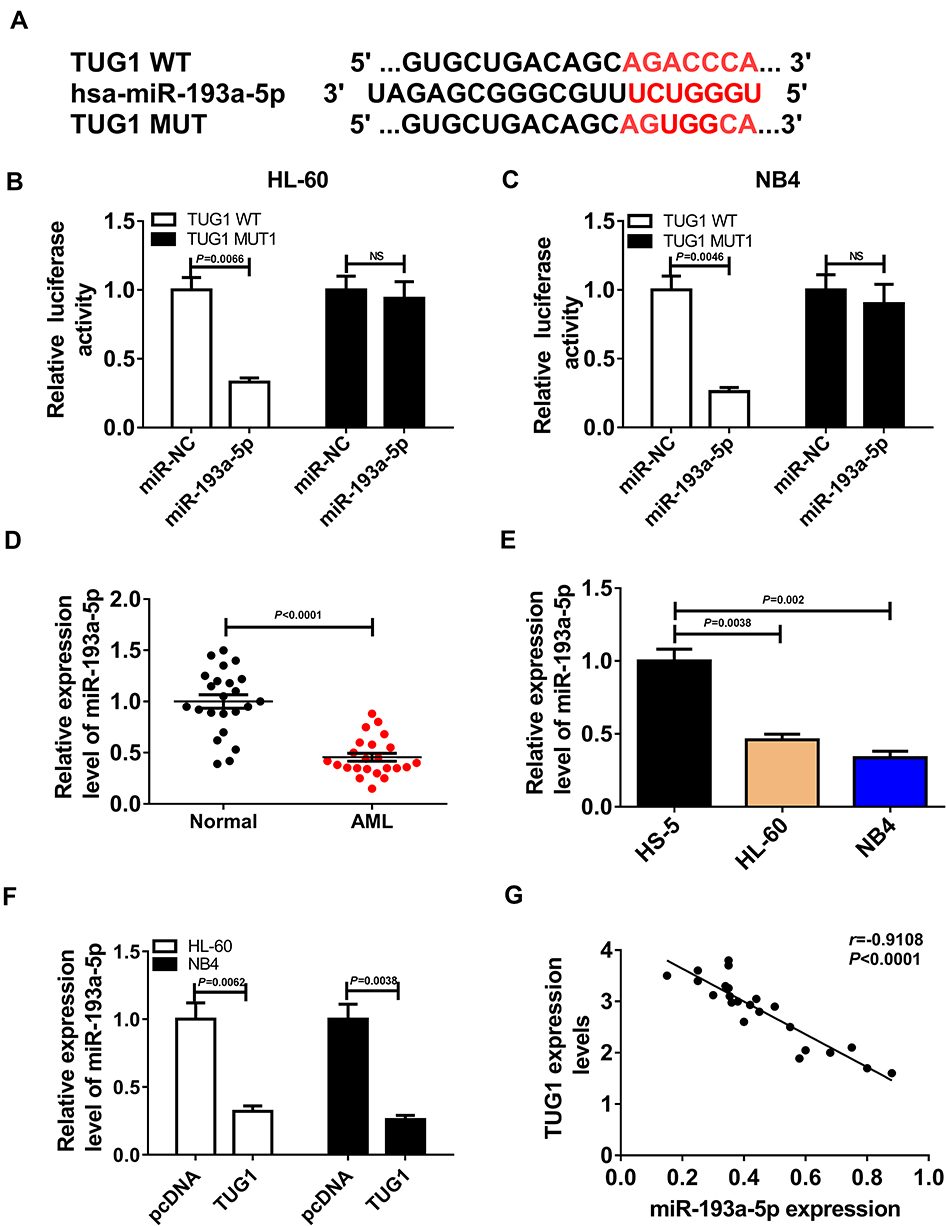 |
Figure 3 LncRNA TUG1 directly targeted miR-193a-5p. (A) The predicted binding site of miR-193a-5p and TUG1 and the mutant. (B, C) Dual-luciferase reporter assays for HL-60 and NB4 cells transfected with TUG1-WT reporter or TUG1-MUT reporter, as well as miR-193a-5p mimics or miR-NC. (HL-60: miR-193a-5p VS miR-NC, P=0.0066; NB4: miR-193a-5p VS miR-NC, P=0.0046) (D) The expression of miR-193a-5p in AML marrow samples and healthy controls. P < 0.0001 (E) MiR-193a-5p expression in AML HL-60 and NB4 cells, as well as normal marrow cells HS-5. (HL-60 VS HS-5, P=0.0038; NB4 VS HS-5, P=0.002) (F) QRT-PCR assay for miR-193a-5p expression in HL-60 and NB4 cells transfected with TUG1 or pcDNA. (HL-60: TUG1 VS pcDNA, P=0.0062; NB4: TUG1 VS pcDNA, P=0.0038) (G) Pearson correlation analysis for the correlation between relative expression levels of TUG1 and miR-193a-5p in AML bone marrow. r=−0.9108, P < 0.0001. |
Overexpressed miR-193a-5p Induced a Cytotoxic Effect on AML Cells
To construct AML cells with miR-193a-5p upregulation, miR-193a-5p mimics was transfected into HL-60 and NB4 cells, with miR-NC as a negative control. QRT-PCR assay was applied to measure transfection efficiency and suggested that miR-193a-5p level was distinctly increased after transfection with miR-193a-5p mimics (Figure 4A). Following CCK-8 assay revealed that the overexpression of miR-193a-5p notably suppressed the cell viability of HL-60 and NB4 cells (Figure 4B and C). Besides, the percentage of viability of HL-60 and NB4 cells at 72-hrs post-transfection is exhibited in Supplementary Figure 1B, which further manifested that upregulated miR-193a-5p inhibited the viability of AML cells. Moreover, cell apoptosis assay showed that up-regulated miR-193a-5p remarkably contributed to the cell death rate of HL-60 and NB4 cells (Figure 4D).
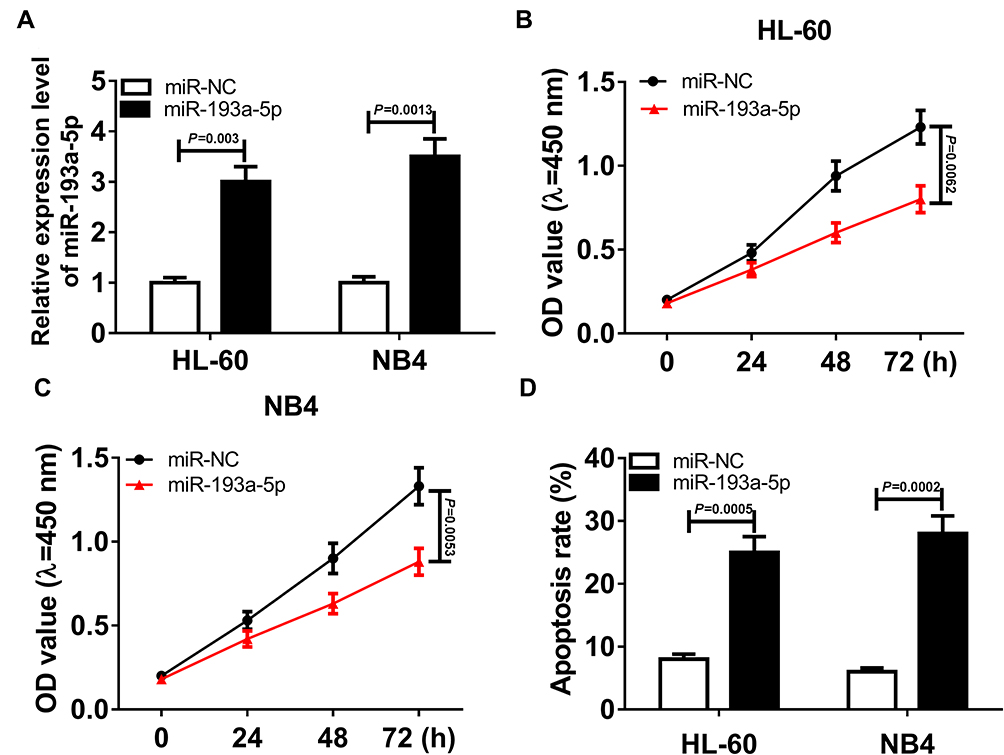 |
Figure 4 Overexpressed miR-193a-5p induced a cytotoxic effect on AML cells. HL-60 and NB4 cells were transfected with miR-193a-5p mimics or miR-NC mimics. (A) The relative expression level of miR-193a-5p in transfected AML cells. (HL-60: miR-193a-5p VS miR-NC, P=0.003; NB4: miR-193a-5p VS miR-NC, P=0.0013) (B, C) CCK-8 assay for transfected HL-60 and NB4 cells. (HL-60: miR-193a-5p VS miR-NC, P=0.0062; NB4: miR-193a-5p VS miR-NC, P=0.0053) (D) Cell apoptosis assay for transfected HL-60 and NB4 cells. (HL-60: miR-193a-5p VS miR-NC, P=0.0005; NB4: miR-193a-5p VS miR-NC, P=0.0002). |
TUG1 Regulated the Cell Viability and Death of AML Cells Through Targeting miR-193a-5p
To figure out how TUG1 regulates the cell viability and death of AML cells, a recovery experiment was conducted. The in-miR-193a-5p was transfected into HL-60 and NB4 cells to obtain AML cells with miR-193a-5p knockdown, and the transfection efficiency was validated through qRT-PCR assay (Figure 5A). CCK-8 assay suggested transfection with in-miR-193a-5p alleviated the inhibitory effect of silencing of TUG1 on the cell viability of the two AML cell lines (Figure 5B and C). Additionally, the down-regulation of miR-193a-5p could also reverse the silencing of TUG1-mediated the enhancement of the cell death of HL-60 and NB4 cells (Figure 5D).
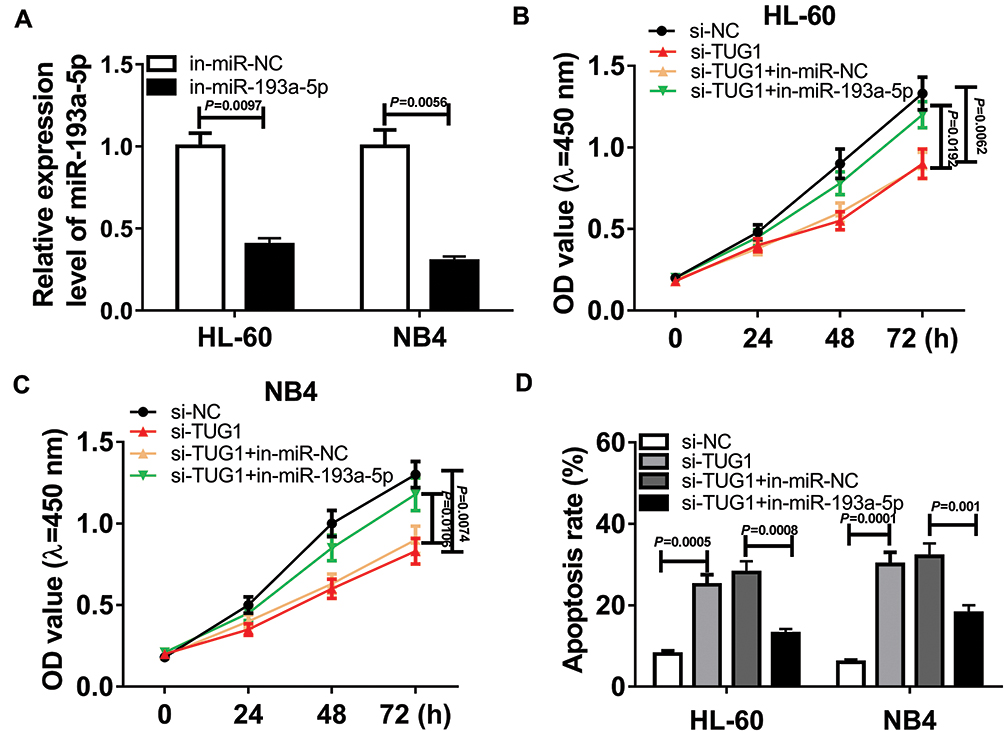 |
Figure 5 TUG1 regulated the cell viability and death of AML cells through targeting miR-193a-5p. (A) HL-60 and NB4 cells were transfected with in-miR-193a-5p or in-miR-NC. The relative expression level of miR-193a-5p after transfection. (HL-60: in-miR-193a-5p VS in-miR-NC si-NC 97; NB4: in-miR-193a-5p VS in-miR-NC, P=0.0056) (B, D) HL-60 and NB4 cells were transfected with si-NC, si-TUG1, si-TUG1 + in-miR-NC or si-TUG1 + in-miR-193a-5p. (B, C) CCK-8 assay for transfected HL-60 and NB4 cells. (HL-60: si-TUG1 VS si-NC, P=0.0062; HL-60: si-TUG1 + in-miR-193a-5p VS si-TUG1 + in-miR-NC, P=0.0192; NB4: si-TUG1 VS si-NC, P=0.0074; NB4: si-TUG1 + in-miR-193a-5p VS si-TUG1 + in-miR-NC, P=0.0106) (D) Cell apoptosis assay for transfected HL-60 and NB4 cells. (HL-60: si-TUG1 VS si-NC, P=0.0005; HL-60: si-TUG1 + in-miR-193a-5p VS si-TUG1 + in-miR-NC, P=0.0008; NB4: si-TUG1 VS si-NC, P=0.0001; NB4: si-TUG1 + in-miR-193a-5p VS si-TUG1 + in-miR-NC, P=0.001). |
MiR-193a-5p Targeted and Negatively Regulated Rab10
Bioinformatics analysis by DIANA TOOLS demonstrated that there were binding sites between miR-193a-5p and the 3ʹUTR of Rab10, which are shown in Figure 6A. To further confirm whether miR-193a-5p directly targeted Rab10, dual-luciferase reporter assay was conducted and indicated that miR-193a-5p mimics evidently inhibited the luciferase activity of Rab10 3ʹUTR-WT, whereas it had on impact on the luciferase activity of Rab10 3ʹUTR-MUT (Figure 6B and C). QRT-PCR assay was performed to analyze the relative expression level of Rab10 in AML bone marrow and cells and revealed that Rab10 was up-regulated in AML bone marrow and cells, compared to corresponding normal controls (Figure 6D and E). Western blot assay was performed to clarify the impact of miR-193a-5p and TUG1 on the protein level of Rab10. Distinctly, overexpressed miR-193a-5p repressed Rab10 expression level (Figure 6F). Also, the silencing of TUG1 also inhibited the level of Rab10 (Figure 6G). Pearson correlation analysis suggested that there existed a negative correlation between the relative expression levels of TUG1 and miR-193a-5p (Figure 6H), and a positive correlation between the expression levels of TUG1 and Rab10 in AML bone marrow (Figure 6I).
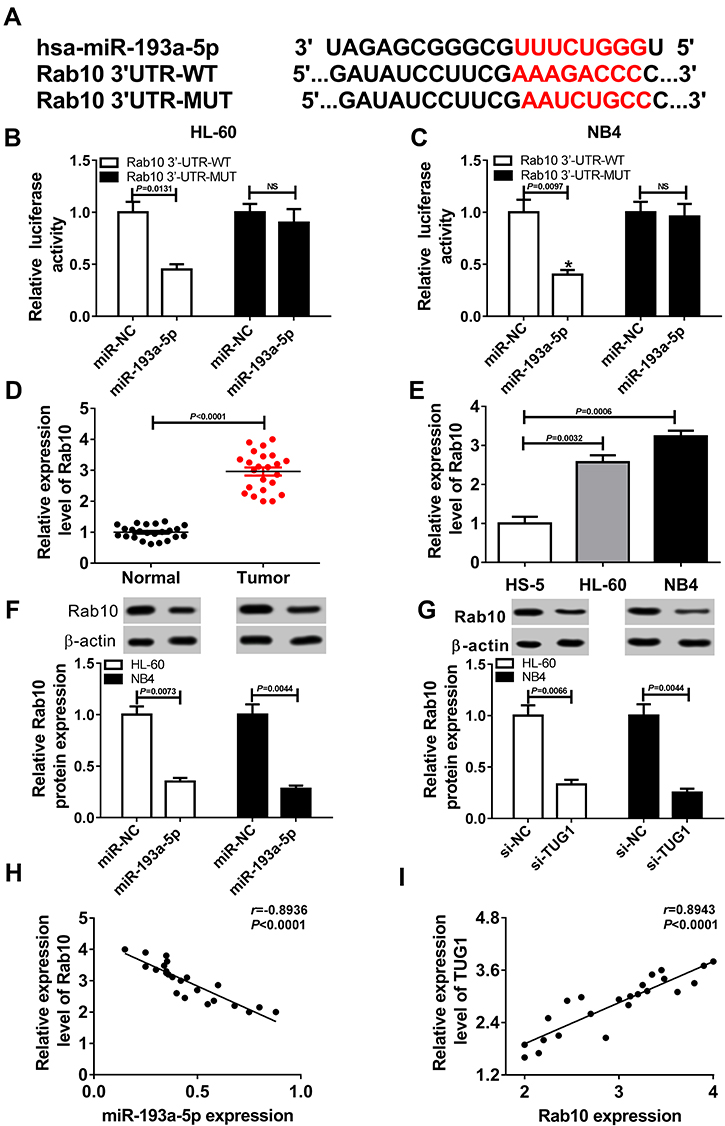 |
Figure 6 MiR-193a-5p targeted and negatively regulated Rab10. (A) The putative binding site of miR-145-5p on 3ʹUTR of Rab10 predicted by DIANA TOOLS and the mutant. (B, C) Dual-luciferase reporter assays for HL-60 and NB4 cells transfected with Rab10-WT reporter or Rab10-MUT reporter, as well as miR-193a-5p mimics or miR-NC mimics. (HL-60: miR-193a-5p VS miR-NC, P=0.0131; NB4: miR-193a-5p VS miR-NC, P=0.0097) (D) The level of Rab10 in AML samples and healthy controls detected by the qRT-PCR assay. *P < 0.0001 (E) Rab10 expression level evaluated via qRT-PCR assay. (HL-60 VS HS-5, P=0.0032; NB4 VS HS-5, P=0.0006) (F) Western blot assay for Rab10 expression in HL-60 and NB4 cells transfected with miR-193a-5p mimics or miR-NC mimics. (HL-60: miR-193a-5p VS miR-NC, P=0.0073; NB4: miR-193a-5p VS miR-NC, P=0.0044) (G) Western blot assay for Rab10 expression in HL-60 and NB4 cells transfected with si-TUG1 or si-NC. (HL-60: si-TUG1 VS si-NC, P=0.0066; NB4: si-TUG1 VS si-NC, P=0.0044) (H) Pearson correlation analysis for the correlation between relative expression levels of Rab10 and miR-193a-5p in AML bone marrow samples. r=−0.8936, P < 0.0001. (I) Pearson correlation analysis for the correlation between relative expression levels of Rab10 and TUG1 in AML bone marrow samples. r=0.8943, P < 0.0001. |
TUG1 Regulated Cell Viability and Death of AML Cells Through Regulating miR-139a-5p/Rab10 Axis
To confirm whether TUG1 affects AML cell lines through the miR-193a-5p/Rab10 axis, in-miR-193a-5p and si-Rab10 were co-transfected into both HL-60 and NB4 cells. CCK-8 assay revealed that the silencing of Rab10 inhibited the cell viability of the two cell lines, whereas simultaneous knockout of miR-193a-5p reverted the decrease of the cell viability of the two cell lines induced by si-Rab10 (Figure 7A and B). What could be concluded from Figure 7C was that the silencing of Rab10 significantly contributed to the cell death of HL-60 and NB4 cells, while down-regulation of miR-193a-5p reversed the promoted impact of si-Rab10. What is more, both HL-60 and NB4 cells were co-transfected with si-TUG1 and pcDNA-Rab10. We found that overexpressed Rab10 rescued si-TUG1-mediated reduction of the cell viability of HL-60 and NB4 cells (Figure 7D and E). Cell apoptosis assay indicated that the up-regulation of Rab10 overturned the effect of si-TUG1 on the cell death of the two cell lines (Figure 7F).
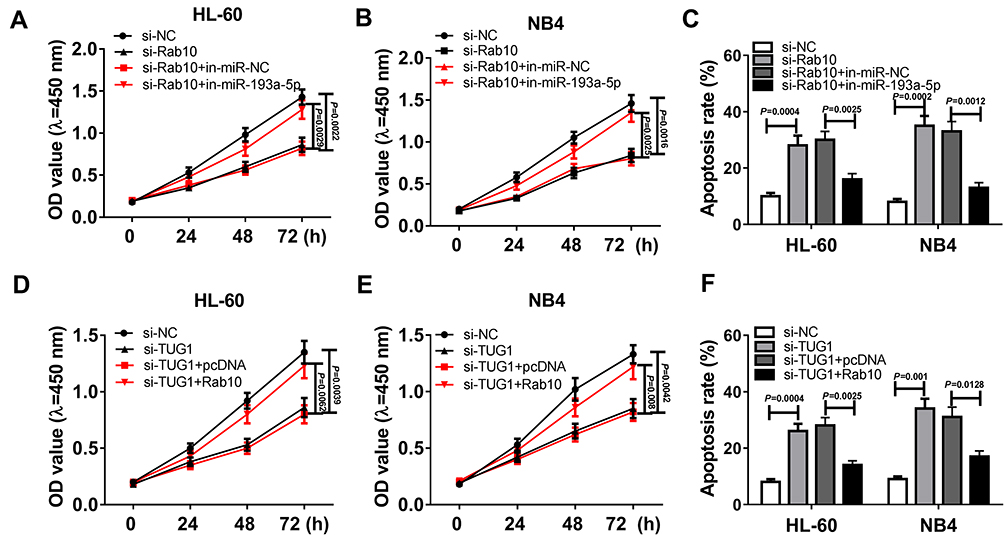 |
Figure 7 TUG1 regulated the cell viability and death of AML cells through regulating miR-139a-5p/Rab10 axis. (A–C) HL-60 and NB4 cells were transfected with si-NC, si-Rab10, si-Rab10+ in-miR-NC or si-Rab10 + in-miR-193a-5p. (A, B) CCK-8 assay for transfected HL-60 and NB4 cells. (HL-60: si-Rab10 VS si-NC, P=0.0022; HL-60: si-Rab10 + in-miR-193a-5p VS si-Rab10+ in-miR-NC, P=0.0029; NB4: si-Rab10 VS si-NC, P=0.0016; NB4: si-Rab10 + in-miR-193a-5p VS si-Rab10+ in-miR-NC, P=0.0025) (C) Death of HL-60 and NB4 cells after transfection. (HL-60: si-Rab10 VS si-NC, P=0.0004; HL-60: si-Rab10 + in-miR-193a-5p VS si-Rab10+ in-miR-NC, P=0.0025; NB4: si-Rab10 VS si-NC, P=0.0002; NB4: si-Rab10 + in-miR-193a-5p VS si-Rab10+ in-miR-NC, P=0.0012) (D–F) HL-60 and NB4 cells were transfected with si-NC, si-TUG1, si-TUG1 + pcDNA or si-TUG1 + Rab10. (D–E) The cell viability of transfected HL-60 and NB4 cells measured by CCK-8 assay. (HL-60: si-TUG1 VS si-NC, P=0.0039; HL-60: si-TUG1 + Rab10 VS si-TUG1 + pcDNA, P=0.0062; NB4: si-TUG1 VS si-NC, P=0.0042; NB4: si-TUG1 + Rab10 VS si-TUG1 + pcDNA, P=0.008) (F) Death of transfected HL-60 and NB4 cells. (HL-60: si-TUG1 VS si-NC, P=0.0004; HL-60: si-TUG1 + Rab10 VS si-TUG1 + pcDNA, P=0.0025; NB4: si-TUG1 VS si-NC, P=0.001; NB4: si-TUG1 + Rab10 VS si-TUG1 + pcDNA, P=0.0128). |
Discussion
As one of the most frequent hematological malignant tumors, AML seriously threatens the life of affected patients.22 Recently, a great deal of studies revealed that non-coding RNAs including lncRNAs and miRNAs could function as regulators in AML. Here, in the current, we found that the silencing of TUG1 inhibited cell viability and promoted cell death of AML HL-60 and NB4 cells by regulating the miR-193a-5p/Rab10 axis.
Previous studies suggested that many lncRNAs could affect the progression of AML. For example, lncRNA HOXA transcript at the distal tip (HOTTIP) was obviously up-regulated in AML-M5 patients and AML cell lines, and overexpressed HOTTIP evidently facilitated the proliferative potential and cell cycle of AML cells. What is more, HOTTIP enhanced the proliferative ability and cell cycle of AML cells through up-regulating DDA1 expression by sponging microRNA-608.23 LncRNA linc00239 was found to be up-regulated in AML patients and two AML cell lines, and overexpressed linc00239 promoted proliferation, colony formation and migration ability of AML cells.24 Long non-coding RNA zinc finger antisense 1 (ZFAS1) has been reported to be upregulated in the bone marrow of acute leukemia patients and AML cell lines. And researchers validated that the silencing of ZFAS1 blocked the progression of AML by regulating miR-150/Sp1 and miR-150/Myb pathways.25
TUG1 was reported to contribute to the development of prostate cancer and laryngocarcinoma in vitro, serving as an oncogene.12,13 Qin et al corroborated that lncRNA TUG1 could function as a predictor for advanced disease conditions and poor prognosis in AML patients. Additionally, the expression of TUG1 was obviously higher in AML patients compared to controls, and it was positively correlated with white blood cell counts as well as poor risk stratification. The higher expression of TUG1 was also detected in AML cell lines when compared to control cells. In vitro experiments suggested that silenced TUG1 inhibited proliferation and promoted apoptosis in AML cells.26 Luo and his colleagues reported that lncRNA TUG1 expression was up-regulated in refractory or relapsed acute myeloid leukemia (R/R AML) compared to controls. TUG1 might serve as a probable biomarker for poor prognosis in R/R AML patients treated with CLAG or FLAG-based chemotherapy.27 Here, the expression of lncRNA TUG1 in AML bone marrow and cells, as well as its roles and mechanistic pathway of TUG1 in AML cell viability and death were explored. Consistent with previous reports,14,26,27 lncRNA TUG1 was upregulated in bone marrow and cells, and knockdown of TUG1 suppressed cell viability but promoted death in AML cells. Additionally, we analyzed the correlation between the expression of TUG1 in acute myeloid leukemia and the clinicopathological parameters, and drew a conclusion that the expression of TUG1 was correlated with Extramedullary disease in AML patients.
A growing body of evidence manifested that lncRNAs were involved in the development and progression of AML via regulating miRNA/mRNA axis or pathways.28 To figure out how the TUG1 mediates the cell viability and death of AML cells, bioinformatics analysis utilizing LncBase Predicted v.2 was conducted to seek for potential target miRNAs of TUG1 and revealed that miR-193a-5p has a complementary site with TUG1. Following dual-luciferase reporter assay further authenticated the interaction between TUG1 and miR-193a-5p.
MicroRNA-193 (miR-193) family, including miR-193a-3p, miR-193a-5p, miR-193a-3p, miR-193a-5p, has been identified as important regulators in the proliferation and cell cycle of normal cells, as well as in both liquid and solid tumors.17 MiR-193a-5p has been considered as a tumor suppressor in various malignancies, such as breast cancer,29 osteosarcoma,30 hepatocellular carcinoma.31 Li et al pointed out that the miR-193a-5p expression was apparently decreased in AML patients compared to normal controls, and miR-193a-5p showed anti-leukemia activity.18 Moreover, Zhang and his colleagues demonstrated that miR-139-5p expression was significantly reduced in AML patients and cells. Up-regulated miR-139-5p restrained cell proliferation, invasion and migration abilities, and caused cell cycle arrest in AML cells via targeting Tspan3 through inactivation of the PI3K/Akt pathway.32 Our study also validated that miR-139a-5p expression was significantly decreased in AML bone marrow and the two cell lines. The miR-139a-5p expression was negatively regulated by TUG1 and inversely correlated with TUG1 expression. We observed that up-regulated miR-139a-5p markedly constrained cell viability, but facilitated cell death in AML HL-60 and NB4 cells, exhibiting as the decreased OD450 and percentage of viability. Rescue experiments further demonstrated that TUG1 mediated the cell viability and death of AML cells through targeting miR-193a-5p.
Then, Rab10 was identified as a target of miR-193a-5p by bioinformatics analysis, which was confirmed by DIANA TOOLS and dual-luciferase reporter assay. Rab10 functions as an oncogene in ESCC21 and osteosarcoma.33 Fan et al demonstrated Rab10 expression was remarkably increased in AML samples and cell lines. And circular RNA-100290 regulates cell proliferation and apoptosis via sponging miR-203/Rab10 axis.34 Analogously, we found that Rab10 expression was elevated in AML bone marrow and cells. Moreover, Rab10 expression was negatively regulated by miR-193a-5p but positively regulated by TUG1. Additionally, CCK-8 assay and cell apoptosis assay confirmed that TUG1 regulated the cell viability and death of AML cells through regulating miR-139a-5p/Rab10 axis.
In fact, there existed some limitations in the current study. The effects of TUG1, miR-193a-5p and Rab10 on the development (including migration and invasion) of AML need to be further explored in other AML cells and xenograft model.
Conclusion
Taken together, our study suggested that TUG1 elevated cell viability and restrained death through downregulating miR-193a-5p in AML cell lines. MiR-193a-5p directly targeted and negatively regulated Rab10. What is more, TUG1 regulated the cell viability and death of the AML cells through regulating the miR-139a-5p/Rab10 axis.
Disclosure
The authors have no conflicts of interest to declare in this work.
References
1. Hansrivijit P, Gale RP, Barrett J, Ciurea SO. Cellular therapy for acute myeloid leukemia - Current status and future prospects. Blood Rev. 2019;37:100578. doi:10.1016/j.blre.2019.05.002
2. Talati C, Sweet K. Recently approved therapies in acute myeloid leukemia: a complex treatment landscape. Leuk Res. 2018;73:58–66. doi:10.1016/j.leukres.2018.09.001
3. Shallis RM, Wang R, Davidoff A, Ma X, Zeidan AM. Epidemiology of acute myeloid leukemia: recent progress and enduring challenges. Blood Rev. 2019;36:70–87. doi:10.1016/j.blre.2019.04.005
4. Gan S, Ma P, Ma J, et al. Knockdown of ZFAS1 suppresses the progression of acute myeloid leukemia by regulating microRNA-150/Sp1 and microRNA-150/Myb pathways. Eur J Pharmacol. 2019;844:38–48. doi:10.1016/j.ejphar.2018.11.036
5. Bartonicek N, Maag JL, Dinger ME. Long noncoding RNAs in cancer: mechanisms of action and technological advancements. Mol Cancer. 2016;15(1):43. doi:10.1186/s12943-016-0530-6
6. Ma L, Wang Q, Gong Z, Xue L, Zuo Z. Long noncoding RNA GIHCG enhanced tongue squamous cell carcinoma progression through regulating miR-429. J Cell Biochem. 2018;119(11):9064–9071. doi:10.1002/jcb.27164
7. Tian YJ, Wang YH, Xiao AJ, et al. Long noncoding RNA SBF2-AS1 act as a ceRNA to modulate cell proliferation via binding with miR-188-5p in acute myeloid leukemia. Artif Cells Nanomed Biotechnol. 2019;47(1):1730–1737. doi:10.1080/21691401.2019.1608221
8. Gan L, Lv L, Liao S. Long noncoding RNA H19 regulates cell growth and metastasis via the miR223p/Snail1 axis in gastric cancer. Int J Oncol. 2019;54(6):2157–2168. doi:10.3892/ijo.2019.4773
9. Fan S, Fan C, Liu N, Huang K, Fang X, Wang K. Downregulation of the long non-coding RNA ZFAS1 is associated with cell proliferation, migration and invasion in breast cancer. Mol Med Rep. 2018;17(5):6405–6412. doi:10.3892/mmr.2018.8707
10. Zhu FF, Zheng FY, Wang HO, Zheng JJ, Zhang Q. Downregulation of lncRNA TUBA4B is associated with poor prognosis for epithelial ovarian cancer. Pathol Oncol Res. 2018;24(2):419–425. doi:10.1007/s12253-017-0258-7
11. Ghaforui-Fard S, Vafaee R, Taheri M. Taurine-upregulated gene 1: a functional long noncoding RNA in tumorigenesis. J Cell Physiol. 2019. doi:10.1002/jcp.28464
12. Yang XL, Wei C, Zhang YB, Guo HQ. Long noncoding RNA TUG1 promotes progression via upregulating DGCR8 in prostate cancer. Eur Rev Med Pharmacol Sci. 2019;23(6):2391–2398. doi:10.26355/eurrev_201903_17385
13. Zhuang S, Liu F, Wu P. Upregulation of long noncoding RNA TUG1 contributes to the development of laryngocarcinoma by targeting miR-145-5p/ROCK1 axis. J Cell Biochem. 2019;120:13392–13402. doi:10.1002/jcb.v120.8
14. Wang X, Zhang L, Zhao F, et al. Long non-coding RNA taurine-upregulated gene 1 correlates with poor prognosis, induces cell proliferation, and represses cell apoptosis via targeting aurora kinase A in adult acute myeloid leukemia. Ann Hematol. 2018;97(8):1375–1389. doi:10.1007/s00277-018-3315-8
15. Sayed D, Abdellatif M. MicroRNAs in development and disease. Physiol Rev. 2011;91(3):827–887. doi:10.1152/physrev.00006.2010
16. Marcucci G, Mrozek K, Radmacher MD, Garzon R, Bloomfield CD. The prognostic and functional role of microRNAs in acute myeloid leukemia. Blood. 2011;117(4):1121–1129. doi:10.1182/blood-2010-09-191312
17. Khordadmehr M, Shahbazi R, Sadreddini S, Baradaran B. miR-193: a new weapon against cancer. J Cell Physiol. 2019;234:16861–16872. doi:10.1002/jcp.28368
18. Li H, Xing C, Zhou B, et al. A regulatory circuitry between miR-193a/miR-600 and WT1 enhances leukemogenesis in acute myeloid leukemia. Exp Hematol. 2018;61:59–68.e5. doi:10.1016/j.exphem.2018.02.001
19. Tavana JP, Rosene M, Jensen NO, et al. RAB10: an Alzheimer’s disease resilience locus and potential drug target. Clin Interv Aging. 2019;14:73–79. doi:10.2147/CIA
20. Barbosa MD, Johnson SA, Achey K, et al. The Rab protein family: genetic mapping of six Rab genes in the mouse. Genomics. 1995;30(3):439–444. doi:10.1006/geno.1995.1262
21. Ding N, Sun X, Wang T, Huang L, Wen J, Zhou Y. miR378a3p exerts tumor suppressive function on the tumorigenesis of esophageal squamous cell carcinoma by targeting Rab10. Int J Mol Med. 2018;42(1):381–391. doi:10.3892/ijmm.2018.3639
22. Ferrara F, Schiffer CA. Acute myeloid leukaemia in adults. Lancet. 2013;381(9865):484–495. doi:10.1016/S0140-6736(12)61727-9
23. Zhuang MF, Li LJ, Ma JB. LncRNA HOTTIP promotes proliferation and cell cycle progression of acute myeloid leukemia cells. Eur Rev Med Pharmacol Sci. 2019;23(7):2908–2915. doi:10.26355/eurrev_201904_17569
24. Yang Y, Dai W, Sun Y, Zhao Z. Long noncoding RNA linc00239 promotes malignant behaviors and chemoresistance against doxorubicin partially via activation of the PI3K/Akt/mTOR pathway in acute myeloid leukaemia cells. Oncol Rep. 2019;41(4):2311–2320. doi:10.3892/or.2019.6991
25. Chi H. miR-194 regulated AGK and inhibited cell proliferation of oral squamous cell carcinoma by reducing PI3K-Akt-FoxO3a signaling. Biomed Pharmacother. 2015;71:53–57. doi:10.1016/j.biopha.2015.02.011
26. Qin J, Bao H, Li H. Correlation of long non-coding RNA taurine-upregulated gene 1 with disease conditions and prognosis, as well as its effect on cell activities in acute myeloid leukemia. Cancer Biomark. 2018;23(4):569–577. doi:10.3233/CBM-181834
27. Luo W, Yu H, Zou X, Ni X, Wei J. Long non-coding RNA taurine-upregulated gene 1 correlates with unfavorable prognosis in patients with refractory or relapsed acute myeloid leukemia treated by purine analogue based chemotherapy regimens. Cancer Biomark. 2018;23(4):485–494. doi:10.3233/CBM-181405
28. Liu Y, Cheng Z, Pang Y, et al. Role of microRNAs, circRNAs and long noncoding RNAs in acute myeloid leukemia. J Hematol oncol. 2019;12(1):51.
29. Tsai KW, Leung CM, Lo YH, et al. Arm selection preference of MicroRNA-193a varies in breast cancer. Sci Rep. 2016;6:28176. doi:10.1038/srep28176
30. Pu Y, Zhao F, Cai W, Meng X, Li Y, Cai S. MiR-193a-3p and miR-193a-5p suppress the metastasis of human osteosarcoma cells by down-regulating Rab27B and SRR, respectively. Clin Exp Metastasis. 2016;33(4):359–372. doi:10.1007/s10585-016-9783-0
31. Li P, Xiao Z, Luo J, Zhang Y, Lin L. MiR-139-5p, miR-940 and miR-193a-5p inhibit the growth of hepatocellular carcinoma by targeting SPOCK1. J Cell Mol Med 2019;23(4):2475–2488.
32. Zhang R, Tang P, Wang F, et al. Tumor suppressor miR-139-5p targets Tspan3 and regulates the progression of acute myeloid leukemia through the PI3K/Akt pathway. J Cell Biochem. 2019;120(3):4423–4432. doi:10.1002/jcb.27728
33. Jiang W, Liu J, Xu T, Yu X. MiR-329 suppresses osteosarcoma development by downregulating Rab10. FEBS Lett. 2016;590(17):2973–2981. doi:10.1002/1873-3468.12337
34. Fan H, Li Y, Liu C, Liu Y, Bai J, Li W. Circular RNA-100290 promotes cell proliferation and inhibits apoptosis in acute myeloid leukemia cells via sponging miR-203. Biochem Biophys Res Commun. 2018;507(1–4):178–184. doi:10.1016/j.bbrc.2018.11.002
 © 2020 The Author(s). This work is published and licensed by Dove Medical Press Limited. The
full terms of this license are available at https://www.dovepress.com/terms
and incorporate the Creative Commons Attribution
- Non Commercial (unported, 3.0) License.
By accessing the work you hereby accept the Terms. Non-commercial uses of the work are permitted
without any further permission from Dove Medical Press Limited, provided the work is properly
attributed. For permission for commercial use of this work, please see paragraphs 4.2 and 5 of our Terms.
© 2020 The Author(s). This work is published and licensed by Dove Medical Press Limited. The
full terms of this license are available at https://www.dovepress.com/terms
and incorporate the Creative Commons Attribution
- Non Commercial (unported, 3.0) License.
By accessing the work you hereby accept the Terms. Non-commercial uses of the work are permitted
without any further permission from Dove Medical Press Limited, provided the work is properly
attributed. For permission for commercial use of this work, please see paragraphs 4.2 and 5 of our Terms.