Back to Journals » Diabetes, Metabolic Syndrome and Obesity » Volume 14
Liver Stiffness Measurement by Using Transient Elastography in Bangladeshi Patients with Type 2 Diabetes Mellitus and Ultrasonography-Diagnosed Nonalcoholic Fatty Liver Disease
Authors Alam MS ![]() , Kamrul-Hasan ABM
, Kamrul-Hasan ABM ![]() , Kalam ST, Rahman SMM, Hoque MI, Islam MB, Paul AK
, Kalam ST, Rahman SMM, Hoque MI, Islam MB, Paul AK
Received 4 May 2021
Accepted for publication 22 June 2021
Published 6 July 2021 Volume 2021:14 Pages 3089—3096
DOI https://doi.org/10.2147/DMSO.S317876
Checked for plagiarism Yes
Review by Single anonymous peer review
Peer reviewer comments 3
Editor who approved publication: Professor Ming-Hui Zou
Muhammad Shah Alam,1 ABM Kamrul-Hasan,2 Syeda Tanzina Kalam,3 SM Mizanur Rahman,4 Mohammad Izazul Hoque,5 Md Belalul Islam,6 Ajit Kumar Paul7
1Department of Medicine, Army Medical College, Comilla, Bangladesh; 2Department of Endocrinology, Mymensingh Medical College, Mymensingh, Bangladesh; 3Department of Psychiatry, Comilla Medical College Hospital, Comilla, Bangladesh; 4Department of Medicine, CMH and Army Medical College, Comilla, Bangladesh; 5Department of Hepatology, Comilla Medical College, Comilla, Bangladesh; 6Department of Medicine, Comilla Medical College, Comilla, Bangladesh; 7Department of Endocrinology, Maynamati Medical College, Comilla, Bangladesh
Correspondence: ABM Kamrul-Hasan
Department of Endocrinology, Mymensingh Medical College, Charpara, Mymensingh, 2207, Bangladesh
Tel +8801711103905
Email [email protected]
Purpose: Type 2 diabetes mellitus (T2DM) is associated with an increased risk of nonalcoholic fatty liver disease (NAFLD), and the presence of T2DM tremendously drives NAFLD progression. The use of transient elastography (TE) for assessment of NAFLD has been increasing due to its high sensitivity and specificity. This study aimed to measure liver stiffness in patients with T2DM and ultrasonography (USG)-diagnosed NAFLD and assess the correlations between liver stiffness and other clinical and biochemical parameters.
Patients and Methods: This cross-sectional study assessed 205 adult patients with T2DM and USG-diagnosed NAFLD who were being treated at a specialized endocrine private practice in Bangladesh. All subjects underwent TE for hepatic fibrosis assessment, which was performed using a FibroScan® 402 device. A fibrosis score ≥ 9.7 kilopascals (kPa) was used to define advanced fibrosis (≥F3).
Results: Out of 205 (65.9% female, mean age 45 ± 27 years, 67.3% obese) patients, the frequencies of Grade 1, Grade 2, and Grade 3 fatty liver on USG were 46.3%, 51.2%, and 2.4%, respectively. According to the TE results, 41 (20%) had advanced fibrosis (≥F3). Subjects with advanced fibrosis had a higher body mass index (BMI), higher levels of alanine aminotransferase (ALT) and aspartate aminotransferase (AST), and higher frequencies of individuals with elevated ALT and AST and advanced fatty liver grades on USG. The fibrosis score (kPa) was strongly and positively correlated with age, BMI, waist circumference, obesity, serum ALT and AST levels, and the fatty liver grade in USG; the AST:ALT ratio did not correlate with kPa.
Conclusion: The data showed that 20% of the subjects with T2DM having NAFLD on USG exhibited advanced fibrosis, demonstrating the need for early diagnosis and treatment of NAFLD in T2DM. The use of TE with other serum markers can be helpful for the diagnosis of advanced fibrosis.
Keywords: type 2 diabetes, NAFLD, transient elastography, advanced fibrosis, AST:ALT ratio
Introduction
Nonalcoholic fatty liver disease (NAFLD) refers to a spectrum of conditions, including simple steatosis, nonalcoholic steatohepatitis (NASH), advanced fibrosis, cirrhosis, and hepatocellular carcinoma (HCC).1 NAFLD is an emerging global health problem with a worldwide prevalence of 25.24%. NAFLD is frequently associated with metabolic comorbidities, including obesity, type 2 diabetes mellitus (T2DM), dyslipidemia, hypertension, and metabolic syndrome (MetS).2 The global prevalences of NAFLD and NASH among patients with T2DM are higher than those for the general population.3 In addition, NAFLD is associated with an approximately 2.2-fold increased risk of incident diabetes.4
Ultrasonography (USG) is the most commonly used method for screening asymptomatic patients with suspected NAFLD. USG is easy to perform and is relatively inexpensive but is associated with variable sensitivity and specificity.5 Fibrosis staging is essential for all patients with NAFLD to identify patients with advanced hepatic fibrosis.6 A liver biopsy is the definitive, gold-standard method for diagnosing NAFLD and allows for the assessment of hepatic steatosis, hepatocellular injury, inflammation, and fibrosis. However, a biopsy is an invasive procedure and is often not necessary to diagnose NAFLD.7 Many non-invasive tests, including transient elastography (TE), magnetic elastography (ME), and acoustic radiation force impulse (ARFI), can be applied for the assessment of hepatic fibrosis, among which TE is the most widely used.6,7
In Bangladesh, data regarding the liver stiffness measurement (LSM) among patients with T2DM are scarce. In this study, we evaluated LSM using TE in patients with T2DM and USG-diagnosed NAFLD and assessed the correlations between LSM values and other clinical and biochemical parameters.
Materials and Methods
This cross-sectional study was conducted from January to December 2020 at a specialized endocrine private practice in Comilla City, Bangladesh. The study population included non-pregnant adult (age ≥18 years) patients with T2DM who were diagnosed with fatty liver based on abdominal USG examinations performed at the clinic. Conventional B-mode liver USG was performed with a convex 3.5-MHz probe by a single radiologist using a Mindray DC-N3 (Shenzhen Mindray Bio-Medical Electronics Co. Ltd., Shenzhen 518057, P.R. China). During a USG examination, the echogenicity of a healthy liver is equal to or minimally exceeds that of the spleen or renal cortex; intrahepatic vessels are sharply demarcated, and posterior aspects of the liver are well depicted. Fatty liver is diagnosed if the liver echogenicity exceeds that of the spleen or renal cortex, the ultrasound wave is attenuated, or any loss of diaphragm definition or poor delineation of the intrahepatic architecture is observed. In this study, fatty liver was diagnosed and graded into one of three grades according to the severity of fat deposition as follows:
Grade 1: Minimal diffuse increase in the fine echoes. The liver appears bright compared against the kidney cortex, with normal visualization of the diaphragm and intrahepatic vessel borders.
Grade 2: Moderate diffuse increase in the fine echoes, with slightly impaired visualization of the intrahepatic vessels and diaphragm.
Grade 3: Marked increase in fine echoes. No or poor visualization of intrahepatic vessels and the diaphragm, with poor penetration of the posterior segment of the right liver lobe.5
The eligible patients were enrolled nonselectively and consecutively; informed written consent was obtained from each study subject. Patients with evidence of any other chronic liver diseases, including hepatitis B or C, autoimmune hepatitis, or alcoholic liver disease, were excluded from this study. Patients with clinical or ultrasound evidence of decompensated cirrhosis, cardiac failure, and hepatic congestion were excluded. Patients on hepatotoxic medications, such as methotrexate or those on drugs that cause fatty changes to the liver (eg amiodarone, sodium valproate, or tetracycline) were also excluded. In addition, those who could not undergo TE examinations due to very high (≥40 kg/m2) body mass index (BMI) or other reasons were also excluded.
Data were collected using a semi-structured, predesigned case record form. Demographic data on sex, age, and area of residence were obtained for each patient. Standing height was measured to within 1 mm, without shoes, using wall-mounted stadiometers. Measurement of body weight was performed to within 0.5 kg using a standard weight measuring device placed on a hard, flat surface in light clothing and without shoes. BMI was calculated by dividing weight in kg by the square of height in meters. Waist circumference (WC) was measured to within 0.5 mm with the subject standing and at the end of a gentle expiration using a plastic tape measure at the midpoint between the costal margins and the iliac crests in the mid-axillary line. We used BMI categories applicable to Asian Indians to determine obesity status.8
A fasting venous blood sample was collected; alanine aminotransferase (ALT), aspartate aminotransferase (AST), glycated hemoglobin (HbA1c), and fasting lipid profile were measured. For each patient, the AST:ALT ratio was calculated. Serum AST (normal range <37 units/L) and ALT (normal range <40 units/L) were measured by Ortho Clinical VITROS® 250 Chemistry System (Ortho Clinical Diagnostics, Ramsey, MN 55303, USA) using the reflectospectrophotometric method. HbA1c was measured using the Bio-Rad D-10® HPLC analyzer (Bio-Rad Laboratories, CA, USA) using ionic exchange high-performance liquid chromatography (HPLC). Lipids were measured by the Dimension® EXL™ 200 Integrated Chemistry System (Siemens Healthcare Diagnostics Inc., Newark, DE 19714-6101, USA) using the spectrophotometric method. Dyslipidemia was defined according to the cutoff values described in the Adult Treatment Panel (ATP) III guideline.9
TE is a non-invasive, ultrasound-based technology during which a low-frequency (50 Hz) elastic shear wave generated by a transducer is used to propagate through tissues. The propagation speed is proportional to the stiffness of the tissues crossed, and specific software can be used to obtain tissue stiffness measurements, expressed in kilopascal (kPa) and ranging from 2.5 to 75 kPa. TE is an easy, painless, and rapid procedure and is highly acceptable to both patients and physicians.10 TE is considered a unique alternative to liver biopsy among NAFLD patients and plays a vital role in the exclusion of liver cirrhosis.11 In this study, a trained technician, blinded to the USG results measured LSM using the FibroScan® 402 machine (Echosens, 2010, France). Patients were advised to fast for at least 3 hours before the examination. Probe selection was made using an automatic probe (either M or XL probes) selection tool embedded in the device software that recommends the appropriate probe for everyone according to the real-time assessment of the skin-to-liver capsule distance. M probe was used initially unless the device indicated the use of the XL probe. Patients were placed in a supine position with their right arm fully abducted, and measurements were performed by scanning the right liver lobe through the intercostal spaces.12 The median liver stiffness value (kPa) of the ten successful measurements fulfilling the criteria (interquartile range/median ratio of <30% and success rate of >60%) were recorded. Border values of liver stiffness need to be determined in each chronic liver disease separately. Moreover, for NAFLD, different cutoff values have been suggested by different authors. The cutoff values suggested by Eddowes et al are most frequently used for NAFLD staging; the cutoff values were defined as ≤8.1 kPa for F0–F1 (no or mild fibrosis), ≥8.2 kPa for F≥2 (moderate fibrosis), ≥9.7 kPa for F≥3 (severe fibrosis), and ≥13.6 kPa for F4 (cirrhosis).13 In a study conducted by Kumar et al among Indian patients with NAFLD, the best LSM (kPa) cutoffs for fibrosis stages F1, F2, F3, and F4 were 6.1, 7.0, 9.0, and 11.8, respectively.14
Statistical Analysis
We analyzed data using the Statistical Product and Service Solutions (SPSS) version 26.0 software (IBM Corp. Released 2019. IBM SPSS Statistics for Windows, Version 26.0. Armonk, NY: IBM Corp). Categorical variables are presented as the number and percentage, and continuous variables are presented as the mean ± standard deviation (SD) or median (interquartile range [IQR]). Student’s t-test, chi-square test, and nonparametric tests were used to compare variables between subjects with advanced fibrosis (≥F3) and those without advanced fibrosis (≤F2). Spearman correlation test was used to measure correlations between the fibrosis score (kPa) and other variables. P-value ≤0.05 was considered significant.
Results
Among the 205 subjects evaluated, 65.9% were female; the mean age was 45 ± 27 years; 67.3% were obese; 98% had central obesity. The median duration of T2DM was six years; the mean HbA1c level was 8.8% ± 1.7%; 32.7% were taking lipid-lowering drugs (statins/fibrates) at the time of evaluation; almost all (99%) had dyslipidemia. Based on the USG evaluation, Grade 1, Grade 2, and Grade 3 fatty liver frequencies were 46.3%, 51.2%, and 2.4%, respectively.
According to the cutoff values suggested by Eddowes et al, 74.6% had no or mild fibrosis (F0–F1), 5.4% had moderate fibrosis (F2), 14.1% had severe fibrosis (F3), and 5.9% had cirrhosis (F4).13 The frequencies of F0-F1, F2, F3, and F4 by applying cutoff values suggested by Kumar et al were 62.4%, 17.1%, 12.7%, and 7.8%, respectively.14 Almost similar proportion of the subjects had significant fibrosis (≥F3) according to the two cutoff criteria (20% according to Eddowes et al and 20.5% according to Kumar et al).13,14
The study subjects without advanced fibrosis (≤F2) and those with advanced fibrosis (≥F3), according to Eddowes et al were categorized in Group 1 (n = 164, 80%) and Group 2 (n = 41, 20%), respectively.13 Table 1 compares the demographic, clinical, and biochemical variables between Group 1 and Group 2. Subjects in Group 2 had higher BMI, ALT, AST, and a higher frequency of subjects with elevated ALT and AST values. Fatty liver grades on USG were also significantly different between the two groups, with Group 2 having higher frequencies of advanced fatty liver grades on USG than Group 1.
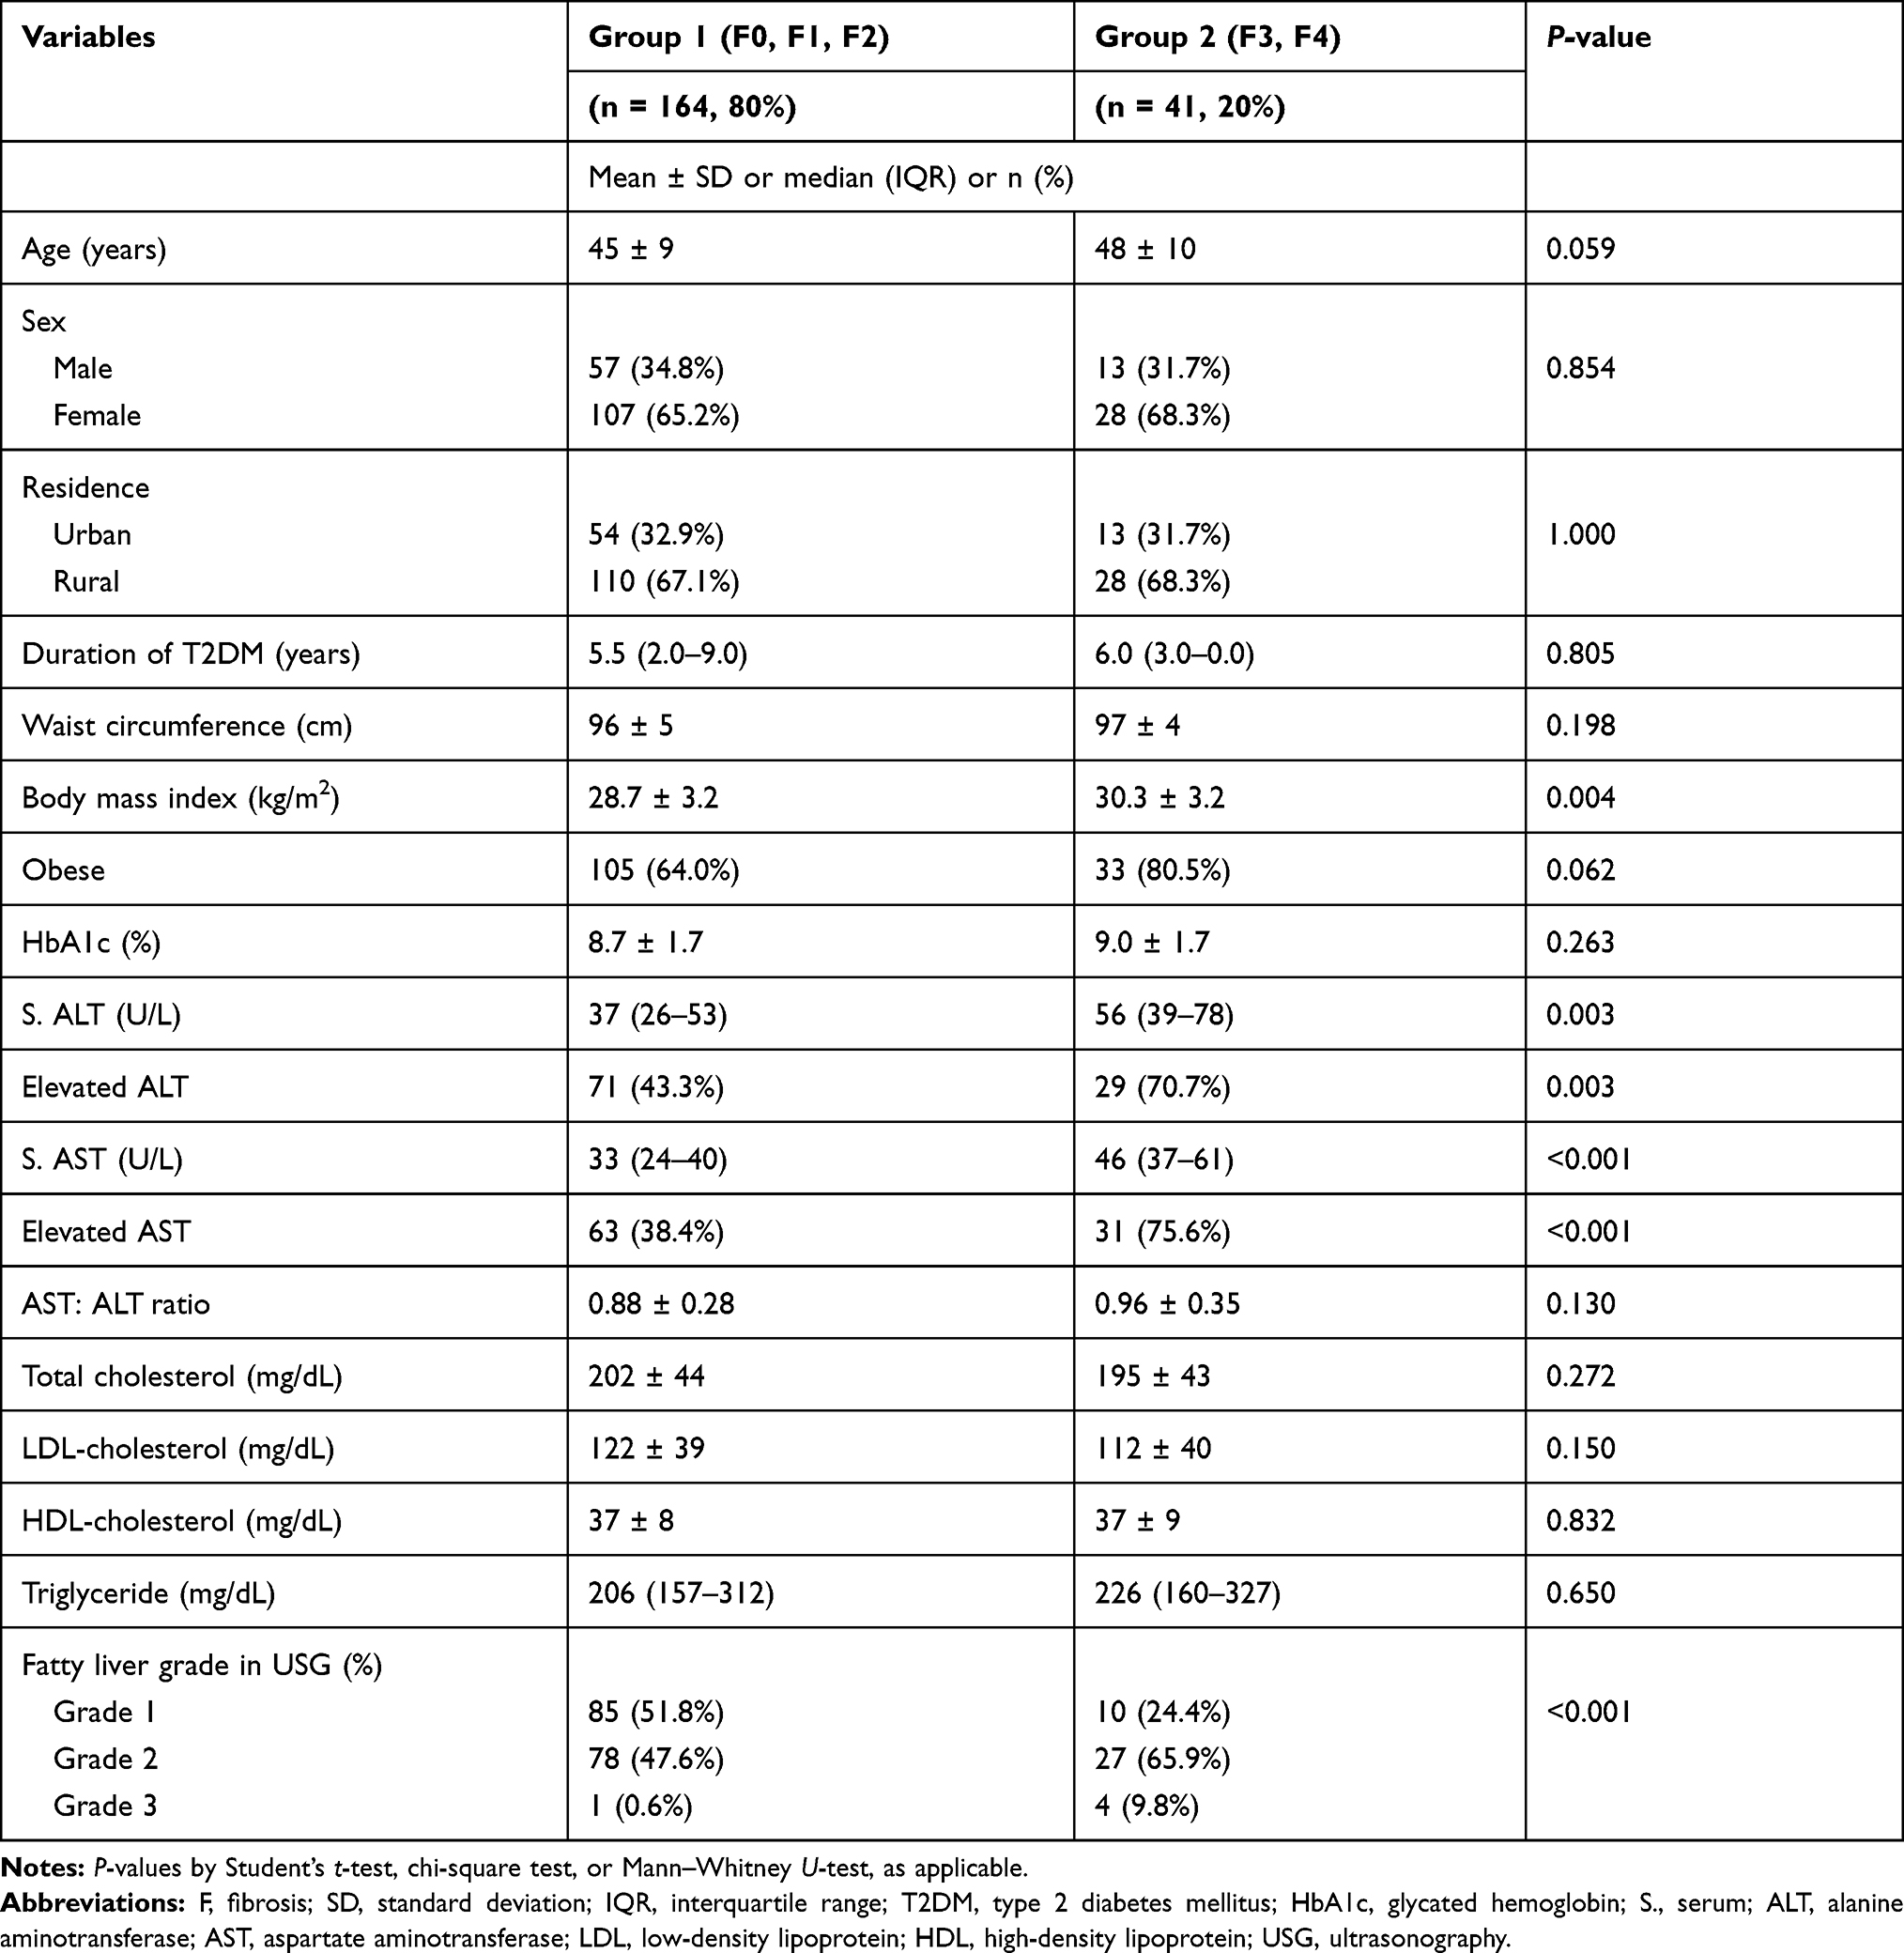 |
Table 1 Comparison of the Demographic, Clinical, and Biochemical Variables Between Group 1 and Group 2 |
Correlations between LSM assessed as fibrosis scores (kPa) and other variables are shown in Table 2. LSM was strongly and positively correlated with age, BMI, WC, obesity, serum ALT and AST levels, and the fatty liver grade in USG in the study subjects. In group 1, positive correlations of kPa were observed with sex, BMI, WC, obesity, serum ALT, AST, and triglyceride levels. None of the variables correlated with kPa in group 2 except the fatty liver grade in USG.
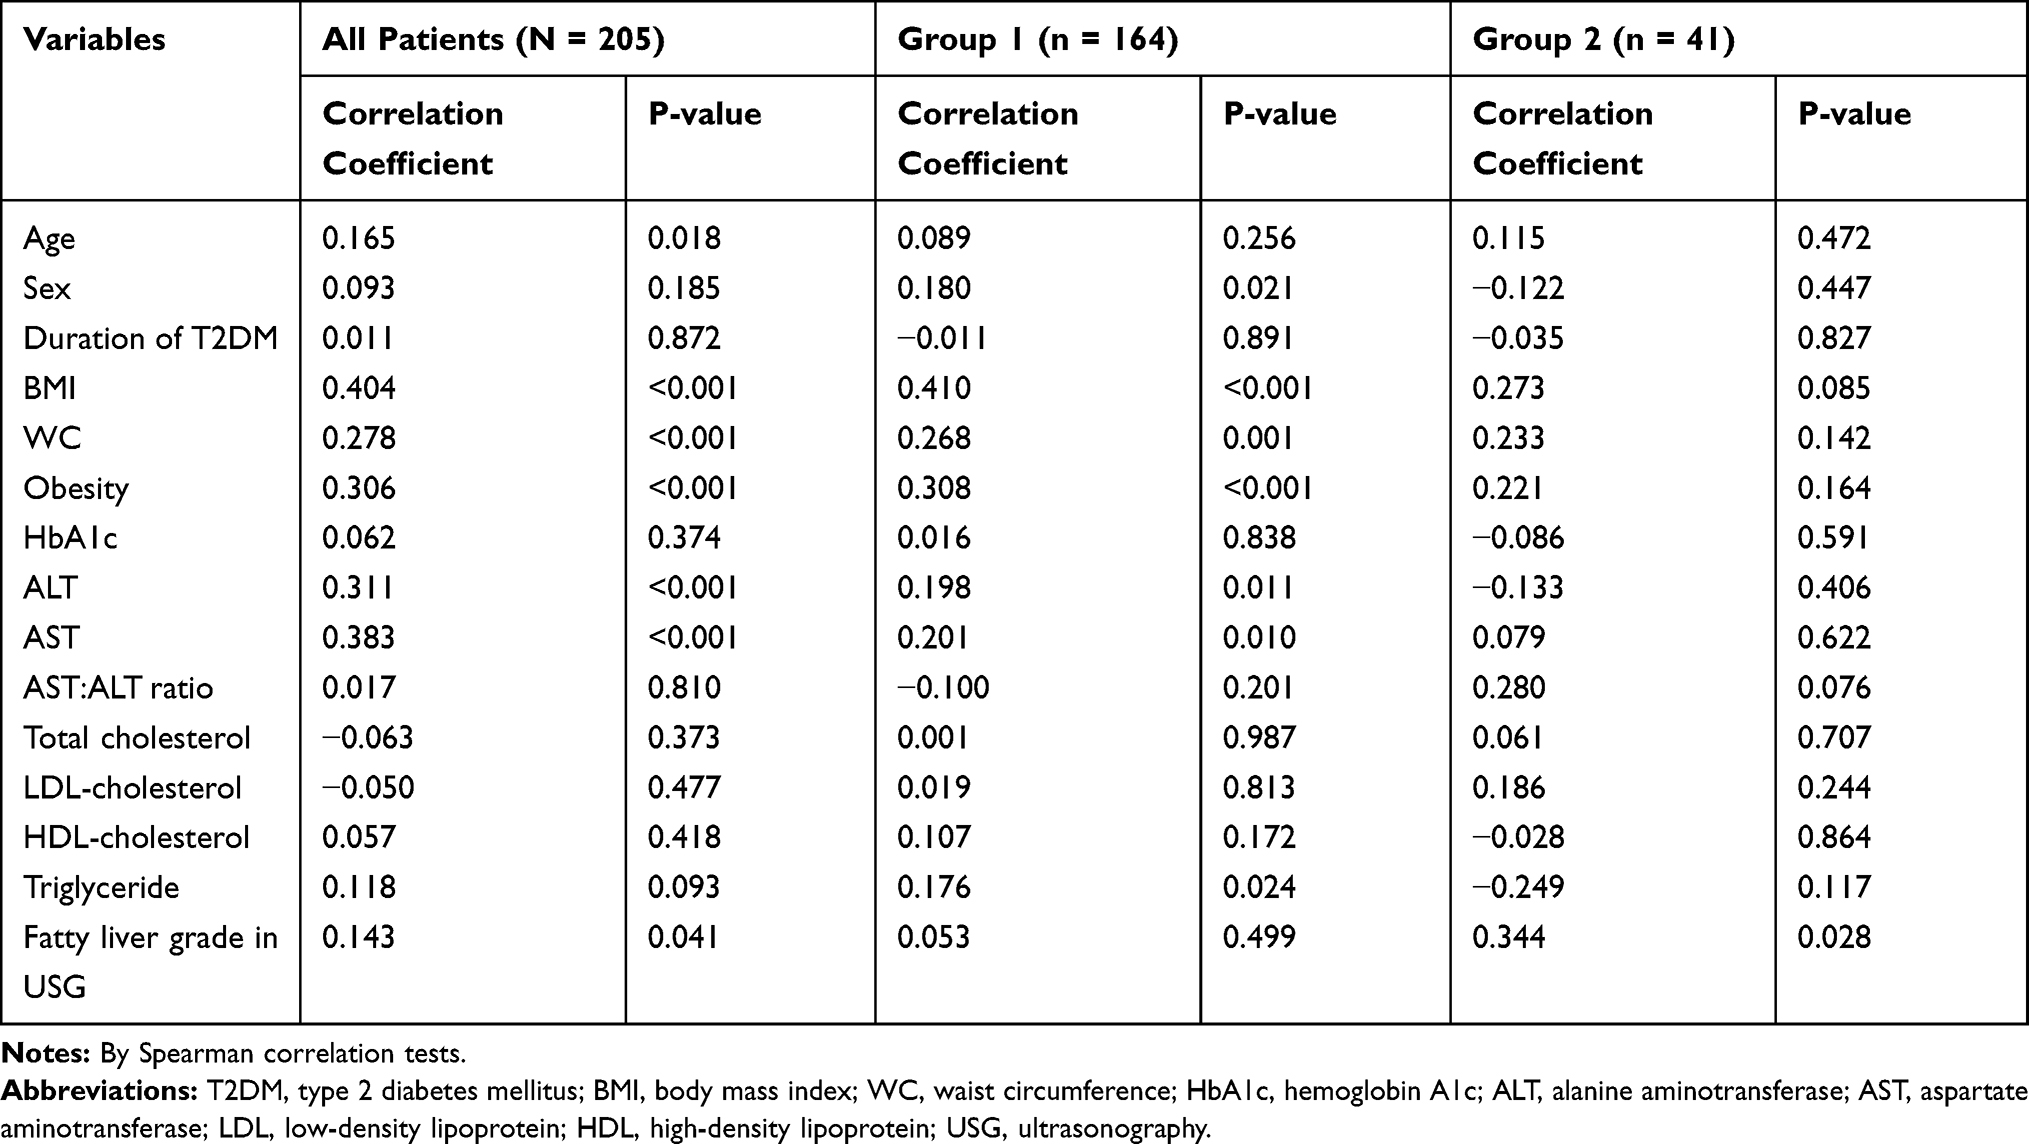 |
Table 2 Correlations Between Fibrosis Score (kPa) and Other Variables |
Discussion
In concert with increased obesity and MetS prevalence rates, the worldwide prevalence of NAFLD has increased dramatically in recent decades.15 The overall prevalence of NAFLD in Western countries varies from 15% to 40%, whereas the prevalence in Asian countries varies from 9% to 40%.16 In Bangladesh, Alam et al found the overall prevalence of NAFLD was 33.86% in a recent study.17 Both diabetes and prediabetes are associated with increased risks of NAFLD. Compared to subjects with fasting plasma glucose <6.1 mmol/L, the odds ratio for developing NAFLD among subjects with impaired fasting glucose and T2DM was 1.35 and 1.40, respectively, in a recent study.18 The reported prevalence of NAFLD in T2DM patients is highly variable, ranging from 29.6% to 87.1% in the available literature.19 Current estimates indicate that approximately 10–20% of patients with NAFLD will develop into NASH, increasing the risk of liver advanced fibrosis or cirrhosis.20 The presence of diabetes tremendously drives NAFLD progression to NASH, cirrhosis, and even HCC in the final stages.21
The prevalence of advanced liver fibrosis in T2DM patients with NAFLD is highly variable among studies due to differences in the cutoff values used to define fibrosis stages.22–28 Using TE, the prevalence of advanced fibrosis (≥F3) observed by other researchers is summarized in Table 3. In the present study, 20% of patients with NAFLD had advanced fibrosis, which was higher than that reported by previous studies using similar cutoff values and lower than most other studies that used a lower cutoff value.22–28 Apart from cutoff values used, ethnic differences in the severity of fibrosis associated with diabetic NAFLD affect the prevalence of advanced fibrosis.3,4 Due to a lack of data, we could not compare the frequency of advanced fibrosis in patients with T2DM with that for the general population.
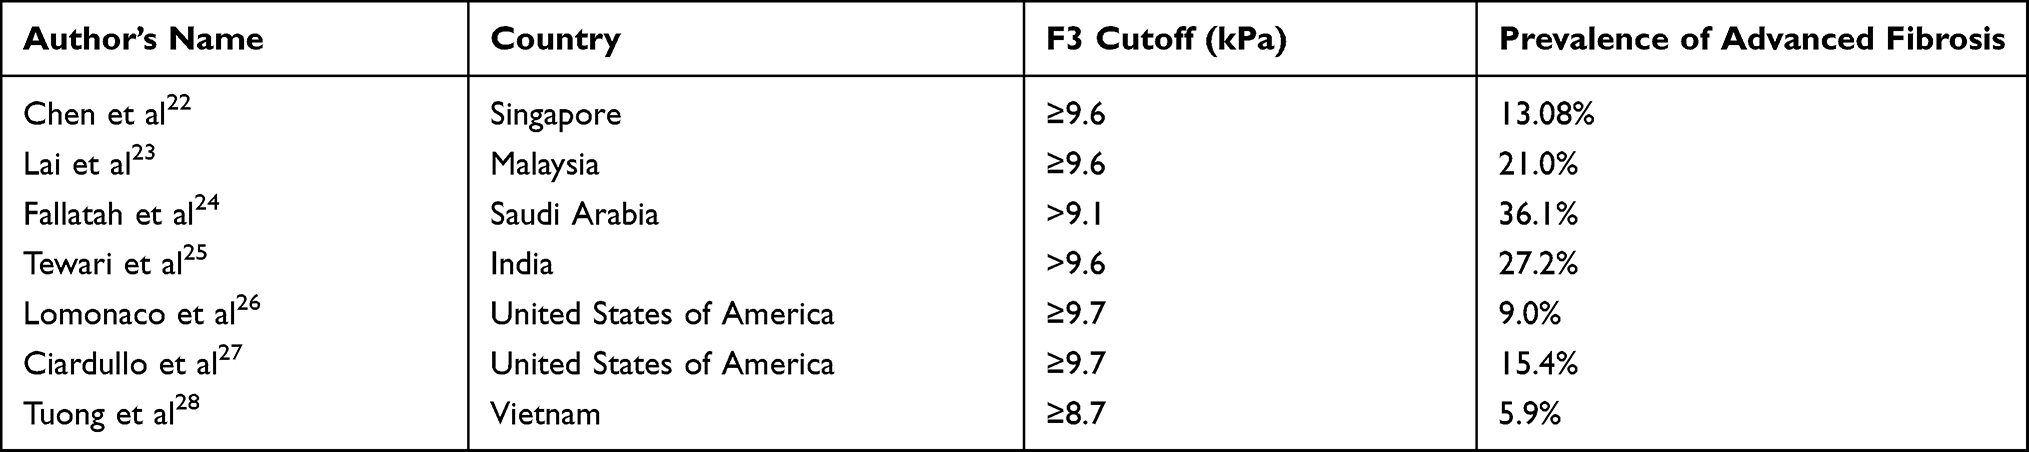 |
Table 3 Prevalence of Advanced Fibrosis (≥F3) Observed by Other Authors Using Various Cutoff Values for kPa |
We found no difference in age between subjects with and without advanced fibrosis, although age was strongly correlated with the fibrosis score (kPa). Several studies have reported that age is a factor associated with the development and severity of liver fibrosis in NAFLD, whereas other studies have reported that the increased probability of liver fibrosis among T2DM patients is independent of age.22–25,27,28 Similar to Chen et al and Tuong et al, we did not observe any sex-associated influences on fibrosis severity.22,28 By contrast, Lai et al and Fallatah et al found that male patients are more likely to have advanced fibrosis than female patients.23,24 We found such influence only in subjects without advanced fibrosis.
The duration of diabetes and HbA1c levels was similar between the two groups and was not correlated with fibrosis scores in this study. Elevated HbA1c levels have been associated with liver fibrosis in some studies.23,25 Single HbA1c is not the reflection of glycemic control over years, which can make correlating HbA1c results with fibrosis severity challenging. Tewari et al observed a strong correlation between advanced fibrosis and the duration of diabetes,25 whereas Chen et al and Tuong et al also observed no correlation between fibrosis and HbA1c, similar to our findings.22,28
Subjects with advanced fibrosis had higher BMI values than their counterparts, but WC and the frequency of obesity were similar between the two groups in this study. In most studies, patients with advanced fibrosis had greater BMI and WC values and were more likely to be obese and centrally obese.23,25,28 Most (67.3%) of our study subjects were obese, and almost all (98%) of them had central obesity, which may explain the similar WC and obesity frequencies observed between the two groups. Similar to previous studies, we observed strong positive correlations between BMI, obesity, WC, and the fibrosis score though such correlations were not observed in subjects with advanced fibrosis in this study.
Except for a positive correlation with triglyceride level in the subjects without advanced fibrosis, we observed no influences of the various lipid parameters on fibrosis severity; Chen et al and Tuong et al reported no relationship among fibrosis severity and serum lipids.22,28 This result should be interpreted cautiously as nearly one-third (32.7%) of our study subjects were on the lipid-lowering agent(s). By contrast, higher TG and lower HDL were observed among patients with T2DM and advanced fibrosis by Lai et al.23
Similar to the reported outcomes of previous research, serum ALT and AST values were higher in the advanced fibrosis group in the present study.22,23,28 The fibrosis scores were strongly correlated with all the study subjects’ ALT and AST values; in subgroup analysis, such correlation was not observed in the advanced fibrosis group. AST:ALT ratio was higher in the advanced fibrosis group, but the difference was not statistically significant; kPa value did not correlate with the AST:ALT ratio. Fallatah et al observed a strong positive correlation between the fibrosis score and the AST:ALT ratio.24 NAFLD is the leading cause of elevated ALT and AST in patients with T2DM. Elevated serum aminotransferases in patients with NAFLD may serve as useful markers for a clinician to suspect the presence of NASH.3,6,22 Individually, ALT and AST do not correlate very well with the severity of NAFLD always. Normal ALT and AST levels are not uncommon in patients with NASH; even with the entire spectrum of histological findings of NAFLD, including active necroinflammation, fibrosis and cirrhosis, patients may have normal ALT values.29 In this study, a large proportion of subjects with advanced fibrosis had normal ALT and AST levels (29.3% and 24.4%, respectively). By contrast, 43.3% and 38.4% of subjects without advanced fibrosis had elevated ALT and AST levels, respectively. Verma et al also found that 37.5% of the normal ALT group had NASH or advanced fibrosis, whereas 53% of the elevated ALT group had no NASH or advanced fibrosis.30 Our observation indicates that serum aminotransferase level may not be ideal for screening patients with more severe NAFLD because these values can present as normal across the spectrum of the disease.23
USG is a cheap and easily accessible method representing the most commonly used imaging method for NAFLD diagnosis. In a meta-analysis, the overall sensitivity and specificity of USG for the detection of moderate-severe fatty liver, compared to histology (the gold standard), were 84.8% and 93.6%, respectively.31 In the Rotterdam study, which included 3041 participants from the general population, steatosis, as detected by USG, was strongly associated with the presence of clinically relevant fibrosis (defined as LSM ≥8 kPa by TE).32 This study observed higher frequencies of advanced fatty liver grades as assessed by USG, and LSM was strongly and positively correlated with the USG grade for fatty liver, especially in cases of advanced fibrosis. Kamali et al reported 73% sensitivity and 69% specificity for USG when detecting fatty liver disease using TE as a standard method.33
This study has several limitations. It was performed as a single-center study, and the sample size was small relative to the national NAFLD prevalence data; therefore, the study may not reflect the characteristics of the country. Liver biopsy, the gold standard for NAFLD diagnosis, was not used in this study. We did not use adjusted cutoff values of kPa for the XL probe, which may affect the results’ accuracy. Moreover, we did not measure hepatic steatosis using the controlled attenuation parameter (CAP). We also obtained no data on platelet counts and could not measure Fibrosis-4 (FIB-4) scores or AST:platelet ratio index (APRI) scores, which are other novel non-invasive markers of liver fibrosis.
Conclusion
In our study, out of 205 USG-diagnosed NAFLD patients with T2DM who underwent TE, 20% had advanced fibrosis (≥F3). Advanced fibrosis was associated with higher BMI and higher ALT and AST levels. In addition, fatty liver grade in USG was found to help predict advanced fibrosis. Therefore, patients with T2DM who have fatty liver detected by USG may be further investigated by liver stiffness measurements using TE.
Data Sharing Statement
The data used to support this study are available from the corresponding author upon request.
Ethical Considerations
Ethical approval for this study (CHD/IRB/2019/11) was provided by the Institutional Review Board of Comilla Diabetic Association, Comilla, Bangladesh, on 15 November 2019. All participants provided written informed consent before inclusion. The study was conducted following the principles of biomedical research as stated in the Declaration of Helsinki.
Funding
The authors received no funding from any external sources for this study.
Disclosure
The authors report no conflicts of interest in this work.
References
1. Adams LA, Lymp JF, St Sauver J, et al. The natural history of nonalcoholic fatty liver disease: a population-based cohort study. Gastroenterology. 2005;129(1):113–121. doi:10.1053/j.gastro.2005.04.014
2. Younossi ZM, Koenig AB, Abdelatif D, et al. Global epidemiology of nonalcoholic fatty liver disease-meta-analytic assessment of prevalence, incidence, and outcomes. Hepatology. 2016;64(1):73–84. doi:10.1002/hep.28431
3. Younossi ZM, Golabi P, de Avila L, et al. The global epidemiology of NAFLD and NASH in patients with type 2 diabetes: a systematic review and meta-analysis. J Hepatol. 2019;71(4):793–801. doi:10.1016/j.jhep.2019.06.021
4. Mantovani A, Petracca G, Beatrice G, et al. Nonalcoholic fatty liver disease and risk of incident diabetes mellitus: an updated meta-analysis of 501022 adult individuals. Gut. 2020;
5. Khanal UP, Paudel B, Gurung G, et al. Correlational study of nonalcoholic fatty liver disease diagnosed by ultrasonography with lipid profile and body mass index in adult Nepalese population. J Med Ultrasound. 2019;27(1):19–25. doi:10.4103/JMU.JMU_53_18
6. Foucher J, Chanteloup E, Vergniol J, et al. Diagnosis of cirrhosis by transient elastography (FibroScan): a prospective study. Gut. 2006;55(3):403–408. doi:10.1136/gut.2005.069153
7. Dyson JK, Anstee QM, McPherson S. Nonalcoholic fatty liver disease: a practical approach to diagnosis and staging. Frontline Gastroenterol. 2014;5(3):211–218. doi:10.1136/flgastro-2013-100403
8. WHO Expert Consultation. Appropriate body-mass index for Asian populations and its implications for policy and intervention strategies. Lancet. 2004;363(9403):157–163. doi:10.1016/S0140-6736(03)15268-3.
9. National Cholesterol Education Program (NCEP) Expert Panel on Detection, Evaluation, and Treatment of High Blood Cholesterol in Adults (Adult Treatment Panel III). Third report of the National Cholesterol Education Program (NCEP) expert panel on detection, evaluation, and treatment of high blood cholesterol in adults (Adult Treatment Panel III) final report. Circulation. 2002;106(25):3143–3421. doi:10.1161/circ.106.25.3143.
10. Tsochatzis EA, Gurusamy KS, Ntaoula S, et al. Elastography for the diagnosis of severity of fibrosis in chronic liver disease: a meta-analysis of diagnostic accuracy. J Hepatol. 2011;54(4):650–659. doi:10.1016/j.jhep.2010.07.033
11. Hashemi SA, Alavian SM, Gholami-Fesharaki M. Assessment of transient elastography (FibroScan) for diagnosis of fibrosis in nonalcoholic fatty liver disease: a systematic review and meta-analysis. Caspian J Intern Med. 2016;7(4):242–252.
12. Newsome PN, Sasso M, Deeks JJ, et al. FibroScan-AST (FAST) score for the non-invasive identification of patients with nonalcoholic steatohepatitis with significant activity and fibrosis: a prospective derivation and global validation study. Lancet Gastroenterol Hepatol. 2020;5(4):362–373. doi:10.1016/S2468-1253(19)303838
13. Eddowes PJ, Sasso M, Allison M, et al. Accuracy of FibroScan controlled attenuation parameter and liver stiffness measurement in assessing steatosis and fibrosis in patients with nonalcoholic fatty liver disease. Gastroenterology. 2019;156(6):1717–1730. doi:10.1053/j.gastro.2019.01.042
14. Kumar R, Rastogi A, Sharma MK, et al. Liver stiffness measurements in patients with different stages of nonalcoholic fatty liver disease: diagnostic performance and clinicopathological correlation. Dig Dis Sci. 2013;58(1):265–274. doi:10.1007/s10620-012-2306-1
15. Younossi Z, Anstee QM, Marietti M, et al. Global burden of NAFLD and NASH: trends, predictions, risk factors and prevention. Nat Rev Gastroenterol Hepatol. 2018;15(1):11–20. doi:10.1038/nrgastro.2017.109
16. Kalra S, Vithalani M, Gulati G, et al. Study of prevalence of nonalcoholic fatty liver disease (NAFLD) in type 2 diabetes patients in India (SPRINT). J Assoc Physicians India. 2013;61(7):448–453.
17. Alam S, Fahim SM, Chowdhury MAB, et al. Prevalence and risk factors of nonalcoholic fatty liver disease in Bangladesh. JGH Open. 2018;2(2):39–46. doi:10.1002/jgh3.12044
18. Li Y, Wang J, Tang Y, et al. Bidirectional association between nonalcoholic fatty liver disease and type 2 diabetes in Chinese population: evidence from the Dongfeng-Tongji cohort study. PLoS One. 2017;12(3):e0174291. doi:10.1371/journal.pone.0174291
19. Dai W, Ye L, Liu A, et al. Prevalence of nonalcoholic fatty liver disease in patients with type 2 diabetes mellitus: a meta-analysis. Medicine. 2017;96(39):e8179. doi:10.1097/MD.0000000000008179
20. Lazo M, Clark JM. The epidemiology of nonalcoholic fatty liver disease: a global perspective. Semin Liver Dis. 2008;28(4):339–350. doi:10.1055/s-0028-1091978
21. Tada T, Toyoda H, Sone Y, et al. Type 2 diabetes mellitus: a risk factor for progression of liver fibrosis in middle-aged patients with nonalcoholic fatty liver disease. J Gastroenterol Hepatol. 2019;34(11):2011–2018. doi:10.1111/jgh.14734
22. Chen K, Sng WK, Quah JH, et al. Clinical spectrum of nonalcoholic fatty liver disease in patients with diabetes mellitus. PLoS One. 2020;15(8):e0236977. doi:10.1371/journal.pone.0236977
23. Lai -L-L, Wan Yusoff WNI, Vethakkan SR, et al. Screening for nonalcoholic fatty liver disease in patients with type 2 diabetes mellitus using transient elastography. J Gastroenterol Hepatol. 2019;34(8):1396–1403. doi:10.1111/jgh.14577
24. Fallatah HI, Akbar HO, Fallatah AM. Fibroscan compared to FIB-4, APRI, and AST/ALT ratio for assessment of liver fibrosis in Saudi patients with nonalcoholic fatty liver disease. Hepat Mon. 2016;16(7):e38346. doi:10.5812/hepatmon.38346
25. Tewari A, Tewari V, Tewari J. Screening for nonalcoholic liver disease in type 2 diabetic patients and its association with age, BMI and duration of diabetes mellitus- A cross-sectional study. J Clin Diag Res. 2021;15(4):OC27–OC30. doi:10.7860/JCDR/2021/47105.14788
26. Lomonaco R, Godinez Leiva E, Bril F, et al. Advanced liver fibrosis is common in patients with type 2 diabetes followed in the outpatient setting: the need for systematic screening. Diabetes Care. 2021;44(2):399–406. doi:10.2337/dc20-1997
27. Ciardullo S, Monti T, Perseghin G. High prevalence of advanced liver fibrosis assessed by transient elastography among U.S. adults with type 2 diabetes. Diabetes Care. 2021;44(2):519–525. doi:10.2337/dc20-1778
28. Tuong TTK, Tran DK, Phu PQT, et al. Nonalcoholic fatty liver disease in patients with type 2 diabetes: evaluation of hepatic fibrosis and steatosis using Fibroscan. Diagnostics. 2020;10(3):159. doi:10.3390/diagnostics10030159
29. Mofrad P, Contos MJ, Haque M, et al. Clinical and histologic spectrum of nonalcoholic fatty liver disease associated with normal ALT values. Hepatology. 2003;37(6):1286–1292. doi:10.1053/jhep.2003.50229
30. Verma S, Jensen D, Hart J, et al. Predictive value of ALT levels for nonalcoholic steatohepatitis (NASH) and advanced fibrosis in nonalcoholic fatty liver disease (NAFLD). Liver Int. 2013;33(9):1398–1405. doi:10.1111/liv.12226
31. Hernaez R, Lazo M, Bonekamp S, et al. Diagnostic accuracy and reliability of ultrasonography for the detection of fatty liver: a meta-analysis. Hepatology. 2011;54(3):1082–1090. doi:10.1002/hep.24452
32. Koehler EM, Plompen EP, Schouten JN, et al. Presence of diabetes mellitus and steatosis is associated with liver stiffness in a general population: the Rotterdam study. Hepatology. 2016;63(1):138–147. doi:10.1002/hep.27981
33. Kamali L, Adibi A, Ebrahimian S, et al. Diagnostic performance of ultrasonography in detecting fatty liver disease in comparison with FibroScan in people suspected of fatty liver. Adv Biomed Res. 2019;8:69. doi:10.4103/abr.abr_114_19
 © 2021 The Author(s). This work is published and licensed by Dove Medical Press Limited. The
full terms of this license are available at https://www.dovepress.com/terms
and incorporate the Creative Commons Attribution
- Non Commercial (unported, 3.0) License.
By accessing the work you hereby accept the Terms. Non-commercial uses of the work are permitted
without any further permission from Dove Medical Press Limited, provided the work is properly
attributed. For permission for commercial use of this work, please see paragraphs 4.2 and 5 of our Terms.
© 2021 The Author(s). This work is published and licensed by Dove Medical Press Limited. The
full terms of this license are available at https://www.dovepress.com/terms
and incorporate the Creative Commons Attribution
- Non Commercial (unported, 3.0) License.
By accessing the work you hereby accept the Terms. Non-commercial uses of the work are permitted
without any further permission from Dove Medical Press Limited, provided the work is properly
attributed. For permission for commercial use of this work, please see paragraphs 4.2 and 5 of our Terms.