Back to Journals » Diabetes, Metabolic Syndrome and Obesity » Volume 15
Liver Enzymes are Associated with Hyperglycemia in Diabetes: A Three-Year Retrospective Study
Received 3 December 2021
Accepted for publication 9 February 2022
Published 23 February 2022 Volume 2022:15 Pages 545—555
DOI https://doi.org/10.2147/DMSO.S350426
Checked for plagiarism Yes
Review by Single anonymous peer review
Peer reviewer comments 2
Editor who approved publication: Prof. Dr. Juei-Tang Cheng
Jie-Ying Wan, Li-Zhen Yang
Division of Endocrinology and Metabolism, Shanghai Ninth People’s Hospital, Shanghai Jiao Tong University School of Medicine, Shanghai, 200011, People’s Republic of China
Correspondence: Li-Zhen Yang, Tel +86-15618690375, Email [email protected]
Purpose: The correlation between liver enzymes and blood glucose in diabetes mellitus remains unclear. The purpose of present three-year retrospective study was to explore the association between liver enzymes and glycemia in type 2 diabetes mellitus (T2DM).
Patients and Methods: 2046 participants (non-fatty liver, n=1253; fatty liver, n=793) with T2DM were included in our study. For all these patients, related basic clinical information, biochemical parameters and liver ultrasonic data were collected. The effects of liver enzymes on blood glucose levels were analysed by linear and binary logistic regression models.
Results: In the comparative analyses between groups, gamma-glutamyltransferase (GGT) and serum alkaline phosphatase (AKP) levels increased with glycosylated haemoglobin A1c (HbA1c) concentration, but alanine aminotransferase and aspartate aminotransferase did not show the same trend. Adjusted for possible confounding factors, the linear regression models indicated the strong positive correlations between Log10 AKP, Log10 GGT and three blood glucose parameters (fasting glucose, postprandial glucose, and HbA1c) (all P< 0.01). And such correlations were more significant in the subgroups of fatty liver. Multivariate binary logistic regression showed that the ORs increased by 1.01 times higher per Log10 AKP unit in the highest blood glucose tertile (P< 0.01).
Conclusion: GGT and especially AKP can aggravate hyperglycemia in T2DM patients, which provides new clues for the research and treatment of T2DM.
Keywords: liver enzymes, fasting blood glucose, postprandial blood glucose, HbA1c, T2DM
Introduction
Over the last few decades, the number of patients with diabetes has risen unprecedently, and it is predicted that it will increase to 600 million globally by 2035.1 The consensus is that maintaining blood glucose homeostasis is one of the most important steps in the treatment of diabetes. The liver is involved in regulating glycemic homeostasis by means of glycogenesis, gluconeogenesis and etc.2 The plasma concentrations of liver enzymes are routinely measured in patients with and without T2DM. Elevated liver enzyme concentrations may not always indicate hepatitis or excessive alcohol consumption, but they may suggest the existence of metabolic syndrome.3 A meta-analysis,4 focusing on the aspartate aminotransferase (AST) and alanine aminotransferase (ALT) levels, showed that a moderate association existed between an increased risk of T2DM and ALT but not AST. A series of previous clinical studies have also shown that ALT5,6 and gamma-glutamyltransferase (GGT)5–7 were independent predictors of T2DM in the older people5 and general population.6,7 The relationship between liver enzymes and fasting blood glucose (FPG) was also mentioned in previous studies,8 which is, ALT was positively correlated with FPG. However, previous studies have not mentioned the relationship between entire parameters of liver function and glycemic control indexes, such as postprandial blood glucose (PBG) and HbA1c, which can also be used in the diagnosis and glucose monitoring of T2DM.9
The increased hepatic gluconeogenesis and insulin resistance may lead to hyperglycemia. However, it remains uncertain whether they are associated with liver function parameters. Hence, the efforts to explore the pathogenesis of the relationship between liver function parameters and glucose metabolism are still needed. The purpose of the present study tried to probe into whether and to what extent liver function indicators are associated with blood glucose levels in T2DM patients.
Materials and Methods
Study Population
We collected 2099 medical records and test data of hospitalized T2DM patients for three consecutive years approximately at the Endocrinology and Metabolism Division of the hospital. The selection criteria were (I) age older than 18 years and (II) T2DM. The exclusion criteria were as follows: (I) diabetic ketosis or other acute complications of diabetes, (II) liver or renal dysfunction, (III) serious infection, (IV) malignant tumour, (v) gestational diabetes mellitus, and (vi) history of hepatitis or taking drugs that may cause liver damage in the past three months. After excluding patients without complete laboratory data (n=46) and with severe liver disease history (n=5) or abnormal liver function parameters (outliers) (n=2), 2046 patients were eventually enrolled. The present study was approved by the primary registration institution of the World Health Organization international clinical trial registry (the approval number: ChiCTR1800017123).
Data Collection
Most data collected in the study were collected and verified by the same person. Body Mass Index (BMI: Kg/m2) = Weight/Height squared. Blood pressure was measured by a sphygmomanometer (TERUMO-Elemano H5503, Tokyo, Japan).
Laboratory Assays
Basic information of all participants, including age, sex, BMI, hospitalization time, blood pressure, and current medication status, were collected from the medical history system. Venous blood was drawn for laboratory tests after 8 hours of fasting. Platelet count (PLT) was measured by an XE-2100 automatic hemorheometer (Sysmex, Japan), and FPG, PBG, albumin, liver enzyme parameters and lipid profiles, were measured using a Beckman Coulter AU680 system (Brea, USA). Serum insulin and C-peptide concentrations were determined by chemiluminescence using Abbott ARCHITECT i2000sr (Illinois, USA), and HbA1c was measured by HPLC (MQ-2000PT, Medconn, Shanghai. The normal liver enzyme reference ranges used for this study were as follows: GGT: 0–38 U/L; ALT: 10–49 U/L; AST: 0–34 U/L; and AKP: 46–116 U/L.
Definition
The diagnosis of nonalcoholic fatty liver disease (NAFLD): (I) elevated ALT and/or AST; (II) no alcohol abuse. Women and men did not exceed the weekly alcohol intake 70 g and 140 g respectively; (III) B-ultrasound: The experienced ultrasonologists performed abdominal ultrasonographic examinations, and the ultrasonographic diagnostic criteria included hepatic and renal echo discrepancy, as well as increased and bright liver echogenicity;10 (IV) the subjects suffered hepatic diseases by other causes including alcohol, virus, drug, autoimmune, cholestasis or heredity were excluded. All patient were diagnosed as T2DM in accordance with the diagnostic criteria of the American Diabetes Association. Homeostasis model assessment of insulin resistance (HOMA-IR) was assessed by a formula: (mmol/L×μU/mL) = [FPG (mmol/l)]×[FINS (μU/mL)]/22.5. In addition, we introduced two indicators, NAFLD fibrosis score (NFS)11 and fatty liver index (FLI),12 to assess the degree of fatty liver and hepatic fibrosis, respectively. NFS=−1.675+ 0.037×age(y)+0.094 ×BMI (kg/m2)+1.13×IFG or diabetes (yes=1, no=0)+0.99×AST/ALT ratio-0.013×PLT(×109/L)-0.66× albumin (g/dl), <-1.455, absence of significant fibrosis; −1.455–0.676, uncertain; >0.676, presence of significant fibrosis.11
FLI=(Exp 0.953×ln (TG (mmol/L))+0.139×BMI (kg/m2)+0.718×ln (GGT (U/L))+0.053×WC (cm)-15.745)/(1 + Exp 0.953×ln (TG (mmol/L))+0.139×BMI (kg/m2)+0.718×ln (GGT (U/L))+0.053×WC (cm)-15.745)×100, <30, absence of significant hepatic steatosis, 30–60, uncertain; >60, presence of significant hepatic steatosis.12
Statistical Analysis
Data analysis was performed by SPSS version 24.0 (SPSS Inc., Chicago, IL, USA). Whether continuous variables were normally distributed should be tested by Shapiro-Wilk test. The results showed that all continuous variables in this study were non-normally distributed. Hence, in this study, they were represented by medians (25–75 percentiles). The differences between two and more groups were analysed by Kruskal–Wallis and Nemenyi tests, respectively. Categorical variables are presented as percentages (%), and chi-square test was employed for differences analysis between groups. The association between liver enzymes and blood glucose was assessed by logistic and linear regression analyses. Log10 conversions are performed on the corresponding variable before multiple linear regression. If a variable changed the blood glucose value by more than 10% by linear regression analysis, the variable would be incorporated into a confounder as follows in the final model: age, smoking, alcohol, PLT, albumin, TC, LDL, FLI and NFS. The results of linear regression models were expressed as a non-standardized coefficient β (95% CI). Univariate and multivariate binary logistic regression analyses were conducted to estimate the odds ratios (ORs) of high tertiles of FPG (>8.40 mmol/L), PBG (>13.20 mmol/L) and HbA1c (>9.60 mmol/L). All analyses were two-sided, and P<0.05 indicated significant difference.
Results
Clinical Characteristics of the Participants
In total, 2046 patients with T2DM participated in the study. In non-fatty liver (n=1253) and fatty liver groups (n=793), GGT were 21.00 (15.00–31.00) U/L and 29.00 (20.00–45.00) U/L (P=0.000), ALT were 17.00 (13.00–24.00) U/L and 23.00 (16.00–34.00) U/L (P=0.000), AST were 18.00 (15.00–22.00) U/L and 21.00 (17.00–27.00) U/L (P=0.000) and AKP were 73.00 (59.00–89.00) U/L and 76.00 (63.00–92.00) U/L (P=0.001), respectively. All variables were grouped according to HbA1c quartiles: Q1 (3.90–7.30%, n=547), Q2 (7.30–8.50%, n=479), Q3 (8.50–10.20%, n=524), and Q4 (10.20–17.70%, n=495), and an interquartile comparison was performed, as shown in Table 1. For all the participants, no statistical differences were found among the HbA1c quartiles of the sex, alcohol and SBP etc. Compared with those in the low-level HbA1c group (Q1), DBP, PLT, FPG, PBG, GGT, AKP, TC, TG and LDL in the other three groups (Q2, Q3 and Q4) were significantly increased, while NFS, FINS, FCP, PINS, PCP, ALB and HDL levels were significantly decreased.
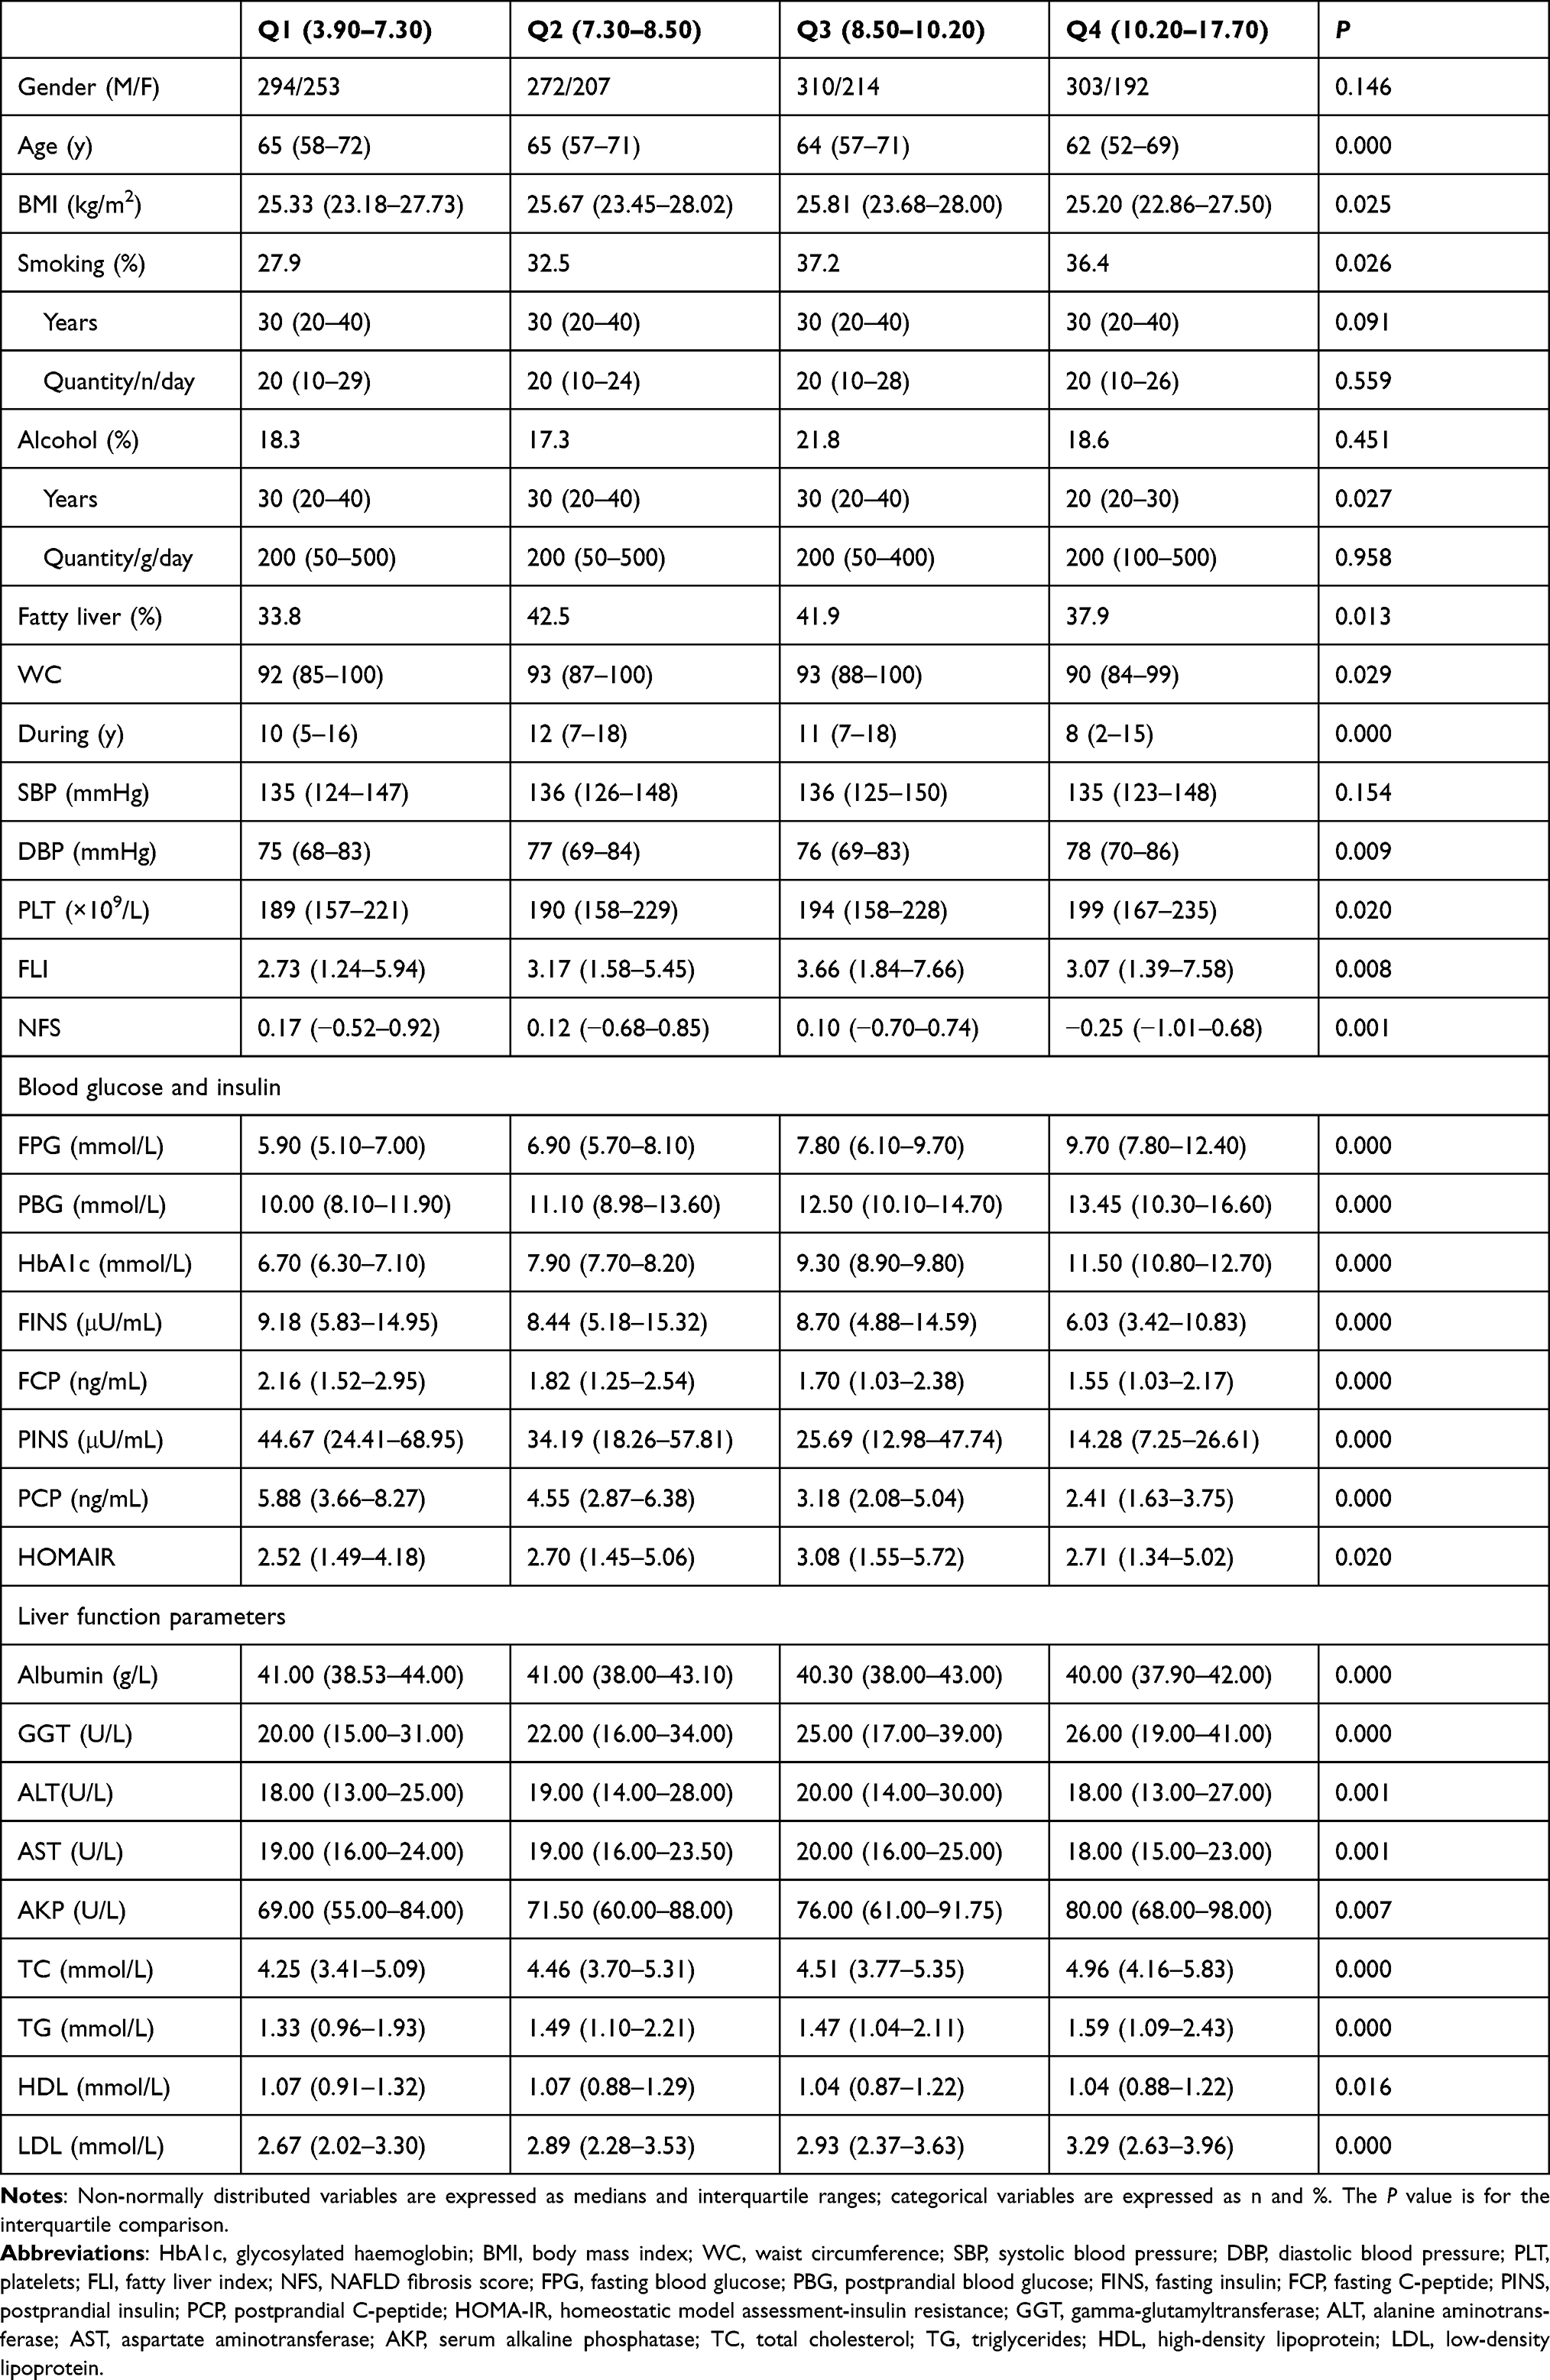 |
Table 1 Characteristics of the Study Population According to Baseline HbA1c Quartiles |
Association of Liver Enzymes (Independent Variables) and Blood Glucose (Dependent Variable)
The results of Table 2 from multiple linear regression methods show the correlation between liver enzymes and blood glucose parameters. In the models adjusted for age, smoking, alcohol, PLT, albumin, TC, LDL, FLI and NFS, Log10 GGT and Log10 AKP were significantly positively related with Log10 FPG, Log10 PBG and Log10 HbA1c (all P<0.01) in all patients, but no similarly correlation between ALT, AST and blood glucose parameters was observed.
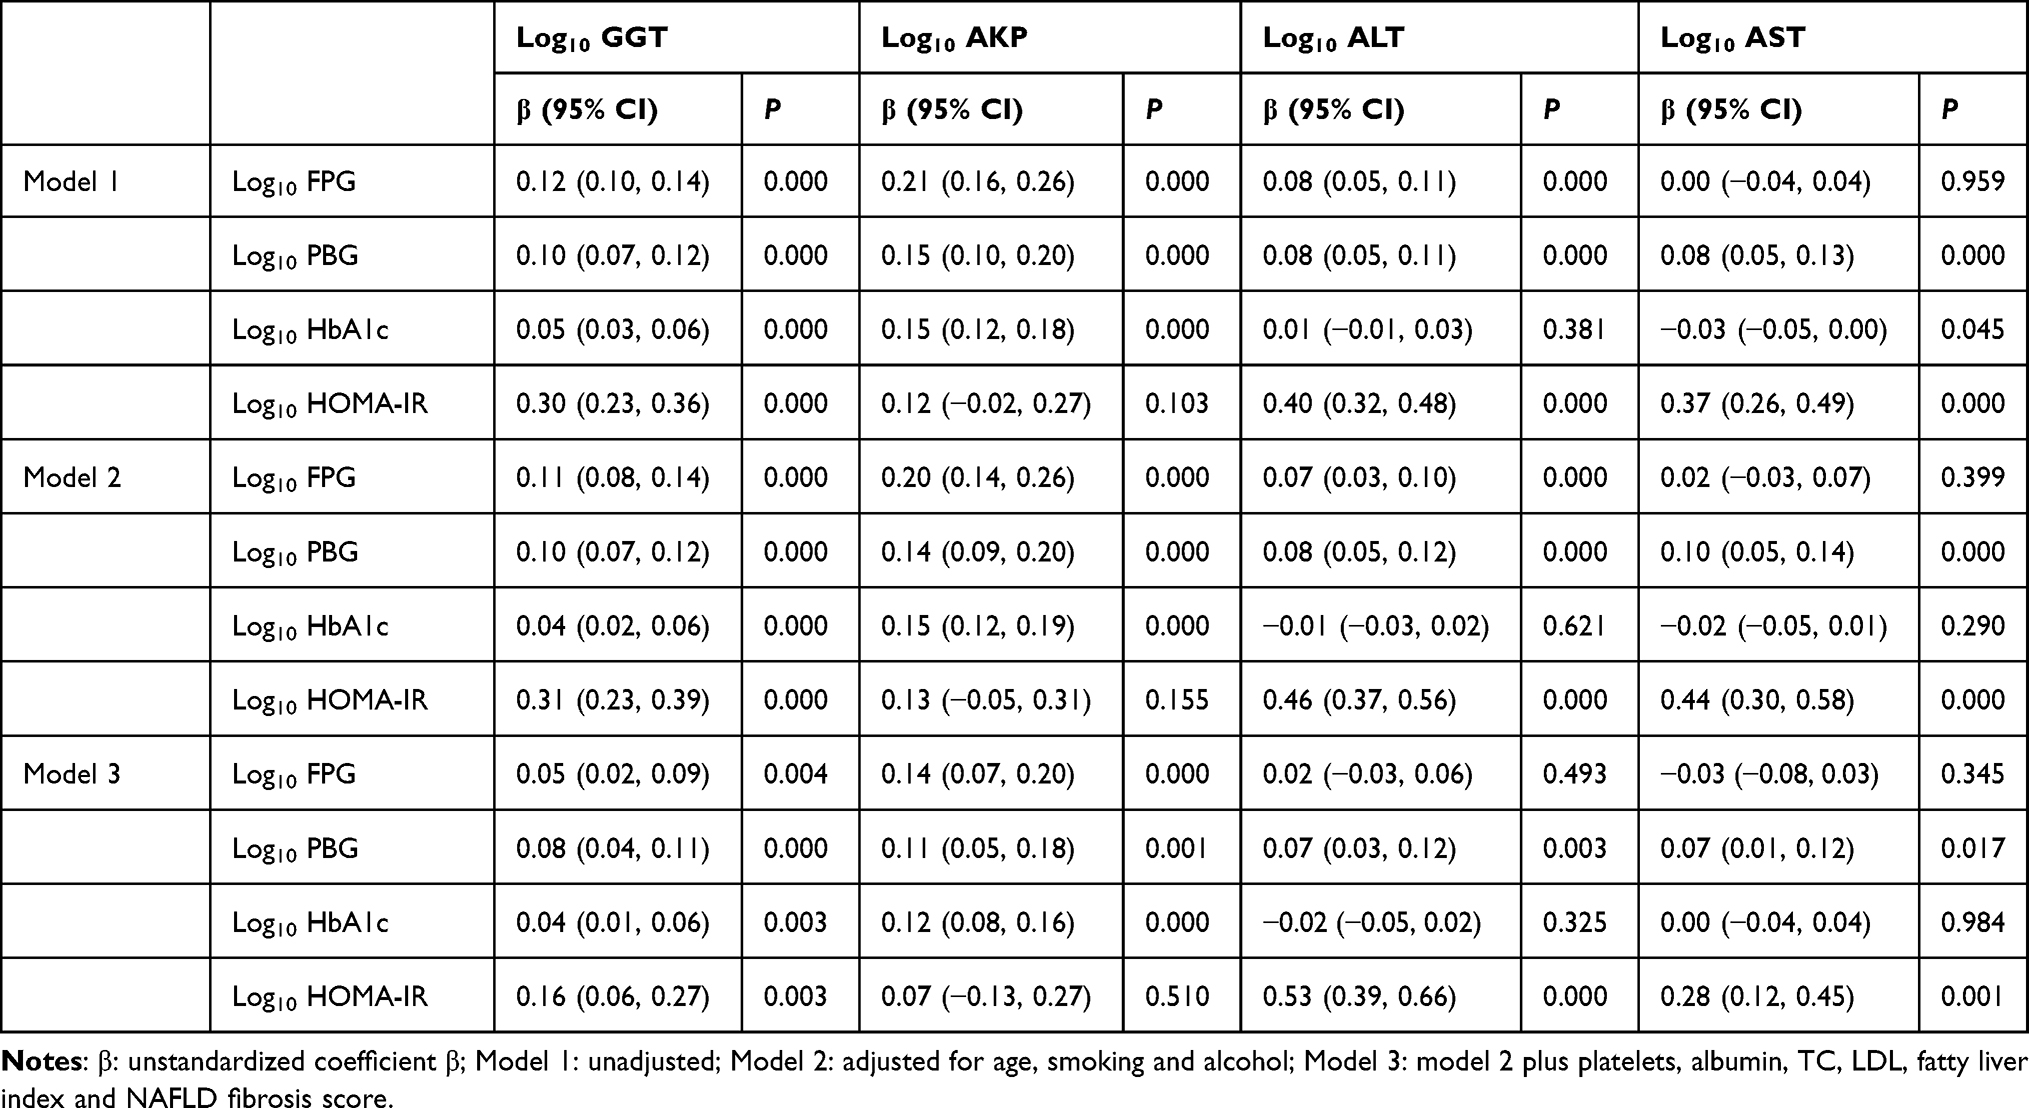 |
Table 2 Association of the Liver Enzymes (Independent Variables) and Blood Glucose (Dependent Variable) According to Multiple Linear Regression Analysis |
To further explore the relationship between GGT, AKP and blood glucose, we analyzed the correlation between the above two liver enzymes and blood glucose according to different degrees of fatty liver and liver fibrosis (Table 3). Log10 AKP was positively correlated with Log10 FPG, Log10 PBG and Log10HbA1c in the non-fibrosis groups. Similarly, in the NFS subgroups, the relationship between Log10 AKP and Log10 HbA1c was more significant in the fatty liver or suspected fatty liver group, and the relationship between Log10 GGT and blood glucose was more significant as the degree of fatty liver increased.
 |
Table 3 Association of the Serum GGT and AKP Concentrations (Independent Variables) and Blood Glucose (Dependent Variable) According to Different Degrees of Fatty Liver and Liver Fibrosis |
Association of Serum GGT and AKP Concentrations (Independent Variables) and Blood Glucose (Dependent Variable)
As shown as Table 4, FPG, PBG and HbA1c were divided according to tertiles (FPG: <6.20 mmol/L, 6.20–8.40 mmol/L, >8.40 mmol/L; PBG: <9.93 mmol/L, 9.93–13.20 mmol/L, >13.20 mmol/L; HbA1c: <7.70 mmol/L, 7.70–9.60 mmol/L, >9.60 mmol/L). With blood glucose as the dependent variable and age, smoking, alcohol, albumin, during, GGT, ALT, AST, AKP, TC, TG, HDL, LDL, FLI and NFS as the independent variables, univariate logistic regression analysis was performed first, and then multivariate logistic regression analysis was performed by the forward-Wald method. The ORs were 1.01 times higher for each Log10 unit increase of AKP in the highest FPG, PBG and HbA1c tertiles (all P<0.01), and GGT, ALT and AST did not show the same trend.
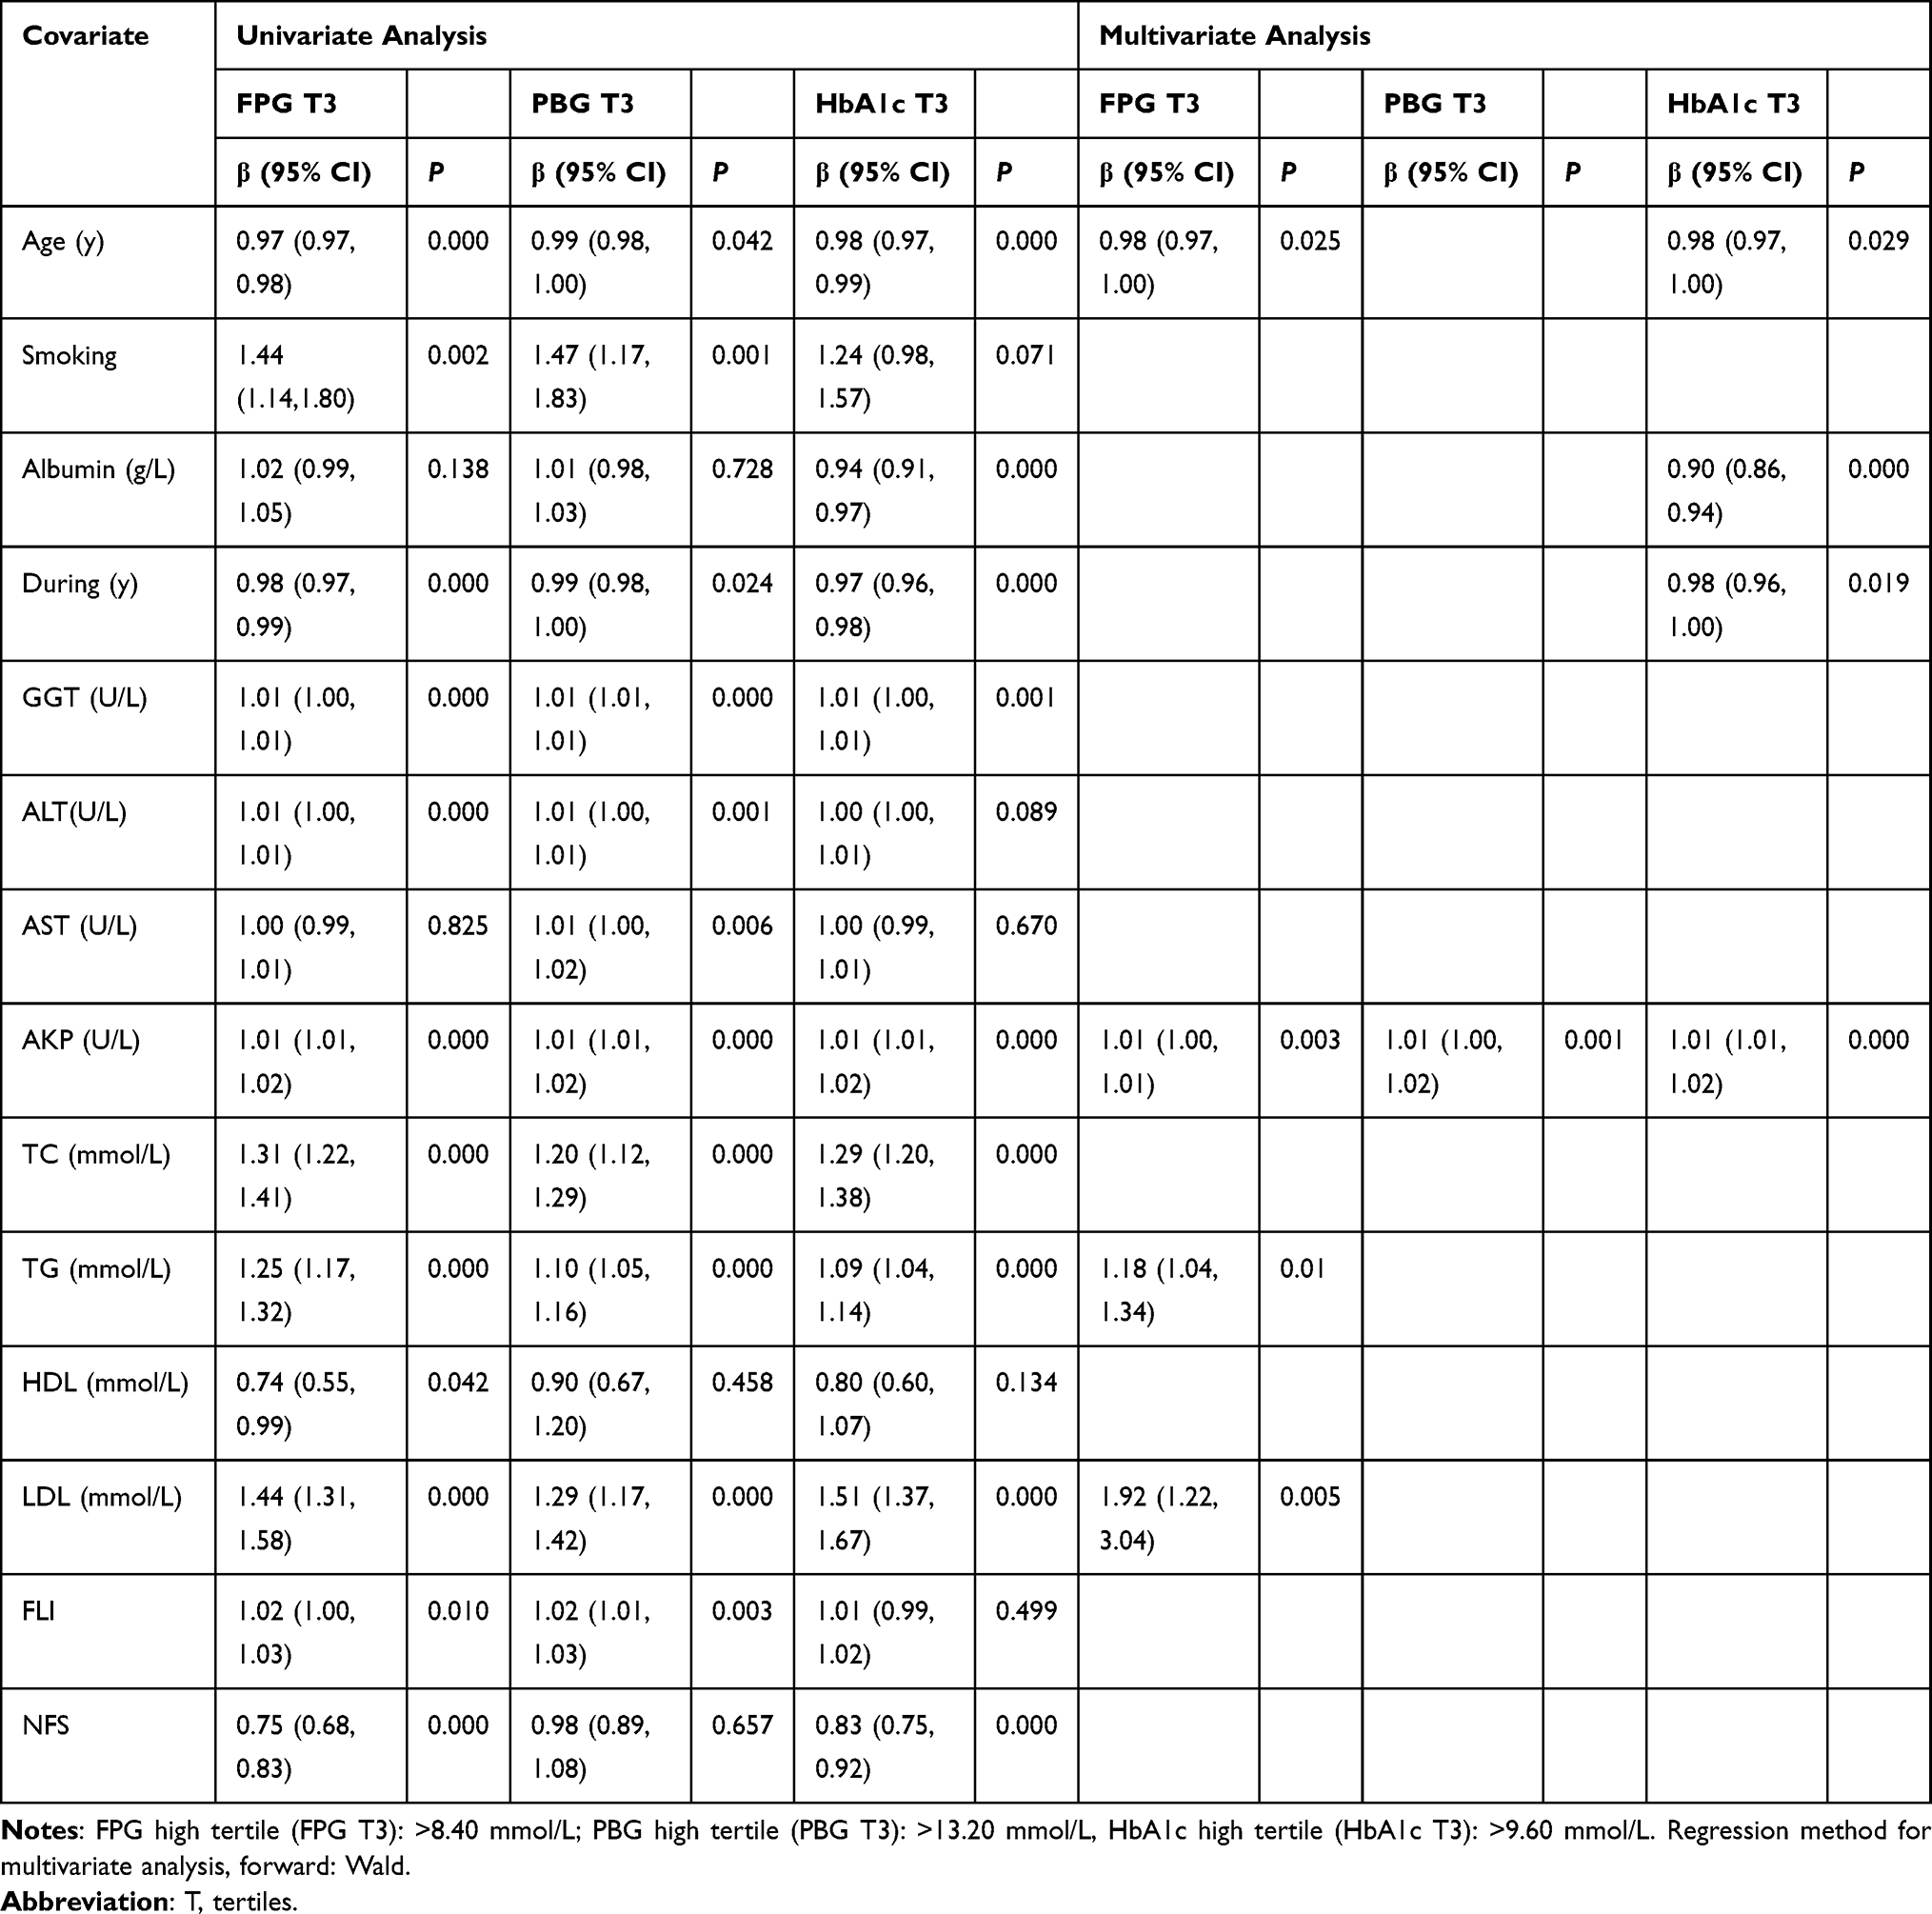 |
Table 4 Association of the Serum Liver Enzymes Concentrations (Independent Variables) and Blood Glucose (Dependent Variable) According to Binary Logistic Regression Analysis |
Discussion
The present retrospective study identified that blood glucose was significantly correlated with liver enzymes, including the concentrations of GGT and AKP. More importantly, compared with GGT, the relationships between the levels of FPG, PBG, HbA1c, HOMA-IR and the concentration of AKP were independent and significant. In addition, we found that the relationship between the two liver enzymes and blood glucose was somewhat correlated with the extent of fatty liver and liver fibrosis in T2DM. In addition, such trend was more pronounced in T2DM patients with fatty liver.
The liver participates in regulation of glycemic homeostasis because hepatic glucose production accounts for 79% of endogenous glucose production in the fasting state13 and is responsible for metabolizing the equivalent of 60–65% of the oral glucose load;14 therefore, we are concerned about the relationship between liver function parameters and blood glucose concentrations. As a series of indicators, AST, ALT, GGT and AKP are important common parameters reflecting the basic liver function status, and their changes can reflect the extent of hepatocytic damage.15 Therefore, we focused on these four parameters in this study.
In this study, we found that GGT and AKP were positively correlated with blood glucose levels in T2DM patients, while ALT and AST were not significantly correlated. A Mendel randomized study based on the Korean population also concluded that GGT was positively related with the risk of diabetes.16 However, reports from Europe indicated no significant causal association between GGT,17,18 AKP18 and T2DM. In addition, previous meta-analyses, prospective study, and Mendelian randomization studies have shown that ALT18,19 and AST19 were positively associated with the risk of T2DM in Western (mainly European) populations. But a previous meta-analysis of 2729 studies involving 60,359 participants and 3890 T2DM patients reported that AST did not increase the risk of T2DM,4 and another Mendel randomized study based on a Chinese population showed no significant association between ALT and blood glucose levels.8 We believe that the reasons for the inconsistent results may be the inconsistencies of the study population and the interference of confounding factors that cannot be excluded (such as dietary habits and bad living habits), and the failure to assess and correct the degree of fatty liver and liver fibrosis of each subject.
Increased GGT Concentrations in Patients with Dysglycemia
GGT is an important defender of cellular oxidation, responsible for extracellular catabolism of antioxidant glutathione (GSH), and maintains intracellular GSH concentration.20 Multiple studies have shown that GGT is a promising predictor of T2DM and a useful additional measure in discerning those at risk of diabetes,5–7,21 In addition, this study found that the positive correlation between GGT and blood glucose was more significant in patients with fatty liver, hence we speculate that the relationship between GGT and blood glucose is likely mediated by fatty liver.19 In addition, there are two possible explanations for the strong association between GGT concentrations and hyperglycemia. First, we hypothesized that the positive correlation between GGT and blood glucose might be associated with oxidative stress, a common pathological condition in hyperglycemia,22 and previous studies have indicated that it is directly involved in reactive oxygen species generation.23 Furthermore, GGT exists widely in human organ systems, including the kidney, pancreas, brain, and male reproductive systems,24 and it may be leaked into the serum because of normal cell turnover and cellular stress.7
Increased AKP in Patients with Hyperglycemia
In the HbA1c quartile, AKP levels increased with increasing HbA1c. The results of linear and logistic regression analyses also showed that AKP was significantly positively related with blood glucose and HOMA-IR. In addition, such relation was more significant than that between GGT and blood glucose. Although the biological mechanisms of the association between AKP and glucose regulation are unclear, several possibilities exist (Figure 1A). AKP is a membrane-bound glycoprotein that catalyses the hydrolysis of phosphate monoesters and is divided into four isozymes [ie, intestinal AKP (IAP), placental AKP (PLAP), germ cell AKP (GCLAP) (tissue-specific AKP; TSAP) and liver/bone/kidney AKP (tissue nonspecific AKP; TNAP)].25 In the intestine, FAT/CD36, a phosphorylated fatty acid translocase, is involved in promoting the transport of long-chain fatty acid (LCFA) into intestinal epithelial cells. Increased IAP leads to FAT/CD36 dephosphorylation and increases uptake of LCFA in the small intestine, which may exacerbate lipid metabolism disorders and insulin resistance in T2DM patients (Figure 1C).26 The present study also indicated that the positive correlation between AKP and blood glucose was more obvious in the patients with type 2 diabetic fatty liver, which could further explain why elevated AKP might lead to increase of blood glucose through the effect on lipid metabolism. TNAP elevates blood glucose levels by hydrolysing ATP, ADP, AMP, glucose-1-phosphate, glucose-6-phosphate (G-6-P), fructose-6-phosphate (F-6-P), β-glycerophosphate, and other intermediate and terminal products of glucose metabolism (Figure 1B), and there may be a negative feedback mechanism that elevates TNAP as well.27 Thus, we hypothesized that hyperglycemia might lead to more glucose entering the glycolysis process, leading to elevate intermediates and TNAP for the hydrolysis of glycolytic intermediates and ATP. In contrast, during the synthesis of hepatic glycogen from glucose (GLU → G-6-P → UDP-GLU → glycogen),14 G-6-P, as a key intermediate, can be hydrolysed by AKP, resulting in both glucose not being successfully transformed into glycogen and stored in the liver and the loss of homeostasis in the peripheral blood glucose concentration. In addition, due to the positive correlation between AKP concentration and HOMA-IR, we speculate that AKP is likely to act on insulin to affect blood glucose level (Figure 1D). Previous studies have found that after insulin binds to the insulin receptor, it can activate the receptor’s intrinsic tyrosine kinase activity and phosphorylate the tyrosine residues of the IRS (insulin receptor substrates) protein, thereby activating the mitogen-activated protein kinases (MAPK), phosphatidylinositol 3-kinase (PI3K) and Cbl-associated protein/Cbl (CAP/Cbl) signalling pathways. When PI3K binds to tyrosine-phosphorylated IRS, it motivates the production of phosphatidylinositol-3,4,5-trisphosphate, which promotes glucose transport and glycogen synthesis. The CAP/Cbl pathway can also regulate glucose transport by activating the GTP-binding protein TC10, thereby regulating blood glucose levels.28 Due to the dephosphorylation of AKP,27 the tyrosine residue of IRS is dephosphorylated, and its downstream signalling pathway cannot be activated normally, thus inhibiting glucose transport and glycogen synthesis, resulting in an increase in blood glucose levels. On the other hand, several common diseases, including bone disease and/or high glomerular filtration rate,29 may account for the elevated serum AKP levels in T2DM patients. Although we observed a correlation between AKP and blood glucose, the causal relationship between them still needs to be further investigated.
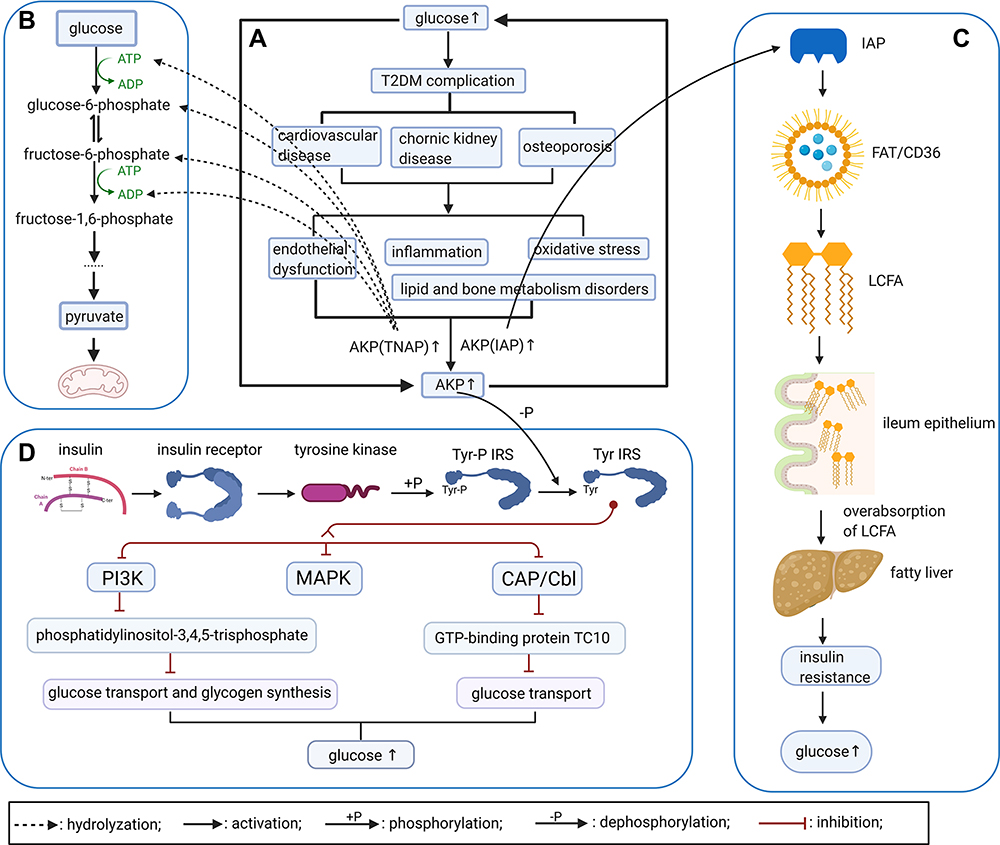 |
Figure 1 Interaction between elevated AKP concentrations and hyperglycemia (created with BioRender.com). (A) Persistent hyperglycemia will cause complications, such as cardiovascular disease, chronic kidney disease, osteoporosis, and pathological changes, including endothelial dysfunction, inflammation, oxidative stress and lipid and bone metabolism disorders, ultimately increasing AKP levels. (B) Normal aerobic oxidation and glycolysis in glucose metabolism. In the setting of hyperglycemia, increases in the AKP concentration can accelerate the hydrolysis of G-6-P, F-6-P, ATP, ADP, and other intermediate products of glucose metabolism, thereby accelerating the decomposition of glucose; this is a possible regulatory mechanism for elevating blood glucose level. (C) IAP and lipid metabolism. Dephosphorylation of the FAT/CD36 complex can promote LCFA entering the small intestine epithelial cells, thereby promoting fat absorption and metabolism, and IAP can accelerate this dephosphorylating process, leading to the overabsorption of fat, disorders of lipid metabolism and even promotion of fatty liver, and resulting in further aggravating the patient’s IR. Eventually, the blood glucose concentration cannot be adjusted to a normal level. (D) Through normal insulin signaling pathway, AKP may dephosphorylate the Tyr-phosphorylated insulin receptor substrates, leading to the failure of normal activation of PI3K and CAP/Cbl signalling pathways, thus inhibiting glucose transport and glycogen synthesis, causing the increase of blood glucose level. Abbreviations: IAP, intestinal alkaline phosphatase; TNAP, tissue nonspecific alkaline phosphatase; LCFA, long-chain fatty acid; IRS, insulin receptor substrates. |
Conclusion
A novel finding of the present work is the exact association between blood glucose (FPG, PBG, and HbA1c) and elevated GGT and AKP, which suggests that GGT and AKP may be new indicators of whether the control of FPG, PBG, and HbA1c in T2DM patients is effective. However, specific monitoring and prediction capabilities require further research. This study may alert clinicians to these phenomenons and highlight the importance of the hepatic function monitoring and adjustment in diabetic patients. We logically speculate that early detection of liver disease or abnormal liver enzyme indexes, especially AKP and GGT, and appropriate follow-up and intervention are beneficial to the control of blood glucose in T2DM patients.
The present research has some important limitations. Incomplete information regarding some complications was due to the retrospective study rather than a prospective one. Additionally, because of the limited sample size and only a retrospective study, from the study, we cannot confirm whether these patients had liver damage before developing T2DM. Admittedly, at the first clinic visit, the patients’ slight complaints for their hepatic diseases might be ignored by endocrinologists, but these related data could provide clues about the liver function alterations in the T2DM subjects. Finally, some covariates, such as vitamin D, glomerular filtration rate and parathyroid hormone, were not available.
Data Sharing Statement
After this paper is published, under the relevant regulations and laws, the data of the tables and figures in the article will be shared by the readers or scientists only for research purposes. In addition, the study protocol, statistical analysis plan and entire text of the paper are also available. Tables, study protocol, statistical methods and other data are included within the article, which can be downloaded from the official website of the journal, or obtained from the corresponding author upon request, corresponding author, Dr. Li-Zhen Yang, email, [email protected]. Data will be available permanently after this article is published.
Ethics Statement
The research is consistent with the Declaration of Helsinki. The ethics Committee of Shanghai Ninth People’s Hospital, Shanghai Jiao Tong University School of Medicine reviewed and approved the study. Informed consent is exempted, because the clinical data were collected only for a retrospective study and this study did not involve any personal privacy or commercial interest. We keep all participants anonymous anywhere in the article.
Acknowledgments
We appreciate Meng-Na Yu who participated in the early relevant data (about 200 cases, mainly for another study) collection.
Disclosure
The authors report no conflicts of interest in this work.
References
1. Zimmet PZ, Magliano DJ, Herman WH, et al. Diabetes: a 21st century challenge. Lancet Diabetes Endocrinol. 2014;2(1):56–64. doi:10.1016/s2213-8587(13)70112-8
2. Han HS, Kang G, Kim JS, et al. Regulation of glucose metabolism from a liver-centric perspective. Exp Mol Med. 2016;48:e218. doi:10.1038/emm.2015.122
3. Rantala AO, Lilja M, Kauma H, et al. Gamma-glutamyl transpeptidase and the metabolic syndrome. J Intern Med. 2000;248(3):230–238. doi:10.1046/j.1365-2796.2000.00723.x
4. Kunutsor SK, Apekey TA, Walley J. Liver aminotransferases and risk of incident type 2 diabetes: a systematic review and meta-analysis. Am J Epidemiol. 2013;178(2):159–171. doi:10.1093/aje/kws469
5. Wannamethee SG, Shaper AG, Lennon L, et al. Hepatic enzymes, the metabolic syndrome, and the risk of type 2 diabetes in older men. Diabetes Care. 2005;28(12):2913–2918. doi:10.2337/diacare.28.12.2913
6. Doi Y, Kubo M, Yonemoto K, et al. Liver enzymes as a predictor for incident diabetes in a Japanese population: the Hisayama study. Obesity. 2007;15(7):1841–1850. doi:10.1038/oby.2007.218
7. Lee DH, Ha MH, Kim JH, et al. Gamma-glutamyltransferase and diabetes–a 4 year follow-up study. Diabetologia. 2003;46(3):359–364. doi:10.1007/s00125-003-1036-5
8. Xu L, Jiang CQ, Lam TH, et al. Mendelian randomization estimates of alanine aminotransferase with cardiovascular disease: Guangzhou Biobank Cohort study. Hum Mol Genet. 2017;26(2):430–437. doi:10.1093/hmg/ddw396
9. Lu J, He J, Li M, et al. Predictive value of fasting glucose, postload glucose, and hemoglobin A1c on risk of diabetes and complications in Chinese adults. Diabetes Care. 2019;42(8):1539–1548. doi:10.2337/dc18-1390
10. Pulzi FB, Cisternas R, Melo MR, et al. New clinical score to diagnose nonalcoholic steatohepatitis in obese patients. Diabetol Metab Syndr. 2011;3(1):3. doi:10.1186/1758-5996-3-3
11. Angulo P, Hui JM, Marchesini G, et al. The NAFLD fibrosis score: a noninvasive system that identifies liver fibrosis in patients with NAFLD. Hepatology. 2007;45(4):846–854. doi:10.1002/hep.21496
12. Bedogni G, Bellentani S, Miglioli L, et al. The Fatty Liver Index: a simple and accurate predictor of hepatic steatosis in the general population. BMC Gastroenterol. 2006;6:33. doi:10.1186/1471-230X-6-33
13. Ekberg K, Landau BR, Wajngot A, et al. Contributions by kidney and liver to glucose production in the postabsorptive state and after 60 h of fasting. Diabetes. 1999;48(2):292–298. doi:10.2337/diabetes.48.2.292
14. Moore MC, Coate KC, Winnick JJ, et al. Regulation of hepatic glucose uptake and storage in vivo. Adv Nutr. 2012;3(3):286–294. doi:10.3945/an.112.002089
15. De Silva NMG, Borges MC, Hingorani AD, et al. Liver function and risk of type 2 diabetes: bidirectional Mendelian randomization study. Diabetes. 2019;68(8):1681–1691. doi:10.2337/db18-1048
16. Lee YS, Cho Y, Burgess S, et al. Serum gamma-glutamyl transferase and risk of type 2 diabetes in the general Korean population: a Mendelian randomization study. Hum Mol Genet. 2016;25(17):3877–3886. doi:10.1093/hmg/ddw226
17. Noordam R, Smit RA, Postmus I, et al. Assessment of causality between serum gamma-glutamyltransferase and type 2 diabetes mellitus using publicly available data: a Mendelian randomization study. Int J Epidemiol. 2016;45(6):1953–1960. doi:10.1093/ije/dyw306
18. Liu J, Au Yeung SL, Lin SL, et al. Liver enzymes and risk of ischemic heart disease and type 2 diabetes mellitus: a Mendelian randomization study. Sci Rep. 2016;6:38813. doi:10.1038/srep38813
19. Ballestri S, Zona S, Targher G, et al. Nonalcoholic fatty liver disease is associated with an almost twofold increased risk of incident type 2 diabetes and metabolic syndrome. Evidence from a systematic review and meta-analysis. J Gastroenterol Hepatol. 2016;31(5):936–944. doi:10.1111/jgh.13264
20. Karp DR, Shimooku K, Lipsky PE. Expression of γ-glutamyl transpeptidase protects ramos B cells from oxidation-induced cell death. J Biol Chem. 2001;276(6):3798–3804. doi:10.1074/jbc.M008484200
21. André P, Balkau B, Born C, et al. Hepatic markers and development of type 2 diabetes in middle aged men and women: a three-year follow-up study. the D.E.S.I.R. study (data from an epidemiological study on the insulin resistance syndrome). Diabetes Metab. 2005;31(6):542–550. doi:10.1016/S1262-3636(07)70229-X
22. Muriach M, Flores-Bellver M, Romero FJ, et al. Diabetes and the brain: oxidative stress, inflammation, and autophagy. Oxid Med Cell Longev. 2014;2014:102158. doi:10.1155/2014/102158
23. Drozdz R, Parmentier C, Hachad H, et al. γ-glutamyltransferase dependent generation of reactive oxygen species from a glutathione/transferrin system. Free Radic Biol Med. 1998;25(7):786–792. doi:10.1016/S0891-5849(98)00127-0
24. Hanigan MH, Frierson HF. Immunohistochemical detection of gamma-glutamyl transpeptidase in normal human tissue. J Histochem Cytochem. 1996;44(10):1101–1108. doi:10.1177/44.10.8813074
25. Sharma U, Pal D, Prasad R. Alkaline phosphatase: an overview. Indian J Clin Biochem. 2014;29(3):269–278. doi:10.1007/s12291-013-0408-y
26. Lynes M, Narisawa S, Millán JL, et al. Interactions between CD36 and global intestinal alkaline phosphatase in mouse small intestine and effects of high-fat diet. Am J Physiol Regul Integr Comp Physiol. 2011;301(6):R1738–R1747. doi:10.1152/ajpregu.00235.2011
27. Eduard AS. Phosphatase high-throughput screening assay design and selection. In: Millán JL, editor. Phosphatase Modulators. Berlin: Springer; 2013:18–42.
28. Boura-Halfon S, Zick Y. Phosphorylation of IRS proteins, insulin action, and insulin resistance. Am J Physiol Endocrinol Metab. 2009;296(4):E581–E591. doi:10.1152/ajpendo.90437.2008
29. Oh SW, Han KH, Han SY. Associations between renal hyperfiltration and serum alkaline phosphatase. PLoS One. 2015;10(4):e0122921. doi:10.1371/journal.pone.0122921
 © 2022 The Author(s). This work is published and licensed by Dove Medical Press Limited. The
full terms of this license are available at https://www.dovepress.com/terms
and incorporate the Creative Commons Attribution
- Non Commercial (unported, 3.0) License.
By accessing the work you hereby accept the Terms. Non-commercial uses of the work are permitted
without any further permission from Dove Medical Press Limited, provided the work is properly
attributed. For permission for commercial use of this work, please see paragraphs 4.2 and 5 of our Terms.
© 2022 The Author(s). This work is published and licensed by Dove Medical Press Limited. The
full terms of this license are available at https://www.dovepress.com/terms
and incorporate the Creative Commons Attribution
- Non Commercial (unported, 3.0) License.
By accessing the work you hereby accept the Terms. Non-commercial uses of the work are permitted
without any further permission from Dove Medical Press Limited, provided the work is properly
attributed. For permission for commercial use of this work, please see paragraphs 4.2 and 5 of our Terms.