Back to Journals » Diabetes, Metabolic Syndrome and Obesity » Volume 15
Lipid Accumulation Product Index Predicts New-Onset Type 2 Diabetes Among Non-Obese Koreans: A 12-Year Longitudinal Study
Authors Yang SH, Yoon J ![]() , Lee YJ
, Lee YJ ![]() , Park B
, Park B ![]() , Jung DH
, Jung DH ![]()
Received 22 September 2022
Accepted for publication 27 November 2022
Published 30 November 2022 Volume 2022:15 Pages 3729—3737
DOI https://doi.org/10.2147/DMSO.S389889
Checked for plagiarism Yes
Review by Single anonymous peer review
Peer reviewer comments 2
Editor who approved publication: Professor Gian Paolo Fadini
Seung Ho Yang, Jihyun Yoon, Yong-Jae Lee, Byoungjin Park, Dong-Hyuk Jung
Department of Family Medicine, Yonsei University College of Medicine, Seoul, Republic of Korea
Correspondence: Dong-Hyuk Jung; Byoungjin Park, Department of Family Medicine, Yongin Severance Hospital, Yonsei University College of Medicine, 363 Dongbaekjukjeondae-ro, Giheung-gu, Yongin-si, Gyeonggi-do, 16995, Republic of Korea, Tel +82-31-5189-8762 ; +82 31 5189 8763, Fax +82-31-5189-8567, Email [email protected]; [email protected]
Purpose: The lipid accumulation product (LAP) has been a potential indicator of central lipid accumulation status. This study aimed to assess the longitudinal association between LAP index and incident type 2 diabetes among non-obese Korean adults using a large, community-based Korean cohort observed over 12 years.
Patients and Methods: This study included 4281 non-diabetic adults without generalized obesity and abdominal obesity and aged 40– 69 years from the Korean Genome and Epidemiology Study. The participants were divided into four groups according to LAP index quartiles, calculated as (waist circumference [cm] - 65) x (triglycerides [mmol/L]) in men and (waist circumference [cm] - 58) x (triglycerides [mmol/L]) in women. We prospectively assessed hazard ratios (HRs) with 95% confidential intervals (CIs) for incident type 2 diabetes using multivariate Cox proportional hazard regression models.
Results: Overall, 608 (14.2%) participants developed type 2 diabetes during the follow-up period. HRs for incident type 2 diabetes in the second, third, and fourth LAP quartile were 1.32 (95% CI: 0.97– 1.79), 1.51 (95% CI: 1.11– 2.06), and 2.14 (95% CI: 1.56– 2.94), respectively, after adjusting for age, sex, body mass index, smoking status, alcohol intake, physical activity, mean arterial blood pressure, family history of diabetes, and impaired glucose tolerance.
Conclusion: A high LAP index can be an additional indicator for new-onset T2DM among middle-aged and elderly non-obese Koreans.
Keywords: lipid accumulation product index, prospective cohort study, incident type 2 diabetes, Koreans
Introduction
Type 2 diabetes mellitus (T2DM), a chronic disease known for hyperglycemia and its complications, has been established as a global pandemic.1,2 With complications ranging from diabetic retinopathy to diabetic foot ulcers, identification of risk factors and early detection of T2DM is essential for its prevention.3,4 Evidence indicates that T2DM was mainly a result of obesity and subsequent insulin resistance.5,6 However, in East Asia, T2DM patients were often non-obese.7,8 Additionally, the prevalence of obesity among Korean women has decreased, while T2DM incidence has increased; thus, there is a need for a more comprehensive indicator to predict and manage T2DM risk factors among apparently healthy individuals.9–11
The lipid accumulation product (LAP) index has gained attention for reflecting metabolic alterations related to lipid accumulation status.12–14 LAP, a product of waist circumference (WC) and triglyceride, was derived to reflect an individual’s anthropometric and physiological status.15 Initially, it was measured to reflect the risk of cardiovascular disease in a general sense. However, it gained further attention due to its links to liver disease, chronic kidney disease, and insulin resistance conditions.16–19 Korean ethnicity, as compared to the general population, is considered to be lower in anthropomorphic statistics. According to the Korea National Health and Nutrition Examination Survey, the LAP index may represent insulin resistance and beta-cell function even in non-diabetic individuals.20 Also, The previous study on other Asian populations reported that the LAP index showed better predictive value for metabolic syndrome than body mass index (BMI) or waist circumference (WC).21
In this regard, this study aimed to provide insights regarding T2DM in non-obese individuals and a Korean-specific demographic. There are also well-known insulin resistance indicators, such as the the homeostasis model assessment of insulin resistance (HOMA-IR) or hyperinsulinemic-euglycemic clamp. Still, this study would provide additional benefits for a relatively non-obese East Asian through easily measurable indicators. We investigated the relationship between the LAP index and incident T2DM using a large, community-based Korean cohort observed over 12 years among middle-aged and elderly non-obese Koreans.
Materials and Methods
Study Population
This study was derived from the Korean Genome and Epidemiology Study (KoGES), a large prospective cohort study initiated by the Korea National Institute of Health to explore and characterize the epidemiological features of chronic diseases in Koreans. It consists of community-dwelling men and women aged 40–69 years at the baseline who lived in Ansan (urban area) or Ansung (rural area). This cohort study has been conducted biannually since the baseline survey in 2001–2002 up to 2013–2014. All participants voluntarily participated and provided informed consent before enrolment. During the baseline survey (2001–2002), 10,030 participants were recruited, consisting of 5012 Ansan residents and 5018 Ansung residents. Among 10,030 participants assessed at the baseline survey, we excluded 1344 (13.4%) participants who had previously been diagnosed with T2DM or met the diagnostic criteria for T2DM, according to the American Diabetes Association (ADA). Also, we excluded obese individuals, defined as BMI ≥ 25 kg/m2 and WC ≥ 90 cm in men or ≥ 85 cm in women,22 or current use of dyslipidemia medications (n=4405). After these exclusions, 4281 participants (1875 men and 2406 women) were selected during the baseline survey (Figure 1). The study protocol was approved by the Institutional Review Board of the Korea Centers for Disease Control and Prevention, and all study participants gave their written informed consent. The study was approved by the Institutional Review Board of Yongin Severance Hospital, Yonsei University College of Medicine (IRB number: 9–2020-0018).
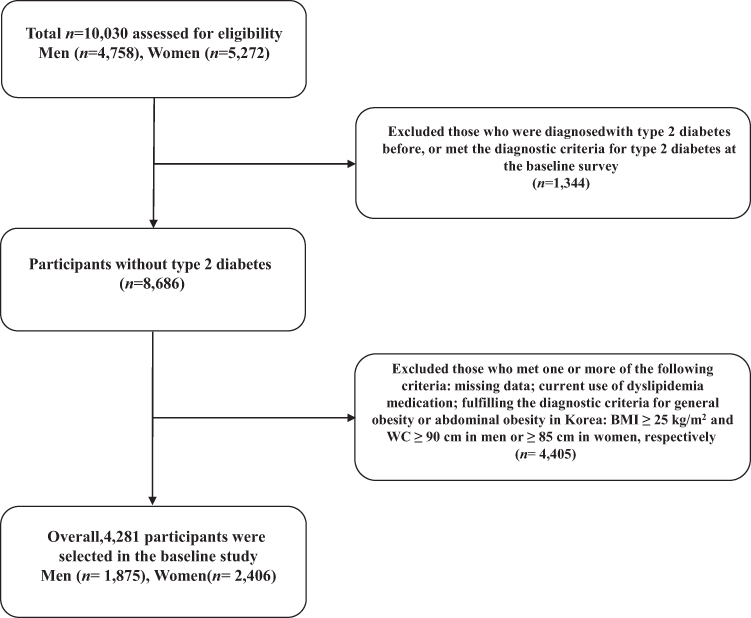 |
Figure 1 Flowchart for the selection of study participants. |
Study Design
The methodology of the KoGES (Ansung-Ansan) cohort study has been described in detail in previous studies.23 After fasting for at least 8 hours, the lipids profile and fasting plasma glucose were measured enzymatically using a 747 chemistry analyzer (Hitachi 7600 automatic analyzer; Hitachi Global, Tokyo, Japan). The C-reactive protein concentration was assessed with an immunoradiometric assay (ADVIA 1650; Bayer Diagnostics, Tarrytown, NY, USA). The level of glycosylated hemoglobin (HbA1c) was measured by high-performance liquid chromatography (VARIANT II; Bio-Rad Laboratories, Hercules, CA, USA). Plasma glucose levels were measured 2 hours after a meal into a 75 g oral glucose tolerance test (OGTT) biannually until 2013–2014. Newly developed T2DM was defined as a fasting plasma glucose level ≥ 126 mg/dL, 2-h postprandial plasma glucose level ≥ 200 mg/dL in the 75 g OGTT, HbA1c ≥ 6.5% according to the ADA criteria,24 or ongoing treatment with oral hypoglycemic medications or insulin therapy. Impaired fasting glucose was defined as a fasting plasma glucose level between 100 and 126 mg/dl and impaired glucose tolerance as a 2-hour postprandial plasma glucose level between 140 and 200 mg/dl. The LAP index was determined using the following formula: (WC [cm] - 65) x (triglycerides [mmol/L]) in men and (WC [cm] - 58) x (triglycerides [mmol/L]) in women. The LAP indexes were categorized into four quartiles, namely Q1: ≤ 12.7 (≤ 25th percentile), Q2: 12.8–20.1 (26 to 50th percentile), Q3: 20.2–31.6 (51 to 75th percentile), and Q4: ≥ 31.7 (≥ 76th percentile).
Statistical Analysis
According to the LAP index quartiles, the baseline characteristics of the study population were compared using Pearson’s chi-squared test for categorical variables and analysis of variance for continuous variables. Age- and sex-adjusted initial LAP index means and standard errors (SE) were calculated using analysis of covariance (ANCOVA) according to the incidence of diabetes. Furthermore, we assessed the cumulative incidence of T2DM using Kaplan–Meier curves with the Log rank test. After setting the lowest quartile as a reference group of the LAP index values, the hazard ratio (HR) and 95% confidence interval (CI) for incident T2DM were calculated using multivariate Cox proportional hazards regression models after adjusting for age, BMI, smoking status, alcohol intake, physical activity, mean arterial blood pressure, family history of diabetes, and impaired glucose tolerance. We also performed a sex-based subgroup analysis for incident T2DM similarly. Last, we performed pairwise comparisons of receiver-operating characteristic (ROC) curves and concordance (C) statistics to assess the ability of a risk factor to predict T2DM. All analyses were performed using SAS version 9.4 (SAS Institute Inc., Cary, NC, USA). All statistical tests were two-sided, and statistical significance was set at P < 0.05.
Results
The baseline characteristic of the study population (n = 4281; 1875 men and 2406 women), arranged by LAP index quartiles, is shown in Table 1. Mean age, BMI, and WC were 51.5 ± 8.9 years, 22.3 ± 1.8 kg/m2, and 77.0 ± 6.1 cm, respectively. Lipid markers data consisted as follows: mean total cholesterol, 4.8 ± 0.9 mmol/L; triglyceride, 1.5 ± 0.9 mmol/L; high-density lipoprotein (HDL)-cholesterol, 1.2 ± 0.3 mmol/L. Mean values of BMI, WC, and blood pressure were the highest in the highest quartile of the LAP index. Glucose impairment indices including fasting plasma glucose, 2-h postprandial plasma glucose, and HbA1c were also the highest in the fourth quartile. There were no significant differences within the areas of regular exercise, family history of diabetes, and fasting glucose impairment percent. However, the prevalence of impaired glucose tolerance was the highest (21.1%) in the fourth LAP quartile.
 |
Table 1 Baseline Characteristics of the Study Population According to Lipid Accumulation Product Quartiles |
Table 2 shows the incidence of T2DM during the follow-up study from 2001 to 2014. Biannual incidences are shown with a total of 4281 individuals. A total of 608 (14.2%, 608/4281) individuals were diagnosed with T2DM during the 12-year study period. Incidence rates within 2 years were in the range of 2.2–3.5%. With reference to Figure 2, higher quartiles of the LAP index showed increasing cumulative incidences of T2DM over the 12 years of study from the baseline survey (Log rank test, P < 0.001). Figure 3 shows that age- and sex-adjusted initial LAP index means were significantly higher in the diabetes group compared to the non-diabetes group (32.4 ± 0.8 cm x mmol/l vs 24.2 ± 0.83 cm x mmol/l, P < 0.001).
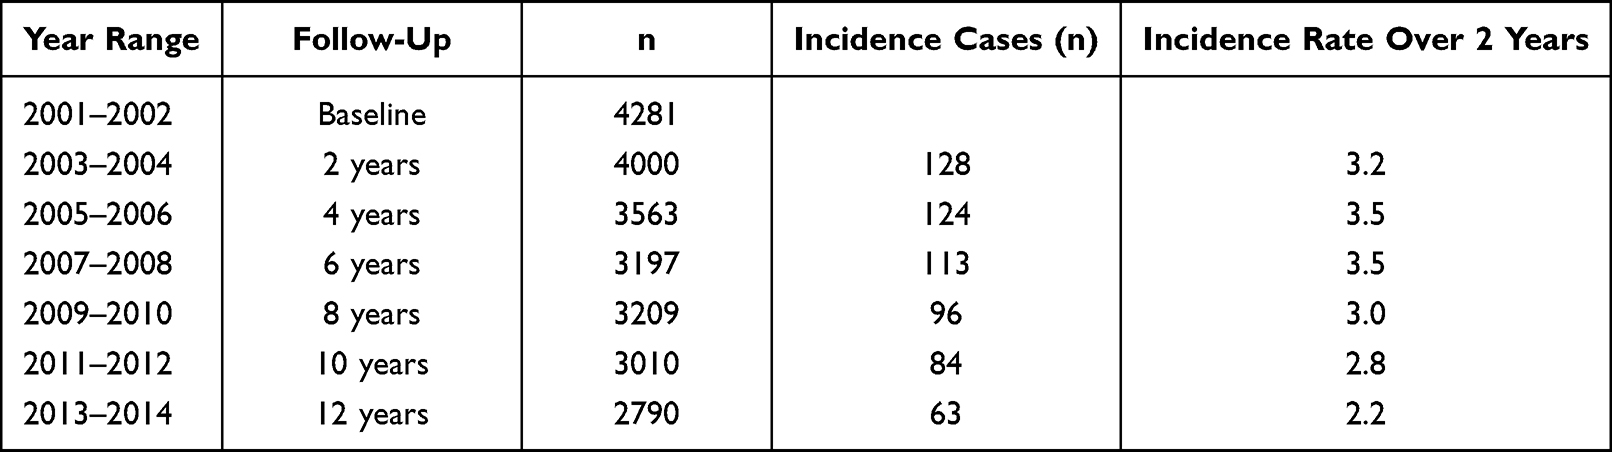 |
Table 2 Incidence of Type 2 Diabetes During the Follow-Up Study |
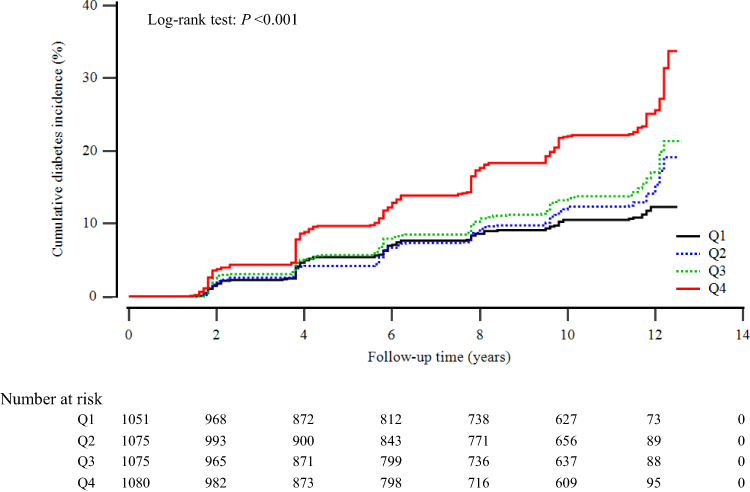 |
Figure 2 Kaplan–Meier plots indicating the cumulative probability of being diagnosed with diabetes after the baseline survey. |
 |
Figure 3 Age- and sex-adjusted LAP index at baseline according to the incidence of diabetes. |
Multivariate Cox proportional hazards regression analysis was also performed for the prediction of T2DM according to LAP index quartiles as shown in Table 3. The incidence rate per 1000 person-years increased proportionally with increasing LAP index quartiles (Q1: 10.5, Q2: 12.6, Q3: 14.7, and Q4: 23.8 per 1000 person-years). With the first quartile as a baseline reference, the HR increased in a dose-response manner for the subsequent quartiles. The HR, adjusted for age, sex, BMI, smoking status, alcohol intake, and physical activity was calculated to be 1.32 (95% CI: 0.97–1.79), 1.59 (95% CI: 1.16–2.17), and 2.43 (95% CI: 1.78–3.33) for Q2, Q3, and Q4, respectively. Similarly, these dose-responsive associations were found after additional adjustment for mean arterial blood pressure, family history of diabetes, and impaired glucose tolerance. The HRs of incident T2DM were 1.32 (95% CI: 0.97–1.79) for Q2, 1.51 (95% CI: 1.11–2.06) for Q3, and 2.14 (95% CI: 1.56–2.94) for Q4. Sex-based subgroup analysis revealed that the HRs of incident T2DM for the fourth quartile tend to be similar in men and women [HR (95% CI) = 2.20 [1.46–3.32] and 2.26 [1.34–3.82], respectively) (Model 3, Table 4). Furthermore, using a pairwise comparison of ROC analyses of new-onset T2DM, the C-index of LAP index data was significantly higher than that of BMI, WC, and HOMA-IR (P < 0.001, P = 0.016, and P = 0.001, respectively) (Table 5).
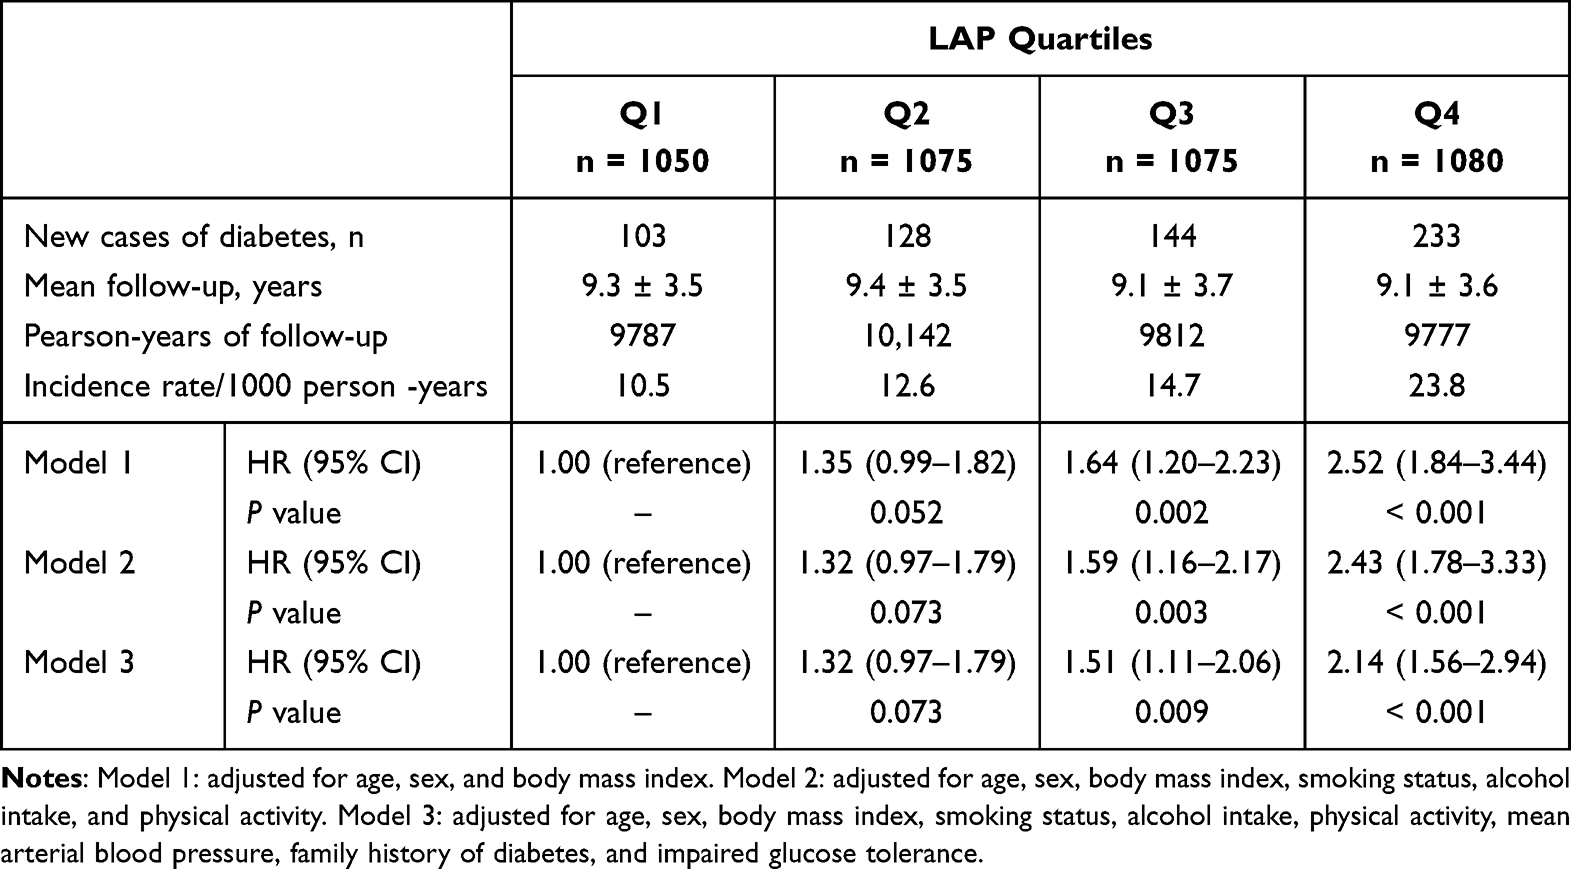 |
Table 3 Hazard Ratios and 95% Confidence Intervals for Incident Type 2 Diabetes According to LAP Quartiles |
 |
Table 4 Sex-Based Subgroup Analysis for Incident Type 2 Diabetes According to LAP Quartiles |
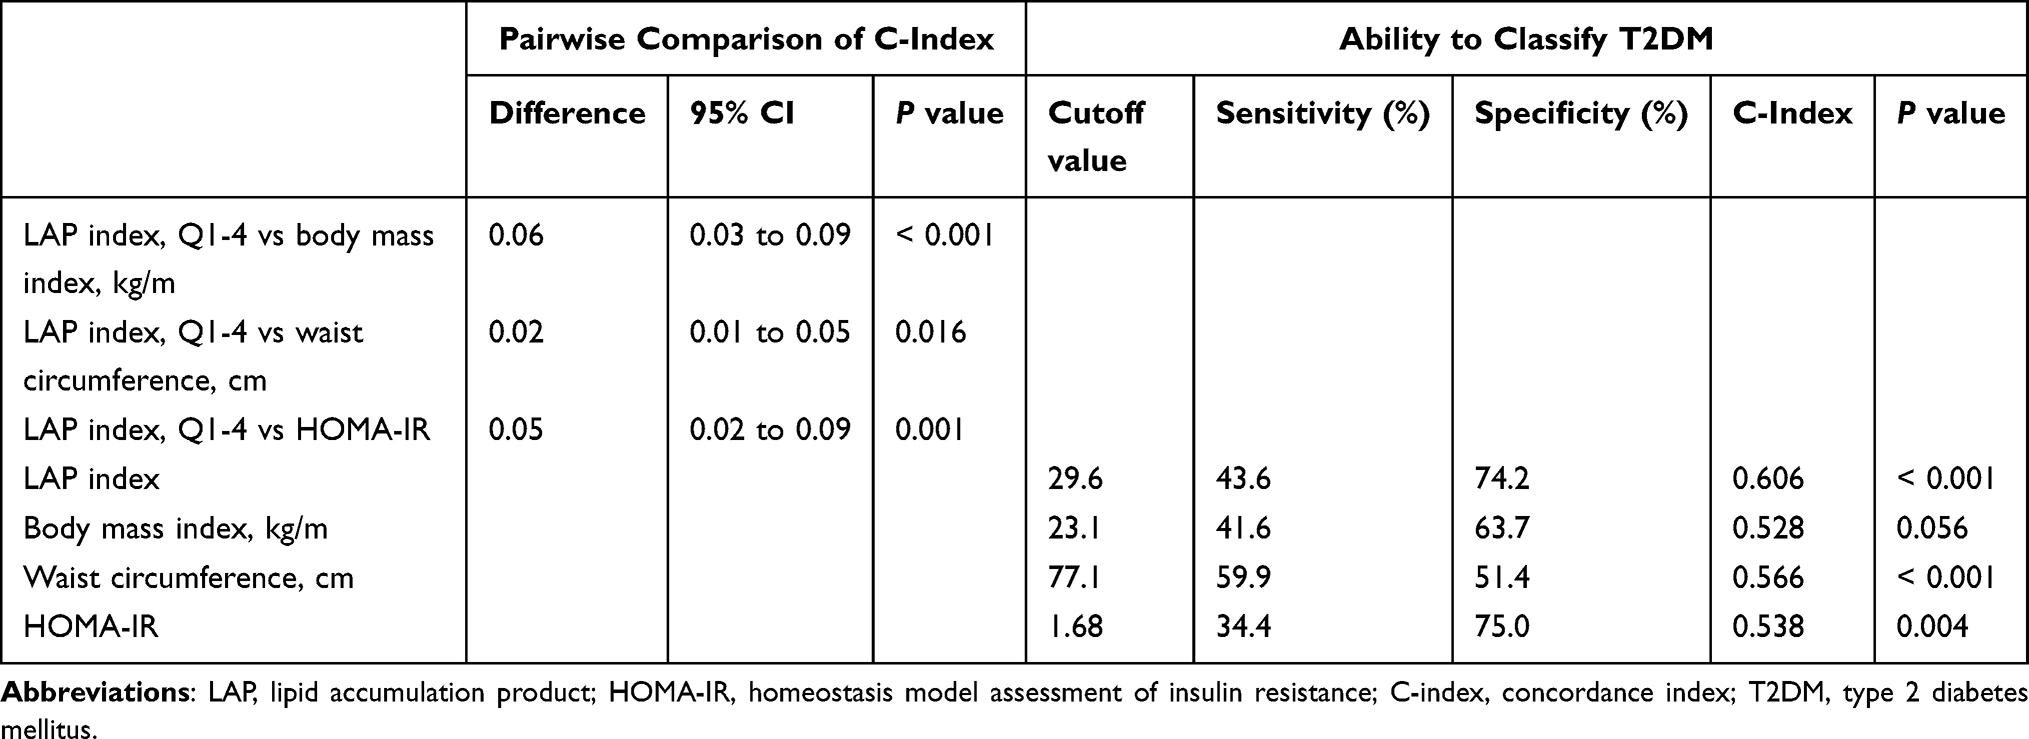 |
Table 5 LAP Index versus body Mass Index, Waist circumference and HOMA-IR for predicting type 2 Diabetes |
Discussion
We found that a higher LAP index is positively and independently associated with T2DM after adjusting for known confounding variables within the large-scale 12-year follow-up data. The fourth quartile showed the highest 2-h postprandial plasma glucose, adequately exemplifying a higher risk of T2DM in patients with a higher LAP as well as increased HbA1c levels within the normal range. Social history markers, including smoking, drinking, and exercise percentage were the lowest in the fourth quartile. Although less exercise correlates to a higher lipid profile,25 alcohol and smoking history was the lowest, despite studies showing a higher triglyceride level with greater alcohol and smoking history.26,27 This could be because most of the individuals in the population group recognized the need for lifestyle changes and thus, represented as current non-smokers and non-drinkers; however, specific data regarding the length of discontinuation would be required to verify such results.
The results for family history of diabetes were not significant, indicating a weak association of T2DM with LAP. It has been proven that a family history of diabetes is an independent risk factor for diabetes.28 With this study, a high LAP index could be considered an independent risk factor for the incidence of T2DM.
Some plausible mechanisms deserve consideration for the observed association, reflecting the collective effect of the components of the LAP index. First, pathophysiology of T2DM has been characterized by decreased insulin secretion by pancreatic β-cells and the inability of tissue to respond to insulin.29 Studies have shown a high correlation of T2DM with obesity, especially visceral fat.30,31 WC or BMI has been the classic index for visceral fat, accounting for the factor of obesity in patients, but WC is difficult to distinguish between visceral fat and subcutaneous fat, and BMI has limitations in viewing body composition.32,33 As the number of non-obese T2DM patients increased, studies have aimed to find a more comprehensive index for predicting T2DM.23,34 Further studies have shown that the LAP index was an effective tool in predicting T2DM incidence, with the capacity to include visceral fat as well as subcutaneous fat.12,19 Second, although there are several mechanisms proposed to explain high triglyceride levels in diabetes, one specifically addresses muscle-related insulin resistance. As triglyceride levels increase in the blood, insulin activity in muscles is seen to be inhibited, not to mention a significant decrease in β-cells functions.35 With more triglyceride levels accumulating within the muscles, the resulting myosteatosis leads to the production of inflammatory cytokines and muscle catabolism.36,37 This correlates well to studies on non-obese diabetic patients and the relationship to a lower muscle mass.38 In addition, triglyceride levels in the blood are significant independent risk factors for glucose tolerance disorders and diabetes when they are in a high range or increase within the normal range.39 WC and serum triglycerides can be evaluated together to be a meaningful indicator of early identification and management of diabetes risk even in Asians, with seemingly low metabolic risks.
The major strength of this study is that the study was conducted using 12-year data. A subsequent 12-year prospective cohort study using such a community-based large sample population of middle-aged Korean individuals was performed. Limitations, however, arise from the data set, as the population is rather limited to be generalized to a worldwide population. The LAP formula is based on the US National Health and Nutrition Examination Survey.15 Also, although dietary habits could be essential for T2DM, they were not fully adjusted for in the statistical model, causing a possible residual confounding effect. Thus, ethnic differences, including lifestyle factors, limit the study to a more East Asian reference. Additional limitation includes a potential selection bias, as data were collected from volunteers, leaving grounds for the population to be a more health-seeking population. Lastly, the patient medication history was not considered. Medications that affect muscle metabolism and inflammatory reactions have the potential to change catabolism, thus affecting factors related to diabetes. Further studies considering a complete history taking of medication as well as dietary supplements are warranted.
In full consideration of the strengths and weaknesses of the study, however, important implications of a high LAP resulting in T2DM incident are highlighted, deeming it a necessary factor for preventing diabetes in healthy adults.
Conclusion
In conclusion, a high LAP index can indicate a possible incidence of T2DM among middle-aged and elderly non-obese Koreans.
Acknowledgments
The authors would like to express their heartfelt gratitude to the participants and survey staff of the Korean Genome and Epidemiology Study (KoGES) for contributing to the present study.
Disclosure
The authors report no conflicts of interest in this work.
References
1. Unnikrishnan R, Pradeepa R, Joshi SR, Mohan V. Type 2 diabetes: demystifying the global epidemic. Diabetes. 2017;66(6):1432–1442. doi:10.2337/db16-0766
2. Saeedi P, Petersohn I, Salpea P, et al. Global and regional diabetes prevalence estimates for 2019 and projections for 2030 and 2045: results from the international diabetes federation diabetes atlas, 9(th) edition. Diabetes Res Clin Pract. 2019;157:107843. doi:10.1016/j.diabres.2019.107843
3. Lechner J, O’Leary OE, Stitt AW. The pathology associated with diabetic retinopathy. Vision Res. 2017;139:7–14. doi:10.1016/j.visres.2017.04.003
4. Reardon R, Simring D, Kim B, Mortensen J, Williams D, Leslie A. The diabetic foot ulcer. Aust J Gen Pract. 2020;49(5):250–255. doi:10.31128/ajgp-11-19-5161
5. Knowler WC, Pettitt DJ, Saad MF, Bennett PH. Diabetes mellitus in the Pima Indians: incidence, risk factors and pathogenesis. Diabetes Metab Rev. 1990;6(1):1–27. doi:10.1002/dmr.5610060101
6. Yazıcı D, Sezer H. Insulin resistance, obesity and lipotoxicity. Adv Exp Med Biol. 2017;960:277–304. doi:10.1007/978-3-319-48382-5_12
7. Nanditha A, Ma RC, Ramachandran A, et al. Diabetes in Asia and the pacific: implications for the global epidemic. Diabetes Care. 2016;39(3):472–485. doi:10.2337/dc15-1536
8. Chan JC, Malik V, Jia W, et al. Diabetes in Asia: epidemiology, risk factors, and pathophysiology. JAMA. 2009;301(20):2129–2140. doi:10.1001/jama.2009.726
9. Kang HT, Shim JY, Lee HR, Park BJ, Linton JA, Lee YJ. Trends in prevalence of overweight and obesity in Korean adults, 1998–2009: the Korean national health and nutrition examination survey. J Epidemiol. 2014;24(2):109–116. doi:10.2188/jea.je20130017
10. Kim S, Subramanian SV, Oh J, Razak F. Trends in the distribution of body mass index and waist circumference among South Korean adults, 1998–2014. Eur J Clin Nutr. 2018;72(2):198–206. doi:10.1038/s41430-017-0024-7
11. Cai XT, Ji LW, Liu SS, Wang MR, Heizhati M, Li NF. Derivation and validation of a prediction model for predicting the 5-year incidence of type 2 diabetes in non-obese adults: a population-based cohort study. Diabetes Metab Syndr Obes. 2021;14:2087–2101. doi:10.2147/dmso.S304994
12. Ayundini G, Astrella C, Tahapary D, Soewondo P. A systematic review on the association between lipid accumulation product index and type 2 diabetes mellitus. J ASEAN Fed Endocr Soc. 2019;34(1):16–20. doi:10.15605/jafes.034.01.04
13. Oh JY, Sung YA, Lee HJ. The lipid accumulation product as a useful index for identifying abnormal glucose regulation in young Korean women. Diabet Med. 2013;30(4):436–442. doi:10.1111/dme.12052
14. Ahn N, Baumeister SE, Amann U, et al. Visceral adiposity index (VAI), lipid accumulation product (LAP), and product of triglycerides and glucose (TyG) to discriminate prediabetes and diabetes. Sci Rep. 2019;9(1):9693. doi:10.1038/s41598-019-46187-8
15. Kahn HS. The “lipid accumulation product” performs better than the body mass index for recognizing cardiovascular risk: a population-based comparison. BMC Cardiovasc Disord. 2005;5:26. doi:10.1186/1471-2261-5-26
16. Yan P, Xu Y, Miao Y, et al. Association of lipid accumulation product with chronic kidney disease in Chinese community adults: a report from the REACTION study. Lipids Health Dis. 2021;20(1):131. doi:10.1186/s12944-021-01569-8
17. Özcabı B, Demirhan S, Akyol M, Öztürkmen Akay H, Güven A. Lipid accumulation product is a predictor of nonalcoholic fatty liver disease in childhood obesity. Korean J Pediatr. 2019;62(12):450–455. doi:10.3345/kjp.2019.00248
18. Motamed N, Razmjou S, Hemmasit G, Maadi M, Zamani F. Lipid accumulation product and metabolic syndrome: a population-based study in northern Iran, Amol. J Endocrinol Invest. 2016;39(4):375–382. doi:10.1007/s40618-015-0369-5
19. Xia C, Li R, Zhang S, et al. Lipid accumulation product is a powerful index for recognizing insulin resistance in non-diabetic individuals. Eur J Clin Nutr. 2012;66(9):1035–1038. doi:10.1038/ejcn.2012.83
20. Cho HE, Yang SB, Gi MY, Cha JA, Park SY, Yoon H. The relationship between the lipid accumulation product and beta-cell function in Korean adults with or without type 2 diabetes mellitus: the 2015 Korea national health and nutrition examination survey. Endocr Res. 2022;47(2):80–88. doi:10.1080/07435800.2022.2053540
21. Ray L, Ravichandran K, Nanda SK. Comparison of lipid accumulation product index with body mass index and waist circumference as a predictor of metabolic syndrome in Indian population. Metab Syndr Relat Disord. 2018;16(5):240–245. doi:10.1089/met.2017.0119
22. Nam GE, Kim Y-H, Han K, et al. Obesity fact sheet in Korea, 2019: prevalence of obesity and abdominal obesity from 2009 to 2018 and social factors. J Obes Metab Syndr. 2020;29(2):124. doi:10.7570/jomes20058
23. Park B, Lee HS, Lee YJ. Triglyceride glucose (TyG) index as a predictor of incident type 2 diabetes among nonobese adults: a 12-year longitudinal study of the Korean Genome and Epidemiology Study cohort. Transl Res. 2021;228:42–51. doi:10.1016/j.trsl.2020.08.003
24. American Diabetes Association. Classification and diagnosis of diabetes: standards of medical care in diabetes-2021. Diabetes Care. 2021;44(Suppl1):S15–s33. doi:10.2337/dc21-S002
25. Wang Y, Xu D. Effects of aerobic exercise on lipids and lipoproteins. Lipids Health Dis. 2017;16(1):132. doi:10.1186/s12944-017-0515-5
26. Koda M, Kitamura I, Okura T, Otsuka R, Ando F, Shimokata H. The associations between smoking habits and serum triglyceride or hemoglobin A1c levels differ according to visceral fat accumulation. J Epidemiol. 2016;26(4):208–215. doi:10.2188/jea.JE20150086
27. Klop B, Do Rego AT, Cabezas MC. Alcohol and plasma triglycerides. Curr Opin Lipidol. 2013;24(4):321–326. doi:10.1097/MOL.0b013e3283606845
28. Scott RA, Langenberg C, Sharp SJ, et al. The link between family history and risk of type 2 diabetes is not explained by anthropometric, lifestyle or genetic risk factors: the EPIC-InterAct study. Diabetologia. 2013;56(1):60–69. doi:10.1007/s00125-012-2715-x
29. Galicia-Garcia U, Benito-Vicente A, Jebari S, et al. Pathophysiology of type 2 diabetes mellitus. Int J Mol Sci. 2020;21:17. doi:10.3390/ijms21176275
30. Kriketos AD, Furler SM, Gan SK, Poynten AM, Chisholm DJ, Campbell LV. Multiple indexes of lipid availability are independently related to whole body insulin action in healthy humans. J Clin Endocrinol Metab. 2003;88(2):793–798. doi:10.1210/jc.2002-020848
31. Yang X, Lin Y, Xu GD, et al. optimal cut-off values of visceral fat area for predicting metabolic syndrome among type 2 diabetes patients in Ningbo, China. Diabetes Metab Syndr Obes. 2021;14:1375–1383. doi:10.2147/dmso.S304164
32. Tian T, Pei H, Chen Z, et al. Comparison of lipid accumulation product and body mass index as indicators of diabetes diagnosis among 215,651 Chinese adults. PeerJ. 2020;8:e8483. doi:10.7717/peerj.8483
33. Zhang X, Yan W, Wang B, Wang L, Mu Y, Wang S. Association between some different obesity anthropometric indices and type 2 diabetes mellitus in middle-aged and elderly Chinese men and Women in Beijing, China: a cross-sectional study. Diabetes Metab Syndr Obes. 2022;15:1799–1807. doi:10.2147/dmso.S359657
34. Xie X, Bai G, Liu H, et al. Early predictors in the onset of type 2 diabetes at different fasting blood glucose levels. Diabetes Metab Syndr Obes. 2021;14:1485–1492. doi:10.2147/dmso.S301352
35. Unger RH. Lipotoxicity in the pathogenesis of obesity-dependent NIDDM. Genetic and clinical implications. Diabetes. 1995;44(8):863–870. doi:10.2337/diab.44.8.863
36. Ha K, Kim K, Chun OK, Joung H, Song Y. Differential association of dietary carbohydrate intake with metabolic syndrome in the US and Korean adults: data from the 2007–2012 NHANES and KNHANES. Eur J Clin Nutr. 2018;72(6):848–860. doi:10.1038/s41430-017-0031-8
37. Armani A, Berry A, Cirulli F, Caprio M. Molecular mechanisms underlying metabolic syndrome: the expanding role of the adipocyte. FASEB j. 2017;31(10):4240–4255. doi:10.1096/fj.201601125RRR
38. Sugimoto K, Tabara Y, Ikegami H, et al. Hyperglycemia in non-obese patients with type 2 diabetes is associated with low muscle mass: the multicenter study for clarifying evidence for sarcopenia in patients with diabetes mellitus. J Diabetes Investig. 2019;10(6):1471–1479. doi:10.1111/jdi.13070
39. Riediger ND, Clark K, Lukianchuk V, Roulette J, Bruce S. Fasting triglycerides as a predictor of incident diabetes, insulin resistance and β-cell function in a Canadian First Nation. Int J Circumpolar Health. 2017;76(1):1310444. doi:10.1080/22423982.2017.1310444
 © 2022 The Author(s). This work is published and licensed by Dove Medical Press Limited. The
full terms of this license are available at https://www.dovepress.com/terms
and incorporate the Creative Commons Attribution
- Non Commercial (unported, 3.0) License.
By accessing the work you hereby accept the Terms. Non-commercial uses of the work are permitted
without any further permission from Dove Medical Press Limited, provided the work is properly
attributed. For permission for commercial use of this work, please see paragraphs 4.2 and 5 of our Terms.
© 2022 The Author(s). This work is published and licensed by Dove Medical Press Limited. The
full terms of this license are available at https://www.dovepress.com/terms
and incorporate the Creative Commons Attribution
- Non Commercial (unported, 3.0) License.
By accessing the work you hereby accept the Terms. Non-commercial uses of the work are permitted
without any further permission from Dove Medical Press Limited, provided the work is properly
attributed. For permission for commercial use of this work, please see paragraphs 4.2 and 5 of our Terms.