Back to Journals » Cancer Management and Research » Volume 11
Lipase member H is a downstream molecular target of hypoxia inducible factor-1α and promotes papillary thyroid carcinoma cell migration in BCPAP and KTC-1 cell lines
Authors Li Y, Zhou X, Zhang Q, Chen E, Sun Y, Ye D, Wang O, Zhang X, Lyu J
Received 12 August 2018
Accepted for publication 26 December 2018
Published 22 January 2019 Volume 2019:11 Pages 931—941
DOI https://doi.org/10.2147/CMAR.S183355
Checked for plagiarism Yes
Review by Single anonymous peer review
Peer reviewer comments 2
Editor who approved publication: Dr Antonella D'Anneo
Yuefeng Li,1,2,* Xiaofen Zhou,2,* Qiongying Zhang,3 Endong Chen,2 Yihan Sun,2 Danrong Ye,2 Ouchen Wang,2 Xiaohua Zhang,2 Jianxin Lyu1
1Key Laboratory of Laboratory Medicine, Ministry of Education, Zhejiang Provincial Key Laboratory of Medical Genetics, College of Laboratory Medicine and Life Sciences, Wenzhou Medical University, Wenzhou, Zhejiang, China; 2Department of Thyroid and Breast Surgery, The First Affiliated Hospital of Wenzhou Medical University, Wenzhou, Zhejiang, China; 3Pathology Department, The First Affiliated Hospital of Wenzhou Medical University, Wenzhou, China
*These authors contributed equally to this work
Background: Papillary thyroid carcinoma (PTC) is the most common type of thyroid carcinoma, which is associated with a high incidence of lymph-node metastasis. Multiple biomarkers have been identified for the precise diagnosis of PTC at an early stage. However, their role in PTC remains poorly elucidated. Previously, we reported that lipase H (LIPH), a membrane-bound protein, was highly expressed in PTC. This study aimed to fully elucidate the causal role of LIPH in the development of PTC and investigated its relationship with lymph-node metastasis in PTC.
Materials and methods: Quantitative reverse transcription PCR and immunohistochemistry were used to measure the mRNA and protein expression levels of LIPH in 45 and 6 pairs of PTC tissues and adjacent normal tissues, respectively. Clinical tissue data of 504 PTC tissues and 60 normal thyroid tissues from The Cancer Genome Atlas database were used to analyze the correlation between LIPH expression level and clinical features in PTC. siRNAs were used to knock down genes, while plasmids were used to overexpress genes. Two PTC cell lines (KTC-1 and BCPAP) were used in subsequent cytological function studies. In addition, a hypoxia stress model was constructed using cobaltous chloride hexahydrate reagent, and the protein expression level of the corresponding biomarkers was measured by Western blotting.
Results: This study revealed that high expression of LIPH in PTC was closely associated with lymph-node metastasis. Our cellular function experiments indicated that LIPH positively correlated with the malignant behavior of PTC cell lines. We further confirmed the role of LIPH in hypoxia and its relationship with the epithelial–mesenchymal transition pathway in PTC.
Conclusion: LIPH plays an important role in PTC oncogenesis and development, especially in lymph-node metastasis. It can be regarded as a biomarker for the diagnosis and treatment of PTC in the near future.
Keywords: papillary thyroid carcinoma, hypoxia, metastasis, epithelial–mesenchymal transition
Introduction
A rapid increase in the incidence of thyroid carcinoma (TC), a common endocrine malignancy, has occurred worldwide in the past few decades.1 In the USA, ~56,870 cases of TC were newly diagnosed in 2017, and ~3.5% of these patients died from the disease.2 Papillary thyroid carcinoma (PTC), a differentiated thyroid cancer, is the most common type, accounting for 85–90% of all TC types.3,4 However, PTC is regarded as an inert tumor and has an overall survival rate of 90% in the population under the age of 45 years.5 A study on the quality of life of patients with TC revealed no significant difference in quality of life between survivors of other cancers and survivors of PTC.6 Thus, methods for the early diagnosis and standardized treatment of PTC still require improvement.
LIPH, also called mPA-PLA1, is a gene that encodes a membrane-bound protease that can catalyze the production of lysophosphatidic acid (LPA).7 In addition, LPA participates in various cellular processes such as proliferation, survival, migration, invasion, and angiogenesis in multiple cancer cells.8 Previous studies on LIPH focused on its mutation and how it related to hypotrichosis.9,10 However, oncology studies on LIPH have assessed its involvement in only three cancers: breast cancer, lung cancer, and esophageal adenocarcinomas.11–13
Previously, we reported that LIPH is one of the distinct differential genes between PTC and normal tissue, using whole-transcriptome sequencing of 19 paired PTC tissues.14 In this study, we used a quantitative reverse transcription PCR (qRT-PCR) assay to measure the relative expression levels of LIPH in 45 pairs of tumor samples and matched non-cancerous thyroid tissues. We also verified the differentiation and the expression levels of our target gene. We then further validated the expression level of LIPH in some PTC cell lines and used cell-line experiments to explore the function of LIPH in PTC.
Because of the lack of in-depth studies on LIPH in cancer, we aimed to determine the effect of LIPH on the malignant behavior of PTC and the connection between the molecular characteristics of this gene and the clinical diagnosis of PTC. Furthermore, we also aimed to explore the potential mechanism of the relevant functions of LIPH.
Materials and methods
Tissue specimens
Our study strictly follows the Declaration of Helsinki and was implemented with the approval of the Ethics Committee of the First Affiliated Hospital of Wenzhou Medical University. Each clinical sample was obtained after the corresponding patient had signed the informed consent form. In total, 45 PTC tissues and their matched adjacent normal thyroid tissues were obtained during the patients’ initial surgery in the First Affiliated Hospital of Wenzhou Medical University. The sample quality-control principles are as follows: the patient needed to have a surgical indication and without surgical contraindications; the result of the rigorous pathological diagnosis was PTC or normal thyroid tissue; the patient did not have any other concomitant malignant tumors and had not received any treatment before surgery; the sample needed to have sufficient content of cancer cells, and the conclusion of the pathological diagnosis should have been repeatedly confirmed by two experimental pathologists. Specimens were frozen in liquid nitrogen immediately after surgery, and then transferred to storage in a refrigerator at –80°C for the next experiments. The LIPH expression values and their corresponding clinicopathological features in PTC were downloaded from The Cancer Genome Atlas (TCGA) database (which contains data on 504 PTC tissues and 60 normal thyroid tissues) for further analysis.
Cell cultures
The Htori-3 and BCPAP cell lines were obtained from Professor Mingzhao Xing of the Johns Hopkins University School of Medicine (Baltimore, MD, USA), and were approved for use in experimental research by the Ethics Committee of the First Affiliated Hospital of Wenzhou Medical University. The cells were incubated in Roswell Park Memorial Institute (RPMI) 1640 medium (Thermo Fisher Scientific, Waltham, MA, USA) supplemented with 10% FBS (Gibco, Carlsbad, CA, USA), 1% non-essential amino acids (11140050; Thermo Fisher Scientific), and 1% sodium pyruvate 100 mM solution (11360070; Thermo Fisher Scientific), and placed in an incubator with 5% CO2 at 37°C. The KTC-1 cell line was purchased from Shanghai Institutes for Biological Sciences, Chinese Academy of Sciences Cell Resource Center. The required culture medium for KTC-1 is based on the medium described above plus 1% GlutaMAX (35050061; Thermo Fisher Scientific), and placed in an incubator with 5% CO2 at 37°C.
Hypoxia simulation assay
Cobalt(II) chloride hexahydrate (202185; Sigma-Aldrich Co., St Louis, MO, USA) was dissolved in double-distilled water to a concentration of 100 mmol/L, followed by dilution to 250 µmol/L and 200 µmol/L with serum-free medium; KTC-1 was incubated in 250 µmol/L and BCPAP was incubated in 200 µmol/L cobalt(II) chloride medium. The hypoxic cellular models of the two cell lines were constructed after incubation in 5% CO2 at 37°C for 8 hours. LW6 (S8441; Selleck Chemicals; Houston, Texas, USA), an inhibitor of hypoxia inducible factor-1α (HIF-1α), could effectively inhibit the accumulation of HIF-1α by degrading HIF-1α without affecting the corresponding mRNA levels. Western blotting results showed that HIF-1α was significantly downregulated at a concentration of 20 µmol/L cobalt(II) chloride hexahydrate.
qRT-PCR
Total RNA was isolated using TRIzol® reagent (Life Technologies, Carlsbad, CA, USA), and the ReverTra Ace® qPCR RT Master Mix (Toyobo, Osaka, Japan) was used in the reverse transcription of cDNA from 1,000 ng of total RNA. The qRT-PCR, using THUNDERBIRD® SYBR® qPCR Mix (Toyobo), was performed in a CFX96 Touch™ Real-Time PCR Detection System (Bio-Rad Laboratories Inc., Hercules, CA, USA). All reagents were used following the respective manufacturer’s recommendation. Primers were synthesized by Invitrogen Trading (Shanghai) Co. Ltd (Shanghai, China). The sequences of the primers were as follows: glyceraldehyde-3-phosphate dehydrogenase (GAPDH): 5′-ATGGGTGTGAACCATGAGAA-3′ (forward) and 5′-GTGCTAAGCAGTTGGTGGTG-3′ (reverse); LIPH: 5′-CTGATGCTCTACACAAGGA-3′ (forward) and 5′-ATGGACAATGAAGGTGGTT-3′ (reverse). These experiments were repeated at least three times.
Immunohistochemistry
Similar to the tissues used in qRT-PCR experiments, six paired PTC tissue samples were embedded in paraffin. Paraffin-embedded sections were deparaffinized by xylene and rehydrated by using graded alcohol solutions, followed by incubation in 3% hydrogen peroxide for 10 minutes at 37°C. After washing in PBS and antigen retrieval, 5% BSA (A8010; Solarbio, Beijing, China) was used to block antigen for 30 minutes at 37°C. Tissue specimens were incubated with rabbit anti-human anti-LIPH antibody (1:1,000; ab192615; Abcam, Cambridge, UK) at 4°C overnight. After washing in PBS, biotin-conjugated AffiniPure goat anti-rabbit IgG(H+L) (SA00004-2; Proteintech Group, Rosemount, UL) was used for incubation for 1 hour at 37°C. Finally, DAB (1B000125; OriGene, Rockville, MD, USA) was used to perform the chromogenic reaction and then hematoxylin was used to counterstain the sections for 3 minutes. Subsequently, light microscopy was used to evaluate the protein expression level of LIPH.
Transfection
Two sequences of LIPH siRNA and their negative control were designed and manufactured by Shanghai GenePharma Co. (Shanghai, China). To knock down the expression of LIPH, cells were incubated for ~8 hours with Lipofectamine® RNAiMAX transfection reagent (Thermo Fisher Scientific), mixed with two siRNA oligonucleotides or corresponding negative control. Escherichia coli strains, loaded with LIPH overexpression plasmid or the control plasmid, were obtained from Shanghai Genechem Co. (Shanghai, China). Plasmids were amplified using an endotoxin-free plasmid kit (TIANGEN Biotech (Beijing) Co. Ltd, Beijing, China) following the manufacturer’s protocol. To overexpress LIPH, KTC-1 cells were incubated for ~6 hours with Lipofectamine 3000 transfection reagent (Thermo Fisher Scientific) mixed with two siRNA oligonucleotides or corresponding negative control. After transfection, all species were incubated in 5% CO2 at 37°C for 24 hours. Subsequent experiments were performed only after confirmation of either knockdown or overexpression of LIPH by qRT-PCR assay.
Colon formation assay
Cells were transfected with siRNA or plasmid. Approximately 2,000 cells per well were incubated in six-well plates with normal growth medium for 1 week. Colonies were fixed with methanol for 30 minutes, stained with crystal violet assay for 30 minutes, and photographed. Colonies were counted randomly in five independent visual fields of the images. These experiments were repeated at least three times.
Cell Counting Kit-8 (CCK-8) assay
KTC-1 and BCPAP were incubated in 96-well plates at a seeding density of 1,000 cells per well and subsequently transfected with non-specific siRNA and the siRNA targeting LIPH gene for 8 hours (5 wells per sample). The overexpression cell-culture models were constructed similarly and washed with PBS (Gibco), followed by replacement of the media with normal growth media. After incubation for 24 hours, the original medium was replaced by 90 µL normal growth medium mixed with 10 µL CCK-8 (Beyotime, Heimen, China) in each well and incubated for 2 hours. The absorbance of each well was measured by a SpectraMax Plus 384 (Molecular Devices; Silicon Valley, CA, USA) at a wavelength of 450 nm. We recorded the data at 24, 48, 72, and 96 hours during the cell incubation period following transfection. These experiments were repeated at least three times.
Transwell migration assay
After being transfected with siRNA or plasmid, 30,000 cells were suspended in 200 µL complete medium. The uniform suspension was added to the upper chamber of the Transwell® plate (Corning Costar, Cambridge, MA, USA). Subsequently, the corresponding Transwell insert was placed in a well of a 24-well plate that was prefilled with 600 µL medium with twice the FBS concentration of the upper chamber. The grouping of the control group and the experimental group in this experiment was consistent with the grouping of the transfection experiments, colon formation assay and CCK-8 assay. The 24-well plates were incubated at 37°C and 5% CO2 in culture medium for ~24 hours. After wiping the cells on the upper surface of the filter membranes with medical cotton swabs, the Transwell chambers were fixed with methanol for 30 minutes and stained with crystal violet for 30 minutes. Stained cells were then photographed. Colonies were counted in five random independent visual fields of the images. These experiments were repeated at least three times.
Matrigel invasion assay
After being transfected with siRNA or plasmid, respectively, 60,000 cells were suspended in 300 µL complete medium. Uniform suspension was added to each upper chamber of the Matrigel Invasion Chamber 24 DI (Corning, Corning, NY, USA). At least 500 µL RPMI 1640 medium was added per chamber and incubated in the 37°C incubator for 2 hours before use. The subsequent steps were performed similar to the Transwell migration assay described in the previous subsection. These experiments were repeated at least three times.
Western blotting
Cells were disrupted by RIPA Lysis Buffer (Beyotime) and scraped off the plate surface with a cell scraper. Protein concentration was measured using an enhanced BCA Protein Assay Kit (Beyotime). SDS-PAGE (10%) gels were prepared using SDS-PAGE Gel Quick Preparation Kit (Beyotime). Equal amounts of protein by weight were loaded on the SDS-PAGE and electrophoresed at 80 V for 30 minutes followed by 120 V for 45 minutes. Subsequently, the proteins on the gel were transferred on to polyvinlyidene difluoride membranes (EMD Millipore, Billerica, MA, USA). Membranes were blocked with 5% skim milk for 2 hours, and incubated with primary antibodies overnight at 4°C. Following incubation with the corresponding HRP-conjugated secondary antibody for 1 hour, membranes were developed with SuperSignal West Femto Maximum Sensitivity Substrate (Thermo Fisher Scientific). GAPDH was used as an internal loading control. The following antibodies were used: anti-LIPH antibody (Abcam, ab192615), anti-HIF-1α antibody (36169s; CST; Boston, MA, USA), anti-Slug antibody (12129-1-AP; Proteintech Group), anti-E-cadherin antibody (20874-1-AP; Proteintech Group), anti-N-cadherin antibody (22018-1-AP; Proteintech Group), and HRP-conjugated AffiniPure goat anti-rabbit IgG(H+L) (SA00001-2; Proteintech Group).
Statistical analyses
The Student’s t-test (two-tailed) was used to analyze the differences between groups assuming a normal distribution of data. When population variance was unknown, the signed-rank test was used to analyze the paired samples. The data in these kind of groups were expressed as mean ± SD. The chi-squared test or Fisher’s exact test was used to analyze the categorical variables. The receiver operator characteristics (ROC) curve was used to differentiate the correlation between the level of gene expression and the diagnosis of related diseases by calculating the area under the curve (AUC), and the effective predictive value of AUC was defined between 0.5 and 1.0. A two-sided P-value of <0.05 was considered statistically significant. IBM SPSS Statistics 20 (IBM Corporation, Armonk, NY, USA) was used for statistical analysis. GraphPad Prism 6 (GraphPad Software, Inc., La Jolla, CA, USA) was used for plotting graphs.
Results
LIPH expression is significantly upregulated in PTC tissues
We used 45 paired PTC tissues and their corresponding normal thyroid tissues to assess differential LIPH expression levels using qRT-PCR. The results indicated that the LIPH mRNA expression level in PTC tissues was significantly higher than that in the corresponding paired normal thyroid tissues (P<0.001) (Figure 1A). The immunohistochemistry experiments showed similar results (P<0.001) (Figure 1B). We observed dramatic differences in LIPH expression in each group of PTC compared to normal tissue. Furthermore, we plotted an ROC curve according to the expression level of LIPH in PTC, and the AUC was 92.0% (P<0.001) (Figure 1C). To confirm these results, we analyzed the data of 504 PTC tissues and 60 normal thyroid tissues from TCGA database and observed the LIPH mRNA expression level to be upregulated in PTC tissues compared to normal tissues (P<0.001) (Figure 1D), thus corroborating the results of the tissue sample analysis. Furthermore, the analogous ROC curve results also indicated a relationship between LIPH expression level and PTC (AUC 94.0%, P<0.001) (Figure 1E). Subsequently, we analyzed the LIPH expression level in cell lines using qRT-PCR and Western blotting. The mRNA and protein levels of LIPH in BCPAP and KTC-1 cells were significantly higher than those in Htori-3 cells, a normal thyroid cell line (Figure 1F, G).
 | Figure 1 LIPH was relatively overexpressed in PTC tissues and PTC cell lines. Notes: (A) The expression levels of LIPH in 45 PTC tissues and their paired adjacent normal thyroid tissues were measured by qRT-PCR (Mann–Whitney U test, ***P<0.001). (B) Immunohistochemical analyses were performed to examine the expression levels of LIPH in PTC tissues and adjacent normal tissues (6/6 vs 0/6, ***P<0.001). Magnification ×400. (C) The ROC curve was constructed from the LIPH mRNA expression levels in diagnosing PTC in the validation cohort (AUC 92.0%, P<0.001; sensitivity 88.9; specificity 86.7%). (D) The expression levels of LIPH in 504 PTC tissues and 60 normal thyroid tissues were measured by qRT-PCR (Mann–Whitney U test, ***P<0.001). (E) The ROC curve was constructed from the LIPH mRNA expression levels in diagnosing PTC in the TCGA cohort (AUC 94.0%, P<0.001; sensitivity 87.4; specificity 96.6%). (F) The relative expression levels of LIPH in KTC-1 and BCPAP were significantly higher than in Htori-3 (two-tailed Student’s t-test, **P<0.01, ***P<0.001). (G) The corresponding protein expression levels of LIPH in KTC-1 and BCPAP. Abbreviations: AUC, area under the curve; GqRT-PCR, quantitative reverse transcription PCR; LIPH, lipase H; N, normal tissue; PTC, papillary thyroid carcinoma; T, tumor tissue; TCGA, The Cancer Genome Atlas; ROC, receiver operating characteristics.. |
LIPH expression is closely related to clinicopathological characteristics
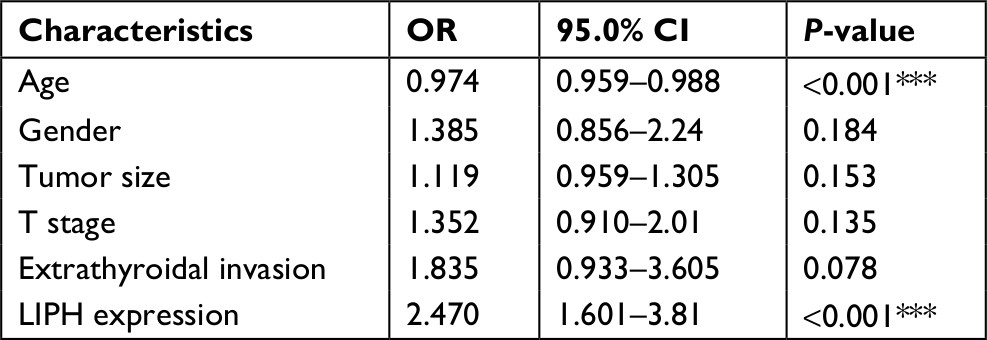
To explore the relationship between LIPH and oncogenesis and progression in PTC, clinical data from 504 PTC specimens were obtained from TCGA database. Based on the median value of the expression level of LIPH, the samples were categorized into high- and low-expression cohorts. All factors analyzed are displayed in Table 1. The results of the statistical analysis revealed that the American Joint Committee on Cancer disease stage, histological type of PTC, and behaviors of extrathyroidal invasion and lymph-node metastasis were relevant to high LIPH expression. Subsequently, we determined whether some possible characteristic factors correlated with lymph-node metastasis. Based on the univariate logistic regression analysis results, the variables of age, gender, tumor size, T stage, extrathyroidal invasion, and LIPH expression level were identified as statistically significant factors that affect lymph-node metastasis (Table 2). Using these factors, we performed further multivariate logistic analysis to reveal that only age and LIPH expression level were independent protective and risk factors of lymph-node metastasis in PTC, respectively (Table 3). Together, these results indicated a close relationship between LIPH expression and the clinical risk of lymph-node metastasis.
 | Table 1 Relationship between LIPH expression and clinicopathological characteristics in TCGA cohort Note: *P<0.05, ***P<0.001. Abbreviations: AJCC, American Joint Committee on Cancer; LIPH, lipase H; TCGA, The Cancer Genome Atlas. |
 | Table 2 Univariate logistic regression analysis for the risk of lymph-node metastasis Note: *P<0.05, **P<0.01, ***P<0.001. Abbreviation: LIPH, lipase H. |
 | Table 3 Multivariate logistic regression analysis for the risk of lymph-node metastasis Note: ***P<0.001. Abbreviation: LIPH, lipase H. |
Knockdown of LIPH restrains cell colony formation, proliferation, migration, and invasion
To explore the potential function of LIPH, we transfected KTC-1 and BCPAP cells with two different siRNA oligonucleotides and defined them as experimental groups S1 and S2, respectively. In addition, we transfected the cell lines with non-specific siRNA (si-NC) as a control group (hereinafter referred to as NC). The mRNA expression level and protein level of LIPH were assessed by qRT-PCR and Western blotting (Figure 2A, B). The cell colony formation assay revealed that the colony formation values in S1 and S2 were significantly lower than that in NC (Figure 2C, D). Furthermore, the results of the CCK-8 assay indicated that the proliferation capacity of the experimental groups was significantly lower than that of the control group after incubating the cell lines for 4 days (Figure 2E, F). To determine the role of LIPH in the biological behavior of tumor metastasis, a Transwell migration assay was performed, which indicated that the migratory ability of the experimental groups was markedly inhibited compared to that of the control groups (Figure 2G, H). A Matrigel invasion assay was subsequently performed on the same specimens, and the results indicated similar tendencies in invasive ability (Figure 2I, J). Together, these results demonstrated the role of LIPH in promoting the malignant biological behavior of PTC.
 | Figure 2 Knockdown of LIPH expression level restrained cell colony formation, proliferation, migration, and invasion in PTC cell lines. Notes: (A) In KTC-1 and BCPAP, the relative expression levels of LIPH were significantly knocked down by siRNA (si-LIPH) in comparison with the negative control group (si-NC) according to the qRT-PCR (two-tailed Student’s t-test, **P<0.01, ***P<0.001). (B) The corresponding protein expression levels of LIPH knockdown by siRNA in KTC-1 and BCPAP. (C) Colony formation assay: S1 and S2 formed fewer colonies than NC. (D) The columns represent the mean colony numbers for each group from at least three independent experiments, and the vertical bars on top of the columns represent SD (two-tailed Student’s t-test, **P<0.01, ***P<0.001). (E, F) CCK-8 assay: cell proliferation was significantly restrained in S1 and S2 in comparison with NC (two-tailed Student’s t-test, *P<0.05, **P<0.01, ***P<0.001). (G) Transwell migration assay: in both KTC-1 and BCPAP, S1 and S2 had fewer migrating cells than NC. (H) The columns represent the mean migrating cell numbers for each group from at least three independent experiments, and the vertical bars on top of the columns represent SD (two-tailed Student’s t-test, ***P<0.001). (I) Matrigel invasion assay: in both KTC-1 and BCPAP, S1 and S2 had fewer invading cells than NC. (J) The columns represent the mean invading cell number for each group from at least three independent experiments, and the vertical bars on top of the columns represent SD (two-tailed Student’s t-test, ***P<0.001). Magnification ×400. Abbreviations: CCK-8, Cell Counting Kit-8; GAPDH, glyceraldehyde-3-phosphate dehydrogenase; LIPH, lipase H; PTC, papillary thyroid carcinoma; NC, non-specific siRNA control group; qRT-PCR, quantitative reverse transcription PCR; S1, S2, experimental groups; si-LIPH, LIPH with siRNA knockdown. |
Overexpression of LIPH promotes cell colony formation, proliferation, migration, and invasion
To follow-up the siRNA transfection experiment, we used KTC-1 cells and transfected them with an LIPH overexpression plasmid as the experimental group (hereinafter referred to as the OEG) or with an empty plasmid as the negative control group (NCG). The transfection efficiency is shown in Figure 3A and B. In contrast to the siRNA transfection results, cell colony formation assays revealed that the overexpression of LIPH significantly promoted the formation of KTC-1 cell colonies (Figure 3C, D). After measuring CCK-8 absorbance over ~4 days to assess cell proliferation, we found that LIPH was closely associated with the proliferation of KTC-1 cells (Figure 3E). Thus, both experiments produced consistent results. Using a Transwell migration assay, we compared the relative numbers of migrated cells and observed markedly increased numbers of migrated cells in the OEG compared with the NCG (Figure 3F, G). Furthermore, the Matrigel invasion assay results indicated that there were more invasive cells in the OEG than in the NCG (Figure 3H, I). These cellular function experiments on cells with upregulated LIPH expression levels further validated the results of the experiments on cells with downregulated LIPH expression levels.
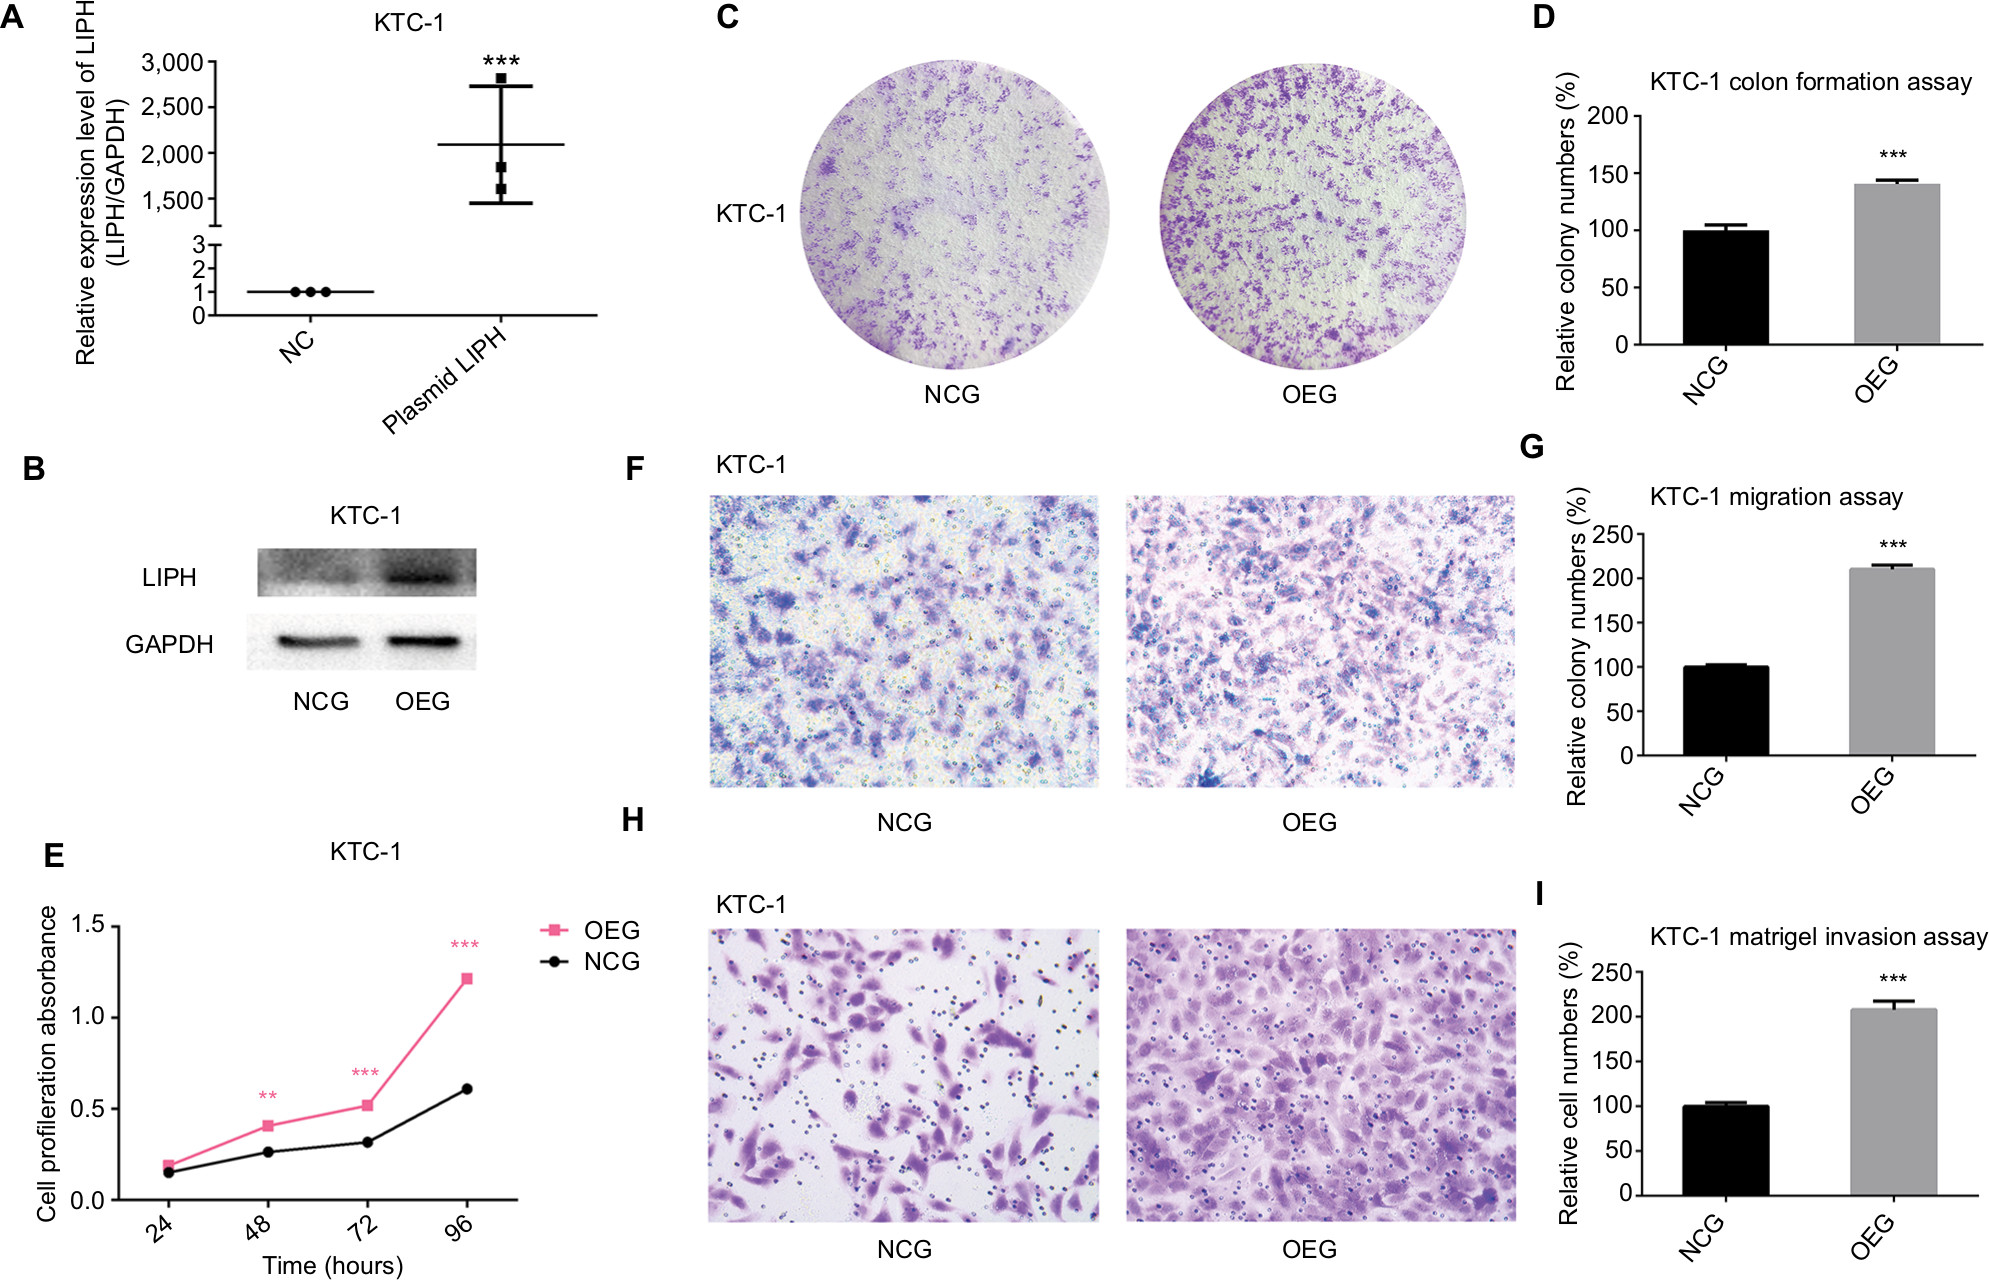 | Figure 3 Overexpression of LIPH promoted cell colony formation, proliferation, migration, and invasion. Notes: (A) In KTC-1, the relative expression level of LIPH was significantly overexpressed by LIPH overexpression plasmid (oe-LIPH) in comparison with the negative control group transfected with empty plasmid (oe-NC) according to qRT-PCR (two-tailed Student’s t-test, ***P<0.001). (B) The corresponding protein expression levels of LIPH overexpressed by overexpression plasmid in KTC-1. (C) Colony formation assay: in KTC-1, OEG formed more colonies than transfected NCG. (D) The columns represent the mean colony number for each group from at least three independent experiments, and the vertical bars on top of the columns represent SD (two-tailed Student’s t-test, ***P<0.001). (E) CCK-8 assay: cell proliferation was significantly promoted in OEG in comparison with NCG (two-tailed Student’s t-test, **P<0.01, ***P<0.001). (F) Transwell migration assay: in KTC-1, OEG had more migrating cells than NCG. (G) The columns represent the mean migrating cell number for each group from at least three independent experiments, and the vertical bars on top of the columns represent SD (two-tailed Student’s t-test, ***P<0.001). (H) Matrigel invasion assay: in KTC-1, OEG had more invading cells than NCG. (I) The columns represent the mean invading cell number for each group from at least three independent experiment, and the vertical bars on top of the columns represent SD (two-tailed Student’s t-test, ***P<0.001). Abbreviations: CCK-8, Cell Counting Kit-8; GAPDH, glyceraldehyde-3-phosphate dehydrogenase; oe, overexpression; LIPH, lipase H; NC, negative control; NCG, negative control group; OEG, overexpression group; qRT-PCR, quantitative reverse transcription PCR. |
Hypoxia upregulates LIPH, Slug, N-cadherin, and vimentin, and downregulates E-cadherin
HIF-1α is a transcription factor that is well known to regulate the downstream genes involved in hypoxia. It has been reported that HIF-1α gene expression increases during hypoxic conditions in tumors, including PTC. Therefore, we chose it as an indicator of the occurrence of hypoxia. We created hypoxia models using the KTC-1 and BCPAP cell lines, and they were confirmed to significantly overexpress HIF-1α. To study the effect of increased HIF-1α on LIPH, we measured the protein level of LIPH in the hypoxia models. In both the KTC-1 and BCPAP hypoxic cellular models, the expression of LIPH was significantly upregulated along with the overexpression of HIF-1α, indicating that HIF-1α may play a critical role in mediating the expression of LIPH. To determine the relationship between hypoxia and epithelial–mesenchymal transition (EMT), we measured the protein levels of Slug, N-cadherin, vimentin, and E-cadherin. When HIF-1α increased, the levels of Slug, N-cadherin, and vimentin increased, while the level of E-cadherin was reduced (Figure 4A). We established experimental groups which used an HIF-1α inhibitor, LW6, which degrades HIF-1α protein in cells. We found that HIF-1α was significantly decreased in the inhibition group compared to the hypoxia cell model groups. Along with the decline in HIF-1α, LIPH also showed a downward trend. Intriguingly, the protein levels of Slug, N-cadherin, vimentin, and E-cadherin showed the opposite trend in hypoxia cell-culture models (Figure 4B).
 | Figure 4 HIF-1α regulated the protein expression levels of LIPH, Slug, and E-cadherin, and the protein expression level of LIPH regulated Slug and E-cadherin. Notes: (A) The protein expression level of HIF-1α was obviously overexpressed in KTC-1 and BCPAP hypoxia models. The protein expression levels of LIPH, Slug, N-cadherin, and vimentin were significantly upregulated and E-cadherin was downregulated in KTC-1 and BCPAP hypoxia models in comparison with their negative control groups. (B) The protein expression levels of HIF-1α, LIPH, Slug, N-cadherin, vimentin, and E-cadherin showed the opposite trend in the inhibitor groups in comparison with the hypoxia groups. (C) The influence of LIPH expression on the well-known epithelial–mesenchymal transition pathway molecules Slug, N-cadherin, vimentin, and E-cadherin in KTC-1 and BCPAP was analyzed by Western blot assay. The expression levels of Slug, N-cadherin, and vimentin were positively regulated by LIPH expression, while E-cadherin was negatively regulated by LIPH expression. Abbreviations: CoCl2, cobalt(II) chloride; GAPDH, glyceraldehyde-3-phosphate dehydrogenase; HIF-1α, hypoxia inducible factor-1α; LIPH, lipase H; NC, negative control; NCG, negative control group; OEG, overexpression group; S1, S2, experimental groups. |
LIPH mediates the EMT signaling pathway in PTC cells
To provide a deeper understanding of the role of LIPH in PTC migration and invasion, we linked it to some of the iconic molecules involved in the EMT pathway. First, we confirmed that LIPH was significantly upregulated or downregulated in KTC-1 and BCPAP cells by measuring its protein expression level. Next, the expression levels of the iconic protein molecules Slug, N-cadherin, vimentin, and E-cadherin were determined by Western blotting. The results indicated that the protein expression levels of Slug, N-cadherin, and vimentin increased as that of LIPH increased, while the protein level of E-cadherin decreased as that of LIPH decreased in the knockdown cell lines. By contrast, the opposite results were obtained in the overexpressing cell lines (Figure 4C).
Discussion
In many countries, the number of diagnosed cases of TC is increasing rapidly because of the optimization and improvement of diagnostic methods.15 Currently, BRAF V600E is regarded as a mutation factor which has >99% positive predictive value for diagnosing PTC. BRAF V600E has been reported to be possibly associated with aggressive features in PTC progression, and thus, it may have a direct significance in the treatment of diseases.16 Although the use of the BRAF mutation has been gradually confirmed by vast quantities of oncogenesis-related genetic information on TC, additional markers and their associated molecular mechanisms need to be identified and applied to improve the diagnostic standards and treatment programs of TC.
The role of the novel carcinoma-related gene LIPH has already been explored in several carcinomas.11–13 In our study, consistent with these previous studies, the expression levels of LIPH in TC tissues were significantly upregulated. Thus, we subsequently referred to TCGA database and confirmed that LIPH was consistently overexpressed in TC compared to the levels in normal thyroid tissue. Two ROC curves were plotted based on analyses of our tissues, and the tissues from TCGA had similar AUC values (both >0.9). These results suggest that the expression level of LIPH in tissues would be an effective index for predicting whether a thyroid nodule is benign or malignant.
To identify the function of LIPH, we first analyzed its relevance to clinical features. To obtain reliable results, we used data on clinical specimens from TCGA for the analysis. We found that the higher the LIPH expression, the more prone PTC was to extrathyroidal invasion and lymph-node metastasis. Subsequently, we performed functional experiments on LIPH at the cytological level. Downregulation of LIPH significantly weakened the abilities of proliferation, migration, and invasion in TC cell lines. Conversely, upregulation of LIPH significantly enhanced these abilities. These experimental results agreed with the clinical statistics results. Thus, we concluded that these in vitro cytological features may coordinate with each other and systematically establish the clinical features relevant to LIPH in vivo.
Notably, lymph-node metastasis of TCs is commonly seen in clinicopathological diagnoses.17 The recurrence and distant metastasis of PTC affect disease-free survival equally and are inseparable from the risk of cervical lymph-node metastasis.18 EMT plays an important role in the development of lymph-node metastasis. Typically, measuring the expression of epidermal and mesenchymal markers is used to determine the EMT phenotype. N-cadherin and vimentin are mesenchymal markers associated with the loss of cell–cell junctions. E-cadherin plays a vital role in cell adhesion and tight junctions. Slug, also called Snail2, can suppress transcription by binding the promoter region of the cell adhesion gene E-cadherin, eventually triggering the EMT pathway.19,20 Based on these previous studies, we hypothesized that if LIPH is closely associated with lymph-node metastasis, it would affect some biomarkers in the EMT pathway. We chose to examine Slug, N-cadherin, vimentin, and E-cadherin as potential biomarkers in the EMT pathway. As shown in cytological experiments, the expression levels of Slug, N-cadherin, and vimentin were positively correlated with that of LIPH, while the expression level of E-cadherin was negatively correlated with that of LIPH. Slug was found to suppress the production of E-cadherin in breast cancer cells during lymph-node metastasis.21 These results confirmed our hypothesis. Thus, we postulate that LIPH may cause lymph-node metastasis in PTC by inducing E-cadherin via Slug.
The effects of hypoxic microenvironments on tumors are attracting increased attention. Various studies on carcinoma have noted that hypoxia results in treatment resistance and accelerates tumor progression by promoting differentiation, cell proliferation, metastasis, and invasion.22,23 It has already been reported that hypoxia is associated with lymph-node metastasis in PTC, but the complicated mechanism of this association remains to be explored.24 Thus, we further hypothesized that LIPH may have a relationship with lymph-node metastasis under hypoxic conditions. HIF-1α controls its oxygen-regulated stability through its oxygen-dependent degradation domain, and its expression increases during hypoxic conditions in tumors.23,25 HIF-1α coexisting with Slug and metallothionein was shown to be significantly associated with lymph-node metastasis in PTC.24 The mechanism by which HIF-1α regulates EMT via Snail in prostate cancer has been reported previously.26 Thus, we constructed hypoxic cellular models using KTC-1 and BCPAP cells for our study. The high expression level of HIF-1α protein confirmed the establishment of hypoxic cell lines. As the HIF-1α protein level expression increased, LIPH showed an upward increasing trend in the two hypoxia cellular models. Subsequently, Slug, N-cadherin, and vimentin were found to be upregulated and E-cadherin was found to be downregulated. As we had speculated, after degrading the protein HIF-1α, the result was contrary to that of the former experiment. These trends indicated that HIF-1α positively regulated the LIPH gene at its protein level within the hypoxic microenvironment in PTC and also mediated the EMT pathway. Together with our previous finding of a positive association between LIPH and lymph-node metastasis, this experiment further revealed that LIPH is a downstream molecular target of HIF-1α and may participate in lymph-node metastasis of PTC in hypoxic environments.
Despite these important findings related to PTC, some issues still need to be addressed. The large database of specimens and the associated clinical information needs to be completed so that it can be used to produce stronger and more credible statistical results. Moreover, the detailed relationship between LIPH and lymph-node metastasis needs further exploration. Furthermore, the hypothesis about the pathway of HIF-1α–LIPH–EMT in PTC in hypoxic environments remains to be proved in future studies.
Conclusion
In summary, our study found that LIPH was upregulated in PTC and positively mediated tumor proliferation and metastasis in vitro. Analysis of the clinical features of PTC revealed that LIPH functioned in an aggressive manner. An important finding was that LIPH is the downstream molecular target of HIF-1α and may be associated with cell migration under hypoxic conditions in vitro. Thus, LIPH is expected to be a potential biomarker in the diagnosis and prognosis of PTC, as well as a novel therapeutic target.
Acknowledgments
This work was supported by grants from the Major Science and Technology Projects of Zhejiang Province (2015C03052), Wenzhou Science and Technology Planning Project (Y20160126), Scientific Research Incubator Project of the First Affiliated Hospital of Wenzhou Medical University (no. FHY2014018), and the Chinese National Science Foundation (31670784). Many thanks are expressed to Yixiang Jin and Zhouci Zheng for their kind help during this work.
Disclosure
The authors report no conflicts of interest in this work.
References
Miller KD, Siegel RL, Lin CC, et al. Cancer treatment and survivorship statistics, 2016. CA Cancer J Clin. 2016;66(4):271–289. | ||
Siegel RL, Miller KD, Jemal A. Cancer statistics, 2017. CA Cancer J Clin. 2017;67(1):7–30. | ||
Shindo ML, Caruana SM, Kandil E, et al. Management of invasive well-differentiated thyroid cancer: an American Head and Neck Society consensus statement: AHNS consensus statement. Head Neck. 2014;16(10):1379–1390. | ||
Hinson AM, Massoll NA, Jolly LA, Stack BC, Bodenner DL, Franco AT. Structural alterations in tumor-draining lymph nodes before papillary thyroid carcinoma metastasis. Head Neck. 2017;39(8):1639–1646. | ||
Daliri M, Abbaszadegan MR, Bahar MM, et al. The role of BRAF V600E mutation as a potential marker for prognostic stratification of papillary thyroid carcinoma: a long-term follow-up study. Endocr Res. 2014;39(4):189–193. | ||
Applewhite MK, James BC, Kaplan SP, et al. Quality of life in thyroid cancer is similar to that of other cancers with worse survival. World J Surg. 2016;40(3):551–561. | ||
Inoue A, Arima N, Ishiguro J, Prestwich GD, Arai H, Aoki J. LPA-producing enzyme PA-PLA1α regulates hair follicle development by modulating EGFR signalling. EMBO J. 2011;30(20):4248–4260. | ||
Lin ME, Herr DR, Chun J. Lysophosphatidic acid (LPA) receptors: signaling properties and disease relevance. Prostaglandins Other Lipid Mediat. 2010;91(3-4):130–138. | ||
Mizukami Y, Hayashi R, Tsuruta D, Shimomura Y, Sugawara K. Novel splice site mutation in the LIPH gene in a patient with autosomal recessive woolly hair/hypotrichosis: case report and published work review. J Dermatol. 2018;45(5):613–617. | ||
Ahmad F, Sharif S, Furqan Ubaid M, et al. Novel sequence variants in the LIPH and LPAR6 genes underlies autosomal recessive woolly hair/hypotrichosis in consanguineous families. Congenit Anom (Kyoto). 2018;58(1):24–28. | ||
Cui M, Jin H, Shi X, et al. Lipase member H is a novel secreted protein associated with a poor prognosis for breast cancer patients. Tumour Biol. 2014;35(11):11461–11465. | ||
Seki Y, Yoshida Y, Ishimine H, et al. Lipase member H is a novel secreted protein selectively upregulated in human lung adenocarcinomas and bronchioloalveolar carcinomas. Biochem Biophys Res Commun. 2014;443(4):1141–1147. | ||
Ishimine H, Zhou R, Sumitomo K, et al. Lipase member H frequently overexpressed in human esophageal adenocarcinomas. Tumour Biol. 2016;37(2):2075–2081. | ||
Wang QX, Chen ED, Cai YF, et al. A panel of four genes accurately differentiates benign from malignant thyroid nodules. J Exp Clin Cancer Res. 2016;35(1):169. | ||
Tufano RP, Noureldine SI, Angelos P. Incidental thyroid nodules and thyroid cancer: considerations before determining management. JAMA Otolaryngol Head Neck Surg. 2015;141(6):566–572. | ||
Yip L. Molecular markers for thyroid cancer diagnosis, prognosis, and targeted therapy. J Surg Oncol. 2015;111(1):43–50. | ||
Wu MH, Shen WT, Gosnell J, Duh QY. Prognostic significance of extranodal extension of regional lymph node metastasis in papillary thyroid cancer. Head Neck. 2015;37(9):1336–1343. | ||
Fukushima M, Ito Y, Hirokawa M, Miya A, Shimizu K, Miyauchi A. Prognostic impact of extrathyroid extension and clinical lymph node metastasis in papillary thyroid carcinoma depend on carcinoma size. World J Surg. 2010;34(12):3007–3014. | ||
Gonzalez DM, Medici D. Signaling mechanisms of the epithelial-mesenchymal transition. Sci Signal. 2014;7(344):re8. | ||
Toiyama Y, Yasuda H, Saigusa S, et al. Increased expression of slug and vimentin as novel predictive biomarkers for lymph node metastasis and poor prognosis in colorectal cancer. Carcinogenesis. 2013;34(11):2548–2557. | ||
Biswas S, Sengupta S, Roy Chowdhury S, et al. CXCL13-CXCR5 co-expression regulates epithelial to mesenchymal transition of breast cancer cells during lymph node metastasis. Breast Cancer Res Treat. 2014;143(2):265–276. | ||
Brahimi-Horn MC, Chiche J, Pouysségur J. Hypoxia and cancer. J Mol Med (Berl). 2007;85(12):1301–1307. | ||
Vaupel P. Hypoxia and aggressive tumor phenotype: implications for therapy and prognosis. Oncologist. 2008;13 (Suppl 3):21–26. | ||
Wang N, Dong CR, Jiang R, et al. Overexpression of HIF-1α, metallothionein and Slug is associated with high TNM stage and lymph node metastasis in papillary thyroid carcinoma. Int J Clin Exp Pathol. 2014;7(1):322–330. | ||
Ke Q, Costa M. Hypoxia-inducible factor-1 (HIF-1). Mol Pharmacol. 2006;70(5):1469–1480. | ||
Cho KH, Choi MJ, Jeong KJ, et al. A ROS/STAT3/HIF-1α signaling cascade mediates EGF-induced Twist1 expression and prostate cancer cell invasion. Prostate. 2014;74(5):528–536. |
 © 2019 The Author(s). This work is published and licensed by Dove Medical Press Limited. The
full terms of this license are available at https://www.dovepress.com/terms
and incorporate the Creative Commons Attribution
- Non Commercial (unported, 3.0) License.
By accessing the work you hereby accept the Terms. Non-commercial uses of the work are permitted
without any further permission from Dove Medical Press Limited, provided the work is properly
attributed. For permission for commercial use of this work, please see paragraphs 4.2 and 5 of our Terms.
© 2019 The Author(s). This work is published and licensed by Dove Medical Press Limited. The
full terms of this license are available at https://www.dovepress.com/terms
and incorporate the Creative Commons Attribution
- Non Commercial (unported, 3.0) License.
By accessing the work you hereby accept the Terms. Non-commercial uses of the work are permitted
without any further permission from Dove Medical Press Limited, provided the work is properly
attributed. For permission for commercial use of this work, please see paragraphs 4.2 and 5 of our Terms.