Back to Journals » Clinical Ophthalmology » Volume 20
Link Between Baseline Peripheral Vascular Leakage and Treatment Response in Patients with Central Retinal Vein Occlusion: A Pilot Study
Authors Munn C ![]() , Kamintsky L, Serlin Y, Smith CA, Friedman A, Corredores J, Levy J
, Kamintsky L, Serlin Y, Smith CA, Friedman A, Corredores J, Levy J ![]()
Received 5 November 2025
Accepted for publication 21 February 2026
Published 23 March 2026 Volume 2026:20 579250
DOI https://doi.org/10.2147/OPTH.S579250
Checked for plagiarism Yes
Review by Single anonymous peer review
Peer reviewer comments 2
Editor who approved publication: Dr Yousef Fouad
Colyn Munn,1– 3 Lyna Kamintsky,2,3 Yonatan Serlin,2 Corey A Smith,1,4 Alon Friedman,2,3,5 Jamel Corredores,6 Jaime Levy6
1School of Biomedical Engineering, Faculty of Medicine, Dalhousie University, Halifax, NS, Canada; 2Department of Medical Neuroscience, Faculty of Medicine, Dalhousie University, Halifax, NS, Canada; 3Emagix Inc, Halifax, NS, Canada; 4Department of Ophthalmology & Visual Sciences, Faculty of Medicine, Dalhousie University, Halifax, NS, Canada; 5Departments of Physiology and Cell Biology and Brain and Cognitive Sciences, Ben-Gurion University of the Negev, Beersheba, Israel; 6Ophthalmology Department, Hadassah Medical Center, Faculty of Medicine, Hebrew University Jerusalem, Jerusalem, Israel
Correspondence: Jaime Levy, Ophthalmology Department, Hadassah Medical Center Faculty of Medicine, Hebrew University, Kiryat Hadassah, POB 12000, Jerusalem, 91120, Israel, Email [email protected]
Purpose: To explore the potential link between quantitative measures of retinovascular function and response to intravitreal bevacizumab in patients with central retinal vein occlusion (CRVO).
Patients and Methods: This retrospective, observational cohort study included 28 eyes with CRVO that satisfied the following inclusion criteria: age over 18 years; bevacizumab treatment for at least 4 months; best corrected visual acuity (BCVA) measurements at baseline and post-treatment; and pre-treatment ultra-wide field fluorescein angiography (UWF-FA). The RETICAD software was used for quantitative analysis of baseline UWF-FA, generating measures of blood flow, perfusion, and blood-retina barrier (BRB) in the central and peripheral retina. Responders and non-responders were defined based on BCVA stratification method developed by the DRCR network. Baseline differences between responders and non-responders were assessed using the Wilcoxon Rank Sum test. The discriminative performance of baseline measures in distinguishing responders from non-responders was evaluated using logistic regression.
Results: At baseline, responders had significantly higher peripheral leakage (p = 0.034), but not central leakage (p = 0.444), compared to non-responders. No significant baseline differences were observed in perfusion or blood flow. The highest discriminative performance for treatment response was observed for baseline BRB leakage in the nasal-peripheral and inferior-peripheral regions (AUC = 0.77 and 0.75, respectively). Baseline blood flow, perfusion, central macular thickness (CMT), and BCVA demonstrated lower discriminative performance.
Conclusion: High peripheral BRB leakage at baseline may be associated with an increased likelihood of benefiting from bevacizumab treatment. While this pilot study highlights the potential of quantitative UWF-FA analysis to guide CRVO therapy, these findings require validation in a larger, prospective, multicenter study with a standardized treatment protocol.
Keywords: central retinal vein occlusion, blood-retina barrier leakage, ultra-wide field fluorescein angiography, image analysis, anti-VEGF treatment response
Introduction
Central retinal vein occlusion (CRVO) affects an estimated 2.5 million individuals worldwide, making it one of the leading causes of sudden unilateral vision loss.1 The progression of CRVO is closely linked to vascular endothelial growth factor (VEGF), a contributing factor to the development of blood-retina barrier (BRB) leakage and of macular edema.2 Anti-VEGF agents are the main treatment for patients diagnosed with CRVO; however, up to 41% of patients do not respond to therapy.3–5 Moreover, there is ongoing debate regarding the optimal treatment timing, as well as intervals, dosage, and endpoint.2,6 With the introduction of new therapies and drugs, some targeting multiple pathways, the need for a personalized approach to CRVO treatment is becoming increasingly apparent.
Currently, clinicians have no tools for identifying CRVO patients likely to respond to anti-VEGF therapy. The objective of the present pilot study was to explore the potential association between treatment response and three baseline characteristics linked to CRVO pathophysiology: (i) blood flow, reflecting hemodynamic changes associated with venous obstruction; (ii) perfusion, reflecting the extent of ischemic burden; and (iii) BRB leakage, reflecting increased vascular permeability driven by VEGF activity).2,5 These characteristics were measured through quantitative analysis of retrospective ultra-widefield fluorescein angiography (UWF-FA) data using the RETICAD software.7–9 While standard fluorescein angiography primarily visualizes the central retina, UWF-FA also captures peripheral pathology, which has been suggested to contribute to RVO progression.10 UWF-FA analysis using the fully automated RETICAD software produces central and peripheral measures of blood flow, perfusion, and BRB leakage. Recent studies have linked RETICAD measures to clinical characteristics in RVO,9 diabetic retinopathy,11,12 and age-related macular degeneration.13 Here, we present the first exploratory study into the potential link between RETICAD measures of vascular pathology prior to treatment and treatment response.
Materials and Methods
Data
This study performed a retrospective analysis of data collected at the Hadassah Medical Center. The analysis included eyes that met the following inclusion criteria: (i) age over 18 years; (ii) CRVO diagnosis; (iii) bevacizumab treatment (1.25 mg/0.05 mL) for at least 4 months; (iv) BCVA measurements (logarithm of the minimum angle of resolution, logMAR) at baseline and post-treatment; and (v) UWF-FA exam collected before treatment. Exclusion criteria included eyes with diseases such as diabetic retinopathy, age-related macular degeneration, branch retinal vein occlusion, retinal detachment, vasculitis, vitreous hemorrhage, and central retinal artery occlusion, as well as eyes with UWF-FA exams of insufficient quality for quantitative analysis. Extracted data also included age, eye disease(s), treatment type(s), and number of intravitreal bevacizumab injections. The study was approved by the institutional ethics committee at Hadassah Medical Center (HMO 382–19) and conducted in accordance with the Declaration of Helsinki. As this is a retrospective study, the need for informed consent was waived by the committee.
SD-OCT
All eyes in the retrospective dataset underwent SD-OCT using the Heidelberg Spectralis OCT system (Heidelberg Engineering GmbH, Heidelberg, Germany). Measurements of central macular thickness (CMT) were obtained using standard macular volume scans centered on the fovea. CMT was automatically calculated by the device’s proprietary segmentation algorithm as the mean retinal thickness within the central 1-mm diameter Early Treatment Diabetic Retinopathy Study (ETDRS) subfield, defined as the distance between the internal limiting membrane and Bruch’s membrane, without manual correction. CMT values are reported in micrometers (µm).
Ultra-Widefield Fluorescein Angiography and the RETICAD Software
UWF-FA exams in the dataset were acquired using an Optos ultra-widefield P200DTx camera (Optos Inc., Dunfermline, United Kingdom). Following dye-injection, UWF-FA images were captured at a rate of one image every 2–3 seconds for the first 50 seconds of the exam. Capture frequency was then reduced to 1–2 images every 30 seconds for the remainder of the 10-minute examination. UWF-FA images were analyzed using the RETICAD software package (v6.0; Emagix Inc., Halifax, NS; Figure 1). The RETICAD software was used in its fully automated mode, which eliminates manual parameter adjustment. For each UWF-FA study, the software applied a series of four pre-processing steps: (1) removal of images with overexposure, underexposure, blurring, and/or occlusions; (2) brightness correction; (3) correction for movement artefacts; and (4) segmentation of the retina vasculature. By performing a pixel-wise linear regression, the software constructs three maps of vascular function: (1) BRB leakage, calculated as the rate of extravascular fluorescein accumulation between the start of recirculation and the late phase; (2) perfusion, calculated as the rate of extravascular fluorescein wash-in between the choroidal flush and arteriovenous phase; and (3) blood flow, calculated as the rate of intravascular fluorescein wash-in between the choroidal flush and arteriovenous phase. The pixel values of the maps are measured in arbitrary-units-per-second (1/s). The software, its subroutines, and clinical validation have been previously reported.7,8,14,15
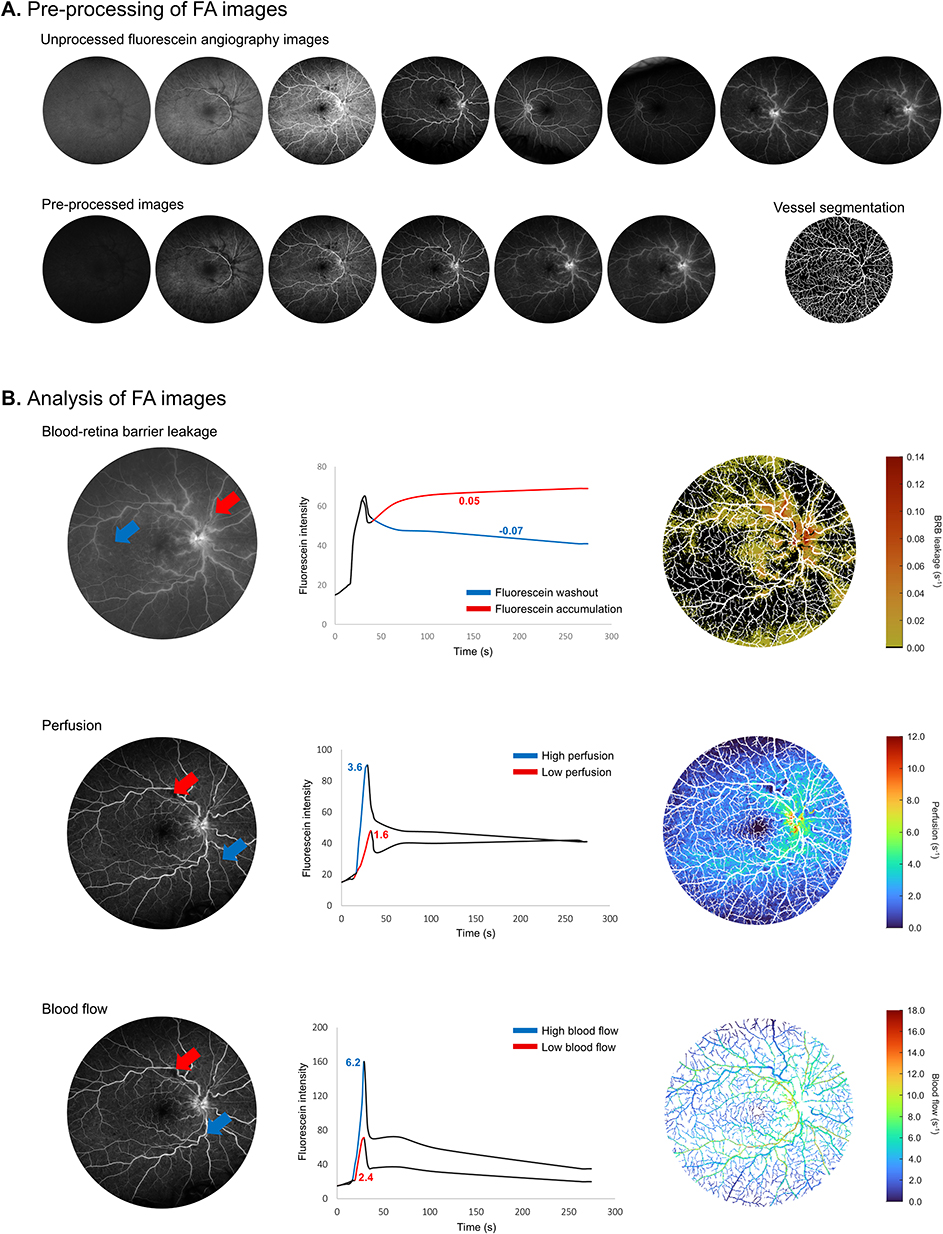 |
Figure 1 RETICAD analysis of fluorescein angiography images. (A) A series of UWF-FA images are uploaded to the RETICAD software platform and undergo a series of pre-processing steps including the removal of poor-quality images, brightness correction, image registration, and blood vessel segmentation. (B) BRB leakage is calculated in pixels of extra-vascular tissue as the rate of fluorescein accumulation between the start of recirculation and the late phase (red arrow: pixel with fluorescein accumulation; blue arrow: pixel with fluorescein washout). Perfusion is calculated in pixels with extra-vascular tissue as the rate of fluorescein wash-in between the choroidal flush and arteriovenous phases (red arrow: pixel with relatively low extravascular wash-in rate; blue arrow: relatively high extravascular wash-in rate). Blood flow is calculated in pixels with extra-vascular tissue as the rate of intra-vascular fluorescein wash-in between the choroidal flush and arteriovenous phases (red arrow: pixel with relatively low intravascular wash-in rate; blue arrow: relatively high intravascular wash-in rate). Abbreviations: UWF-FA, ultra widefield fluorescein angiography; BRB, blood-retina barrier. |
Regional Analysis
Maps of BRB leakage, perfusion, and blood flow are partitioned into five regions using a modified ETDRS grid (Figures 2 and 3). This grid includes a 6-mm diameter circle and a 20-mm diameter circle manually centered about the foveal avascular zone. The 6-mm diameter circle was used to delineate the macula region, while the area between the 6-mm and 20-mm circles was used to delineate the peripheral region. For a more detailed analysis, the periphery was divided into four equally sized regions: (i) superior-periphery; (ii) nasal-periphery; (iii) temporal-periphery; and (iv) inferior-periphery. The circles were scaled proportionally to the width of the optic disc, using the methodology proposed by Abbasnejad et al (2023) – the optic disc is assumed to have a width of 1.67 mm.8
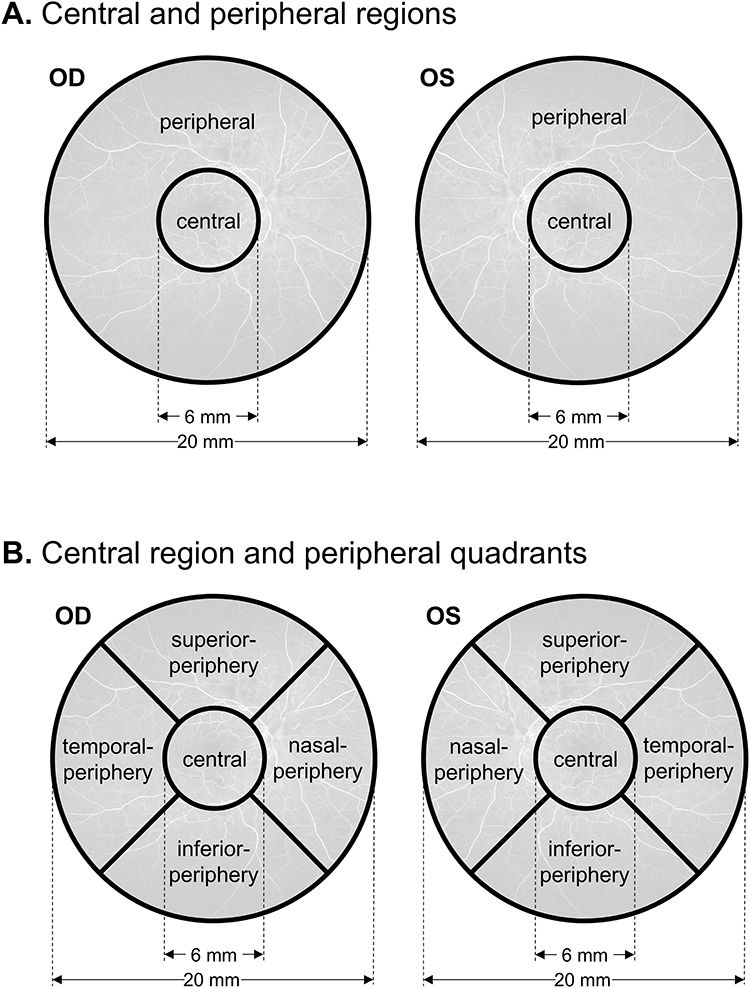 |
Figure 2 RETICAD calculation of region-specific BRB leakage, perfusion, and blood flow. (A) Maps of BRB leakage, perfusion, and blood flow were segmented into a central and peripheral region using two circles (at a 6 mm and a 20 mm diameter) centered about the fovea. (B) For more detailed analyses, the periphery was segmented into four sub-regions: superior, temporal, inferior, and nasal. BRB leakage, perfusion, and blood flow within each region were calculated as the median value of all values within that region. |
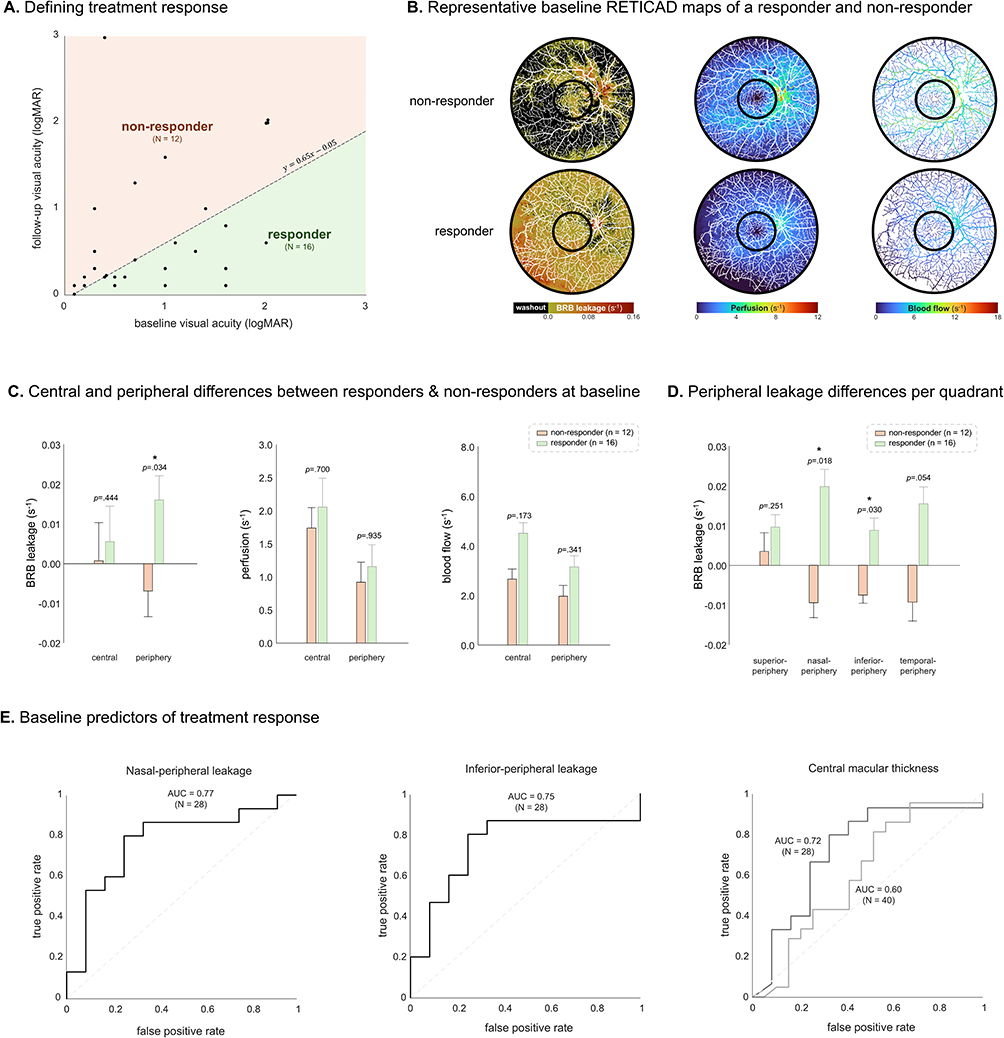 |
Figure 3 Link between baseline measures and treatment response. (A) Treatment responders and non-responders were identified based on changes in visual acuity as defined by the DRCR Network.16 A total of 16 eyes were classified as responders, with the remaining 12 classified as non-responders. (B) Representative examples of baseline leakage, prefusion, and blood flow maps from a responder and a non-responder to treatment. (C) Responders had significantly higher peripheral BRB leakage at baseline compared to non-responders (p=0.034). No significant differences were found in baseline perfusion and blood flow. (D) A quadrant-based analysis of baseline peripheral leakage suggests that increased BRB leakage in responders was localized to the nasal-peripheral and inferior-peripheral regions (p=0.018 and p=0.03, respectively). (E) A univariate logistic regression showed the best performing response discriminators were nasal-peripheral leakage (AUC = 0.77) and inferior-peripheral leakage (AUC = 0.75). Baseline CMT had an AUC of 0.72 in the 28 patients with complete data and an AUC of 0.60 when analyzed with 12 additional patients from the same retrospective dataset who met all inclusion and exclusion criteria except for having baseline UWF-FA (total n=40). All bar chart values are reported in medians ± standard error of the median. Statistical significance was determined at a p-value <0.05 and is indicated by a bold asterisk (*). Abbreviations: DRCR, Diabetic Retinopathy Clinical Research; AUC, area under the receiver operating characteristic curve; BRB, blood-retina barrier; CMT, central macular thickness. |
Definition of Treatment Response
Treatment responders and non-responders were defined using the phenotype model developed by the Diabetic Retinopathy Clinical Research (DRCR) Network.16 This model takes into account baseline BCVA and calculates relative improvement in visual acuity, rather than relying on absolute change alone. This approach adjusts for baseline dependency, recognizing that eyes with better vision at baseline (eg, 20/25) have limited potential for visual gain, while those starting with poorer vision (eg, 20/80) may demonstrate greater absolute gains To adapt this ETDRS letter-based model to our logMAR measures, we applied a previously established linear conversion17 As such, eyes are considered a treatment responder if the following inequality is satisfied:
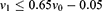
Where  and
and  are the visual acuities measured at baseline and post-treatment in logMAR, respectively.
Statistical Analysis
Quantitative measures were reported using medians, standard error of the median, and interquartile range [IQR]. All analyses were performed using non-parametric tests. Independent measures were compared using the Wilcoxon rank-sum test, and paired measures using the Wilcoxon signed-rank test, with a significance level set at p<0.05. Logistic regression models were used to assess the discriminative performance of baseline measures in predicting treatment response. Model parameters with a significant effect were defined at p<0.05. Sensitivity and specificity were reported for the optimal operating points. All statistical analyses were conducted using MATLAB (MATLAB R2024b, MathWorks, Natick, Massachusetts). Given the exploratory nature of this pilot study, a formal a priori power calculation was not conducted. The sample size was based on available cases and is intended to inform future adequately powered studies.
Results
Patient Characterization
A total of 28 eyes from 28 patients were included in the study (Table 1). At baseline, the mean age of study participants was 66 ± 10.4 years. Patients received an average of 12.4 ± 8.7 intravitreal bevacizumab injections. Treatment responders and non-responders were defined using the DRCR formula calculating baseline-dependent gain in visual acuity.16 Based on this formula, 16 patients responded to treatment and 12 did not (Figure 3A).
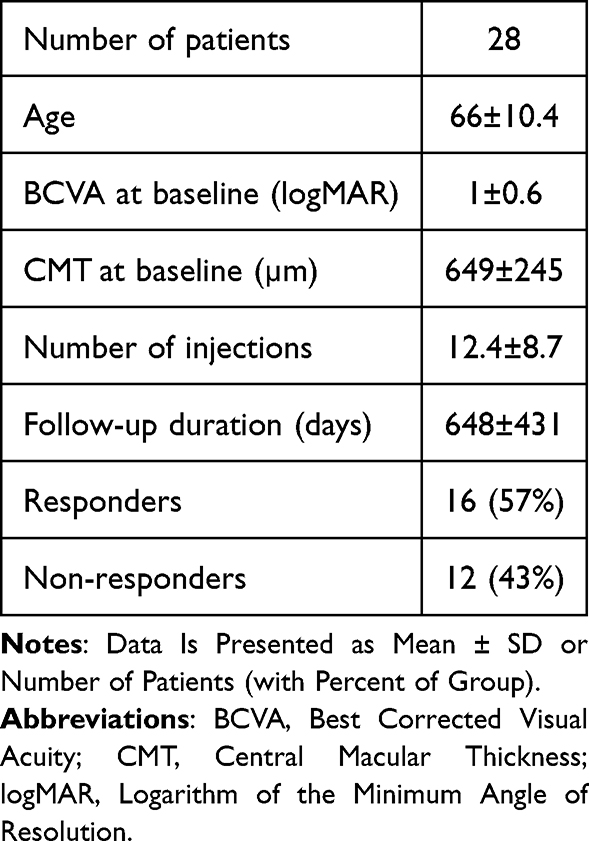 |
Table 1 Characteristics of Study Cohort |
Potential Link Between Peripheral BRB Leakage at Baseline and Treatment Response
The responder and non-responder groups did not differ in the number of received injections, duration of treatment, baseline CMT, or baseline BCVA (p>0.05). In order to explore whether responders and non-responders to treatment may have different profiles of vascular function at baseline, we used the RETICAD software to analyze the 28 baseline UWF-FA exams and produce measures of BRB leakage, perfusion, and blood flow. These baseline measures were then compared between the 16 responders and 12 non-responders to treatment (representative BRB leakage, perfusion, and blood flow maps are shown in Figure 3B). The analysis revealed that, at baseline, responders had significantly higher peripheral leakage (p=0.034) but not central leakage (p=0.444) compared to non-responders (Figure 3C). No significant differences were found in baseline measures of perfusion and blood flow (p>0.05; Figure 3C). An exploratory examination of leakage in peripheral subregions showed that higher leakage among responders was localized to the nasal-peripheral and inferior-peripheral regions (p=0.018 and p=0.03, respectively; Figure 3D).
We next used univariate logistic modelling to explore which FA measures at baseline are most strongly linked to treatment response. The highest discriminative ability was observed for (i) nasal-peripheral leakage (AUC = 0.77) and (ii) inferior-peripheral leakage (AUC = 0.75; Figure 3E). Baseline CMT had an AUC of 0.72 in the 28 patients with complete data and an AUC of 0.60 when analyzed with 12 additional patients from the same retrospective dataset who met all inclusion and exclusion criteria except for having baseline UWF-FA (total n=40; Figure 3E). The discriminative ability of baseline perfusion, blood flow, and BCVA was 0.63, 0.66, 0.66, respectively.
Exploratory Analysis: Responders Exhibit a Greater Reduction in Peripheral BRB Leakage Post-Treatment
Of the 28 eyes included in the study, 17 had pre- and post-treatment UWF-FA examinations. Analysis of post- versus pre-treatment UWF-FA changes in these eyes showed that treatment significantly reduced peripheral, but not central BRB leakage. Perfusion and blood flow remained unchanged (see Supplementary Material 1 and Supplementary Figure 1).
Discussion
This pilot study suggests that high BRB leakage in the peripheral retina at baseline may be associated with a greater likelihood of benefiting from anti-VEGF therapy in CRVO. Our data also indicates that peripheral leakage at baseline has a higher discriminative power of treatment response than baseline measures of perfusion, blood flow, or CMT. These results suggest that elevated peripheral BRB leakage in CRVO patients may help identify candidates likely to benefit from anti-VEGF therapy.
A key clinical challenge in managing CRVO is determining which patients may benefit from intervention. Hence, the goal of this retrospective study was to explore whether UWF-FA metrics before treatment may serve as a biomarker of the likelihood to benefit from treatment. Our exploratory analysis highlighted peripheral BRB leakage as the strongest predictor of post-treatment visual outcomes, with leakage in the nasal and inferior periphery showing the highest discriminative ability. The presence of peripheral leakage in CRVO patients is well-established in the literature.18,19 Our findings add to this literature by: (i) proposing the hypothesis that the therapeutic effects of bevacizumab in CRVO may be mediated through the reduction of VEGF-induced peripheral leakage; and (ii) highlighting the importance of detecting and treating peripheral leakage in CRVO patients.
Our analysis showed no link between perfusion and the therapeutic effect of anti-VEGF, adding to the ongoing debate regarding the effects of anti-VEGF therapy on retinal perfusion.20 Our findings are consistent with findings from Ip et al (2023), who reported no correlation between areas of non-perfusion and visual acuity outcomes following anti-VEGF treatment in CRVO patients.21 In contrast, Singer et al (2014) reported a negative correlation, suggesting that greater non-perfusion at baseline is associated with poorer visual acuity following anti-VEGF treatment.22 Together, these findings highlight the need to investigate whether agents with alternative mechanisms of action can enhance perfusion in CRVO patients, and whether such improvement will be associated with higher response rates, either as monotherapy or in combination with anti-VEGF treatment.
This pilot study has two key limitations: (i) the modest sample size of eyes that met the inclusion and exclusion criteria (n=28), which was determined by the available retrospective data. As a result, the analysis was exploratory in nature with the goal of informing power calculations of future multicenter studies. The modest sample size also precluded adjustment for potential confounders such as systemic comorbidities (eg., hypertension, diabetes) and disease chronicity. Notably, the sample size is also likely to have limited the discriminative performance of the examined measures, resulting in AUC values (0.77 and 0.75) that are below those typically desired for clinical decision-making. (ii) The reliance on retrospective real-world data introduced variability in the treatment protocol, including injection intervals and treatment duration. These limitations warrant cautious interpretation of the findings, which should be interpreted as hypothesis-generating. They also highlight the need to validate these preliminary results in a large, prospective, multicenter study with a standardized treatment protocol. Such a study should also allow evaluation of predictive performance using an independent dataset not involved in model development.
While this pilot study is limited by its sample size and retrospective study design, our exploratory analysis suggests that automated measurement of peripheral BRB leakage on UWF-FA may hold promise as a tool to inform treatment decisions. Although the invasive nature of UWF-FA limits its routine use for detecting peripheral BRB leakage, emerging studies indicate that fluorescein angiography–like images may be synthesized non-invasively using generative AI models.23–25 These advances, along with our findings, suggest that personalized treatment approaches in CRVO are likely to become increasingly feasible.
Conclusions
This pilot study suggests that higher peripheral BRB leakage at baseline, particularly in the nasal and inferior retina, may be associated with a better visual response to intravitreal bevacizumab in patients with CRVO. Quantitative analysis of UWF-FA could therefore provide valuable information for identifying patients most likely to benefit from anti-VEGF therapy. Notably, further validation in a larger dataset is needed to improve the predictive performance of UWF-FA measures, as this exploratory study achieved AUC values that are promising but not yet sufficient for clinical application. Larger, prospective studies using standardized treatment protocols are therefore warranted to validate these preliminary findings and optimize the clinical utility of UWF-FA-derived vascular metrics. In the future, UWF-FA–derived vascular metrics may have the potential to help define drug-specific responder profiles and guide personalized therapy, not only in CRVO but also in other retinal diseases such as diabetic retinopathy, age-related macular degeneration, and uveitis.
Ethics Approval and Informed Consent
The study was approved by the institutional ethics committee at Hadassah Medical Center (HMO 382-19) and conducted in accordance with the Declaration of Helsinki. As this is a retrospective study, the need for informed consent was waived by the committee. All patient data were handled confidentially and anonymized before inclusion in the study.
Acknowledgments
The authors wish to thank Dr. Alan Cruess for his substantial intellectual contributions and expert interpretation of the study findings.
Funding
This work was supported by a grant from the Israel Science Foundation (#3485/19); this funding organization had no role in the design or conduct of this research.
Disclosure
CM, LK, and AF are shareholders of Emagix Inc. In addition, CM, LK, and AF have patents “system and method for detecting and classifying retinal microaneurysms” and “system and method for simulation of fluorescein angiograms” pending. All other authors declare no competing interests in this work.
References
1. McAllister IL. Central retinal vein occlusion: a review. Clin Exp Ophthalmol. 2012;40(1):48–10. doi:10.1111/j.1442-9071.2011.02713.x
2. Noma H, Yasuda K, Shimura M. Cytokines and pathogenesis of central retinal Vein occlusion. J Clin Med MDPI. 2020;9(11):1–16. doi:10.3390/jcm9113457
3. Ding X, Li J, Hu X, Yu S, Tang S, Tang S. Prospective study of intravitreal triamcinolone acetonide versus bevacizumab for macular edema secondary to central retinal vein occlusion. Retina. 2011;31(5):838–845. doi:10.1097/IAE.0b013e3181f4420d
4. Epstein DL, Algvere PV, Von Wendt G, Seregard S, Kvanta A. Benefit from bevacizumab for macular edema in central retinal vein occlusion: twelve-month results of a prospective, randomized study. Ophthalmology. 2012;119(12):2587–2591. doi:10.1016/j.ophtha.2012.06.037
5. Hayreh SS, Podhajsky PA, Zimmerman MB. Natural history of visual outcome in central retinal vein occlusion. Ophthalmology. 2011;118(1):119–133.e2. doi:10.1016/j.ophtha.2010.04.019
6. Coscas G, Loewenstein A, Augustin A, et al. Management of retinal vein occlusion - Consensus document. Ophthalmologica. 2011;226(1):4–28. doi:10.1159/000327391
7. Serlin Y, Tal G, Chassidim Y, et al. Novel fluorescein angiography-based computer-aided algorithm for assessment of retinal vessel permeability. Chaum E ed.. PLoS One. 2013;8(4):e61599. doi:10.1371/journal.pone.0061599
8. Abbasnejad A, Tomkins-Netzer O, Winter A, et al. A fluorescein angiography-based computer-aided algorithm for assessing the retinal vasculature in diabetic retinopathy. Eye. 2022;37(7):1293–1301. doi:10.1038/s41433-022-02120-4
9. Huang RS, Mihalache A, Popovic MM, et al. Artificial intelligence-based extraction of quantitative ultra-widefield fluorescein angiography parameters in retinal vein occlusion. Can J Ophthalmol. 2024;60(3):177–185. doi:10.1016/j.jcjo.2024.08.002
10. Prasad PS, Oliver SCN, Coffee RE, Hubschman JP, Schwartz SD. Ultra wide-field angiographic characteristics of branch retinal and hemicentral retinal vein occlusion. Ophthalmology. 2010;117(4):780–784. doi:10.1016/j.ophtha.2009.09.019
11. Huang RS, Mihalache A, Popovic MM, et al. Quantitative fluorescein angiography biomarkers in diabetic macular edema. Retina. 2025;45(6):1125–1133. doi:10.1097/IAE.0000000000004424
12. Huang RS, Mihalache A, Popovic MM, et al. Association of Intravenous fluorescein angiography and adaptive optics imaging in diabetic retinopathy: a prospective case series. Retina. 2023. doi:10.1097/IAE.0000000000004012
13. Huang RS, Mihalache A, Popovic MM, et al. Artificial intelligence-enhanced analysis of retinal vasculature in age-related macular degeneration. Retina. 2024;44(9):1478–1485. doi:10.1097/IAE.0000000000004159
14. Prager O, Chassidim Y, Klein C, Levi H, Shelef I, Friedman A. Dynamic in vivo imaging of cerebral blood flow and blood-brain barrier permeability. Neuroimage. 2010;49(1):337–344. doi:10.1016/j.neuroimage.2009.08.009
15. Schoknecht K, Prager O, Vazana U, et al. Monitoring stroke progression: in vivo imaging of cortical perfusion, blood-brain barrier permeability and cellular damage in the rat photothrombosis model. J Cereb Blood Flow Metab. 2014;34(11):1791–1801. doi:10.1038/jcbfm.2014.147
16. Sun JK, Beaulieu WT, Melia M, et al. Defining “strong” versus “weak” response to antivascular endothelial growth factor treatment for center-involved diabetic macular edema. Retina. 2023;43(4):616–623. doi:10.1097/IAE.0000000000003730
17. Beck RW, Moke PS, Turpin AH, et al. A computerized method of visual acuity testing. Am J Ophthalmol. 2003;135(2):194–205. doi:10.1016/S0002-9394(02)01825-1
18. Wang X, Sun G, Yi Z, et al. Leakage index on ultra-widefield fluorescence angiography in different regions of retina and its correlation with cystoid macular edema in central retinal vein occlusion eyes. Graefes Arch Clin Exp Ophthalmol. 2021;259(8):2149–2156. doi:10.1007/s00417-021-05126-y
19. Ertop M, Yaylacıoğlu Tuncay F, Arıbaş YK, et al. Evaluation of central and peripheral retinal vascular changes in the fellow eyes of patients with unilateral retinal vein occlusions. Turk J Ophthalmol. 2023;53(6):349–355. doi:10.4274/tjo.galenos.2023.94389
20. Chatziralli I, Touhami S, Cicinelli MV, et al. Disentangling the association between retinal non-perfusion and anti-VEGF agents in diabetic retinopathy. Eye. 2022;36(4):692–703. doi:10.1038/s41433-021-01750-4
21. Ip MS, Scott IU, VanVeldhuisen PC, Oden NL, Blodi BA. Month 60 imaging findings and relationship to treatment outcomes following Anti-VEGF therapy for macular edema due to central or hemi-retinal vein occlusion. Am J Ophthalmol. 2024;260:147–159. doi:10.1016/j.ajo.2023.11.023
22. Singer M, Tan CS, Bell D, Sadda SR. Area of peripheral retinal nonperfusion and treatment response in branch and central retinal vein occlusion. Retina. 2014;34(9):1736–1742. doi:10.1097/IAE.0000000000000148
23. Munn C, Kamintsky L, Serlin Y, et al. RETICAD: a tool for generating dye-free fluorescein angiography and quantifying retinal disease activity. Inv Ophthalmol Visual Sci. 2024;65(7):3758.
24. Li W, He Y, Kong W, et al. SequenceGAN: generating fundus fluorescence angiography sequences from structure fundus image. Lect Notes Comput Sci. 2021:
25. Kamran SA, Hossain KF, Tavakkoli A, Zuckerbrod SL. Attention2AngioGAN: synthesizing Fluorescein Angiography from Retinal Fundus Images using Generative Adversarial Networks. In:
 © 2026 The Author(s). This work is published and licensed by Dove Medical Press Limited. The
full terms of this license are available at https://www.dovepress.com/terms
and incorporate the Creative Commons Attribution
- Non Commercial (unported, 4.0) License.
By accessing the work you hereby accept the Terms. Non-commercial uses of the work are permitted
without any further permission from Dove Medical Press Limited, provided the work is properly
attributed. For permission for commercial use of this work, please see paragraphs 4.2 and 5 of our Terms.
© 2026 The Author(s). This work is published and licensed by Dove Medical Press Limited. The
full terms of this license are available at https://www.dovepress.com/terms
and incorporate the Creative Commons Attribution
- Non Commercial (unported, 4.0) License.
By accessing the work you hereby accept the Terms. Non-commercial uses of the work are permitted
without any further permission from Dove Medical Press Limited, provided the work is properly
attributed. For permission for commercial use of this work, please see paragraphs 4.2 and 5 of our Terms.