Back to Journals » Clinical Epidemiology » Volume 17
Leveraging a Bayesian Approach in a Comparative Effectiveness Trial of Major Adverse Cardiovascular Events
Authors Lwin CT, Roumie CL ![]() , Greevy RA Jr, Beck C
, Greevy RA Jr, Beck C ![]() , Snyder KD, Hackstadt AJ
, Snyder KD, Hackstadt AJ ![]()
Received 13 May 2025
Accepted for publication 15 October 2025
Published 7 November 2025 Volume 2025:17 Pages 903—915
DOI https://doi.org/10.2147/CLEP.S540048
Checked for plagiarism Yes
Review by Single anonymous peer review
Peer reviewer comments 2
Editor who approved publication: Professor H Sorensen
Video abstract of “Bayesian Approach in Major Cardiovascular Events” [540048].
Views: 33
Cara T Lwin,1 Christianne L Roumie,2– 4 Robert Alan Greevy Jr,1,2,5 Cole Beck,1,2 Kathryn Diane Snyder,3 Amber J Hackstadt1,2,5
1Department of Biostatistics, Vanderbilt University School of Medicine, Nashville, TN, USA; 2Geriatric Research Education Clinical Center (GRECC) and the VETWISE-LHS Center of Innovation, Veteran Administration Tennessee Valley VA Health Care System, Nashville, TN, USA; 3Department of Medicine, Vanderbilt University Medical Center, Nashville, TN, USA; 4Department of Health Policy, Vanderbilt University Medical Center, Nashville, TN, USA; 5Center for Health Services Research, Vanderbilt University Medical Center, Nashville, TN, USA
Correspondence: Amber J Hackstadt, Vanderbilt School of Medicine, 2525 West End Avenue, Suite 1100, Nashville, TN, 37203-1741, USA, Email [email protected]
Purpose: We applied a Bayesian approach to further investigate the association of sodium–glucose cotransporter-2 inhibitors (SGLT2i) with the composite outcome of Major Adverse Cardiovascular Event and Heart Failure hospitalization (MACE+HF) and its individual components leveraging the ability of a Bayesian approach to incorporate prior clinical information and to make probability statements about the parameters.
Methods: We use a Bayesian time-to-event model, where the covariates are directly modeled in the hazard function. Following propensity score matching, we fit three Bayesian models; one with a relatively flat, normal prior on the SGLT2i coefficient (Uninformative) and 2 with informative priors from a meta-analysis (based on a cohort with no history of cardiovascular disease [No CVD] and cohorts with a history of CVD [CVD]). We estimate the posterior distribution for the hazard ratio (HR) using a Hamiltonian Monte Carlo algorithm. It allows us to estimate the probability of a meaningful protective association (HR < 0.90) in addition to point and interval estimates.
Results: The posterior means and 95% credible intervals for the HR suggested a protective association for SGLT2i versus dipeptidyl peptidase 4 inhibitors (DPP4i) for the MACE+HF outcome: No CVD: 0.82 (0.68, 0.96), CVD: 0.82 (0.71, 0.94), and Uninformative: 0.79 (0.65, 0.94). The probability of a meaningful protective association for the No CVD, CVD, and Uninformative priors were 88%, 92%, and 93%, respectively. The probability of a meaningful protective association for the HF hospitalization, CVD hospitalization and CVD death components of MACE+HF were 95%, 67%, and 93%, respectively.
Conclusion: The Bayesian analysis allowed for the incorporation of prior information via an informative prior and further investigation of the association between SGLT2 and the components of the MACE+HF composite outcome. It allowed for the calculation of an easily interpretable summary measure, the probability of a meaningful protective association.
Keywords: time-to-event analysis, bayesian inference, hamiltonian monte carlo, propensity score methods, cardiovascular disease, diabetes mellitus
Introduction
There have been several pivotal studies of sodium–glucose cotransporter-2 inhibitors (SGLT2i) and dipeptidyl peptidase 4 inhibitors (DPP4i) that evaluated major adverse cardiovascular events and heart failure hospitalization.1–12 Several studies have shown benefit in Major Adverse Cardiovascular Events and Heart Failure Hospitalization (MACE+HF) among those with preexisting cardiovascular disease (CVD) (secondary prevention), but results were more varied for those without a history of cardiovascular disease (primary prevention). Multiple cohort evaluations which utilized Cox proportional hazards analysis failed to find statistically significant effects and others found protective associations.5–12 Further, in a population without a history of heart failure, the CANVAS trial failed to identify a strong protective effect of SGLT2i (hazard ratio (HR): 0.87, 95% confidence interval (CI): 0.72, 1.06), but it did identify a strong reduction in MACE outcomes for those with a history of heart failure (HR: 0.61, 95% CI: 0.46, 0.80).5,8 Additionally, previous studies have estimated different effect estimates for SGLT2i for each type of cardiovascular event. A meta-analysis of SGLT2i trials on the composite of myocardial infarction, stroke, and cardiovascular death estimated an HR of 1.00 with a 95% CI of (0.87, 1.16) for a fixed effects model on patients with multiple risk factors. When focusing on heart failure (HF) hospitalizations and cardiovascular death, that same meta-analysis estimated an HR of 0.84 with a 95% CI of (0.69, 1.01) for a fixed effects model on patients with multiple risk factors.5
We previously reported that among a cohort of Veterans without a history of cardiovascular disease (primary prevention), SGLT2i for diabetes treatment was associated with reduced risk of heart failure hospitalization when compared with DPP4i. When performing a Cox proportional hazard analysis using propensity score weighting to balance covariates at baseline, the HR for SGLT2i versus dipeptidyl peptidase 4 inhibitors (DPP4i) for time to HF hospitalization only was estimated to be 0.73 with 95% CI of (0.54,0.97). When considering the composite outcome of MACE+HF, the HR for SGLT2i versus DPP4i was of 0.87 (95% CI: 0.74, 1.03).2
The inclusion of the null effect in the confidence interval for our previous study was met with skepticism as this result conflicted with previous studies that found a statistically significant beneficial association between SGLT2i and cardiovascular outcomes, but were restricted to a different population with cardiovascular disease.7,9 Additionally, we were concerned that some readers misinterpreted the Cox proportional hazard results for the composite outcome as a null effect of SGLT2i on cardiovascular outcomes. The failure to reject the null hypothesis does not necessarily provide strong support for the null hypothesis. The oversimplification that the null value in the 95% confidence interval demonstrates proof of the null persists even among well-trained medical professionals.
To address this skepticism for null effects and potential misinterpretations, we apply a Bayesian approach to further investigate the association of SGLT2i with MACE+HF and its components in a propensity score matched primary prevention cohort. The Bayesian approach allowed us to further investigate the differences in effect estimates seen for the individual components of the MACE +HF outcome (HF hospitalization, CVD hospitalization, and CVD death) using probability statements as opposed to hazard ratios and 95% confidence intervals, which can be misinterpreted. It also allowed us to incorporate prior knowledge and skepticism regarding a null effect using informative prior distributions.
Bayesian statistics assume that model parameters have an unknown distribution rather than one true value and use Bayes’ Rule to incorporate prior knowledge about this distribution. Inference is made using the posterior distribution of the parameters, which is proportional to the product of a prior distribution and a likelihood distribution.13,14 Prior information can be included via the choice of the prior distribution. If we are confident about the range of potential values for a parameter of interest, a highly informative prior with a small variance can be used. The posterior distribution will not be heavily influenced by new data, and the posterior distribution will resemble the prior distribution. On the other hand, in scenarios where the investigators are unsure about the values a parameter will take, the use of a less informative or “uninformative prior” with a larger variance and flatter shape can be chosen. The posterior is influenced to a greater degree by the new data and will resemble the likelihood more than the prior distribution.
A major benefit of the Bayesian approach is that it can provide an intuitive summary of the results, as the posterior distribution allows one to make probability statements about the parameters. For example, the Bayesian approach allows us to calculate 95% credible intervals by calculating the 0.025 and 0.975 percentile of the posterior distribution for a parameter of interest. We can then say there is a 95% probability that the true parameter value lies within the interval. Conversely, the interpretation of a frequentist confidence interval is not a probability statement.13,14
We apply Bayesian survival modeling to a large observational propensity score matched primary prevention cohort of United States Veterans to explore the association of SGLT2i with MACE+HF and its components. We incorporate prior beliefs and skepticism for a null association via an informative prior. We use the posterior distribution to estimate the probability of a meaningful protective association between SGLT2i and MACE+HF events and its components to provide an easily interpretable summary measure.
Methods
Data Set for the Bayesian Analysis
The Bayesian analysis is performed on a propensity score matched cohort obtained from a cohort of Veterans Health Administration (VHA) patients with diabetes mellitus (DM) who had a first prescription for a hypoglycemic medication between January 1, 2001, and December 31, 2016. Additional cohort data were obtained through December 31, 2019. The results and details of this cohort have been previously published.2 The study cohort includes Veterans aged 18 years or older with DM who were using metformin, sulfonylurea, or insulin alone, or in combination and later fill one of the following newer drug classes: SGLT2i and DPP4i. We further subset to patients without a history of cardiovascular diseases. The institutional review board of the VHA approved this study with a waiver of informed consent. In compliance with the Declaration of Helsinki, the research involved no more than minimal risk as it was a Phase 4 study of real prescribing patterns. The data accessed was limited to variables regularly stored in medical records and no individual participant was identifiable as the results were reported in aggregate. Patient data was kept on a secure VHA server, and the analysis was performed on anonymized data on secure VHA servers. The research could not have been carried out without the waiver as it was a retrospective study of a large number of Veterans and current contact information would likely be unavailable for a meaningful proportion of Veterans in the study.
The primary outcome was the time to the MACE + HF event. The outcome date was the hospital admission date for acute myocardial infarction, ischemic or hemorrhagic stroke, acute heart failure, or cardiovascular death date. The primary discharge diagnosis or underlying cause of death identified each event. We also evaluated each component separately, not censoring on the other components, except for cardiovascular death. The start of follow-up was the medication fill date of SGLT2i or DPP4i. The follow-up continued until an outcome or censoring event where censoring criteria included: death, study end date (December 31, 2019); non persistence (90 days without medication); crossover/addition of diabetes drug in a different class (eg, SGLT2i user who starts DPP4i) and the 181st day of no VHA contact (inpatient, outpatient, or pharmacy use).2
Propensity Score Matching
Propensity score matching, which is commonly used in large EHR-based studies, was used here as a data-preprocessing method to improve model performance and achieve covariate balance at baseline between the SGLT2i and DPP4i groups.15–17 The propensity score (PS) is the conditional probability of assignment to a treatment given a set of covariates.18 The propensity score is often calculated using a logistic regression model: 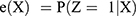 , where
  is the propensity score, Z is the exposure with 1 being exposed and 0 being unexposed, and X is a set of observed baseline characteristics. Once PS are calculated, they are used in varied manners as a data reduction technique and to achieve balance within a population. PS strategies including matching, stratification, inverse probability of treatment weighting (IPTW), and as a measure for covariate adjustment.15,19,20 In this analysis, we implemented propensity score matching using the nearest-neighbor approach and a caliper equal to 0.05, as it was simple to implement and adequately balanced the groups. To perform nearest neighbor matching, treated subjects are ordered randomly and are matched one at a time to the control subject with the closest propensity score. Once a pair is matched, they are removed from the matching pool. Matching continues until all treated subjects are matched or no additional acceptable matches can be made. Remaining observations are dropped if the difference in propensity scores is over the caliper.21,22 As a comparator to the Bayesian time-to-event analysis, we ran a Cox proportional hazards regression analysis on this newly created propensity score matched cohort.
Bayesian Time-to-Event Model
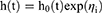
Like the Cox proportional hazards model, the proposed Bayesian approach also uses a hazard model with direct covariate adjustment. We assumed the following hazard function for episode  at time
  :
:

is a vector of the values of the  baseline covariates for episode
  , and
, and  is a vector of the corresponding coefficients.23 Also,
  is the baseline hazard function evaluated at
  and is estimated using monotone splines, also known as M-splines. M-splines are non-increasing or non-decreasing functions and are monotone piecewise polynomials that can be expressed in the following way:
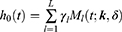
where  denotes the
  th basis term for a degree
  M-spline function evaluated at a vector of knot locations,
  , and
, and  is the lth M-spline coefficient.24 M-splines capture a non-linear but monotonic relationship, meaning that the hazard is either non-increasing or non-decreasing. They are flexible and allow for the approximation of complex functions by piecing together simpler polynomial functions in a smooth and continuous manner.23,24
We assumed  and let
  be an indicator of whether the episode
  is assigned to the treatment group, which in our case is SGLT2i versus DPP4i. Like in the Cox model,
  is the cause-specific hazard ratio (HR) for the treatment effect. A HR less than one suggests a protective association (lower association with the event in the next time period compared to a control subject). The posterior distribution for the HR was found by exponentiating posterior draws for
  . Bayesian modeling was performed using R Statistical Software25 (version 4.4.1) and the stan_surv() function in the rstanarm package.23,26 These packages fit the Bayesian model using an implementation of the Hamiltonian Monte Carlo method known as the No-U-Turn Sampler (NUTS).27
Specifying the Prior Distribution
We assumed fixed values for  and
and  . We fixed
  to be a vector with knots at the minimum timepoint, maximum timepoint and 3 internal knots at equal spaced percentiles, 25%, 50% and 75%. We fixed
  . For all parameters besides
  , we used the default suggestions in the stan_surv() function in the rstanarm package in R.23,26 A normal prior with mean 0 and a standard deviation of 20 is used for the intercept,
  . For the M-spline coefficients,
  , a Dirichlet prior with hyperparameter of a vector with all elements equal to 1 is used.
Priors Based on Prior Studies
For  , we can incorporate information from other studies by using a normal prior with the mean centered around the log of an estimate of HR in the literature and pick a standard deviation based on the corresponding confidence interval for HR. We performed a literature search and focused on a meta-analysis of cardiovascular outcome trials.5 This meta-analysis combined data from three cardiovascular outcome trials, finding a hazard ratio of 1.00 (0.87,1.16) in patients without cardiovascular disease and a hazard ratio of 0.86 (0.80,0.93) in patients with cardiovascular disease (CVD).5 Based on the hazard ratio 1.00 (0.87,1.16), we created an informative prior with normal distribution, a mean of
  , and a standard deviation (sd) of 0.220, referred to as the No CVD prior. The sd was first approximated based on the confidence interval (0.87, 1.16), and then tripled to allow for more variability in posterior draws.5 The sd based on (0.87,1.16) was approximated by taking the mean of
  and
and  and multiplying by 3 to get sd
  . We include the No CVD prior because it is a summary value from a systematic review of the effect of SGLT2i in studies done on patients without cardiovascular disease, which was our population of interest.
We also created a prior based on 0.86 (0.80,0.93) and refer to it as the CVD prior. Using a similar approach, we selected a normal distribution with mean of  and sd=
 . Although the subjects in our population do not have a history of cardiovascular disease, we included this prior because it incorporates information from published studies that suggest a protective effect of SGLT2 for the MACE+HF outcome.
Uninformative Normal Prior
The last prior considered in our Bayesian survival model is a normal distribution with a large variance (sd = 25) centered at 0. We called this prior the Uninformative prior as its shape is relatively flat compared to the other priors and will have a smaller influence on the posterior distribution of  and HR. In addition to fitting a Bayesian survival model for the MACE+HF outcome using the Uninformative prior, we evaluated separate Bayesian models using the Uninformative prior for the cause-specific hazard for each individual component of the MACE+HF outcome: heart failure hospitalization (HF), cardiovascular hospitalization (CVD Hospitalization), and cardiovascular death (CVD Death).
Probability of a Meaningful Protective Association
The time-to-event Bayesian model allows estimation of the probability of a meaningful protective association by using the posterior distribution of HR =  . We consider an HR less than 0.90 to be meaningful protective association based on the meta-analysis with estimate of HR = 0.86 for the cardiovascular cohort.5 The estimated probability that HR < 0.90 can be found by taking the number of posterior draws where
  and dividing by the number of posterior draws.
Results
Analytic Cohort
In the retrospective cohort, 129,834 episodes were included with 23,107 episodes for SGLT2i medication and 106,727 assigned DPP4i (reference). After fitting a logistic regression propensity score model using the covariates given in Table 1 and performing one-to-one matching using a caliper value of 0.05, we matched 21,821 episodes of SGLT2i to 21,821 episodes of DPP4i. A total of 1286 SGLT2i episodes were dropped due to the difference in propensity scores being above the caliper. The distributions of the propensity scores for SGLT2i and DPP4i groups are given in Supplemental Figure 1. After matching, all standardized mean differences of observed baseline covariates were below the threshold of 0.2 and all but one were at or below 0.05, indicating good balance between the groups. The study cohort prior to and after matching is summarized in Table 1.
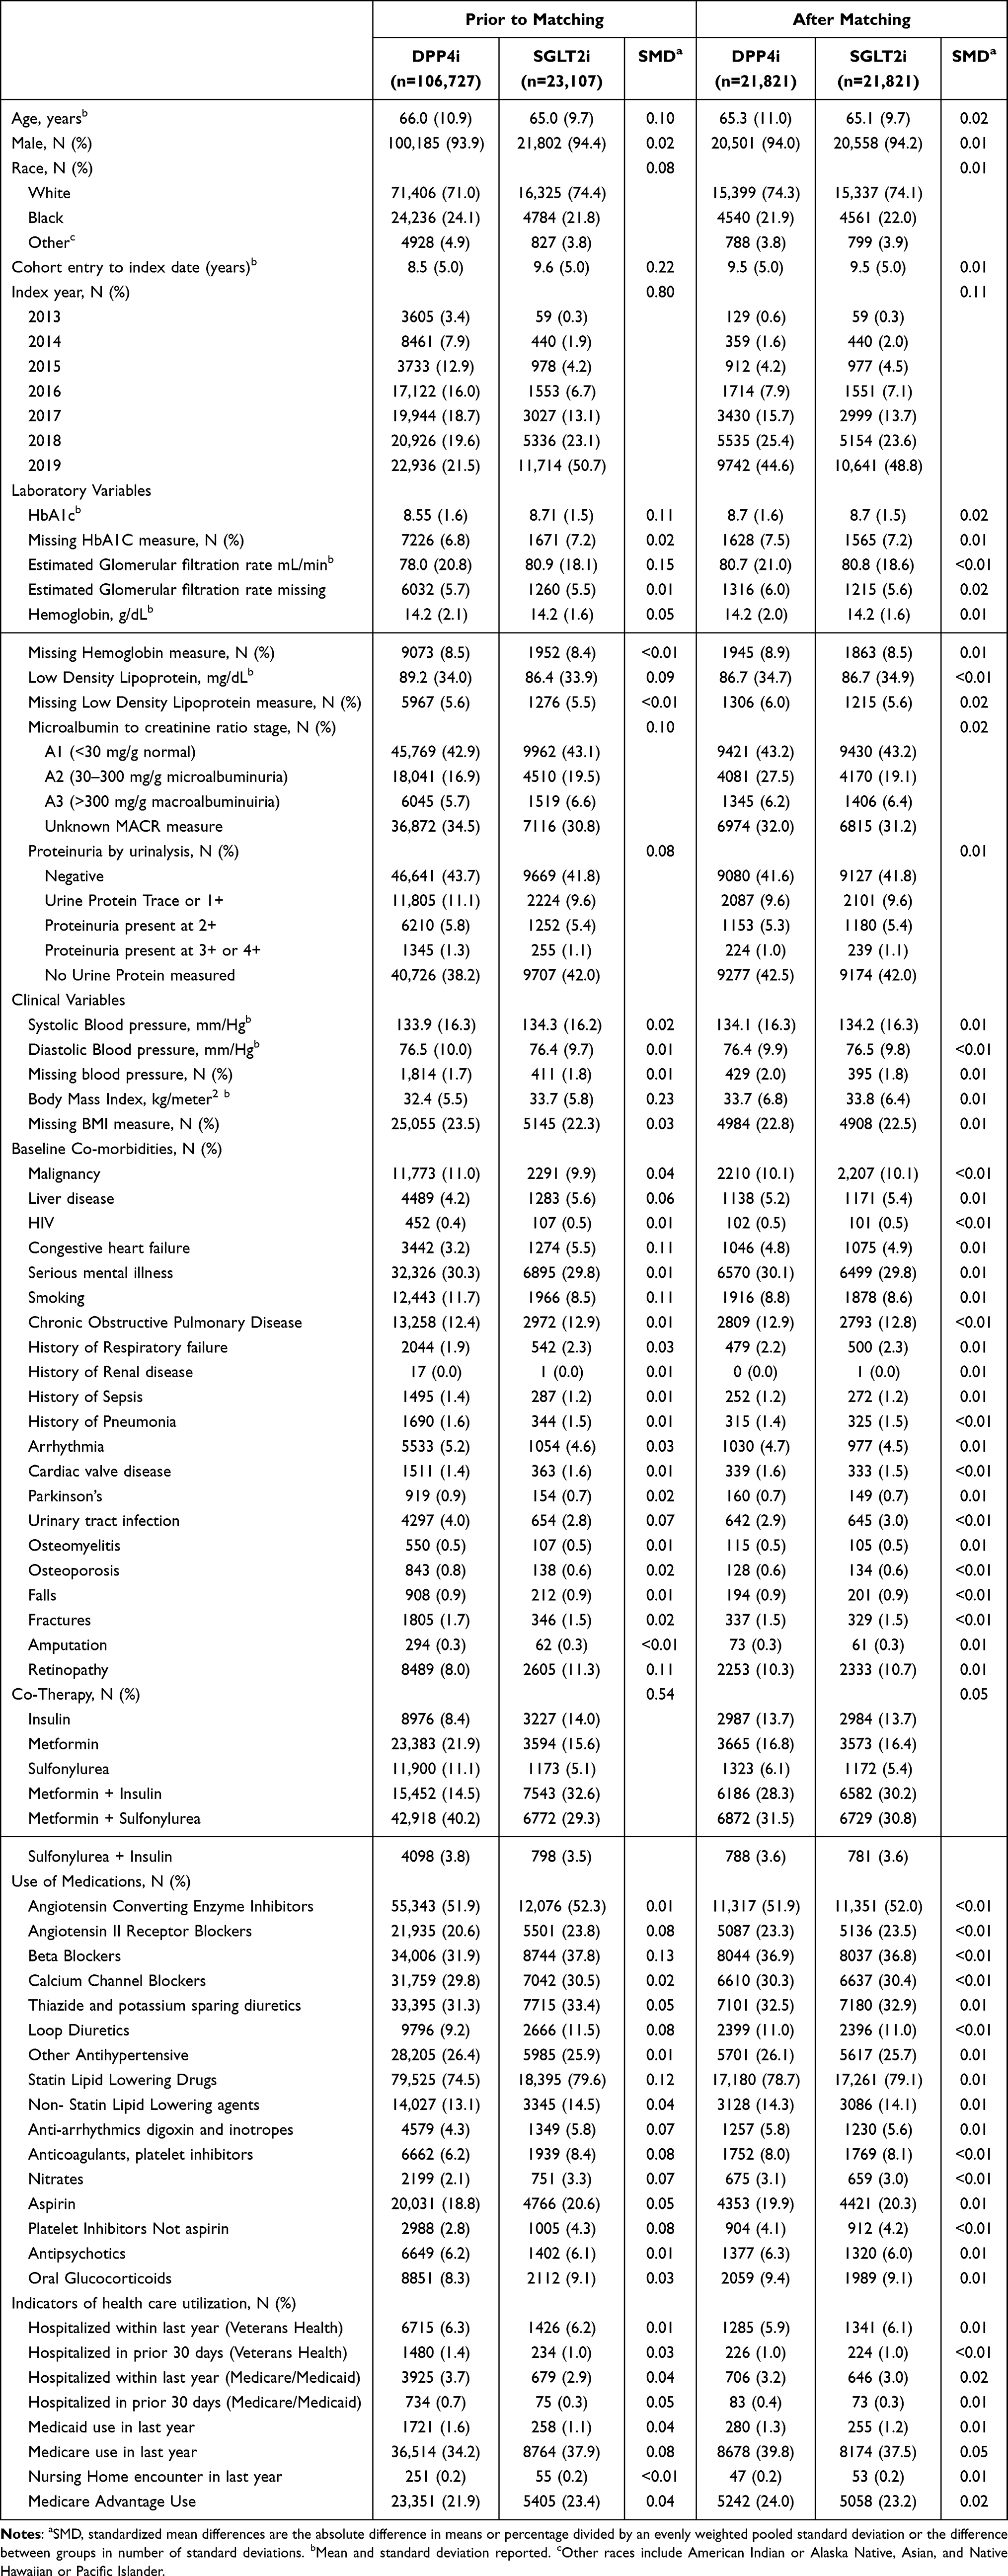 |
Table 1 Summary of Patient Characteristics Prior to and After Propensity Score Matching |
Primary Outcome: MACE+HF
In the matched cohort, there were 188 MACE+HF events for SGLT2i and 277 MACE+HF for DPP4i. The distributions of the three priors for  (No CVD, CVD, and Uninformative) used in the Bayesian time-to-event analysis are shown in Supplemental Figure 2. For each prior for
  , Figure 1 demonstrates the posterior distribution for the cause-specific hazard ratio,
  , for SGLT2i. The prior distributions influence both the location and shape of the corresponding posterior distributions. The estimated hazard ratios and corresponding 95% credible intervals differed by prior: No CVD: 0.82 (0.68,0.96), CVD: 0.81 (0.71,0.94), and Uninformative: 0.79 (0.65,0.94) but all suggest a protective association with the MACE+HF outcome (Table 2). The estimates of the HR and 95% credible intervals for the Bayesian analysis using the Uninformative prior were similar to the results found performing the Cox proportional hazards regression with an HR of 0.78 and 95% CI of (0.65, 0.95). The estimated values for the probability of a meaningful protective association also support a protective association and the probability of a meaningful protective association for the Bayesian model with the No CVD, CVD, and Uninformative priors were 88%, 92%, and 93%, respectively (Table 2). Focusing on the Bayesian time-to-event model with the Uninformative prior, the estimated survival function demonstrated greater survival probability for the SGLT2i for the MACE+HF outcome (Figure 2A).
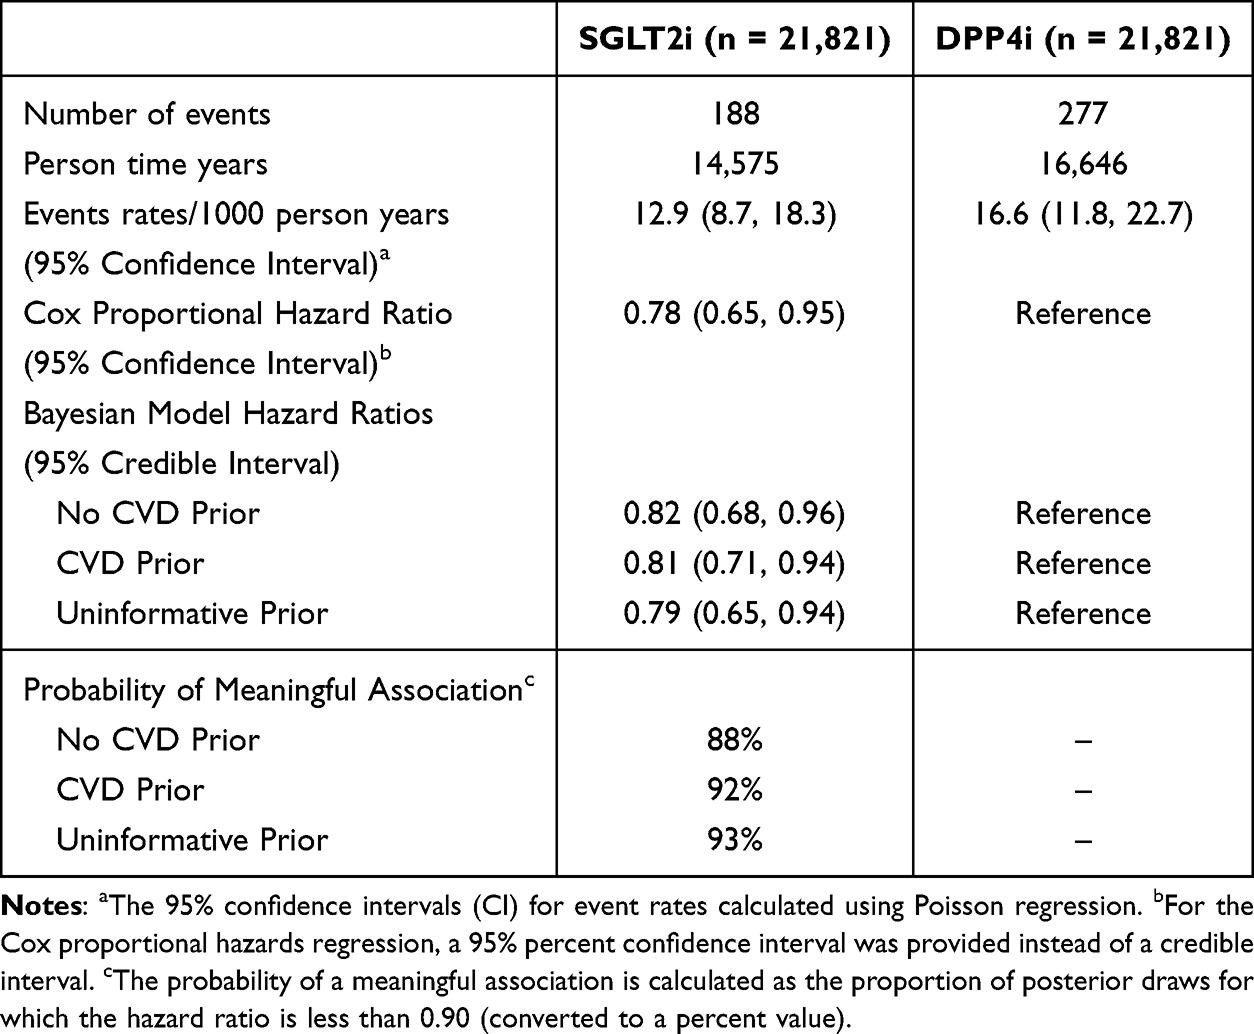 |
Table 2 Event Rates and Cause-Specific Hazard Ratios for Major Adverse Cardiovascular Events Plus Heart Failure |
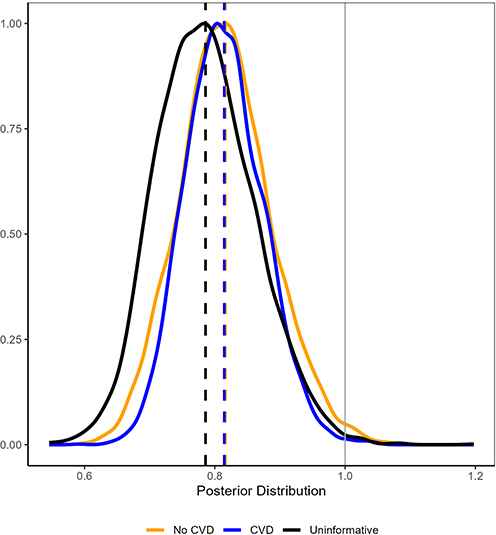 |
Figure 1 Posterior Distributions for the Cause-specific Hazard Ratio. The posterior distributions for the cause-specific hazard ratio for sodium–glucose cotransporter-2 inhibitors (SGLT2i) versus dipeptidyl peptidase 4 inhibitors (DPP4i) for the major adverse cardiovascular events plus heart failure (MACE+HF) outcome from the three different Bayesian models (No CVD: yellow, CVD: blue, Uninformative: black). The vertical dashed lines (No CVD: yellow, CVD: blue, Uninformative: black) denote the posterior means, and the vertical grey line denotes a null association. |
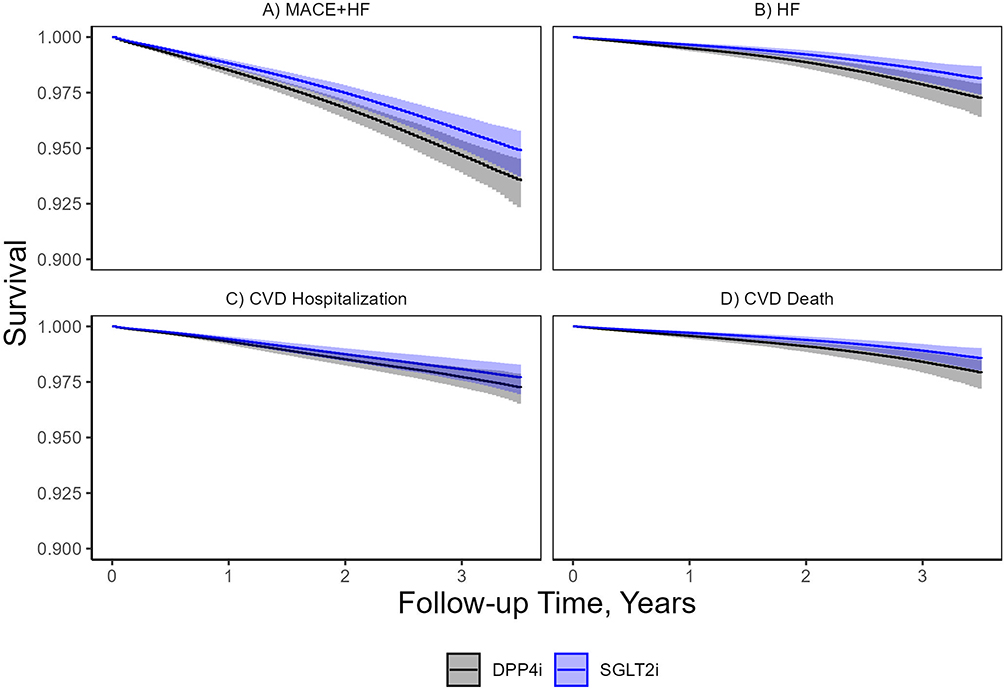 |
Figure 2 Survival Plots. Probability of survival for major adverse cardiovascular events plus heart failure ((A): MACE+HF) and its components ((B): HF, (C): CVD Hospitalization, and (D): CVD Death) among sodium–glucose cotransporter-2 inhibitors (SGLT2i) vs dipeptidyl peptidase 4 inhibitor (DPP4i) users without cardiovascular disease from the cause-specific Bayesian time-to-event analyses using the Uninformative prior. The blue line and blue shading provide the survival function and 95% pointwise prediction interval for SGLT2i users, respectively, and the black line and grey shading provides the survival function and 95% pointwise prediction interval for DPP4i users, respectively. |
Components of MACE+HF
In the matched cohort, there were 57 heart failure hospitalization (HF) events for SGLT2i and 98 HF for DPP4i (Table 3). For the Bayesian time-to-event model with the Uninformative prior and the HF outcome, the cause-specific hazard ratio estimate and 95% credible interval were 0.69 (0.49, 0.95). The HR estimate and the large probability of a meaningful protective association, 95%, suggests a protective association of SGLT2i. Evidence was less robust for a meaningful protective association of SGLT2i for the CVD hospitalization outcome. In the matched cohort, there were 91 cardiovascular hospitalization events for SGLT2i and 123 for DPP4i (Table 3). The cause-specific hazard ratio estimate was 0.86 (0.65, 1.10) and the probability of a meaningful protective association was 67%. There were 48 cardiovascular death events for SGLT2i and 81 for DPP4i (Table 3). The cause-specific hazard ratio estimate was 0.70 (0.48, 0.99) and the probability of a meaningful protective association was 93%. A comparison of the estimated cause-specific hazard ratios and probabilities of meaningful protective associations for the MACE+HF outcome and its components can be found in Figure 3. The survival functions for the components of the MACE+HF are shown in Figure 2B–D.
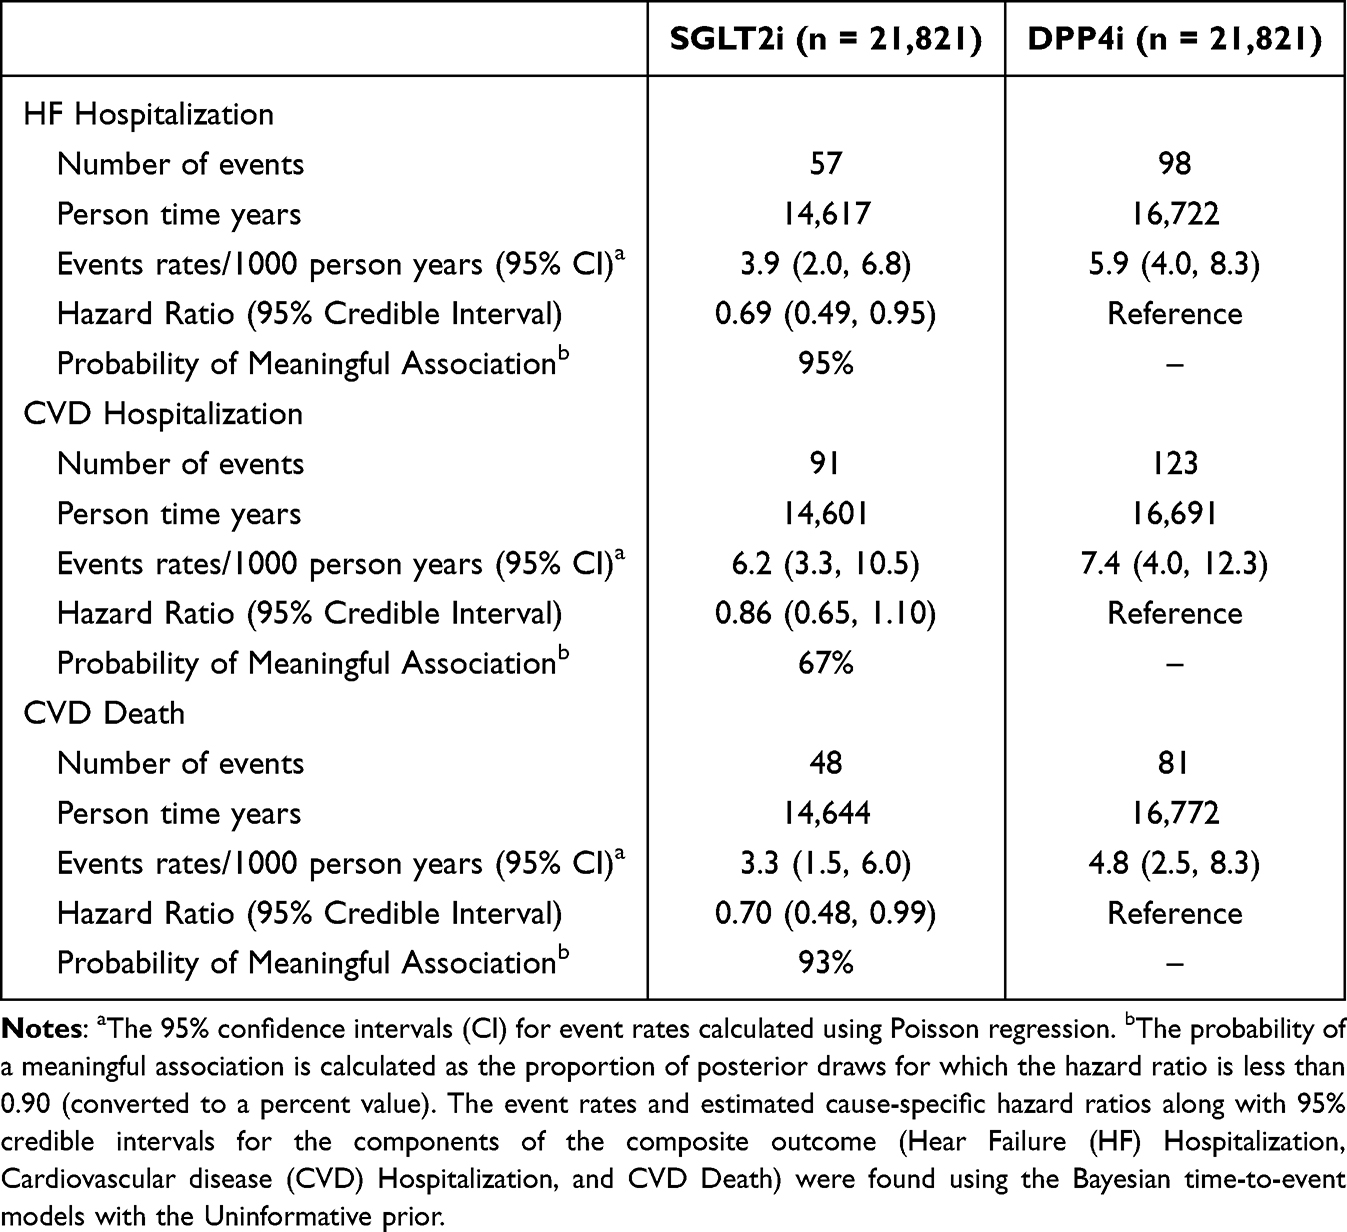 |
Table 3 Event Rates and Cause-Specific Hazard Ratios for the Components of the Major Adverse Cardiovascular Events Plus Heart Failure |
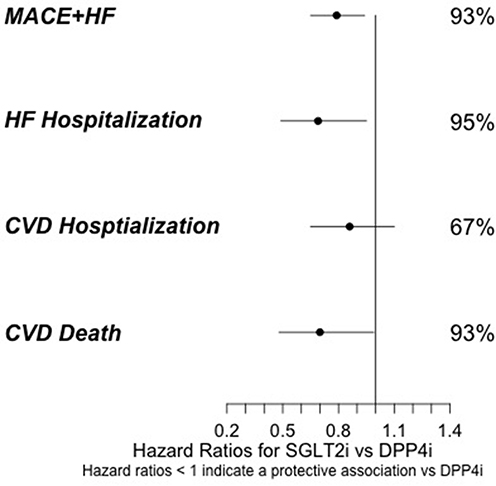 |
Figure 3 Hazard Ratio and Probability of Meaningful Association for MACE+HF and Components. The points are the estimated hazard ratios (HR) along with 95% credible intervals (horizonal lines) and the corresponding probability of a meaningful association (HR < 0.90) for the composite outcome of major adverse cardiovascular events plus heart failure (MACE+HF) and its components (HF Hospitalization, CVD Hospitalization, and CVD Death) found using the Bayesian time-to-event models with the Uninformative prior. |
Discussion
This study demonstrates that a Bayesian survival model is a useful tool for incorporating prior information into a time-to-event analysis. Using a normal prior for the coefficient of interest in the hazard function and selecting the mean and variance of the prior based on the previous effect estimates provides a straightforward way to incorporate information from previous studies. Informative priors are a systematic way to incorporate skepticism or favorability for clinically meaningful effects. The time-to-event Bayesian model provides probability statements regarding the protective association of SGLT2i using the posterior distributions of the hazard ratios. The probability statements guard against a common misinterpretation in Cox proportional hazard regression analyses, that the inclusion of 1 in the 95% confidence interval for the hazard ratio proves a null association. The Bayesian approach allows one to make probability statements about clinically meaningful effects in cardiovascular studies as opposed to simply stating whether a statistically significant effect was found. The probability of a meaningful effect is a more useful statistic for clinical decision-making than a p-value or even a confidence interval.
The results from all three Bayesian models estimated a protective association of SGLT2i versus DPP4i and the MACE+HF outcome. The strength of this association was dependent on both the observed data and prior data incorporated using the informative priors. We also note that protective effect estimates were not as strongly supported for all the components of the composite MACE+HF outcome. The probability of a protective association for CVD Hospitalization was much lower than the probability of a protective association for the composite MACE+HF outcome and the other MACE+HF components, HF hospitalization and Cardiovascular death: 67% versus 93%, 95%, and 93%, respectively. This may have contributed to the observed mixed results for the associations between SGLT2i and cardiovascular outcomes in the literature.
Limitations should be noted. Like many observational studies, this study has the possibility for unobserved confounding. Multiple steps including propensity score matching and the addition of multiple data sources (VHA, Medicare and Medicaid) address the issue of controlling for possible confounding; however, residual confounding may still be present. Since Veterans may not receive all their care at VHA facilities, misclassification of those without CVD may have occurred and outcomes may have been missed. Because we considered episodes of care in the time-to-event analysis and not individual patients, Veterans could enter the study cohort more than one time and have correlated observations. Use of a weighted propensity scores model and robust standard errors can address this limitation. Since the primary objective of this study was to explore the implementation of a Bayesian survival model, we opted to use propensity score matching instead of weighting. This approach allowed us to separate the implementation of the Bayesian survival model from the propensity score adjustment. The study population was mostly white men with a mean age above 65 years who, based on our data, did not have a history of CVD. Therefore, the results may not be generalizable to populations with lower representation in VHA. This study did not evaluate patients who initiated use of DPP4i or SGLT2i as first-line therapy. It should be noted that most patients added the DPP4i or SGLT2i onto existing combination regimens (as a third agent).
Conclusion
This study demonstrates that a Bayesian survival model can be a useful tool to incorporate prior information into a time-to-event analysis and help guard against the misinterpretations often arising from looking solely at the 95% confidence intervals of the hazard ratios. The Bayesian approach allows one to make probability statements about clinically meaningful effects.
Abbreviations
MACE+HF, Major Adverse Cardiovascular Events and heart failure; CVD, cardiovascular disease; SGLT2i, sodium–glucose cotransporter-2 inhibitors; DPP4i, dipeptidyl peptidase 4 inhibitors; HR, hazard ratio; PS, propensity score; VHA, Veterans Health Administration; DM, diabetes mellitus.
Data Sharing Statement
Data available to interested readers by contacting Dr. Roumie at [email protected].
Acknowledgments
The authors acknowledge the support for Veterans Affairs/Centers for Medicare & Medicaid Services data provided by the Department of Veterans Affairs, Veterans Affairs Health Services Research and Development Service, Veterans Affairs Information Resource Center. This project was funded by the VA Clinical Science research and Development investigator-initiated grant CX000570-12 (Roumie) and in part by the supported the VETWISE-LHS Center of Innovation through the Veterans Health Administration Office of Research and Development CIN 24-128 (Roumie, Greevy, Beck, Hackstadt). Drs. Roumie and Hackstadt were supported in part by the Center for Diabetes Translation Research P30DK092986.
Disclosure
Dr Amber Hackstadt and Mr. Cole Beck report grants from PCORI, outside the submitted work. Dr Amber Hackstadt reports support grants from Bristol Myers Squibb Foundation, outside the submitted work. The authors report no other conflicts of interest in this work.
References
1. Joseph JJ, Deedwania P, Acharya T, et al. American Heart Association Diabetes Committee of the Council on Lifestyle and Cardiometabolic Health; Council on Arteriosclerosis, Thrombosis and Vascular Biology; Council on Clinical Cardiology; and Council on Hypertension. Comprehensive management of cardiovascular risk factors for adults with type 2 diabetes: a scientific statement from the American Heart Association. Circulation. 2022;145:e722–e759. doi:10.1161/CIR.0000000000001040
2. Richardson TL Jr, Halvorson AE, Hackstadt AJ, et al. Primary occurrence of cardiovascular events after adding sodium-glucose cotransporter-2 inhibitors or glucagon-like peptide-1 receptor agonists compared with dipeptidyl peptidase-4 inhibitors: a cohort study in veterans with diabetes. Ann Intern Med. 2023;176:751–760. doi:10.7326/m22-2751
3. Green JB, Bethel MA, Armstrong PW, et al. Effect of sitagliptin on cardiovascular outcomes in type 2 diabetes. N Engl J Med. 2015;373:232–242. doi:10.1056/NEJMoa1501352
4. Scirica BM, Bhatt DL, Braunwald E, et al. Saxagliptin and cardiovascular outcomes in patients with type 2 diabetes mellitus. N Engl J Med. 2013;369:1317–1326. doi:10.1056/NEJMoa1307684
5. Zelniker TA, Wiviott SD, Raz I, et al. SGLT2 inhibitors for primary and secondary prevention of cardiovascular and renal outcomes in type 2 diabetes: a systematic review and meta-analysis of cardiovascular outcome trials. Lancet. 2019;393:31–39. doi:10.1016/s0140-6736(18)32590-x
6. Zheng SL, Roddick AJ, Aghar-Jaffar R, et al. Association between use of sodium-glucose cotransporter 2 inhibitors, glucagon-like peptide 1 agonists, and dipeptidyl peptidase 4 inhibitors with all-cause mortality in patients with type 2 diabetes: a systematic review and meta-analysis. JAMA. 2018;319:1580–1591. doi:10.1001/jama.2018.3024
7. Fitchett D, Zinman B, Wanner C, et al. Heart failure outcomes with empagliflozin in patients with type 2 diabetes at high cardiovascular risk: results of the EMPA-REG OUTCOME® trial. Eur Heart J. 2016;37:1526–1534. doi:10.1093/eurheartj/ehv728
8. Mahaffey KW, Neal B, Perkovic V, et al. Canagliflozin for primary and secondary prevention of cardiovascular events: results from the CANVAS program (Canagliflozin Cardiovascular Assessment Study). Circulation. 2018;137(4):323–334. doi:10.1161/circulationaha.117.032038
9. Wiviott SD, Raz I, Bonaca MP, et al. Dapagliflozin and cardiovascular outcomes in type 2 diabetes. N Engl J Med. 2019;380:347–357. doi:10.1056/NEJMoa1812389
10. McGuire DK, Shih WJ, Cosentino F, et al. Association of SGLT2 inhibitors with cardiovascular and kidney outcomes in patients with type 2 diabetes: a meta-analysis. JAMA Cardiol. 2021;6:148–158. doi:10.1001/jamacardio.2020.4511
11. McMurray JJV, Solomon SD, Inzucchi SE, et al. Dapagliflozin in patients with heart failure and reduced ejection fraction. N Engl J Med. 2019;381:1995–2008. doi:10.1056/NEJMoa1911303
12. Packer M, Anker SD, Butler J, et al. Cardiovascular and renal outcomes with empagliflozin in heart failure. N Engl J Med. 2020;383:1413–1424. doi:10.1056/NEJMoa2022190
13. Gelman A, Carlin JB, Stern HS, Rubin DB. Bayesian Data Analysis.
14. van de Schoot R, Depaoli S, King R, et al. Bayesian statistics and modelling. Nat Rev Method Primers. 2021;1:1. doi:10.1038/s43586-020-00001-2
15. Austin PC. A tutorial and case study in propensity score analysis: an application to estimating the effect of in-hospital smoking cessation counseling on mortality. Multivariate Behav Res. 2011;46:119–151. doi:10.1080/00273171.2011.540480
16. Yu J, Bandyopadhyay D, Yang S, et al. Propensity score modeling in electronic health records with time-to-event endpoints: application to kidney transplantation. J Data Sci. 2022;1–21. doi:10.6339/22-JDS1046
17. Ho D, Imai K, King G, et al. Matching as nonparametric preprocessing for reducing model dependence in parametric causal inference. Political Anal. 2007;15:199–236. doi:10.7910/DVN/RWUY8G
18. Rosenbaum PR, Rubin DB. The central role of the propensity score in observational studies for causal effects. Biometrika. 1983;70:41–55. doi:10.1093/biomet/70.1.41
19. Stuart EA. Matching methods for causal inference: a review and a look forward. Stat Sci. 2010;25:1–21. doi:10.1214/09-sts313
20. Johnson SR, Tomlinson GA, Hawker GA, et al. Propensity score methods for bias reduction in observational studies of treatment effect. Rheum Dis Clin North Am. 2018;44:203–213. doi:10.1016/j.rdc.2018.01.002
21. Ho D, Imai K, King G et al. MatchIt: nonparametric preprocessing for parametric causal inference. J Stat Softw. 2011;42(1):–. doi:10.18637/jss.v042.i08
22. Gu XS, Rosenbaum PR. Comparison of multivariate matching methods: structures, distances, and algorithms. J Comput Graph Stat. 1993;2:405–420. doi:10.1080/10618600.1993.10474623
23. Brilleman SL, Elci EM, Buros Novik J, Wolfe R. Bayesian survival analysis using the rstanarm R package. 2020. Available from: arXiv:2002.09633.
24. Ramsay JO. Monotone regression splines in action. Stat Sci. 1988;3:425–441 doi:10.1214/ss/1177012761
25. R Core Team. R: a Language and Environment for Statistical Computing. In: R Foundation for Statistical Computing. 2021.
26. Brilleman S, Crowther M, Moreno-Betancur M, et al. Joint longitudinal and time-to-event models via Stan. In: StanCon 2018. Pacific Grove, CA, USA; 2018.
27. Hoffman MD, Gelman A. The no-U-turn sampler: adaptively setting path lengths in hamiltonian monte carlo. J Mach Learn Res. 2014;15:1593–1623. doi:10.48550/arxiv.1111.4246
 © 2025 The Author(s). This work is published and licensed by Dove Medical Press Limited. The
full terms of this license are available at https://www.dovepress.com/terms
and incorporate the Creative Commons Attribution
- Non Commercial (unported, 4.0) License.
By accessing the work you hereby accept the Terms. Non-commercial uses of the work are permitted
without any further permission from Dove Medical Press Limited, provided the work is properly
attributed. For permission for commercial use of this work, please see paragraphs 4.2 and 5 of our Terms.
© 2025 The Author(s). This work is published and licensed by Dove Medical Press Limited. The
full terms of this license are available at https://www.dovepress.com/terms
and incorporate the Creative Commons Attribution
- Non Commercial (unported, 4.0) License.
By accessing the work you hereby accept the Terms. Non-commercial uses of the work are permitted
without any further permission from Dove Medical Press Limited, provided the work is properly
attributed. For permission for commercial use of this work, please see paragraphs 4.2 and 5 of our Terms.