Back to Journals » OncoTargets and Therapy » Volume 10
Leucine-rich glioma inactivated 3: integrative analyses support its prognostic role in glioma
Authors Kwon NS, Kim DS, Yun HY
Received 5 April 2017
Accepted for publication 2 May 2017
Published 24 May 2017 Volume 2017:10 Pages 2721—2728
DOI https://doi.org/10.2147/OTT.S138912
Checked for plagiarism Yes
Review by Single anonymous peer review
Peer reviewer comments 2
Editor who approved publication: Dr Yao Dai
Nyoun Soo Kwon, Dong-Seok Kim, Hye-Young Yun
Department of Biochemistry, Chung-Ang University, College of Medicine, Seoul, Republic of Korea
Background: Leucine-rich glioma inactivated 3 (LGI3) is a secreted protein member of LGI family. We previously reported that LGI3 was expressed in brain, adipose tissues and skin, where it played roles as a multifunctional cytokine. We postulated that LGI3 may be involved in cytokine network in cancers.
Aim: This study aimed to analyze differentially expressed genes in glioma tissues and glioma cohort data to investigate the prognostic role of LGI3 and its receptors.
Materials and methods: Expression microarray data from Gene Expression Omnibus and glioma cohort data were analyzed using bioinformatic tools for statistical analysis, protein–protein interactions, functional enrichment and pathway analyses and prognostic association analysis.
Results: We found that LGI3 and its receptors, ADAM22 and ADAM23, were significantly downregulated in glioma tissues. Eleven upregulated genes and two downregulated genes in glioma tissues were found to be the previously reported LGI3-regulated genes. Protein–protein interaction network analysis showed that 85% of the LGI3-regulated and glioma-altered genes formed a cluster of interaction network. Functional enrichment and Kyoto Encyclopedia of Genes and Genomes (KEGG) pathway analyses revealed the association of these genes with hypoxia responses, p53 and Akt signaling and various cancer-related pathways including glioma. Analysis of expression microarray data of glioma cohorts demonstrated that low expression levels of LGI3, ADAM22 and ADAM23 were significantly associated with poor prognosis of glioma.
Conclusion: These results propose that LGI3 and its receptors may play a prognostic role in glioma.
Keywords: LGI3, glioma, cytokine, cancer, prognosis
Introduction
Leucine-rich glioma inactivated 3 (LGI3) is a secreted protein member of LGI family that is abundantly expressed in brain in a developmentally regulated fashion.1 Expression of LGI3 in brain was shown to be transcriptionally regulated by activating enhancer-binding protein 2 and neuronal restrictive silencer.1 We reported that LGI3 regulated neuronal exocytosis and neurite outgrowth.2,3 LGI3 is also expressed in skin and adipose tissues.4,5 We showed that LGI3 secretion was induced by ultraviolet B (UVB) and promoted keratinocyte survival.5 We demonstrated that LGI3 promoted the migration of keratinocytes and melanogenesis.6,7
We reported that the expression of LGI3 was decreased during adipocyte differentiation and increased in obese adipose tissues.4,8 We further showed that LGI3 suppressed adipogenesis through a disintegrin and metalloproteinase domain-containing protein 23 (ADAM23) which is one of the LGI3 receptors (ADAM22 and ADAM23) and that LGI3 upregulated inflammatory genes including tumor necrosis factor-α (TNF-α) in macrophages.4 LGI3 downregulated the anti-inflammatory adipokine, adiponectin.8 LGI3 and TNF-α upregulated each other through NF-κB in preadipocytes, suggesting their cooperative involvement in metabolic inflammation in obesity.9 We proposed that LGI3 is a multifunctional cytokine and adipokine released by and acting at various cell types and that LGI3 may be a proinflammatory cytokine that interplayed with multiple cytokines.
The founding member of LGI family, LGI1, was shown to be deficient in malignant gliomas due to gene rearrangements and was postulated to be a tumor suppressor gene.10 LGI protein members (LGI1, LGI2, LGI3 and LGI4) were shown to be differentially expressed in various tumor cell types including glioma, neuroblastoma, melanoma, colon and breast cancers.11 However, the association of LGI3 with glioma and other cancers remained unexplored. In this study, integrative analyses of expression microarrays, protein–protein interactions and patient cohort data supported the potential significance of LGI3 in the prognosis of glioma.
Materials and methods
Expression microarray data
The dataset of mRNA expression microarray was searched and retrieved from Gene Expression Omnibus (GEO). The dataset, GSE4290, was based on the platform of GPL570 [HG-U133_Plus_2] Affymetrix Human Genome U133 Plus 2.0 Array (Affymetrix, Santa Clara, CA, USA).12 The dataset consisted of 180 samples from human brain tissues including 23 tissue samples from epilepsy patients and 157 tumor tissue samples from glioma patients. The raw data and the platform files were downloaded and used for further analysis.
Data preprocessing and identification of differentially expressed genes (DEGs)
The raw microarray data in CEL format were read using the affy package in R 3.3.1.13 The dataset was preprocessed by background correction, quantile normalization and probe summarization of expression values. The log2 probeset intensities were calculated using the robust multichip average (RMA) algorithm from the affy package.13 Gene expression values were averaged to calculate the final expression value for multiple probes corresponding to the same gene symbols. Probesets to non-expressed mRNAs were removed using the Affymetrix Microarray Suite 5 calls (MAS5CALLS) algorithm. Differential analysis was performed using the limma package in R 3.3.1. The cutoff values for statistically significant DEGs were P<0.05 and |log2 (fold change)|≥1.
Comparative analysis, protein–protein interactions and functional enrichment analysis of DEGs
Venn diagram of categorized gene groups was generated by Venny 2.0.2. The protein–protein interaction network was constructed using information provided by the Search Tool for the Retrieval of Interacting Genes (STRING, version 10.0)14 and was visualized by Cytoscape 3.4.0 using interaction degree-sorted circle layout.15 For functional enrichment of a group of regulated genes, gene ontology (GO) enrichment analyses and Kyoto Encyclopedia of Genes and Genomes (KEGG) pathway analysis were performed using Database for Annotation, Visualization and Integrated Discovery (DAVID).16 Results were ranked by their P-values, and the subsets of entries with the lowest P-values were presented.
Meta-analysis of patient cohorts
Gene expression microarray datasets for glioma were searched using PrognoScan database.17 Assessment of the association between gene expression and prognosis employed the minimum P-value approach by grouping patients for survival analysis that determined the optimal cut point in continuous gene expression measurement without prior assumption. Briefly, patients ordered by the expression values were dichotomized at the cut point to minimize the P-value, and survival difference between high and low expression groups was calculated by log-rank test. Kaplan–Meier plots of statistically significant (P<0.05) datasets were generated. Prognostic association analysis of combined multiple markers was conducted using ServExpress.
Results
Differential expression of LGI3 and its receptors in glioma
Previous study reported that LGI3 was expressed in various tumor cell lines and was expressed in approximately 50% of the glioma cell lines.11 Analysis of DEGs in glioma tissues indicated that the expression of LGI3 and its receptors, ADAM22 and ADAM23, were significantly lower than non-glioma tissues (LGI3, −15.6-fold, P=6.77E-38; ADAM22, −2.1-fold, P=1.73E-11; ADAM23, −1.8-fold, P=2.04E-05; Figure 1A). LGI3 was the 16th in the rank based on expression fold changes of the genes with decreased expression in glioma. It is noted that the standard deviation of LGI3 expression levels in glioma tissues was much larger than ADAM22 and ADAM23 (standard deviations of glioma and non-glioma samples: LGI3, 0.573 and 2.372; ADAM22, 0.474 and 0.998; ADAM23, 0.744 and 0.778; Figure 1B).
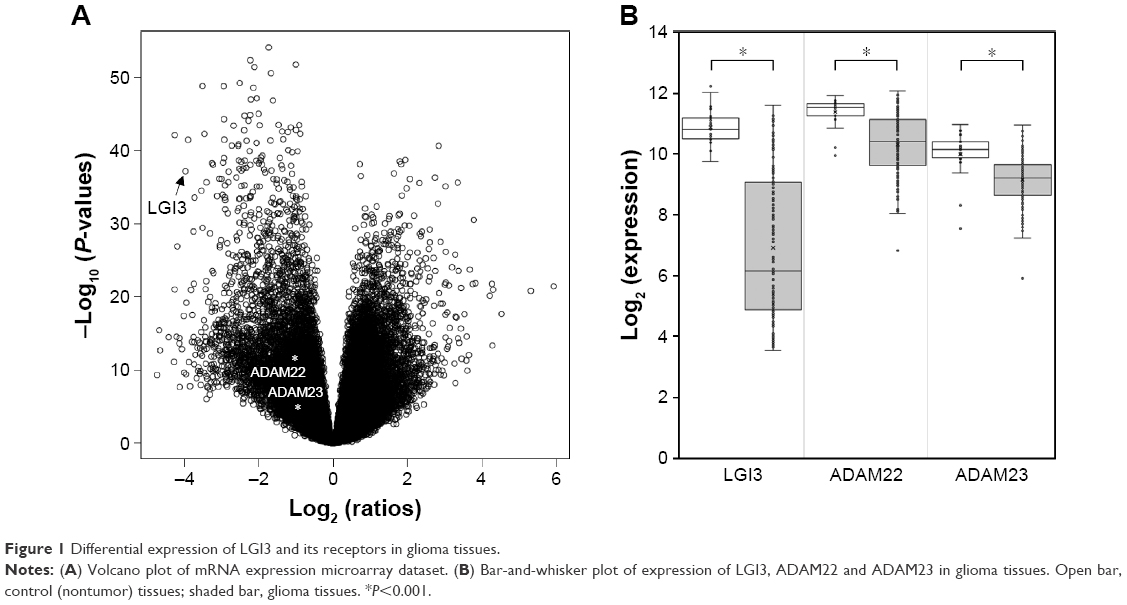 | Figure 1 Differential expression of LGI3 and its receptors in glioma tissues. |
Identification of LGI3-regulated genes that were altered in glioma and their protein–protein interaction network
Our recent work demonstrated that LGI3 regulated multiple gene products (ADIPOQ, AKT1, BAD, C5, CCL12, CCL2, CD68, CEBPA, CRP, CSF1, CSF3, CTNNB1, CXCL13, CXCL2, CYBA, CYBB, DLK1, EIF4EBP1, EMR1, ESM1, FABP4, GSK3A, GSK3B, IGF1, IGFBP1, IGFBP5, IL6, ITGAX, LPL, MAPK1, MAPK3, MDM2, MITF, NCF1, NCF2, NFKB1, NOS2, PIK3CA, PPARG, PRKAA1, PTEN, PTGS2, PTK2, SERPINE1, STX1A, TIMP1, TNF, TP53).18 Analysis of gene expression microarray dataset, GSE4290, showed that 1,812 genes were upregulated and 1,923 genes were downregulated in glioma tissues (P<0.05 and |log2 (fold change)|≥1). Venn diagram analysis of glioma-altered and LGI3-regulated genes revealed that four and seven glioma-upregulated genes belonged to LGI3-upregulated and LGI3-downregulated genes, respectively, and that two glioma-downregulated genes appeared to be LGI3-upregulated genes (Figure 2A). Overall, 39% (7/18) of LGI3-downregulated genes were upregulated in glioma, whereas 20% (6/30) of LGI3-upregulated genes were either up- or downregulated in glioma.
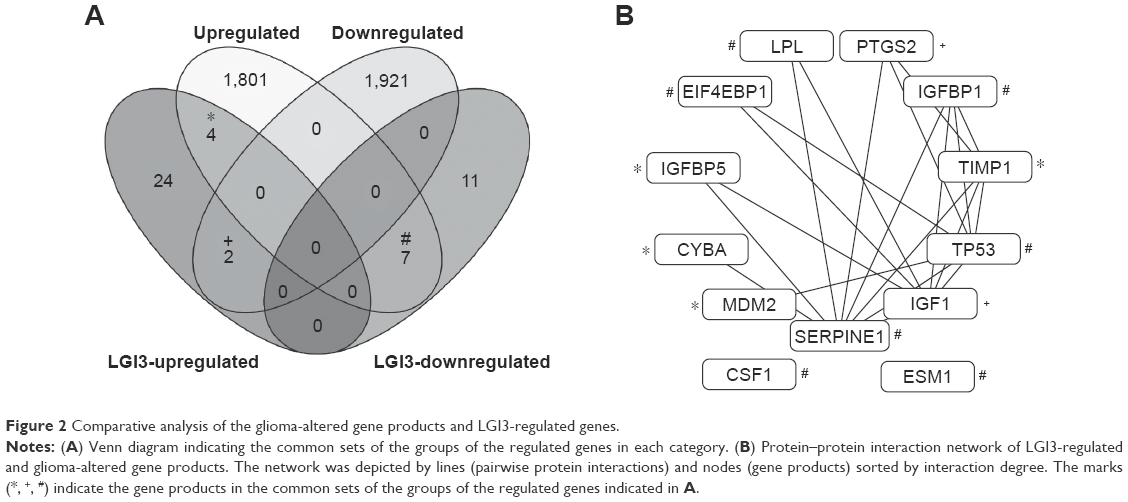 | Figure 2 Comparative analysis of the glioma-altered gene products and LGI3-regulated genes. |
We reported that a majority of LGI3-regulated gene products (94%, 45/48 genes) formed a cluster of protein–protein interaction network.18 Protein–protein interaction network analysis of LGI3- and glioma-regulated genes showed that 11/13 genes of glioma-altered and LGI3-regulated genes participated in a cluster of interaction network (Figure 2B). The gene products with the highest degree of interactions (≥5) were serpin family E member 1 (SERPINE1), insulin-like growth factor 1 (IGF1), tumor protein p53 (TP53) and TIMP metallopeptidase inhibitor 1 (TIMP1).
Functional enrichment and KEGG pathway analyses of LGI3-regulated and glioma-altered genes
LGI3-regulated genes that are changed in glioma tissues were analyzed by functional enrichment to obtain the GO biological processes of the gene group (Table 1). These genes were associated significantly with various cancer-related biological processes such as hypoxia, cell proliferation, metabolism, apoptosis, angiogenesis and inflammation. The GO term “hypoxia” showed the lowest P-value, and the protein binding was the GO term that the most genes were involved. The KEGG pathway analysis of LGI3-regulated and glioma-altered genes showed that these genes were associated with the pathways of p53, hypoxia-inducible factor-1 (HIF-1), phosphoinositide 3-kinase (PI3K)-Akt and other cancer-related pathways including glioma (Table 2). All the associated KEGG pathways appeared to be closely related to cancer.
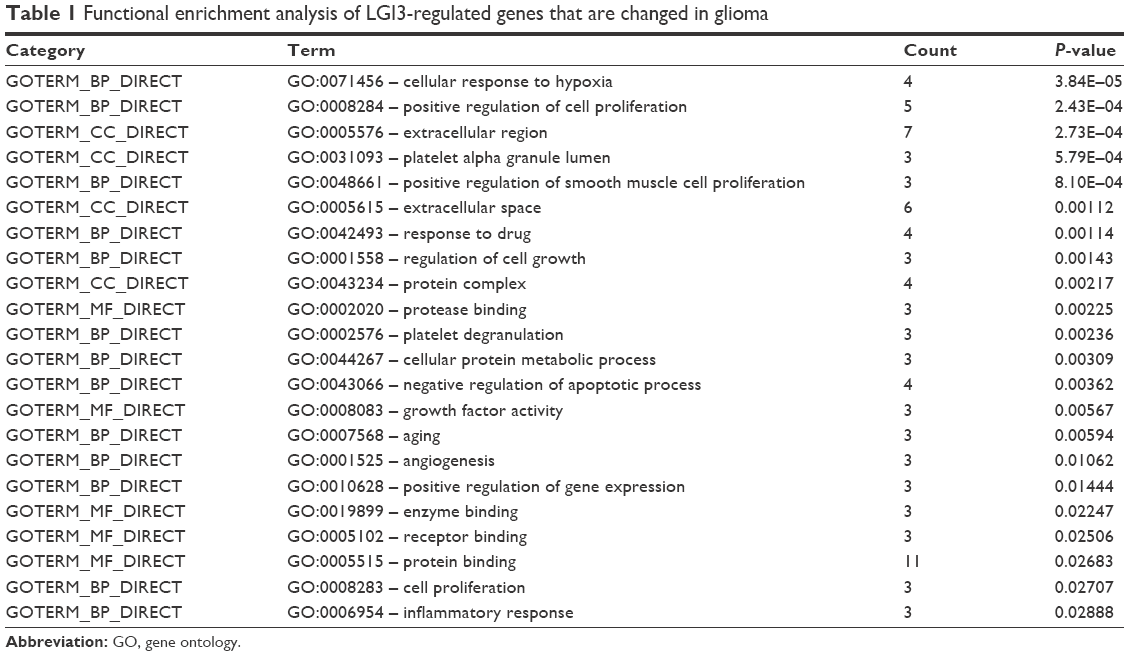 | Table 1 Functional enrichment analysis of LGI3-regulated genes that are changed in glioma |
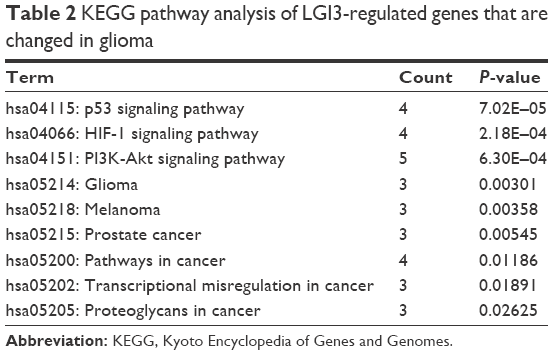 | Table 2 KEGG pathway analysis of LGI3-regulated genes that are changed in glioma |
Prognostic significance of LGI3 and its receptors in glioma
To investigate the significance of LGI3 expression in the prognosis of glioma, gene expression microarray datasets of cancer cohorts were analyzed. The search of PrognoScan databases that contained the expression of LGI3, ADAM22 and ADAM23 showed that two out of four glioma studies showed significant association (P<0.05) of LGI3 expression with glioma prognosis. Analysis of ADAM22 and ADAM23 expressions also revealed that 7 out of 18 and 4 out of 5 studies showed significant prognostic association, respectively. The low expression of LGI3, ADAM22 and ADAM23 correlated significantly with poor survival of the glioma patients (Table 3; Figure 3A–C).
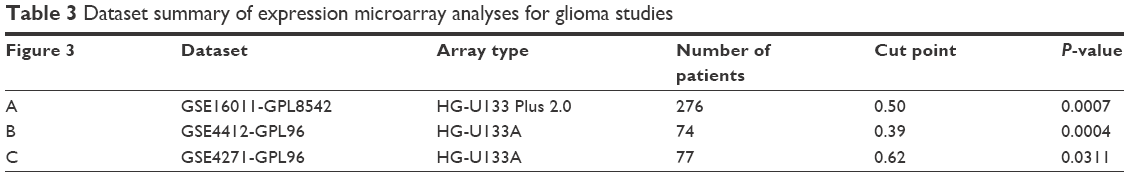 | Table 3 Dataset summary of expression microarray analyses for glioma studies |
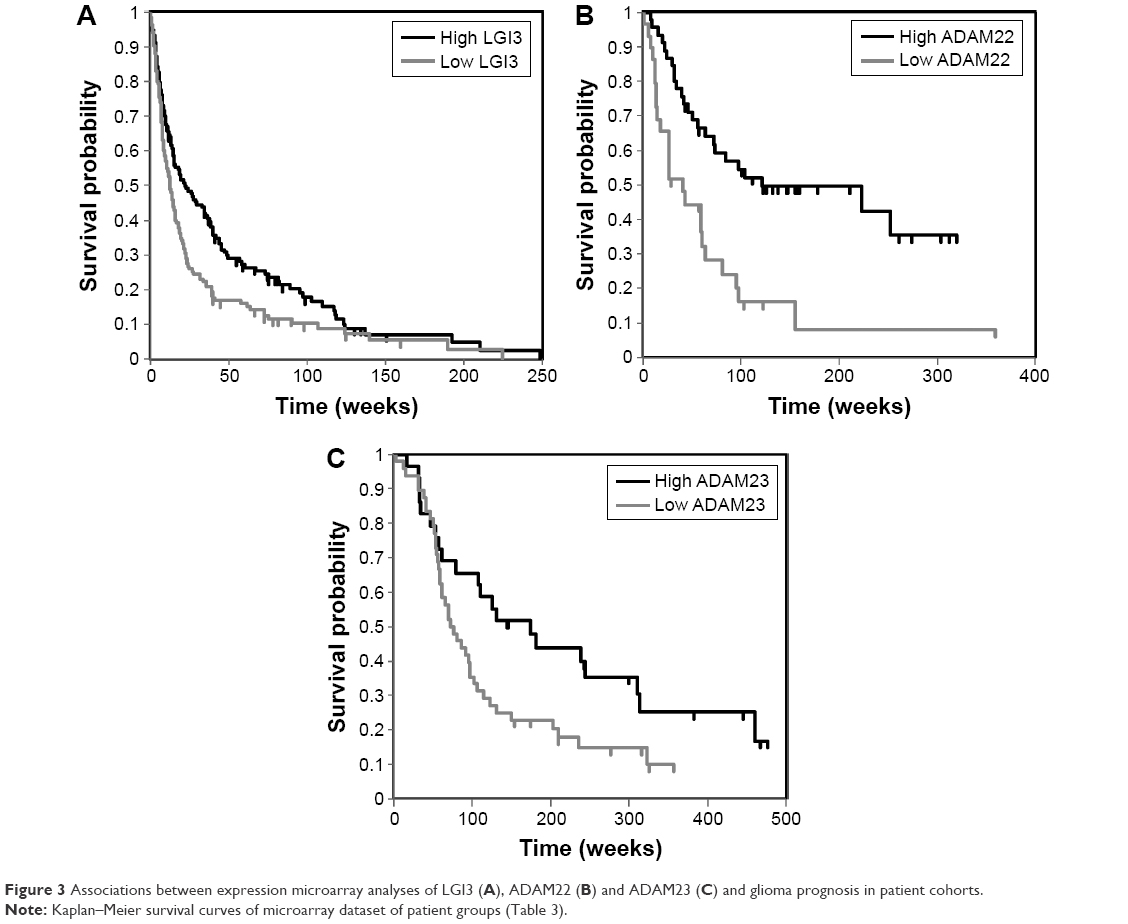 | Figure 3 Associations between expression microarray analyses of LGI3 (A), ADAM22 (B) and ADAM23 (C) and glioma prognosis in patient cohorts. |
Discussion
The LGI family members are diverse and distinct in their tissue distribution and physiological functions despite of the similarity in amino acid sequences and domain organizations.19,20 The expression profiles of LGI family genes in various tumor cells were not correlated with the normal cell origins, and LGI genes were postulated to have specific roles in normal and tumor cells.11 LGI protein members were shown to be differentially expressed in various types of tumor cells (glioma, neuroblastoma, melanoma, colon and breast cancers), and LGI3 was the only LGI family member expressed at significant levels in glioma, melanoma and neuroblastoma.11 This study was prompted by our previous reports supporting the roles of LGI3 as a multifunctional cytokine4–9 and the predicted association of LGI3 with cytokine network in cancer.18
In this study, integrative analysis of gene expression array data explored the potential prognostic value of LGI3 and its receptors, ADAM22 and ADAM23. Significant decreases of LGI3 and its receptors in glioma tissues (Figure 1) suggested that LGI3 may be involved in glioma tumorigenesis and progression through its receptor-mediated signaling pathway. Intracellular signaling mechanisms of LGI3 were reported in our previous works on various cell types. LGI3-promoted neurite outgrowth was mediated by Akt and FAK.3 p53 and MDM2 were shown to be involved in LGI3-promoted cell survival in UVB-irradiated keratinocytes.5 β-Catenin and GSK3β mediated keratinocyte migration induced by LGI3.7 LGI3 downregulated PPARγ and suppressed adipocyte differentiation through ADAM23.4 LGI3-treated preadipocytes showed the regulation of multiple signaling proteins (upregulated: Akt, AMPK, Erk1/2, PTEN; downregulated: 4E-BP1, Bad, GSK3α).18 Since ADAM22 and ADAM23 are abundant in brain,21 it remains to investigate whether LGI3-induced intracellular signaling pathways through these receptors are relevant and dysregulated in glioma cells.
Our previous studies identified 48 gene products that were regulated by LGI3.1–9,18 LGI3 was postulated to participate in cytokine network through regulating various cytokines and secreted factors including TNF-α, adiponectin, C–C motif chemokine ligand 2 (CCL2, MCP-1), C-X-C motif chemokine ligand 13 (CXCL13), C-X-C motif chemokine ligand 2 (CXCL2), C-reactive protein (CRP), TIMP1, colony-stimulating factor 1 (CSF1), CSF3, complement C5 (C5), endothelial cell-specific molecule 1 (ESM1), IGF1, insulin-like growth factor-binding protein 1 (IGFBP1), IGFBP5, interleukin 6 (IL6), lipoprotein lipase (LPL) and SERPINE1.18 Among the 13 LGI3-regulated genes that were up- or downregulated in glioma tissues (Figure 2A), a majority of the gene products formed a protein–protein interaction network (Figure 2B) and belonged to cytokines or secreted protein factors (IGFBP1, TIMP1, IGF1, SERPINE1, ESM1, CSF1, IGFBP5, LPL). Overall, these results implied that the downregulation of LGI3 may be involved in molecular perturbation that may affect cytokine network and intercellular communication in glioma.
Functional enrichment of GO terms and KEGG pathways associated with LGI3-regulated and glioma-altered genes represented many cancer-related terms and pathways such as hypoxia, proliferation, apoptosis, angiogenesis, p53 and HIF-1 (Tables 1 and 2). All these gene products except CYBA were found in the previous reports on glioma that described the association of expression, function or genetic variation of these genes with glioma.22–33 IGF1 and PTGS2 that were shown to be upregulated by LGI3 may be downregulated in glioma due to decreased expression of LGI3 and these genes were reported to be associated with glioma based on cellular radioprotection and genetic polymorphism, respectively.26,29 Seven genes (CSF1, EIF4EBP1, ESM1, IGFBP1, LPL, SERPINE1 and TP53) that were reported to be downregulated by LGI3 may be upregulated in glioma due to the downregulation of LGI3. In particular, CSF1, EIF4EBP1, SERPINE1 and TP53 (p53) were postulated to be functionally involved in glioma.22,30,32,33 Thus, we hypothesize that LGI3 downregulation in glioma may account for downregulation in glioma of the genes that were shown to be upregulated by LGI3 (IGF1 and PTGS2) and upregulation of the genes that were shown to be downregulated by LGI3 (CSF1, EIF4EBP1, ESM1, IGFBP1, LPL, SERPINE1 and TP53). LGI3 may interplay with these gene products through protein–protein interaction network (Figure 2B) in diverse mechanisms suggested by the functional enrichment and KEGG pathway analyses (Tables 1 and 2).
LGI3 is widely expressed in various tissues including brain, lung, adipose tissues, skin, heart, placenta, liver, muscle, kidney and pancreas.1,4,5,34 Abundant expression and its functional elucidation including LGI3-regulated genes were reported in neuronal cells, adipocytes, macrophages, keratinocytes and melanocytes.3–5,9 Our finding that the expressions of LGI3 and its receptors were positively associated with the prognosis of glioma (Figure 3) suggested that LGI3 may play a role as a suppressor of glioma progression through its receptor-mediated mechanisms. LGI3 was reported to transduce intracellular signals through proteins crucially involved in cancers including ADAM23, Akt, β-catenin, focal adhesion kinase, MDM2, p53, NF-κB and microphthalmia-associated transcription factor (MITF).3,5,6,9,35–38 Perturbation of these proteins by downregulated LGI3 and its receptors in glioma may account for the role of LGI3 in pathogenesis and prognosis in glioma and other cancers.18 Our additional analysis using The Cancer Genome Atlas (TCGA) databases showed significant positive prognostic association of LGI3 expression with lower grade glioma (P=0.05, N=206) and association of ADAM22 with glioblastoma multiforme (P=0.009, N=542) and lower grade gliomas (P=0.047, N=206; data not shown). These results suggested that LGI3 and ADAM22 may have higher prognostic value in lower grade glioma. Furthermore, our prognostic association analysis of combined markers (LGI3, ADAM22 and ADAM23) with TCGA lower grade glioma data showed much higher significance (P=0.00073) than individual markers (Table 3). Cumulative cohort studies for associations of individual and combined markers will support prognostic value of LGI3 and its receptors.
We postulated that LGI3 may participate in cytokine networks involved in obesity-related metabolic inflammation and cancer.18 Cytokine networks play important regulatory roles in inflammatory immune responses to cancer including glioma.39–41 Cytokines are also involved in chronic inflammation that may lead to carcinogenesis.39 Obesity increases cancer risk through cytokine perturbation by metabolic inflammation particularly in liver, pancreas and gastrointestinal tract.42 Increased LGI3 in adipose tissue and plasma in obesity may promote metabolic inflammation and cancer.4,8 However, epidemiological studies found no significant association between obesity and glioma.43,44 Thus, LGI3 may participate in cytokine network involved in glioma pathogenesis and prognosis that may not be closely associated with the previously reported LGI3-regulated adipokine network implicated in obesity.8,9 Although it remains unknown whether LGI3 downregulation correlates with poor prognosis of glioma through its decreased proinflammatory activity, we speculate that LGI3 may be involved in acute immune response that may suppress gliomagenesis rather than chronic inflammation that may promote glioma.
Conclusion
The current study proposed that LGI3 may play roles in a variety of biological processes through its receptor-mediated mechanisms in glioma. The results provided an integrative insight into the potential prognostic role of LGI3 and its receptors in glioma by showing the high degree interactions in the network of LGI3-regulated and glioma-altered gene products and the significant correlation of LGI3 expression with glioma prognosis.
Acknowledgment
This research was supported by the Basic Science Research Program through the National Research Foundation of Korea (NRF) funded by the Ministry of Education (grant number: NRF-2015R1D1A1A01056981).
Author contributions
All authors contributed toward data analysis, drafting and critically revising the paper, gave final approval of the version to be published, and agree to be accountable for all aspects of the work.
Disclosure
The authors report no conflicts of interest in this work.
References
Lee SE, Lee AY, Park WJ, et al. Mouse LGI3 gene: expression in brain and promoter analysis. Gene. 2006;372:8–17. | ||
Park WJ, Lee SE, Kwon NS, Baek KJ, Kim DS, Yun HY. Leucine-rich glioma inactivated 3 associates with syntaxin 1. Neurosci Lett. 2008;444(3):240–244. | ||
Park WJ, Lim YY, Kwon NS, Baek KJ, Kim DS, Yun HY. Leucine-rich glioma inactivated 3 induces neurite outgrowth through Akt and focal adhesion kinase. Neurochem Res. 2010;35(5):789–796. | ||
Kim HA, Park WJ, Jeong HS, et al. Leucine-rich glioma inactivated 3 regulates adipogenesis through ADAM23. Biochim Biophys Acta. 2012;1821(6):914–922. | ||
Lee SH, Jeong YM, Kim SY, et al. Ultraviolet B-induced LGI3 secretion protects human keratinocytes. Exp Dermatol. 2012;21(9):716–718. | ||
Jeong HS, Jeong YM, Kim J, et al. Leucine-rich glioma inactivated 3 is a melanogenic cytokine in human skin. Exp Dermatol. 2014;23(8):600–602. | ||
Jeong YM, Park WJ, Kim MK, et al. Leucine-rich glioma inactivated 3 promotes HaCaT keratinocyte migration. Wound Repair Regen. 2013;21(4):634–640. | ||
Kim HA, Kwon NS, Baek KJ, Kim DS, Yun HY. Leucine-rich glioma inactivated 3 associates negatively with adiponectin. Cytokine. 2013;62(2):206–209. | ||
Kim HA, Kwon NS, Baek KJ, Kim DS, Yun HY. Leucine-rich glioma inactivated 3 and tumor necrosis factor-α regulate mutually through NF-κB. Cytokine. 2015;72(2):220–223. | ||
Chernova OB, Somerville RP, Cowell JK. A novel gene, LGI1, from 10q24 is rearranged and downregulated in malignant brain tumors. Oncogene. 1998;17(22):2873–2881. | ||
Rossi MR, Huntoon K, Cowell JK. Differential expression of the LGI and SLIT families of genes in human cancer cells. Gene. 2005;356:85–90. | ||
Sun L, Hui AM, Su Q, et al. Neuronal and glioma-derived stem cell factor induces angiogenesis within the brain. Cancer Cell. 2006;9(4):287–300. | ||
Gautier L, Cope L, Bolstad BM, Irizarry RA. Affy-analysis of Affymetrix GeneChip data at the probe level. Bioinformatics. 2004;20(3):307–315. | ||
Szklarczyk D, Franceschini A, Wyder S, et al. STRING v10: protein-protein interaction networks, integrated over the tree of life. Nucleic Acids Res. 2015;43(Database issue):D447–D452. | ||
Lopes CT, Franz M, Kazi F, Donaldson SL, Morris Q, Bader GD. Cytoscape Web: an interactive web-based network browser. Bioinformatics. 2010;26(18):2347–2348. | ||
Huang DW, Sherman BT, Lempicki RA. Systematic and integrative analysis of large gene lists using DAVID bioinformatics resources. Nat Protoc. 2009;4(1):44–57. | ||
Mizuno H, Kitada K, Nakai K, Sarai A. PrognoScan: a new database for meta-analysis of the prognostic value of genes. BMC Med Genomics. 2009;2:18. | ||
Kim HA, Kwon NS, Baek KJ, Kim DS, Yun HY. Leucine-rich glioma inactivated 3: integrative analyses support its role in the cytokine network. Int J Mol Med. Epub 2017 May 15. | ||
Kegel L, Aunin E, Meijer D, Bermingham JR. LGI proteins in the nervous system. ASN Neuro. 2013;5(3):167–181. | ||
Kegel L, Jaegle M, Driegen S, et al. Functional phylogenetic analysis of LGI proteins identifies an interaction motif crucial for myelination. Development. 2014;141(8):1749–1756. | ||
Sagane K, Yamazaki K, Mizui Y, Tanaka I. Cloning and chromosomal mapping of mouse ADAM11, ADAM22 and ADAM23. Gene. 1999;236(1):79–86. | ||
De I, Steffen MD, Clark PA, et al. CSF1 overexpression promotes high-grade glioma formation without impacting the polarization status of glioma-associated microglia and macrophages. Cancer Res. 2016;76(9):2552–2560. | ||
Dong W, Gong H, Zhang G, et al. Lipoprotein lipase and phospholipid transfer protein overexpression in human glioma cells and their effect on cell growth, apoptosis, and migration. Acta Biochim Biophys Sin (Shanghai). 2017;49(1):62–73. | ||
He J, Reifenberger G, Liu L, Collins VP, James CD. Analysis of glioma cell lines for amplification and overexpression of MDM2. Genes Chromosomes Cancer. 1994;11(2):91–96. | ||
Lee SY, Kim JM, Cho SY, et al. TIMP-1 modulates chemotaxis of human neural stem cells through CD63 and integrin signalling. Biochem J. 2014;459(3):565–576. | ||
Lin RP, Yao CY, Ren DX. Association between genetic polymorphisms of PTGS2 and glioma in a Chinese population. Genet Mol Res. 2015;14(2):3142–3148. | ||
Maurage CA, Adam E, Mineo JF, et al. Endocan expression and localization in human glioblastomas. J Neuropathol Exp Neurol. 2009;68(6):633–641. | ||
Minchenko DO, Kharkova AP, Karbovskyi LL, Minchenko OH. Expression of insulin-like growth factor binding protein genes and its hypoxic regulation in U87 glioma cells depends on ERN1 mediated signaling pathway of endoplasmic reticulum stress. Endocr Regul. 2015;49(2):73–83. | ||
Osuka S, Sampetrean O, Shimizu T, et al. IGF1 receptor signaling regulates adaptive radioprotection in glioma stem cells. Stem Cells. 2013;31(4):627–640. | ||
Roy A, Coum A, Marinescu VD, et al. Glioma-derived plasminogen activator inhibitor-1 (PAI-1) regulates the recruitment of LRP1 positive mast cells. Oncotarget. 2015;6(27):23647–23661. | ||
Wang H, Wang H, Zhang W, Fuller GN. Overexpression of IGFBP5, but not IGFBP3, correlates with the histologic grade of human diffuse glioma: a tissue microarray and immunohistochemical study. Technol Cancer Res Treat. 2006;5(3):195–199. | ||
Zheng H, Ying H, Yan H, et al. p53 and Pten control neural and glioma stem/progenitor cell renewal and differentiation. Nature. 2008;455(7216):1129–1133. | ||
Zhu HL, Xie SM, Fang M, Zhang JJ, Weng ZP, Zhong XY. 4E-BP1 regulates the sensitivity of human glioma cells to chemotherapy through PI3K/Akt/mTOR-independent pathway. Neuropathology. 2014;34(3):227–235. | ||
Gu W, Wevers A, Schroder H, et al. The LGI1 gene involved in lateral temporal lobe epilepsy belongs to a new subfamily of leucine-rich repeat proteins. FEBS Lett. 2002;519(1–3):71–76. | ||
Costa FF, Verbisck NV, Salim AC, et al. Epigenetic silencing of the adhesion molecule ADAM23 is highly frequent in breast tumors. Oncogene. 2004;23(7):1481–1488. | ||
Ji Z, Erin CY, Kumar R, et al. MITF modulates therapeutic resistance through EGFR signaling. J Invest Dermatol. 2015;135(7):1863–1872. | ||
Sulzmaier FJ, Jean C, Schlaepfer DD. FAK in cancer: mechanistic findings and clinical applications. Nat Rev Cancer. 2014;14(9):598–610. | ||
Uzdensky AB, Demyanenko SV, Bibov MY. Signal transduction in human cutaneous melanoma and target drugs. Curr Cancer Drug Targets. 2013;13(8):843–866. | ||
West NR, McCuaig S, Franchini F, Powrie F. Emerging cytokine networks in colorectal cancer. Nat Rev Immunol. 2015;15(10):615–629. | ||
Lippitz BE. Cytokine patterns in patients with cancer: a systematic review. Lancet Oncol. 2013;14(6):e218–e228. | ||
Zhou C, Teng WJ, Zhuang J, et al. Analysis of the gene-protein interaction network in glioma. Genet Mol Res. 2015;14(4):14196–14206. | ||
Font-Burgada J, Sun B, Karin M. Obesity and cancer: the oil that feeds the flame. Cell Metab. 2016;23(1):48–62. | ||
Niedermaier T, Behrens G, Schmid D, Schlecht I, Fischer B, Leitzmann MF. Body mass index, physical activity, and risk of adult meningioma and glioma: a meta-analysis. Neurology. 2015;85(15):1342–1350. | ||
Wiedmann MK, Brunborg C, Di Ieva A, et al. The impact of body mass index and height on the risk for glioblastoma and other glioma subgroups: a large prospective cohort study. Neuro Oncol. Epub 2016 Dec 31. |
 © 2017 The Author(s). This work is published and licensed by Dove Medical Press Limited. The
full terms of this license are available at https://www.dovepress.com/terms
and incorporate the Creative Commons Attribution
- Non Commercial (unported, 3.0) License.
By accessing the work you hereby accept the Terms. Non-commercial uses of the work are permitted
without any further permission from Dove Medical Press Limited, provided the work is properly
attributed. For permission for commercial use of this work, please see paragraphs 4.2 and 5 of our Terms.
© 2017 The Author(s). This work is published and licensed by Dove Medical Press Limited. The
full terms of this license are available at https://www.dovepress.com/terms
and incorporate the Creative Commons Attribution
- Non Commercial (unported, 3.0) License.
By accessing the work you hereby accept the Terms. Non-commercial uses of the work are permitted
without any further permission from Dove Medical Press Limited, provided the work is properly
attributed. For permission for commercial use of this work, please see paragraphs 4.2 and 5 of our Terms.