Back to Journals » International Journal of Nanomedicine » Volume 13
Layer-by-layer DNA films incorporating highly transfecting bioreducible poly(amido amine) and polyethylenimine for sequential gene delivery
Authors Xie L, Ding X, Budry R, Mao G
Received 12 January 2018
Accepted for publication 9 March 2018
Published 31 August 2018 Volume 2018:13 Pages 4943—4960
DOI https://doi.org/10.2147/IJN.S162353
Checked for plagiarism Yes
Review by Single anonymous peer review
Peer reviewer comments 2
Editor who approved publication: Dr Thomas Webster
Lingxiao Xie, Xiong Ding, Rachel Budry, Guangzhao Mao
Department of Chemical Engineering and Materials Science, Wayne State University, Detroit, MI, USA
Background: The layer-by-layer (LbL) assembly method offers a molecular level control of the amount and spatial distribution of bioactive molecules. However, successful clinical translation of LbL film technology will most certainly require a better understanding and control of not only the film assembly process, but also film disassembly kinetics in physiologic conditions.
Purpose: This work focuses on the understanding and control of degradation properties of LbL films for localized gene delivery.
Methods: Bioreducible poly(amido amine)s (PAAs) containing cystaminebisacrylamide (CBA), methylenebisacrylamide, and 5-amino-1-pentanol (APOL) were synthesized by Michael addition polymerization for the construction of bioreducible LbL films capable of sequential gene delivery.
Results: The synthesized PAAs were screened for desirable buffering capacity, cell transfection, and cytotoxicity characteristics together with 25 kDa branched polyethylenimine (PEI) and cross-linked 800 Da PEI. By screening the various polycations we were able to identify a copolymer of CBA and APOL for the subsequent construction of the LbL films. By incorporating a highly transfecting polycation and a nondiffusing polycation we were able to improve the overall transfection of HEK293 and MC3T3 cells from the bioreducible LbL films. We also demonstrated the dual-stage release and transfection of two different DNAs from the LbL films.
Conclusion: The results indicate that LbL films consisting of bioreducible PAAs and non-diffusing polyelectrolytes have excellent degradation properties for the development of LbL coating technology for localized gene delivery applications.
Keywords: biodegradable polymers, cell transfection, interlayer diffusion, localized gene delivery, polyelectrolyte multilayers, sequential release
Introduction
This work focuses on the design of layer-by-layer (LbL) films for localized gene delivery by understanding and controlling film degradation properties. LbL films consisting of polyelectrolyte multilayers (PEMs)1–3 have become a popular coating method for the controlled release of DNA and other bioactive agents4–6 from a variety of implantable devices such as titanium,7,8 stainless steel stents,6,9,10 and microneedles.11,12 PEMs are assembled by a scalable process of repeated deposition of a polycation layer followed by a polyanion layer. The LbL assembly offers a molecular level control of the amount and spatial distribution of bioactive molecules unrivaled among biomedical coating methods. However, in order to achieve sequential release of bioactive molecules, one must pay special attention to the LbL film design in order to limit bulk degradation.13 Successful clinical translation of the LbL film technology will most certainly require a better understanding and control of not only the film assembly process but also film disassembly kinetics.
Polycations commonly used for systemic gene delivery, such as polyethylenimine (PEI), poly(L-lysine), and polysaccharides, form highly stable LbL films with DNA due to the polyvalent nature of their electrostatic interactions. The degradation of such films requires unphysiologic conditions. Strategies to design biodegradable LbL films include the use of hydrolytically and enzymatically degradable polycations.14–16 Another particularly successful strategy involves the use of disulfide containing polycations (bioreducible polycations) whose degradation can be triggered by endogenous chemicals such as glutathione and thioredoxin reductases.6,17–20 Bioreducible LbL films can be degraded by redox-active thioredoxin enzymes in the cellular plasma membrane in contact with the LbL films during cell attachment and proliferation.21–23 Relying on cellular exofacial redox activity of membrane proteins for LbL film disassembly offers major advantages over hydrolytic and enzymatic degradation mechanisms including stability in extracellular environment, responsiveness to redox gradients, and decreased cytotoxicity.
Successful applications of LbL films for gene delivery also require more efficient gene delivery vectors. PEI is one of the most successful polycation gene delivery vectors to date due to its buffering capability for endosomal escape of the gene payload and superior transfection efficiency.24,25 However, high molecular weight PEI (branched polyethylenimine [bPEI]) in various forms is toxic to many cell lines.26,27 Recent efforts have concentrated on reducing the cytotoxicity of PEI by using various low molecular weight PEI derivatives with biodegradable linkages.28 Bioreducible poly(amido amine)s (PAAs), the focus of our work, have shown improved safety over PEI as gene delivery vectors.6,13,29,30 Here, we examine a new type of PAA for LbL-based gene delivery. We applied the proton sponge hypothesis24,31 to screen for PAAs with high buffering capacity. For comparison, we included bPEI (25 kDa), low molecular weight PEI (800 Da), and a degradable PEI (dPEI) in this study (Scheme 1). We synthesized dPEI by cross-linking 800 Da PEI with a biodegradable cross-linker. The screening enabled the selection of the best PAA for the subsequent LbL film construction. In order to avoid uncontrolled bulk peeling of the films, we constructed bioreducible PAA/DNA films with periodically inserted diffusion barrier layers (Scheme 2). LbL film 1 is made of alternating layers of PAA and DNA with periodically inserted bPEI while LbL film 2 is made of PAA/DNA layers with periodically inserted dPEI. The film assembly process was monitored by atomic force microscopy (AFM) while the film disassembly in a reducing solution was monitored by AFM, fluorescence, and dynamic light scattering (DLS). Transfection experiments were conducted on human embryonic kidney (HEK) 293 cell line, fibroblast NIH3T3 cell line, and osteoblast MC3T3 cell line. We show that acid–base titration can be used to screen polyelectrolytes for their buffering capacity and transfection efficiency. We further show that the incorporation of a polyelectrolyte layer to limit interlayer diffusion is essential in achieving sequential DNA release from biodegradable LbL films.
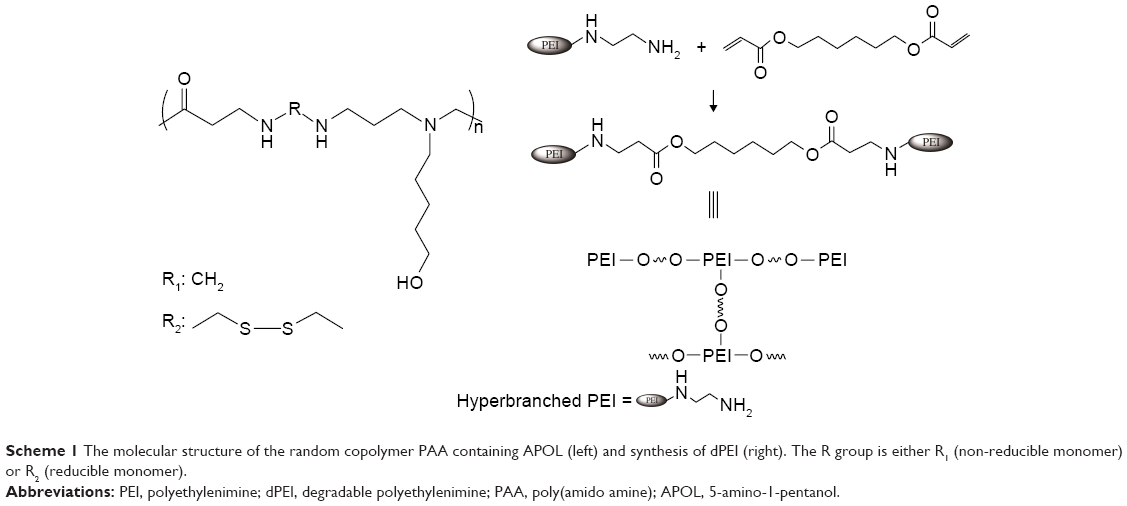 | Scheme 1 The molecular structure of the random copolymer PAA containing APOL (left) and synthesis of dPEI (right). The R group is either R1 (non-reducible monomer) or R2 (reducible monomer). |
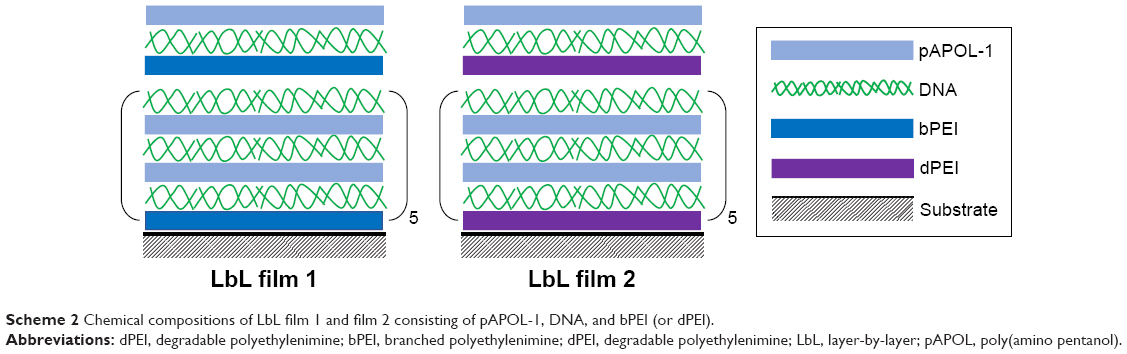 | Scheme 2 Chemical compositions of LbL film 1 and film 2 consisting of pAPOL-1, DNA, and bPEI (or dPEI). |
Materials and methods
Materials
N,N′-Methylenebisacrylamide (MBA, 99%), dithiothreitol (DTT, 99%), high molecular weight bPEI (weight-average molecular weight [Mw] ~25,000 Da, ≤1% water), low molecular weight bPEI (Mw ~800 Da), poly(2-hydroxyethyl methacrylate) (poly-HEMA, BioReagent grade), 1,6-hexanediol diacrylate (80%), 5-amino-1-pentanol (APOL, 95%), bovine serum albumin (BSA, heat shock fraction, pH 7, ≥98%), and fibronectin from human plasmid (0.1%) were purchased from Sigma-Aldrich Co. (St Louis, MO, USA). N,N′-Cystaminebisacrylamide (CBA, Electro Pure™) was purchased from PolySciences, Inc. (Warrington, PA, USA). Sodium chloride (NaCl, BioReagent) and sodium hydroxide (NaOH, BioReagent) were purchased from Thermo Fisher Scientific (Waltham, MA, USA). Sodium acetate anhydrous (NaOAc, 99%) was purchased from Mallinckrodt Chemicals (Staines-upon-Thames, UK). Minimum essential medium α (MEM α, nucleosides), Dulbecco’s Modified Eagle Medium (DMEM), PBS (pH 7.4), fetal bovine serum (FBS, certified, Gibco™), penicillin–streptomycin (10,000 U/mL), Vybrant® MTT Cell Proliferation Assay Kit, SYBR® Safe DNA gel stain (10,000× concentrate in DMSO), and 4-(2-hydroxyethyl)-1-piperazineethanesulfonic acid (1 M) were purchased from Thermo Fisher Scientific.
Water was deionized to 18 MΩ cm resistivity using the Nanopure System from Barnstead (Thermo Fisher Scientific). Glass slides, 15 mm in diameter, were purchased from Ted Pella (Redding, CA, USA). Glass slides were soaked in HCl and methanol mixture (v/v=1:1) for 30 minutes, then rinsed with deionized water for 2 minutes. After rinsing, the slides were immersed in 98% H2SO4 for another 30 minutes, followed by rinsing with deionized water.
Green fluorescence protein (GFP) reporter plasmid (pEGFP-N1 from Clontech, 4,700 bp; Takara Bio, Japan) and E2-Crimson reporter plasmid (pEF.myc.ER-E2-Crimson from Benjamin Glick, 6,263 bp) were prepared using Qiagen Plasmid Giga kit (Qiagen NV, Venlo, the Netherlands). The plasmid was isolated from bacterial lysate by anion-exchange column chromatography, and then concentrated and desalted by isopropanol precipitation, which was repeated in order to remove any protein residue.
Synthesis of bioreducible poly(amino pentanol)
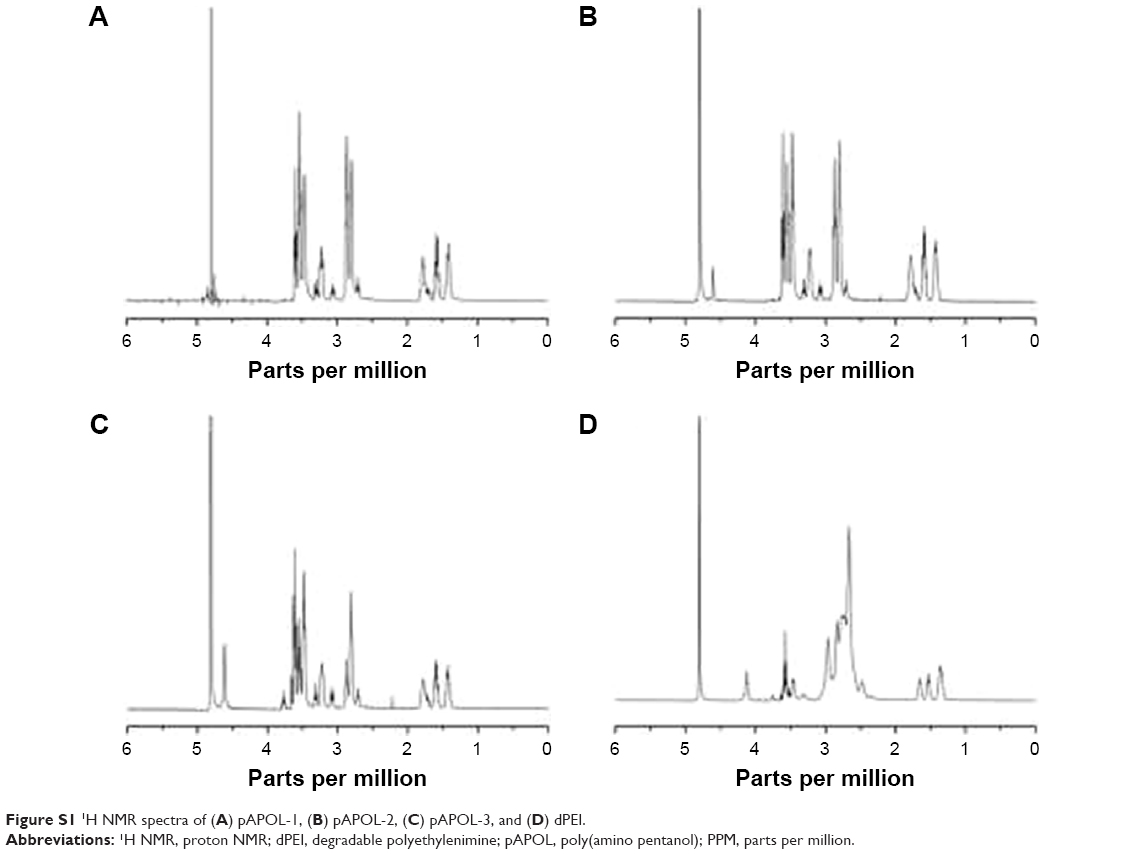
Bioreducible poly(amino pentanol) (PAAs) were synthesized by Michael addition copolymerization of equal molar ratios of monomer APOL and bisacrylamide monomers (CBA and MBA) by modifying literature procedures.32,33 In a typical reaction, CBA (309 mg, 3 mmol, 1 equiv) was dissolved in CH3OH/H2O (4/1 v/v, 3 mL); then, APOL (781 mg, 3 mmol, 1 equiv) was added followed by degassing with N2. The vial was wrapped with foil and then placed in a 50°C oil bath. This mixture was stirred for 10 days at 50°C to yield a light yellow viscous solution. Additional APOL (10 mol%) was added and the reaction continued for another 2 days in order to consume all CBA. After evaporating CH3OH, the solution was added dropwise into 20 mL 4°C acetone. The oil phase was washed with 4°C acetone (3×5 mL). After acetone evaporation, 5 mL water was added, and the pH of the solution was adjusted to 4 using 1 M HCl. The final product was a solid foam (520 mg, 48% yield) after freeze drying. Proton NMR (1H NMR), 400 MHz, D2O: δ1.29 (CH2CH2OH, 2H); δ1.45 (CH2CH2CH2OH, 2H); δ1.64 (CH2CH2CH2CH2OH, 2H); δ2.67 (NHCOCH2, 4H); δ2.72 (SSCH2CH2, 4H); δ3.09 (NCH2CH2CH2CH2CH2OH, 2H); δ3.33 (CH2CH2NCH2CH2, 4H); δ3.40 (SSCH2CH2, 4H); δ3.47 (CH2OH, 2H) (Figure S1A). Other PAAs containing different feed ratios of monomer CBA and MBA were synthesized similarly. PAA made with APOL:CBA:MBA =3:1:2 used 86 mg CBA (0.33 mmol, 1 equiv), 103 mg MBA (0.67 mmol, 2 equiv), and 103 mg APOL (1 mmol, 3 equiv). 1H NMR, 400 MHz, D2O: δ1.29 (CH2CH2OH, 2H); δ1.45 (CH2CH2CH2OH, 2H); δ1.64 (CH2CH2CH2CH2OH, 2H); δ2.67 (NHCOCH2, 4H); δ2.72 (SSCH2CH2, 4H); δ3.09 (NCH2CH2CH2CH2CH2OH, 2H); δ3.33 (CH2CH2NCH2CH2, 4H); δ3.40 (SSCH2CH2, 4H); δ3.47 (CH2OH, 2H); δ4.45 (NHCH2NH, 2H) (Figure S1B). PAA made with APOL:CBA:MBA =3:2:1 used 174 mg CBA (0.67 mmol, 2 equiv), 51 mg MBA (0.33 mmol, 1 equiv), and 103 mg APOL (1 mmol, 3 equiv). 1H NMR, 400 MHz, D2O: δ1.29 (CH2CH2OH, 2H); δ1.45 (CH2CH2CH2OH, 2H); δ1.64 (CH2CH2CH2CH2OH, 2H); δ2.67 (NHCOCH2, 4H); δ2.72 (SSCH2CH2, 4H); δ3.09 (NCH2CH2CH2CH2CH2OH, 2H); δ3.33 (CH2CH2NCH2CH2, 4H); δ3.40 (SSCH2CH2, 4H); δ3.47 (CH2OH, 2H); δ4.45 (NHCH2NH, 2H) (Figure S1C).
Synthesis of dPEI
dPEI was synthesized by cross-linking 800 Da PEI using 1,6-hexanediol diacrylate.34 One gram of 800 Da PEI was dissolved in 3 mL methylene chloride. Equimolar 1,6-hexanediol diacrylate was added dropwise. The reaction was carried out for 6 hours at 45°C with constant stirring. The polymer was precipitated with hexane and collected by freeze drying. The product was stored in liquid N2 until use. 1H NMR, 400 MHz, D2O: δ=3.9–4.0 (br m, 2H, NHCH2CH2COOCH2, ester linker), 3.3–3.5 (br m, 2H, OHCH2CH2, hydrolyzed ester), 2.4–2.8 (br m, 56H, [CH2CH2N]x[CH2CH2NH]y[CH2CH2NH2]z, PEI ethylenes), 2.38 (br m, 2H, NHCH2CH2COOCH2, ester linker), 1.6 (br m, 2H, COOCH2CH2CH2CH2CH2CH2 OH, ester linker), 1.4 (br m, 2H, COOCH2CH2CH2CH2CH2CH2 OH, ester linker), 1.1 (br m, 4H, COOCH2CH2CH2CH2CH2CH2 OH, ester linker) (Figure S1D).
Acid–base titration
The buffering capacity of the polycations was determined by acid–base titration. PAA, bPEI, or dPEI containing 0.1 mmol protonable amine groups was dissolved in 10 mL of 150 mM NaCl aqueous solution. The pH of the solution was adjusted to 2 using 1 M HCl. The solution was titrated with 100 mM NaOH. Buffering capacity is defined as the percentage of protonable amine groups that become protonated from pH 7.4 to 5.1 and can be calculated as follows:24,31
|
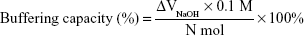
where ΔVNaOH is the titration volume of NaOH added to change the pH value from 5.1 to 7.4; N is the number of moles of protonable amine groups in the polymer.
Deposition of the LbL films
The LbL films were deposited by the dip coating method using a programmable Carl Zeiss HMS50 slide stainer (Carl Zeiss Meditec AG, Jena, Germany) with a homemade substrate holder following our previous work.13 The substrate holder containing five-pieces substrate was first dipped into the PAA or PEI solution (0.5 mg/mL in 30 mM pH 5.5 acetate buffer and with 0.1 M NaCl) for 10 minutes and then in the plasmid DNA solution (0.25 mg/mL in 30 mM pH 5.5 acetate buffer and with 0.1 M NaCl) for 10 minutes. Between each polycation and DNA dipping, the film was rinsed by deionized water for 5 minutes. The polycation and DNA deposition process was repeated to construct the desired number of layers. The dipping solution was refreshed every eight dipping cycles in order to minimize the concentration variation. All the films were terminated with the polycation layer.
AFM imaging
AFM imaging was conducted using Veeco Dimension 3100 AFM (Veeco Instruments, Inc., Plainview, NY, USA). When the tapping mode was used in air to measure the film thickness, the AFM probe used was a silicon probe tap 300-G (BudgetSensors, Sofia, Bulgaria) with a factory-specified resonant frequency of 300 kHz and a spring constant of 40 N/m. In order to measure the LbL film thickness, the film was scratched with a razor blade to expose a part of the glass substrate. Film thickness was determined by the step height between the substrate and the film surface using the sectional height analysis command of the Nanoscope software version 5.12 (Veeco Instruments, Inc.). The film thickness was measured in triplicate.
AFM contact mode in liquid was used to monitor film degradation in situ in 100 μL of 10 mM DTT in PBS buffer (pH 7.4) at room temperature using nonconductive silicon nitride probe NP-20 (Veeco Instruments, Inc.) with a nominal radius of 20 nm and a nominal cantilever spring constant of 0.32 N/m. AFM imaging ensued immediately after DTT solution injection. The surface was imaged continuously at an average rate of 1 Hz for 6 hours.
AFM contact mode in liquid and tapping mode in air were used to study polyplexes as well as the particles released from the bioreducible LbL films after the DTT reaction. In a typical experiment, a droplet of 50 μL polyplex (or solution containing the degradation product from the LbL films) was placed on a 1×1 cm2 freshly cleaved mica substrate. After 5-minute incubation in room temperature, the substrate was rinsed by deionized water to remove the excess solution. Nonconductive silicon nitride probes (NP-20; Veeco Instruments, Inc.) were used for the liquid contact mode. PBS buffer (100 μL) was added on the sample surface to cover the sample and probe. Particle size and volume were analyzed by Nanoscope software (version 5.12b; Veeco Instruments, Inc.). Bearing analysis command was used to calculate the particle volume. The analysis and calculation methods were the same as in our previous report.33
Fluorescence spectroscopy
The amount of DNA released from the LbL films was determined by a fluorimeter. The LbL films were immersed in 10 mM DTT in PBS buffer (pH 7.4). After the film was completely degraded, the solution in contact with the film was concentrated to 250 μL before labeling the DNA in the solution with 10,000× SYBR safe DNA stain (Thermo Fisher Scientific). In a typical experiment, SYBR safe DNA stain was first diluted in Tris-acetate-EDTA buffer, and 100 μL of the diluted solution was added to 250 μL concentrated DNA solution. Then, 150 μL labeled sample was pipetted into 96-well plates. The same procedure was used to prepare standard DNA solutions of 0, 5, 10, 15, 20, 25, 30, 35, and 40 μL/mL concentrations in order to construct the standard curve. The standard curve varies linearly with concentration and was used to determine the DNA amount released from the LbL films.
DLS
The particles in the LbL film degradation solution were analyzed using a Zetasizer (Nanosizer ZS; Malvern Instruments, Malvern, UK). In order to monitor the size of the particles released from the LbL films during reductive degradation in 10 mM DTT in PBS buffer (pH 7.4), the glass slide coated with the LbL films was cut into small pieces, 5 mm in diameter, to fit the microcuvette (ZEN0040; Malvern Instruments). We used three-dimensional printing to make a nylon microcuvette insert to hold the LbL sample in the top portion of the microcuvette. The microcuvette was filled with the DTT solution until just submerging the LbL films. The DLS measurements were performed immediately to determine the effective hydrodynamic diameter (DH) of the particles released from the LbL film. The backscattering angle Θ was fixed at 172° with a laser wavelength λ=633 nm. The size measurement range was set between 1 nm and 6 μm. DH is a function of the diffusion coefficient (D), temperature (T), and viscosity (η) according to the Stokes–Einstein equation: DH= kT/3πηD where k is the Boltzmann constant, T is 25°C, and D is obtained from the autocorrelation function via the cumulate fitting. Data were collected every 15 minutes in the first 24 hours and every 30 minutes after that. The DTT solution was refreshed every 24 hours. The film degradation was continuously monitored for 14 days.
In vitro cell transfection
HEK293 cells were purchased from American Type Culture Collection (ATCC, Manassas, VA, USA). NIH3T3 (organism: Mus musculus) was purchased from ATCC through Dr Wei-Zen Wei’s laboratory, Barbara Ann Karmanos Cancer Institute, Wayne State University. Osteoblast precursor MC3T3 cell line (from mouse calvaria) was purchased from ATCC through Dr Weiping Ren’s laboratory, Department of Biomedical Engineering, Wayne State University. HEK293 and NIH3T3 cells were cultured and maintained in DMEM supplemented with 10% FBS, 1% penicillin–streptomycin, and incubated at 37°C in a humidified incubator with 5% CO2. MC3T3 cells were cultured and maintained in MEM α supplemented with 10% FBS, 1% penicillin–streptomycin, and incubated at 37°C in a humidified incubator with 5% CO2. The medium was replaced every 2 days.
Transfection experiments using polyplexes were performed with HEK293, MC3T3, and NIH3T3 by using plasmid pEGFP-N1 as the report gene. Transfection experiments of each cell line were carried out in separate 24-well plates at an initial cell density of ~80,000 cells per well. Cells incubated for 24 hours (37°C in a humidified incubator with 5% CO2) had to be ~80% confluent before the polyplexes were added to the cell medium. Different basic amino acid residue-to-DNA phosphate molar ratios, the N/P ratios, from 6/1 to 24/1 were used to prepare the polyplexes. The cell medium was replaced with 300 μL fresh medium (without FBS) per well just before adding the polyplexes. Then, 50 μL solution of the polyplexes containing 1 μg DNA was added to each well. The cells were incubated with the polyplex containing transfection medium for 3 hours in a humidified incubator (37°C, 5% CO2). Next, the polyplex containing medium was removed from each well and replaced with 1 mL/well fresh cell culture medium containing FBS. After 24-hour incubation in the humidified incubator at 37°C with 5% CO2, cell images were captured by fluorescence microscopy. The polyplex transfection efficiency was determined by a flow cytometer, and cell viability was characterized by the MTT assay. All transfection experiments were carried out in triplicates.
In order to limit nonspecific cell attachments, the culture plates were coated with poly-HEMA. To apply the poly-HEMA coating, 100 mg poly-HEMA powder was dissolved in 5 mL ethanol and water mixture (v:v=95:1) by heating while stirring at 40°C. Then, 100 μL of filtered poly-HEMA solution was added into each well of the 24-well plate. The plate was kept in sterile conditions and dried overnight.
Transfection experiments on the LbL films were performed with HEK293 and MC3T3 using plasmid pEGFP-N1 and pEF.myc.ER-E2-Crimson as the reporter genes. LbL films deposited on 15 mm diameter glass coverslips were placed at the bottom of 24-well poly-HEMA-coated plates. The LbL films were sterilized under UV light for 1.5 hours before use. Fibronectin (40 μL) was added on the top of each film and allowed to dry in a sterilized environment for 2 hours. Then, the films were seeded with 1.5×10⁴ cells in DMEM culture medium containing 10% FBS and incubated at 37°C in a humidified incubator with 5% CO2. The culture medium was refreshed every 2 days. Cell attachment and proliferation were checked and imaged daily with an inverted optical microscope.
Cell viability assay
The number of viable cells was measured by using Vybrant MTT Cell Proliferation Assay Kit.35,36 The MTT assay value for untreated cells (ie, cells not exposed to the transfection medium or LbL film) was taken as 100% cell viability. Briefly, after 24-hour incubation of polyplex-treated cells, the cell culture medium was removed and replaced with 100 μL fresh culture medium. Then, 10 μL of 12 mM MTT stock solution was added to each well. After 4-hour incubation at 37°C, 100 μL sodium dodecyl sulfate (SDS)-HCl was added to each well and mixed thoroughly with a pipette. Cell incubation continued at 37°C in the humidified chamber for 10 hours. The absorbance was measured at 570 nm. The cells cultured on the LbL surface were treated with the MTT assay kit on day 6. The method followed the same procedure as described above. All experiments were performed in triplicates.
Flow cytometry
Flow cytometry measurements were performed on triplicates immediately after each collection of cultured cells. All the cells were trypsinized and resuspended in Fluorescence-activated cell sorting (FACS) buffer (1% BSA in PBS). All negative control experiments were conducted with cultures not exposed to polyplexes or grown on bare glass substrates without the LbL coating. All samples were measured with an Attune Acoustic Focusing Cytometer (Thermo Fisher Scientific) using 488 nm for GFP excitation. GFP fluorescence was detected using a photomultiplier tube with a 530/30 bandpass filter. An electronic gate encompassed live cells based on the forward and side scatter properties of the population and a minimum of 10,000 gated events per sample was collected and stored in list mode files. Data analysis was performed with Attune software version 2.1 (Thermo Fisher Scientific). Non-transfected cells were used for background calibration.
Results
Polymer synthesis and characterization
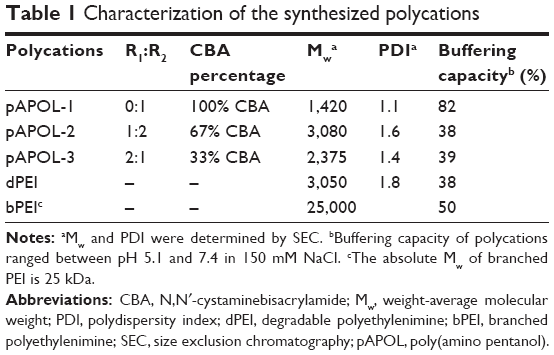
We employed Michael addition copolymerization of a primary amine monomer, APOL, and two bisacrylamide monomers, CBA and MBA, to prepare PAAs with different contents of disulfides by varying the CBA to MBA molar ratio (Scheme 1). The synthesized PAAs are linear polymers with various CBA/(CBA + MBA) percentages (33%, 67%, and 100%) according to the feed ratio. The polymer chemical composition was characterized by 1H NMR using a spectrometer (400 MHz) (Figure S1). The weight-average molecular weight (Mw) of three different poly(amino pentanol) (pAPOLs) (pAPOL-1, pAPOL-2, and pAPOL-3) is in the range of 1,200–3,200 with a polydispersity index (Mw/ [number-average molecular weight] Mn) range of 1.0–1.5 (Table 1). The low molecular weight of the pAPOLs is attributed to primary amines, such as APOL, being less nucleophilic than secondary amines, which limits the reaction rate and molecular weight in Michael addition polymerization.37 We synthesized dPEI by allowing 800 Da PEI to react with 1,6-hexanediol diacrylate.38,39 The acrylate group reacts with either a primary amine or a secondary amine resulting in a highly branched structure. The ester bonds in dPEI are susceptible to hydrolysis at physiologic conditions. Mw and Mw/Mn of PAAs and dPEI were determined by size exclusion chromatography in 0.3 sodium acetate (pH 4.4)/methanol (70/30, v/v) using Waters Alliance 2690 Separations Module (Waters Corporation, Milford, MA, USA) equipped with Waters Ultrahydrogel (500, 120 Å) column. Poly(ethylene glycol) (molecular weight of the peak maxima [Mp] =21,160 to 106 Da) was used as the standard.
 | Table 1 Characterization of the synthesized polycations |
We measured the buffering capacity of the synthesized PAAs in order to predict their gene delivery efficiency. The buffering capacity is defined as the percentage of amine groups becoming protonated when the pH changes from 7.4 to 5.1 during acid–base titration.24,31 The buffering capacity of pAPOL-1 was calculated to be 82% based on the volume of 0.1 M NaOH solution used to increase the pH value of the pAPOL-1 solution from 5.1 to 7.4 (Figure 1; Table 1). The pH range is chosen to correspond to the highest pH in the extracellular environment to the lowest endosomal pH.40 Of all the polymers studied, pAPOL-1 with 100% CBA displays the highest buffering capacity followed by bPEI with pAPOL-3, and pAPOL-2 and dPEI displaying the lowest buffering capacity.
 | Figure 1 Titration curves obtained by titrating polycation solution containing 0.1 mmol protonable amine group (dissolved in 10 mL 150 mM NaCl aqueous solution; pH 2, adjusted by 1 M HCl) with 0.1 M NaOH. The two horizontal lines indicate the pH range 5.1–7.4. |
Polyplex characterization
We studied the size and size distribution of polyplexes using AFM and DLS because polyplex size is one of the major factors determining DNA delivery efficiency.41 The incubation time of polyplex formation was fixed at 30 minutes after the initial mixing because of the polyplex size dependence on its formation kinetics.33,42 All the polycations studied were found to be capable of condensing DNA into polyplexes with an overall positive charge (Table 2). Both bPEI and dPEI are effective in forming compact polyplexes with hydrodynamic size approaching 60 nm consistent with the literature values.31 The smallest hydrodynamic size for the pAPOL polyplexes is around 100 nm. There was a significant reduction in size for pAPOL-1 and pAPOL-2 when the N/P ratio was increased from 8 to 12. The polyplexes formed by pAPOL-3 are larger and their size does not decrease with increasing N/P ratio. To further investigate polyplex stability, we collected DLS data as a function of incubation time as shown in Figure 2. The data show that the sizes of pAPOL-1, pAPOL-2, and dPEI polyplexes were unchanged during the 1-hour measurement time while the size of the pAPOL-3 polyplexes increased steadily with time. The increasing size is due to the agglomeration of the primary polyplex particles. Particle agglomeration is likely due to attractive polymer bridging interactions between loosely bound polyplexes.33 A more rigid pAPOL-3 molecule may make it more difficult to fully condense DNA. Lastly, we found no clear correlation between the zeta potential and polyplex size stability.
 | Table 2 Average particle size and zeta potential of polyplexes |
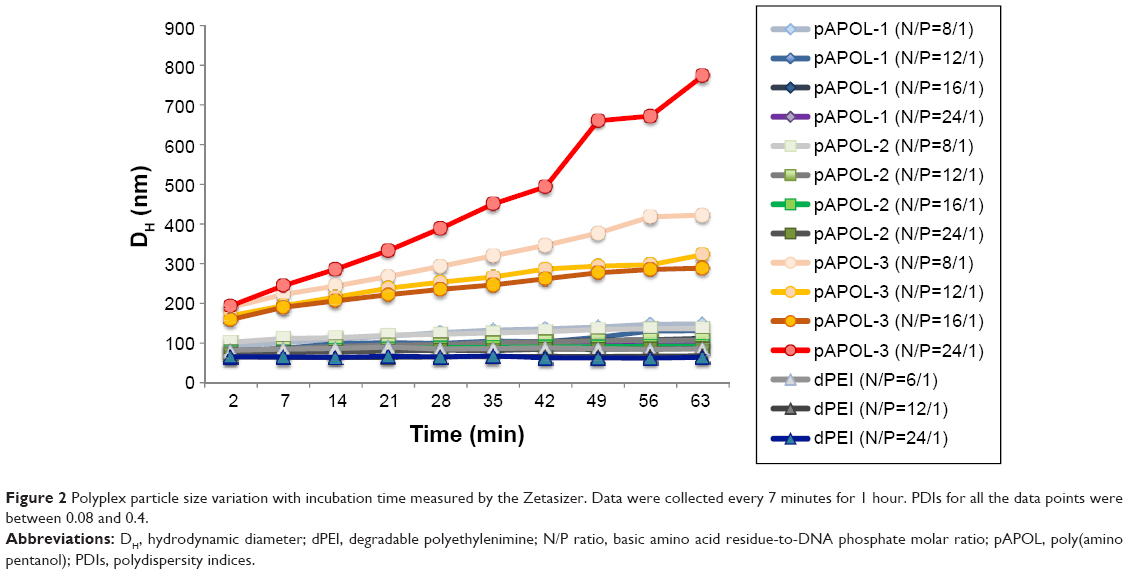 | Figure 2 Polyplex particle size variation with incubation time measured by the Zetasizer. Data were collected every 7 minutes for 1 hour. PDIs for all the data points were between 0.08 and 0.4. |
The polyplexes of pAPOL-1 with N/P ratio of 12 were imaged by AFM in air. Polyplexes 15 minutes post-formation tend to have a rod shape while those 45 minutes post-formation show a spheroidal shape (Figure 3). These data are consistent with our previous observations of PAAs of different chemical compositions showing a strong morphological dependence on incubation time.33
 | Figure 3 AFM height images of pAPOL-1 polyplexes (N/P=12/1). (A) Polyplexes incubated for 15 minutes. Z range is 5 nm. (B) Polyplexes incubated for 45 minutes. Z range is 10 nm. |
Polyplex transfection activity and cytotoxicity
To evaluate the transfection capability of the PAAs, their polyplexes containing pEGFP-N1 plasmid DNA were incubated with HEK293, MC3T3, and NIH3T3 cells. N/P ratios of the PAAs ranging from 12 to 16 were used. Polyplexes with N/P ratios of 8 and 24 did not show significant transfection activities. Cultured cells in the absence of polyplexes were used as the negative control. The transfection efficiency was determined after 24-hour cell incubation with the polyplexes by flow cytometry. The percentage of transfected cells (Figure 4A) and mean fluorescence intensity (MFI) (Figure 4B) are used here to express the transfection efficiency. The total number of events measured is 10,000 per sample. Of all the pAPOLs, pAPOL-1 exhibits the highest transfection efficiency; pAPOL-2 shows some transfection activities; and pAPOL-3 shows no transfection (data not shown). bPEI was able to transfect HEK293 cells and NIH3T3 cells but not as effectively in MC3T3 cells. Here, pAPOL-1 shows significant higher transfection activities than bPEI in MC3T3 cells. The biodegradable dPEI shows low transfection in all three cell lines. Figure 4C reports the cell viability data by the MTT assay. The control group consists of cells attaching and proliferating on the culture plate in the absence of the polyplexes. Polyplexes of pAPOL-1 at N/P=12 show the lowest toxicity in all three cell lines. Polyplexes of pAPOL-1 at N/P=16 and pAPOL-2 show significant toxicity to MC3T3 cells, which may be related to the lower rate of mitosis of MC3T3 compared with NIH3T3 and HEK293.43 dPEI is less toxic to cells than bPEI as expected.31
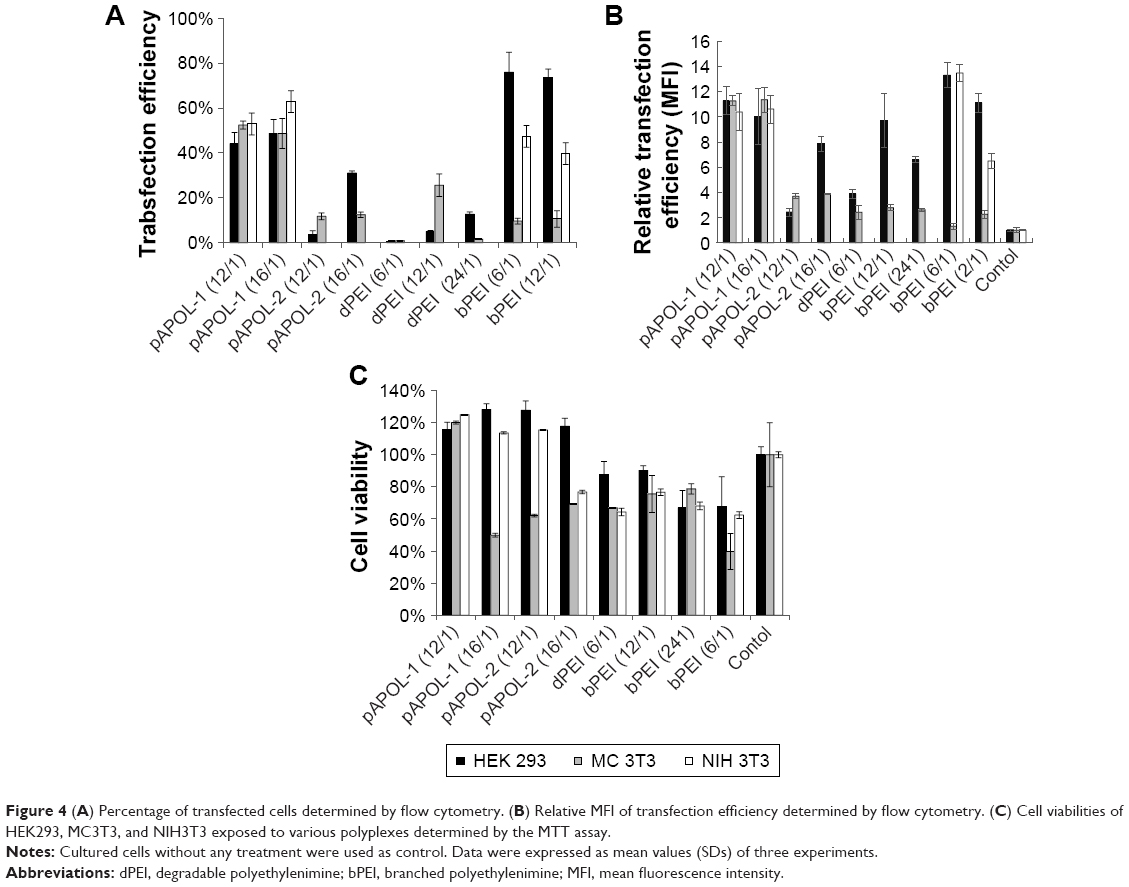 | Figure 4 (A) Percentage of transfected cells determined by flow cytometry. (B) Relative MFI of transfection efficiency determined by flow cytometry. (C) Cell viabilities of HEK293, MC3T3, and NIH3T3 exposed to various polyplexes determined by the MTT assay. |
LbL film assembly and structural analysis
The above polycation screening based on polyplexes has identified pAPOL-1 to be a suitable polycation with low cytotoxicity and high transfection efficiency for the subsequent LbL film study. We prepared 16.5 bilayers of LbL films containing pAPOL-1 and DNA. In addition, bPEI or dPEI was inserted periodically as a barrier against interlayer diffusion (LbL film 1 and film 2 in Scheme 2). The LbL film deposition process was monitored by AFM. The film thickness was measured in AFM height images of samples where part of the film was removed so the height difference between the film surface and bare substrate can be determined.13 Figure 5A and B shows the film growth patterns for LbL film 1 and film 2. Figure 5C and D shows AFM images of the films containing the scratched area for film thickness measurements. Both films show a relatively smooth texture. Both types of films exhibit linear growth behavior where the film thickness increases linearly with the number of layers. This linear growth behavior suggests minimal interlayer diffusion in the LbL films.44–46 The total thickness for LbL film 1 is 77.5±1.9 nm, which yields an average polycation/DNA bilayer thickness of 4.6 nm. The total film thickness for LbL film 2 is 70.1±3.0 nm with the thickness per bilayer of 4.2 nm. Our data suggest that both bPEI and dPEI are effective diffusion barriers to maintain the layered structure in the LbL films. The same films were also measured in PBS buffer to show a wet film thickness of 103.7±3.9 nm for film 1 and 111.8±2.9 nm for film 2.
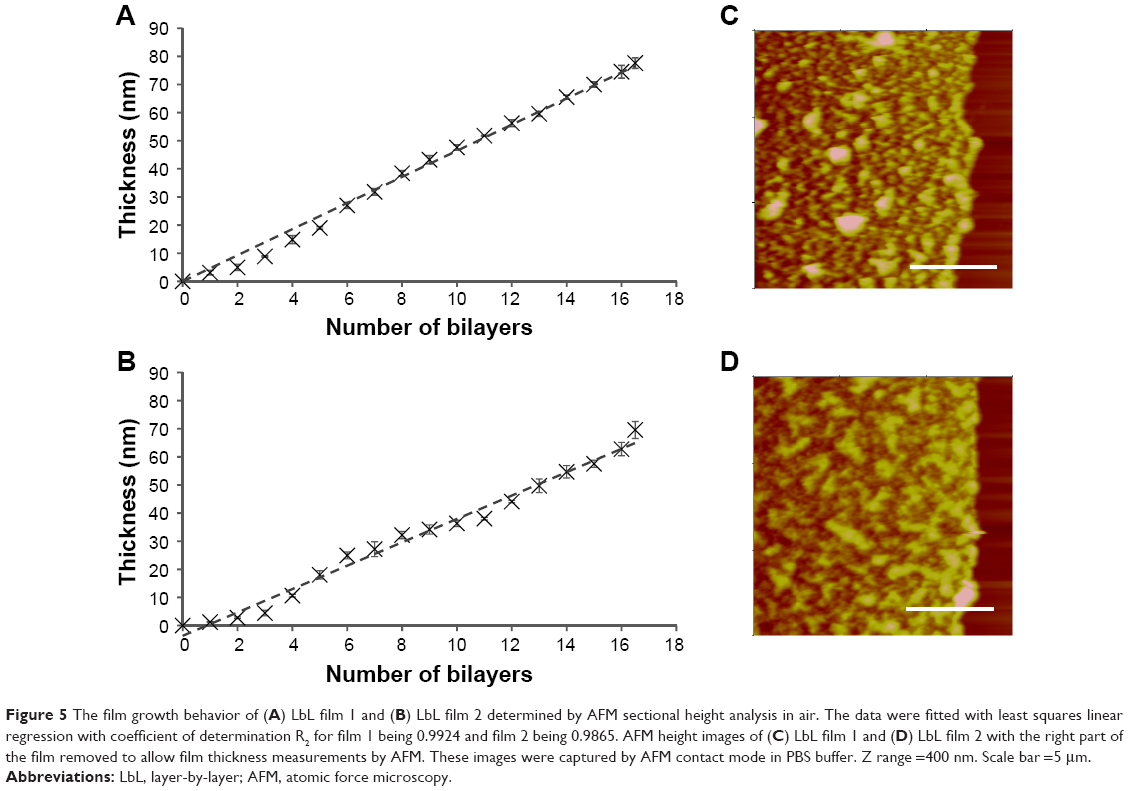 | Figure 5 The film growth behavior of (A) LbL film 1 and (B) LbL film 2 determined by AFM sectional height analysis in air. The data were fitted with least squares linear regression with coefficient of determination R2 for film 1 being 0.9924 and film 2 being 0.9865. AFM height images of (C) LbL film 1 and (D) LbL film 2 with the right part of the film removed to allow film thickness measurements by AFM. These images were captured by AFM contact mode in PBS buffer. Z range =400 nm. Scale bar =5 μm. |
Film disassembly in solution
The LbL films immersed in reductive 10 mM DTT solution were taken out periodically to be imaged by AFM in air. Figure 6A shows AFM images captured during LbL film 1 degradation. The film (dry) thickness and surface roughness variation with degradation time are plotted in Figure 6B and C, respectively. At t=0, the film thickness is ~80 nm and the root mean square roughness is ~15 nm. Both decreased in values during the degradation period up to 225 hours. The film thickness decreased more rapidly during the first 24 hours indicating an initial burst release behavior and then decreased more slowly toward the limiting film thickness of 9.7±0.4 nm at 225 hours. The initial film roughness is 15.1±0.6 nm, which increased slightly to 19 nm in the first 4 hours, followed by a gradual decrease to ~15 nm at 50 hours and ~10 nm until the end of the observation period. The initial roughness increase is due to many particles being released from the LbL film during the initial film degradation period. When LbL films undergo bulk degradation, we tend to observe large micron size pieces missing from the film. The fact that we did not observe such missing pieces from LbL film 1 and 2 indicates that the films degrade more gradually, following the LbL disassembly mechanism. LbL film 2 disassembles similarly as LbL film 1. During an 8-day degradation study, LbL 2 film (dry) thickness decreased gradually to 10.3±0.4 nm. Our study indicates that both bPEI and dPEI are effective in preventing bulk degradation of the pAPOL/DNA films.
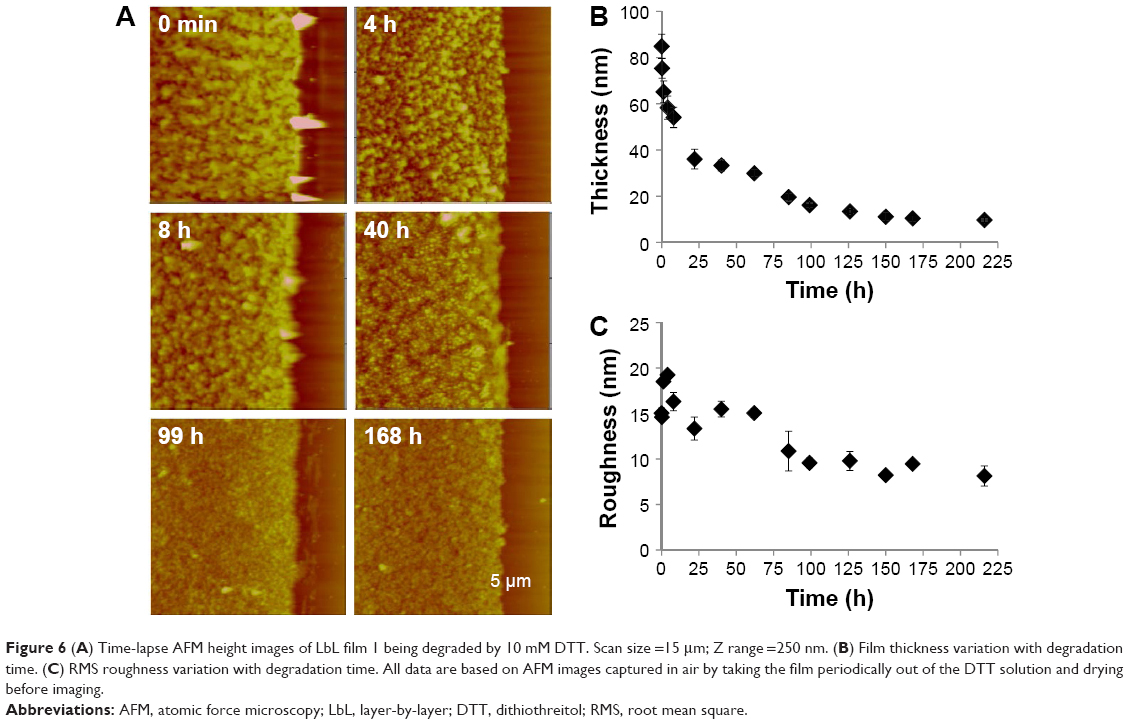 | Figure 6 (A) Time-lapse AFM height images of LbL film 1 being degraded by 10 mM DTT. Scan size =15 μm; Z range =250 nm. (B) Film thickness variation with degradation time. (C) RMS roughness variation with degradation time. All data are based on AFM images captured in air by taking the film periodically out of the DTT solution and drying before imaging. |
Film degradation was also studied using real-time AFM imaging in DTT solution. We monitored film 2 disassembly in 10 mM DTT solution for 6 hours in order to capture the initial disassembly process in real time (Figure 7). Figure 7A shows the film surface morphological change in the reducing environment. We did not observe micrometer patches in the film indicating the absence of bulk film erosion. We focused our imaging on an area where part of the film was removed prior to the real-time experiment, by a razor blade, in order to monitor the film thickness change during film degradation in DTT solution. The starting film thickness is 104±4 nm with a surface roughness of 33.9 nm measured in PBS solution (Figure 5D). The film thickness reduction is more pronounced in the first 150 minutes, by about 50% (Figure 7B). After 150 minutes, the film degradation rate starts to slow down. After 8 days of degradation, the thickness of film 2 was 30±11 nm.
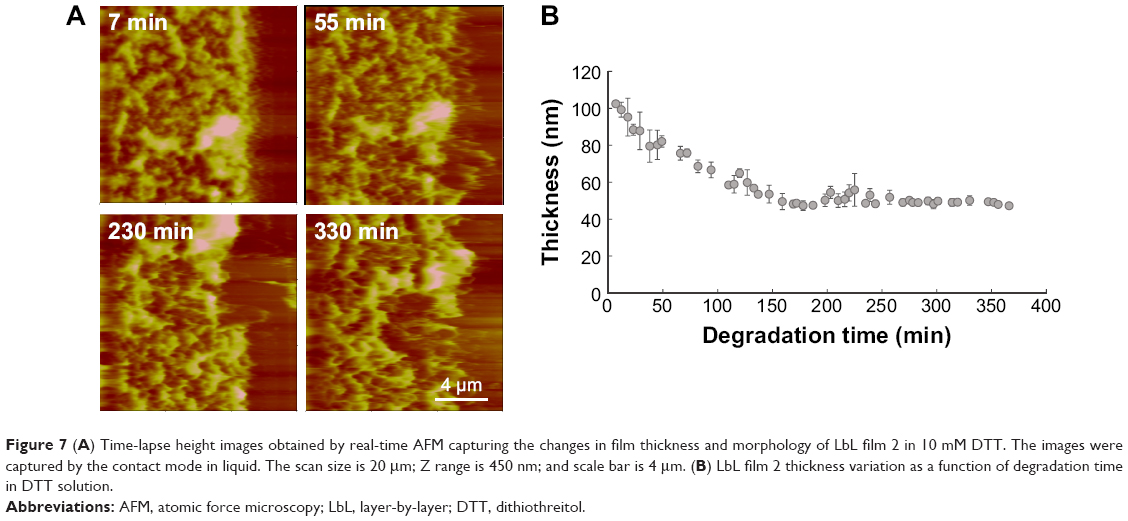 | Figure 7 (A) Time-lapse height images obtained by real-time AFM capturing the changes in film thickness and morphology of LbL film 2 in 10 mM DTT. The images were captured by the contact mode in liquid. The scan size is 20 μm; Z range is 450 nm; and scale bar is 4 μm. (B) LbL film 2 thickness variation as a function of degradation time in DTT solution. |
DNA delivery efficiency is also impacted by the particle morphology released from the LbL films upon reductive degradation. Therefore, we characterized the particles released from the LbL films by DLS. The DH of the particles collected in the incubation solution during LbL film degradation was continuously monitored as a function of degradation time. We averaged the DH values in one 24-hour period and reported the averages every 24 hours as a function of degradation time in Figure 8A. LbL film 1 which contains bPEI released particles with a DH size range of 200–400 nm throughout the observation period of 360 hours. It should be pointed out that the large error bar in the first 24 hours is due to the high concentration of particles released during this initial period resulting in significant particle agglomeration (Figure S2). LbL film 2 containing dPEI released larger particles in the range of 350–600 nm. After 9 days, the number of particles released from LbL film 2 was insufficient for DLS detection. AFM thickness analysis also shows that film 2 was fully degraded after 9 days with the remaining 8.9% of the film accounted for by the irreversibly adsorbed anchoring layer. To study the particle morphology, the released particles were collected, deposited on mica, and imaged by the AFM tapping mode in PBS buffer (Figure 8B–E). Further analysis by AFM of the released particle volume in air shows that most particles are 2–5×10⁴ nm3 in particle volume, which corresponds to 2–3 plasmid DNA molecules per particle (Figure 9). Particles released in the first 6 hours are rod or spheroid shaped with a volume of 2–3×10⁴ nm3 (Figure 9A and B). Particles collected on day 7 (Figure 9C) have a similar morphology as those collected at 6 hours. Approximately 13% of the particles exhibit much larger particle volume equivalent to containing 10–12 DNA plasmids per particle (Figure 9D), which is due to particle agglomeration. The AFM and DLS data suggest that LbL film 1 releases smaller particles for a longer period of time than film 2. dPEI is less toxic than bPEI because of its biodegradable property; on the other hand, our data suggest that dPEI’s biodegradable property also limits its ability to maintain a compact polyplex shape during a prolonged delivery process.
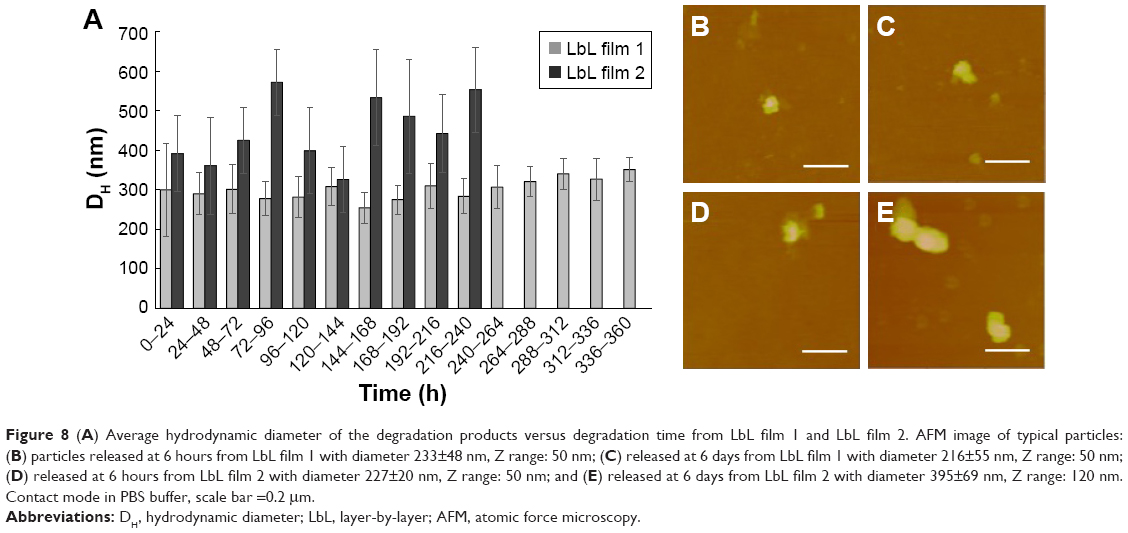 | Figure 8 (A) Average hydrodynamic diameter of the degradation products versus degradation time from LbL film 1 and LbL film 2. AFM image of typical particles: (B) particles released at 6 hours from LbL film 1 with diameter 233±48 nm, Z range: 50 nm; (C) released at 6 days from LbL film 1 with diameter 216±55 nm, Z range: 50 nm; (D) released at 6 hours from LbL film 2 with diameter 227±20 nm, Z range: 50 nm; and (E) released at 6 days from LbL film 2 with diameter 395±69 nm, Z range: 120 nm. Contact mode in PBS buffer, scale bar =0.2 μm. |
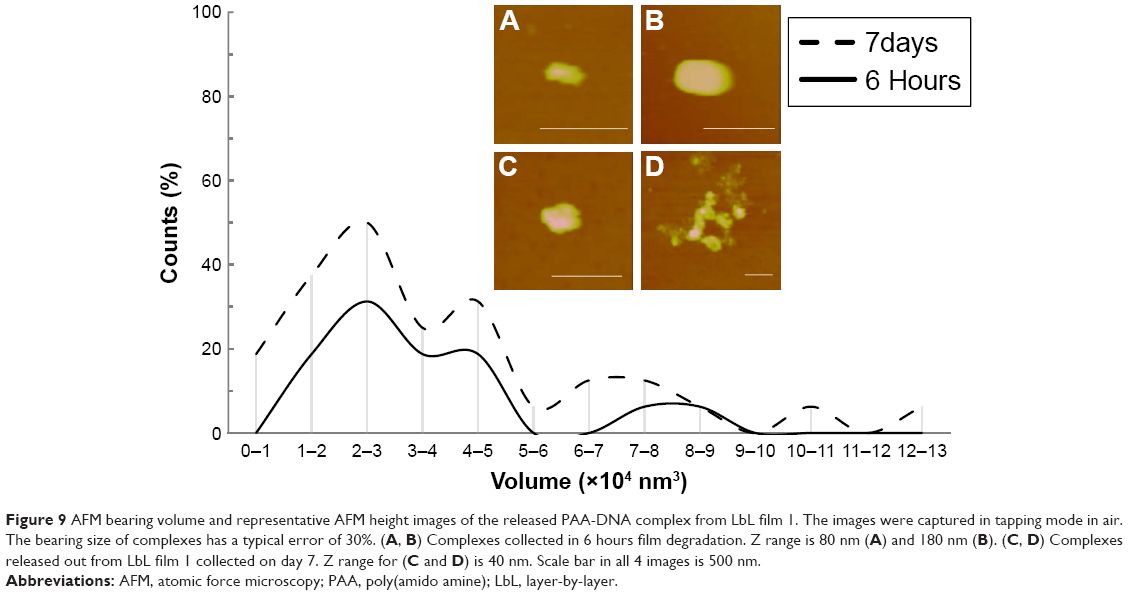 | Figure 9 AFM bearing volume and representative AFM height images of the released PAA-DNA complex from LbL film 1. The images were captured in tapping mode in air. The bearing size of complexes has a typical error of 30%. (A, B) Complexes collected in 6 hours film degradation. Z range is 80 nm (A) and 180 nm (B). (C, D) Complexes released out from LbL film 1 collected on day 7. Z range for (C and D) is 40 nm. Scale bar in all 4 images is 500 nm. |
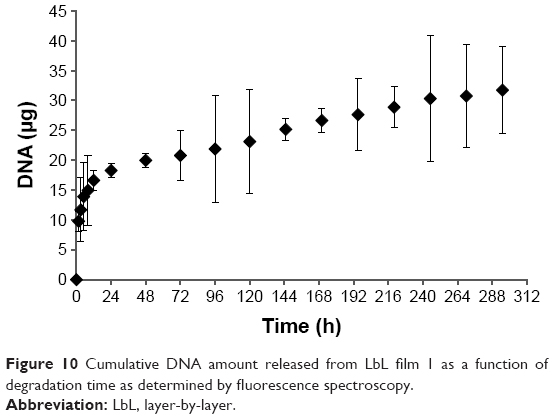
The degradation kinetics was further analyzed by fluorescence spectroscopy. The DNA amount released from the LbL films in the presence of DTT was determined by fluorescent labeling of DNA with SYBR safe DNA stain. The fluorescence data were calibrated using a known amount of DNA as described in the “Materials and methods” section. Figure 10 shows the continuous release of DNA from the LbL film during the 300-hour observation period. The film exhibited a burst release behavior in the first 24 hours consistent with the film thickness data measured by AFM, probably due to excess polyelectrolytes quickly coming out of the film at the beginning of film degradation. After 24 hours, the film degradation slowed down significantly consistent with surface erosion mechanism. We achieved sequential DNA release of the pAPOL-1/DNA films by the insertion of diffusion barrier layers of bPEI and dPEI.
 | Figure 10 Cumulative DNA amount released from LbL film 1 as a function of degradation time as determined by fluorescence spectroscopy. |
In vitro transfection activity and cytotoxicity of the LbL films
The transfection study was carried out by culturing HEK293 and MC3T3 cells directly on the LbL films. A layer of fibronectin was applied to the film prior to cell culture because fibronectin has been found to improve cell attachment and proliferation.47 Figure 11 shows the bright field (left column) and fluorescence images (right column) of proliferating HEK293 cells (left panel) and MC3T3 cells (right panel) on LbL film 1 (Figure 11A) and LbL film 2 (Figure 11B). When the cells were cultured on film 1, they attached and grew well on the films throughout the observation period of 6 days. GFP fluorescence images indicate transfection of pEGFP-N1 plasmid DNA from day 2 till the end of the cell culturing period. We observed a significant increase in the number of green cells in day 4. HEK293 and MC3T3 cells did not attach and grow well on LbL film 2. Cells were observed to detach and aggregate starting on day 2 (MC3T3) and day 4 (HEK293). On day 6, most cells appeared unhealthy and aggregated. Although HEK293 cells can be transfected when cultured on LbL film 2 (Figure 11B, left panel), the transfection efficiency was significantly reduced due to poor cell attachment and growth.
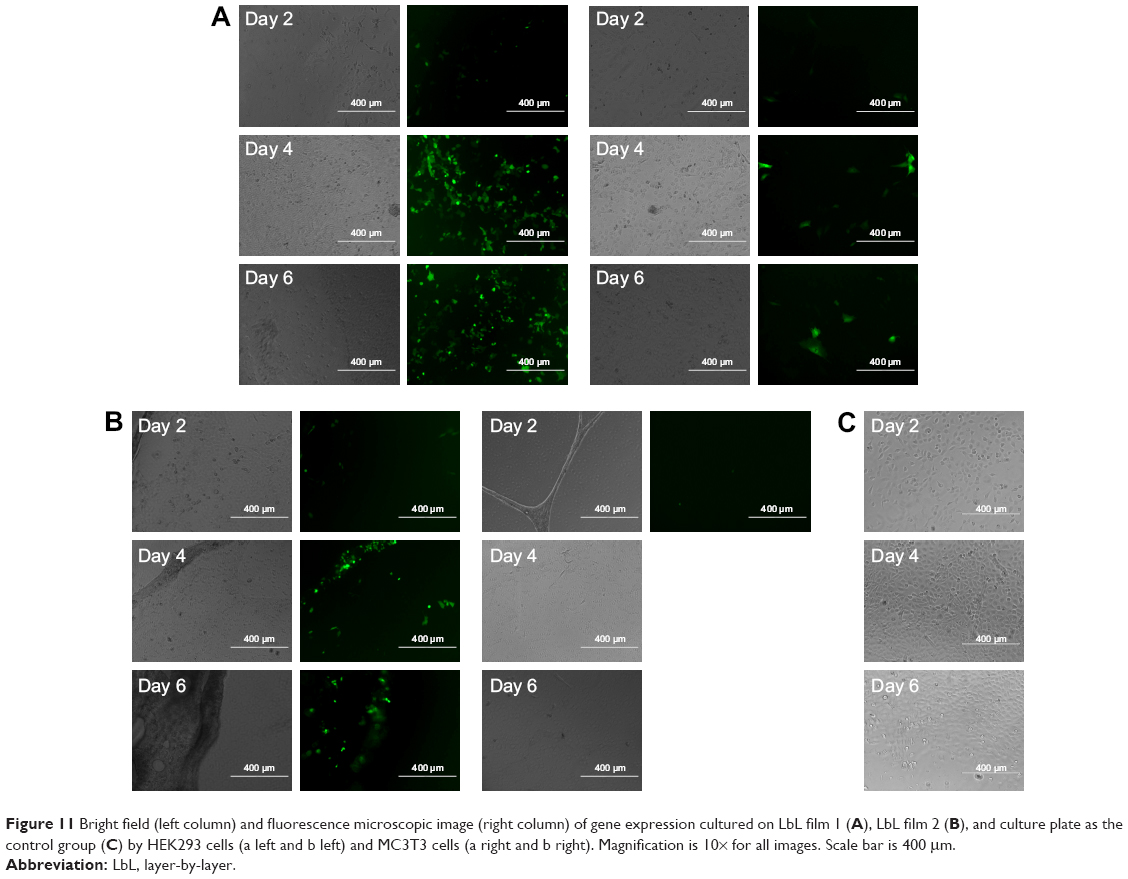 | Figure 11 Bright field (left column) and fluorescence microscopic image (right column) of gene expression cultured on LbL film 1 (A), LbL film 2 (B), and culture plate as the control group (C) by HEK293 cells (a left and b left) and MC3T3 cells (a right and b right). Magnification is 10× for all images. Scale bar is 400 μm. |
Flow cytometry was used to characterize cell transfection efficiency on day 6. Day 6 was chosen because of the maximum fluorescence signal observed. The percentages of transfected cells and MFI are used here to quantify the transfection efficiency. The total event measured is 10,000 for each sample. Cells grown on 24-well culture plates without any transfection agent were used as a negative control. Figure 12A shows the percentage of transfected cells and relative MFI for each experimental group. HEK293 cells grown on LbL film 1 had 9.9% cells with green fluorescence (Figure 12A), and the corresponding MFI value was 4.6-fold higher than that of the control group (Figure 12B). The MFI value of MC3T3 cells on LbL film 1 was only 2.5-fold higher than that of the control. For LbL film 2, HEK293 had a much lower percentage of transfected cells, ~0.9% (Figure 12A). Relative MFI was 4.0-fold higher than the control (Figure 12B). The MC3T3 cells grown on LbL film 2 showed <0.5% transfection percentage (Figure 12A). The relative MFI was 1.2-fold higher than the control (Figure 12B).
 | Figure 12 (A) Proportion of transfected cells and (B) relative MFI of transfection cells of LbL films in HEK293 and MC3T3 cells on day 6. (C) Cell viability of HEK293 and MC3T3 cells cultured on LbL films on day 6 determined by MTT assay. The experiments were expressed as mean values (SDs) of three experiments. |
Figure 12C plots the cell viability data cultured on the LbL films by the MTT assay. For HEK293 cells, the cell viability of film 1 is 85.8% and for LbL film 2 it is 21.6%. MC3T3 cells showed 73.1% cell viability on film 1 and 11.6% on film 2. Our data suggest that LbL film 1 is more biocompatible than film 2, and HEK293 cell line is less adversely affected than MC3T3 cell line by the presence of the LbL films.
Lastly, to demonstrate the ability of LbL film 1 for sequential gene delivery, two different DNA plasmids were incorporated into the film as shown in Scheme 3. The bottom nine bilayers were constructed using the pEF.myc.ER-E2-Crimson plasmid and its transfection gave red fluorescence. The top 7.5 bilayers contain the green fluorescent pEGFP-N1 plasmid. HEK293 cells were cultured on this LbL film for 10 days. Figure 13 shows the dominance of the green fluorescence on day 4 and the emergence of red fluorescence on day 6. It shows the persistence of green fluorescence from day 4 to day 8 and delayed expression of the Crimson plasmid from day 4 to day 10. The data demonstrate the promise of such LbL films for controlled and sequential gene delivery for biomedical applications.
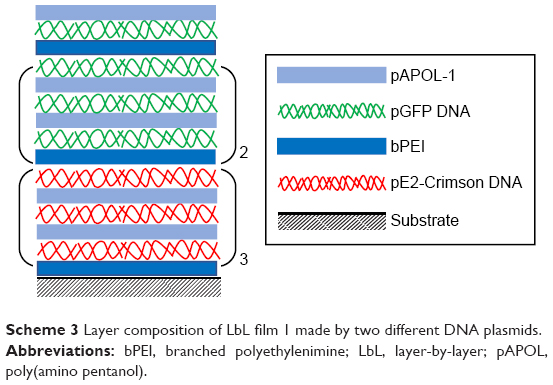 | Scheme 3 Layer composition of LbL film 1 made by two different DNA plasmids. |
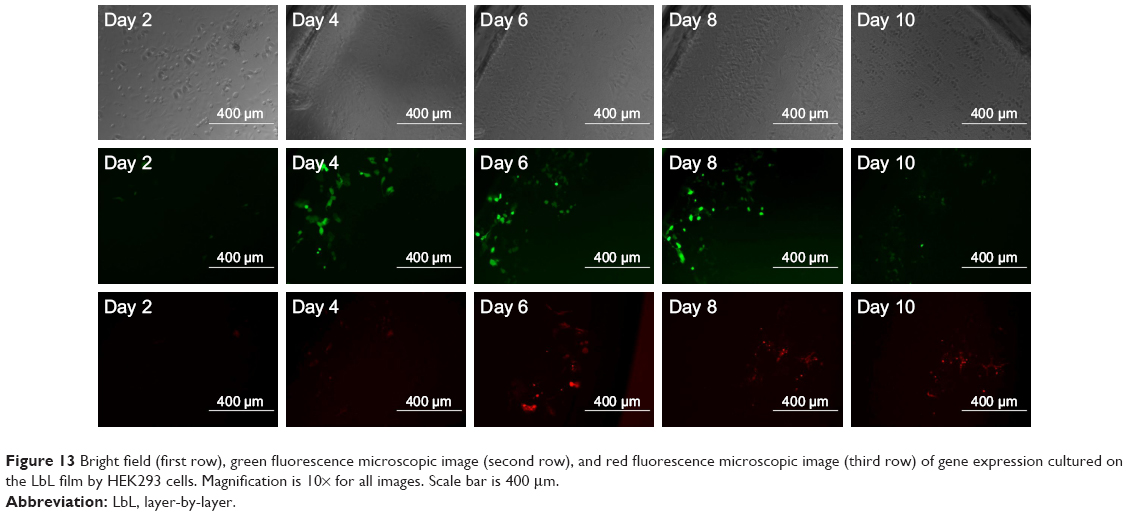 | Figure 13 Bright field (first row), green fluorescence microscopic image (second row), and red fluorescence microscopic image (third row) of gene expression cultured on the LbL film by HEK293 cells. Magnification is 10× for all images. Scale bar is 400 μm. |
Discussion
Cell transfection by DNA from LbL films is a complex process and often a difficult task to achieve. LbL films need to disassemble in such a manner that generates transient condensed DNA nanoparticles to allow cell uptake, endosomal escape, and intracellular trafficking into the nucleus. Then, the nanoparticles need to unpack to enable DNA transfection in the cell nucleus. A prerequisite for transfection by LbL films is to use biodegradable polycations capable of condensing DNA, enabling endosomal escape of their gene payload, and achieving high transfection while maintaining low cytotoxicity. Here, we have applied acid–base titration as an effective screening tool for polymer gene delivery vectors. A bioreducible PAA with APOL side groups, pAPOL-1, was selected for the subsequent build-up of LbL films, based on its performance in the polyplex form. The acid–base titration utilizes the proton sponge hypothesis, which relates the buffering capacity of the polycation gene delivery vectors to their transfection efficiency.24,48 The proton sponge effect allows endosomal escape of the polyplexes by creating an osmotic pressure to burst the endosomes. The amount of titratable amines in the polymer is the main contributor to buffering capacity by reducing acidification, increasing Cl− accumulation, and increasing endosomal swelling and lysis.50 Primary amines in the polymers are predominately protonated at neutral pH.49 PEI and pAPOLs both possess higher order amines, which give rise to higher buffering capacity in the relevant pH range.49,50 The homogeneous protonation distribution over the whole endolysosomal pH range is attributed to the continuous chains of ethylamine groups in bPEI and dPEI.51 It is unclear why pAPOL-1 has the strongest buffering capacity. Compared to the other pAPOLs, the average distance between amine groups is longer in pAPOL-1 and it has the lowest molecular weight (more end groups containing secondary amines). Both factors could contribute to its high buffering capacity.52 The poor buffering capacity of dPEI compared to bPEI is likely due to its tendency to hydrolyze in the titration pH range. Incidentally, polyplexes of pAPOL-1 show the highest transfection efficiency with the lowest cytotoxicity. The higher transfection efficiency of pAPOL-1 is consistent with its high buffering capacity and biophysical characteristics. For comparison, even though dPEI is less toxic to cells than bPEI,31 it is also less effective than bPEI due to dPEI’s hydrolytic instability thus limiting its use in the LbL films.
Another focus of this work is the incorporation of diffusion barrier layers in order to achieve sequential DNA release from LbL films by limiting bulk film degradation. While DNA itself is a nondiffusing polyanion,53 bioreducible PAAs are capable of interlayer diffusion as indicated by its exponential growth pattern.13 There exists a diffusion zone in the LbL films with interlayer diffusion, which acts as a reservoir during layer growth until reaching a kinetic limit.44,48 The growing reservoir with increasing number of layers results in the exponential growth of the LbL films.48 The insertions of both bPEI and dPEI layers into the pAPOL-1/DNA LbL films change the film growth pattern to a linear growth pattern. Our results show that the linearly grown films also undergo more gradual film disassembly lasting for days when compared to bulk film degradation in minutes. Our results show that periodic insertions of the bPEI or dPEI layer are effective in achieving a linear film growth pattern and preventing bulk erosion. PEI has a smaller diffusion coefficient and a higher charge density than PAAs. It binds strongly to the surface during LbL assembly and acts as a separating layer to prevent interlayer diffusion of PAA molecules. PEI acts as a barrier by screening the residue charge on the film.53 More importantly, it limits chain mobility during film disassembly thus allowing the gradual release of DNA nanoparticles at the film/cell interfacial zone.13 Our results demonstrate the strategy of combining highly transfecting bioreducible pAPOL-1 and PEI in the LbL film assembly to achieve controlled gene delivery from the films.
Conclusion
Bioreducible PAAs containing CBA, MBA, and APOL were synthesized by Michael addition polymerization for the construction of bioreducible LbL films capable of sequential gene delivery. The synthesized PAAs together with 25 kDa branched PEI and cross-linked 800 Da PEI were evaluated prior to their incorporation into LbL films by acid–base titration, cell transfection, and MTT assay in their polyplex form. The prescreening identified pAPOL-1, made by the copolymerization of CBA and APOL, to exhibit high buffering capacity, high transfection efficiency, and low cytotoxicity. Therefore, pAPOL-1 was selected for the subsequent construction of the LbL films. In addition to pAPOL-1, nondiffusing PEI was incorporated into the LbL films in order to achieve sustained DNA release from the LbL films in the polyplex nanoparticle form. Cell transfections conducted on HEK293 and MC3T3 cells showed that LbL films containing pAPOL-1 and 25 kDa branched PEI are effective in DNA transfection while LbL films containing pAPOL-1 and cross-linked 800 Da PEI are less efficient. We also demonstrated the dual-stage release and transfection of two different DNAs from the LbL films. The results indicate that LbL films consisting of bioreducible PAAs and nondiffusing polyelectrolytes have excellent degradation properties for the development of LbL coating technology for localized gene delivery applications including tissue/bone regeneration, wound healing, drug/vaccine delivery, and production of stem cells.
Acknowledgments
The abstract of this paper was presented at the AIChE annual meeting 2016 as an oral presentation with interim findings. The presentation’s abstract was published in the AIChE program booklet: https://aiche.confex.com/aiche/2016/webprogram/Paper460422.html.
Disclosure
This work was supported by the National Science Foundation (CHE-1404285 and DMR-1229284 [GM]). The authors report no other conflicts of interest in this work.
References
Decher G. Fuzzy nanoassemblies: toward layered polymeric multicomposites. Science. 1997;277(5330):1232–1237. | ||
Decher G, Hong JD, Schmitt J. Buildup of ultrathin multilayer films by a self-assembly process 3. Consecutively alternating adsorption of anionic and cationic polyelectrolytes on charged surfaces. Thin Solid Films. 1992;210(1–2):831–835. | ||
Mao GZ, Tsao YH, Tirrell M, Davis HT, Hessel V, Ringsdorf H. Self-assembly of photopolymerizable bolaform amphiphile monolayers and multilayers. Langmuir. 1993;9(12):3461–3470. | ||
Boudou T, Crouzier T, Ren K, Blin G, Picart C. Multiple functionalities of polyelectrolyte multilayer films: new biomedical applications. Adv Mater. 2010;22(4):441–467. | ||
Correa S, Dreaden EC, Gu L, Hammond PT. Engineering nanolayered particles for modular drug delivery. J Control Release. 2016;240:364–386. | ||
Blacklock J, You Y-Z, Zhou Q-H, Mao G, Oupický D. Gene delivery in vitro and in vivo from bioreducible multilayered polyelectrolyte films of plasmid DNA. Biomaterials. 2009;30(5):939–950. | ||
Werner S, Huck O, Frisch B, et al. The effect of microstructured surfaces and laminin-derived peptide coatings on soft tissue interactions with titanium dental implants. Biomaterials. 2009;30(12):2291–2301. | ||
Chua PH, Neoh KG, Kang ET, Wang W. Surface functionalization of titanium with hyaluronic acid/chitosan polyelectrolyte multilayers and RGD for promoting osteoblast functions and inhibiting bacterial adhesion. Biomaterials. 2008;29(10):1412–1421. | ||
Yamauchi F, Koyamatsu Y, Kato K, Iwata H. Layer-by-layer assembly of cationic lipid and plasmid DNA onto gold surface for stent-assisted gene transfer. Biomaterials. 2006;27(18):3497–3504. | ||
Saurer EM, Jewell CM, Roenneburg DA, et al. Polyelectrolyte multilayers promote stent-mediated delivery of DNA to vascular tissue. Biomacromolecules. 2013;14(5):1696–1704. | ||
DeMuth PC, Min YJ, Huang B, et al. Polymer multilayer tattooing for enhanced DNA vaccination. Nat Mater. 2013;12(4):367–376. | ||
DeMuth PC, Moon JJ, Suh H, Hammond PT, Irvine DJ. Releasable layer-by-layer assembly of stabilized lipid nanocapsules on microneedles for enhanced transcutaneous vaccine delivery. ACS Nano. 2012;6(9):8041–8051. | ||
Zou Y, Xie L, Carroll S, et al. Layer-by-layer films with bioreducible and nonbioreducible polycations for sequential DNA release. Biomacromolecules. 2014;15(11):3965–3975. | ||
De Geest BG, Sanders NN, Sukhorukov GB, Demeester J, De Smedt SC. Release mechanisms for polyelectrolyte capsules. Chem Soc Rev. 2007;36(4):636–649. | ||
Zhang J, Chua LS, Lynn DM. Multilayered thin films that sustain the release of functional DNA under physiological conditions. Langmuir. 2004;20(19):8015–8021. | ||
Ren K, Ji J, Shen J. Construction and enzymatic degradation of multilayered poly-l-lysine/DNA films. Biomaterials. 2006;27(7):1152–1159. | ||
Oupický D, Parker AL, Seymour LW. Laterally stabilized complexes of DNA with linear reducible polycations: strategy for triggered intracellular activation of DNA delivery vectors. J Am Chem Soc. 2002;124(1):8–9. | ||
Estrela JM, Ortega A, Obrador E. Glutathione in cancer biology and therapy. Crit Rev Clin Lab Sci. 2006;43(2):143–181. | ||
Soundara Manickam D, Bisht HS, Wan L, Mao G, Oupicky D. Influence of TAT-peptide polymerization on properties and transfection activity of TAT/DNA polyplexes. J Control Release. 2005;102(1):293–306. | ||
Blacklock J, Handa H, Manickam DS, Mao GZ, Mukhopadhyay A, Oupicky D. Disassembly of layer-by-layer films of plasmid DNA and reducible TAT polypeptide. Biomaterials. 2007;28(1):117–124. | ||
Ryser HJ, Mandel R, Ghani F. Cell surface sulfhydryls are required for the cytotoxicity of diphtheria toxin but not of ricin in Chinese hamster ovary cells. J Biol Chem. 1991;266(28):18439–18442. | ||
Feener EP, Shen WC, Ryser HJP. Cleavage of disulfide bonds in endocytosed macromolecules – a processing not associated with lysosomes or endosomes. J Biol Chem. 1990;265(31):18780–18785. | ||
Sahaf B, Heydari K, Herzenberg LA, Herzenberg LA. The extracellular microenvironment plays a key role in regulating the redox status of cell surface proteins in HIV-infected subjects. Arch Biochem Biophys. 2005;434(1):26–32. | ||
Boussif O, Lezoualc’h F, Zanta MA, et al. A versatile vector for gene and oligonucleotide transfer into cells in culture and in vivo: polyethylenimine. Proc Natl Acad Sci U S A. 1995;92(16):7297–7301. | ||
Liu H, Wang Y, Wang M, Xiao J, Cheng Y. Fluorinated poly(propylenimine) dendrimers as gene vectors. Biomaterials. 2014;35(20):5407–5413. | ||
Brunot C, Ponsonnet L, Lagneau C, Farge P, Picart C, Grosgogeat B. Cytotoxicity of polyethyleneimine (PEI), precursor base layer of polyelectrolyte multilayer films. Biomaterials. 2007;28(4):632–640. | ||
Parhamifar L, Larsen AK, Hunter AC, Andresen TL, Moghimi SM. Polycation cytotoxicity: a delicate matter for nucleic acid therapy – focus on polyethylenimine. Soft Matter. 2010;6(17):4001–4009. | ||
Jiang H-L, Islam MA, Xing L, et al. Degradable polyethylenimine-based gene carriers for cancer therapy. Top Curr Chem. 2017;375(2):34. | ||
Ou M, Xu R, Kim SH, Bull DA, Kim SW. A family of bioreducible poly(disulfide amine)s for gene delivery. Biomaterials. 2009;30(29):5804–5814. | ||
Martello F, Piest M, Engbersen JFJ, Ferruti P. Effects of branched or linear architecture of bioreducible poly(amido amine)s on their in vitro gene delivery properties. J Control Release. 2012;164(3):372–379. | ||
Zhong ZY, Feijen J, Lok MC, et al. Low molecular weight linear polyethylenimine-b-poly(ethylene glycol)-b-polyethylenimine triblock copolymers: synthesis, characterization, and in vitro gene transfer properties. Biomacromolecules. 2005;6(6):3440–3448. | ||
Lin C, Zhong Z, Lok MC, et al. Novel bioreducible poly(amido amine)s for highly efficient gene delivery. Bioconjug Chem. 2007;18(1):138–145. | ||
Wan L, You Y, Zou Y, Oupický D, Mao G. DNA release dynamics from bioreducible poly(amido amine) polyplexes. J Phys Chem B. 2009;113(42):13735–13741. | ||
Forrest ML, Koerber JT, Pack DW. A degradable polyethylenimine derivative with low toxicity for highly efficient gene delivery. Bioconjug Chem. 2003;14(5):934–940. | ||
Mosmann T. Rapid colorimetric assay for cellular growth and survival: application to proliferation and cytotoxicity assays. J Immunol Methods. 1983;65(1–2):55–63. | ||
Liu Y, Peterson DA, Kimura H, Schubert D. Mechanism of cellular 3-(4,5-dimethylthiazol-2-yl)-2,5-diphenyltetrazolium bromide (MTT) reduction. J Neurochem. 1997;69(2):581–593. | ||
Mather BD, Viswanathan K, Miller KM, Long TE. Michael addition reactions in macromolecular design for emerging technologies. Prog Polym Sci. 2006;31(5):487–531. | ||
Lynn DM, Langer R. Degradable poly(β-amino esters): synthesis, characterization, and self-assembly with plasmid DNA. J Am Chem Soc. 2000;122(44):10761–10768. | ||
Lynn DM, Anderson DG, Putnam D, Langer R. Accelerated discovery of synthetic transfection vectors: parallel synthesis and screening of a degradable polymer library. J Am Chem Soc. 2001;123(33):8155–8156. | ||
Ferruti P, Manzoni S, Richardson SCW, et al. Amphoteric linear poly(amido-amine)s as endosomolytic polymers: correlation between physicochemical and biological properties. Macromolecules. 2000;33(21):7793–7800. | ||
Pouton CW, Seymour LW. Key issues in non-viral gene delivery. Adv Drug Deliv Rev. 1998;34(1):3–19. | ||
Chen J, Wu C, Oupicky D. Bioreducible hyperbranched poly(amido amine)s for gene delivery. Biomacromolecules. 2009;10(10):2921–2927. | ||
Wiethoff CM, Middaugh CR. Barriers to nonviral gene delivery. J Pharm Sci. 2003;92(2):203–217. | ||
Losche M, Schmitt J, Decher G, Bouwman WG, Kjaer K. Detailed structure of molecularly thin polyelectrolyte multilayer films on solid substrates as revealed by neutron reflectometry. Macromolecules. 1998;31(25):8893–8906. | ||
Hubsch E, Ball V, Senger B, Decher G, Voegel JC, Schaaf P. Controlling the growth regime of polyelectrolyte multilayer films: changing from exponential to linear growth by adjusting the composition of polyelectrolyte mixtures. Langmuir. 2004;20(5):1980–1985. | ||
Porcel C, Lavalle P, Ball V, et al. From exponential to linear growth in polyelectrolyte multilayers. Langmuir. 2006;22(9):4376–4383. | ||
Engvall E, Ruoslahti E. Binding of soluble form of fibroblast surface protein, fibronectin, to collagen. Int J Cancer. 1977;20(1):1–5. | ||
Sonawane ND, Szoka FC Jr, Verkman AS. Chloride accumulation and swelling in endosomes enhances DNA transfer by polyamine-DNA polyplexes. J Biol Chem. 2003;278(45):44826–44831. | ||
Tang MX, Szoka FC. The influence of polymer structure on the interactions of cationic polymers with DNA and morphology of the resulting complexes. Gene Ther. 1997;4(8):823–832. | ||
von Harpe A, Petersen H, Li YX, Kissel T. Characterization of commercially available and synthesized polyethylenimines for gene delivery. J Control Release. 2000;69(2):309–322. | ||
Lachelt U, Kos P, Mickler FM, et al. Fine-tuning of proton sponges by precise diaminoethanes and histidines in pDNA polyplexes. Nanomedicine. 2014;10(1):35–44. | ||
Lin C, Blaauboer CJ, Timoneda MM, et al. Bioreducible poly(amido amine)s with oligoamine side chains: synthesis, characterization, and structural effects on gene delivery. J Control Release. 2008;126(2):166–174. | ||
Lavalle P, Picart C, Mutterer J, et al. Modeling the buildup of polyelectrolyte multilayer films having exponential growth. J Phys Chem B. 2003;108(2):635–648. |
Supplementary materials
 | Figure S1 1H NMR spectra of (A) pAPOL-1, (B) pAPOL-2, (C) pAPOL-3, and (D) dPEI. |
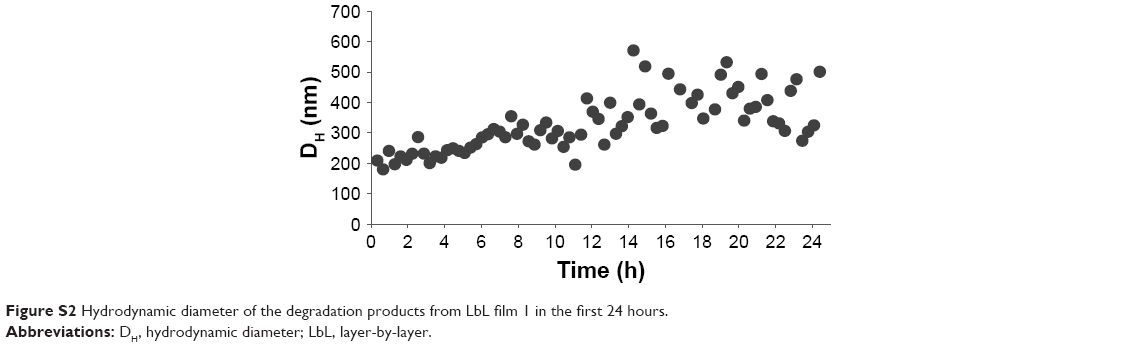 | Figure S2 Hydrodynamic diameter of the degradation products from LbL film 1 in the first 24 hours. |
 © 2018 The Author(s). This work is published and licensed by Dove Medical Press Limited. The
full terms of this license are available at https://www.dovepress.com/terms
and incorporate the Creative Commons Attribution
- Non Commercial (unported, 3.0) License.
By accessing the work you hereby accept the Terms. Non-commercial uses of the work are permitted
without any further permission from Dove Medical Press Limited, provided the work is properly
attributed. For permission for commercial use of this work, please see paragraphs 4.2 and 5 of our Terms.
© 2018 The Author(s). This work is published and licensed by Dove Medical Press Limited. The
full terms of this license are available at https://www.dovepress.com/terms
and incorporate the Creative Commons Attribution
- Non Commercial (unported, 3.0) License.
By accessing the work you hereby accept the Terms. Non-commercial uses of the work are permitted
without any further permission from Dove Medical Press Limited, provided the work is properly
attributed. For permission for commercial use of this work, please see paragraphs 4.2 and 5 of our Terms.