Back to Journals » Cancer Management and Research » Volume 10
Large-scale analysis reveals a novel risk score to predict overall survival in hepatocellular carcinoma
Authors Zheng YJ ![]() , Liu YL, Zhao SF, Zheng ZT, Shen CY, An L, Yuan YL
, Liu YL, Zhao SF, Zheng ZT, Shen CY, An L, Yuan YL
Received 25 July 2018
Accepted for publication 25 October 2018
Published 21 November 2018 Volume 2018:10 Pages 6079—6096
DOI https://doi.org/10.2147/CMAR.S181396
Checked for plagiarism Yes
Review by Single anonymous peer review
Peer reviewer comments 2
Editor who approved publication: Dr Ahmet Emre Eşkazan
Yujia Zheng,1,* Yulin Liu,1,* Songfeng Zhao,2 Zhetian Zheng,3 Chunyi Shen,1 Li An,4 Yongliang Yuan2
1Biotherapy Center, The First Affiliated Hospital of Zhengzhou University, Zhengzhou, Henan, China; 2Department of Pharmacy, The First Affiliated Hospital of Zhengzhou University, Zhengzhou, Henan, China; 3School of Computer Science, Yangtze University, Jingzhou, Hubei, China; 4Institute of Quality Standard and Testing Technology for Agro-products, Henan Academy of Agricultural Sciences, Zhengzhou, China
*These authors contributed equally to this work
Background: Hepatocellular carcinoma (HCC) is a major cause of cancer mortality and an increasing incidence worldwide; however, there are very few effective diagnostic approaches and prognostic biomarkers.
Materials and methods: One hundred forty-nine pairs of HCC samples from Gene Expression Omnibus (GEO) were obtained to screen differentially expressed genes (DEGs) between HCC and normal samples. The Kyoto Encyclopedia of Genes and Genomes (KEGG) pathway, Gene ontology enrichment analyses, and protein–protein interaction network were used. Cox proportional hazards regression analysis was used to identify significant prognostic DEGs, with which a gene expression signature prognostic prediction model was identified in The Cancer Genome Atlas (TCGA) project discovery cohort. The robustness of this panel was assessed in the GSE14520 cohort. We verified details of the gene expression level of the key molecules through TCGA, GEO, and qPCR and used immunohistochemistry for substantiation in HCC tissues. The methylation states of these genes were also explored.
Results: Ninety-eight genes, consisting of 13 upregulated and 85 downregulated genes, were screened out in three datasets. KEGG and Gene ontology analysis for the DEGs revealed important biological features of each subtype. Protein–protein interaction network analysis was constructed, consisting of 64 nodes and 115 edges. A subset of four genes (SPINK1, TXNRD1, LCAT, and PZP) that formed a prognostic gene expression signature was established from TCGA and validated in GSE14520. Next, the expression details of the four genes were validated with TCGA, GEO, and clinical samples. The expression panels of the four genes were closely related to methylation states.
Conclusion: This study identified a novel four-gene signature biomarker for predicting the prognosis of HCC. The biomarkers may also reveal molecular mechanisms underlying development of the disease and provide new insights into interventional strategies.
Keywords: hepatocellular carcinoma, GEO, TCGA, biomarker, differentially expressed genes
Introduction
Hepatocellular carcinoma (HCC) is the second leading cause of cancer mortality worldwide and the fourth highest cancer-related death in Chinese males, with a steady rise in the incidence every year.1–3 In recent years, the development of modern medicine and the combined use of various therapeutic strategies (surgical resection, ablation, or liver transplantation) have improved the HCC patient’s outcomes,4 but the overall 5-year survival rate is still unsatisfactory.5,6 Therefore, there is an urgent need to better understand the pathogenesis and progression in HCC and to find useful biomarkers for diagnosis and prognosis.
Tumorigenesis and cancer development are closely associated with genomic instability.7 Like other cancers, HCC is considered as a heterogeneous disease with various gene aberrations and complex altered multipathways.8 However, the precise molecular mechanisms underlying HCC progression are not thoroughly elucidated. Therefore, it is necessary to investigate the abnormal target molecules and new molecular mechanisms based on genomic instability, which could help in developing individualized strategies for the diagnosis and therapy of HCC. Genomic instability can be categorized into chromosomal instability, microsatellite instability, or significantly heightened levels of mutations at the nucleotide level, all of which can contribute to the development of cancer.9 With the advances in next-generation sequencing technology, numerous genetic alterations have been revealed, following understanding of the well-characterized chromosomal instability pathway. Furthermore, a variety of pathways are related to the progression and metastasis of HCC, such as the RalA signaling pathway,10 FGFR4 signaling pathway,11 and Rac signaling pathway,12,13 has been reported. Meanwhile, several biomarkers for diagnosis and treatment have been revealed.14–16 Some of the biomarkers contribute to understanding the pathogenesis of HCC17 or prognosticate the patients’ survival time.16,18 However, HCC is a heterogeneous disease with complex molecular mechanisms; thus, the occurrence and development of HCC are the result of mutations in multiple genes.19 Gene expression analysis can be used for profiling tumors and predicting their prognosis. Dysregulated genes in the genome between tumors and normal tissues have been verified as promising tool to classify diagnostic and prognostic biomarkers, as well as being therapeutic targets. With limited success achieved when focusing on a single protein or gene mutation, a multigene combination analysis may be more accurate to describe the molecular mechanisms of HCC.
Emerging information has shifted emphasis from specific gene sequences to mRNA and ultimately to proteins – the “central dogma of molecular biology.” RNA modifications are important mechanisms for controlling multiple aspects of RNA biochemistry and cellular function.20 The level of gene expression is associated with high DNA methylation,21 and methylation of genes is an important cause of human phenotypic variation. Genomic alterations are hallmarks of many types of diseases, and DNA methylation is an epigenetic modification that is important in cancer development.22,23 In the past two decades, the potential use of DNA methylation as biomarkers for cancer diagnosis has received attention.24
In general, disease-free survival or relapse-free survival has been used to determine the validity of putative biomarkers of prognosis. However, because the overall survival (OS) is considered to be the ultimate detection standard of therapeutic benefits, a more accurate prognostic assessment model based on patients’ OS is needed. Our findings provided a valid indicator for predicting the prognosis using datasets and bioinformatics analysis.
In this study, we performed univariate and multivariate survival analyses to identify a prognostic signature for OS of HCC based on the intersection of differentially expressed genes (DEGs) and clinical data from The Cancer Genome Atlas (TCGA). A four-gene signature was established by building a reliable likelihood-based survival model. Importantly, the prognostic value of this four-gene signature was evaluated and verified by another HCC gene expression dataset from Gene Expression Omnibus (GEO).
Materials and methods
Patients
One hundred HCC patients were recruited in this study that was approved by the Institutional Ethical Committee of the First Affiliated Hospital of Zhengzhou University, China, and is in accordance with the precepts established by the Declaration of Helsinki. All patients gave written informed consent. Fifty fresh tissues and adjacent normal liver tissues were collected from patients with untreated stage I to stage IV HCC between September 2016 and April 2018. Fifty formalin-fixed paraffin-embedded HCC tissue samples from the same institution were collected between November 2012 and September 2014 to examine SPINK1, TXNRD1, LCAT, and PZP expression at protein level.
Data study
Three mRNA expression datasets were downloaded from the GEO (https://www.ncbi.nlm.nih.gov/geo/), with the accession number of GSE57957, GSE64041, and GSE76427, including 37, 60, and 52 paired HCC tissue samples, respectively, used for discovering DEGs. Unpaired samples were removed.
Another transcriptional level data of HCC samples with clinical data for the screening of prognostic signature were obtained from TCGA (https://tcga-data.nci.nih.gov/). We used GEO (https://www.ncbi.nlm.nih.gov/geo/) with the accession number of GSE14520 (242 HCC samples with detailed clinical data) to verify the risk model. Methylation data were downloaded from the TCGA website.
All the tumor tissue samples and nontumor tissue samples were analyzed by the following methods.
Identification of differential expression genes
To identify DEGs between HCC and adjacent normal tissues, R (version 3.5.1, Auckland, New Zealand) was used to apply significance analysis of microarray with limma version 3.34.8 (http://www.bioconductor.org/packages/release/bioc/html/limma.html) package25 in these three GEO datasets consisting of GSE57957, GSE64041, and GSE76427. The DEGs in HCC samples compared with adjacent normal tissues were obtained with the thresholds of absolute log2-based fold change (log2FC)>1 and adjusted P-value <0.05. We also analyzed the DEGs in these datasets by Venn analysis and found the intersection genes screened out in all three datasets.
Annotation of DEGs
We used gene oncology and KEGG pathway enrichment (https://www.kegg.jp/) methods to analyze the overlapping upregulated and downregulated differential expression genes, respectively. The online tool DAVID (http://david.abcc.ncifcrf.gov/)26 was used to analyze and annotate the genes. All biological characteristics were listed. P<0.05 was considered the level of statistical significance.
Protein–protein interaction (PPI) network
We used an online database (http://string.embl.de/) to construct a PPI network of DEGs and analyze the functional interactions between proteins. Confidence score >0.7 was considered of great significance. Subsequently, we used Cytoscape software (3.5.1) to visualize the results done by the tool online.27
Survival analysis
To analyze the correlation between OS and gene expression, we used the Kaplan–Meier method. The statistical significance of OS was determined with the log-rank test based on the χ2 distribution. Survival analysis and the survival curve were performed with R. The samples with top and bottom expression levels were grouped high and low according to the cutoff point, respectively.
Prognostic index model
Multivariate Cox survival analysis was used to create the prognostic index model for HCC patients. This analytical method is based on the importance of score assigned to each gene. To create the Cox regression model, we calculated the risk score for each patient based on the individual gene expression levels of the screened genes. Then, the formula of this prognostic index model was completed, as follow, prognostic index (PI)=0.06324 × relative expression of SPINK1 + 0.18856 × relative expression of TXNRD1 + (−0.15727) × relative expression of LCAT + (−0.098) × relative expression of PZP. The relative expression value was defined as follows: score 1, < cutoff value; score 2, > cutoff value.
RNA isolation and quantitative real-time PCR
Total mRNA from HCC tissues was extracted with TRIzol reagent (Takara Bio, Kusatsu, Japan), and RNA was reverse transcribed with PrimeScript RT Reagent Kit (Takara Bio, Otsu, Shiga, Japan). Subsequently, expression levels of genes were quantified by qRT-PCR with SYBR Green qPCR Master Mix (Roche, Mannheim, Germany), with the housekeeping gene GAPDH used to normalize gene expression. The 2−ΔΔCt method was used to calculate the gene expression changes. The sequence of PCR primers used in this study is given in Table S1.
Immunohistochemistry (IHC)
Detection of SPINK1, TXNRD1, LCAT, and PZP protein expression was carried out on human HCC sections with IHC staining as described. Results of IHC staining were evaluated and scored by two individuals. Proportion of stained tumor cells was graded as follows: 0 (no positive tumor cells), 1 (<25% positive tumor cells), 2 (26%–50% positive tumor cells), 3 (51%–75% positive tumor cells), and 4 (>76% positive tumor cells). Scores for the intensity of staining were shown as follows: 0 (negative), 1 (weak), 2 (moderate), and 3 (strong). Staining index (SI) was calculated as staining intensity × proportion of positive tumor cells, resulting in scores of 0, 1, 2, 3, 4, 6, 8, 9, and 12. When SI score was ≥6, the tissue was considered high expression, and an SI score ≤4 was considered low expression.
Statistical analysis
All data analyses were carried out with Prism 6.0 (GraphPad, San Diego, CA, USA) or R (version 3.5.1). Data were expressed as mean ± SD, and univariate and multivariate analyses were performed with the Cox proportional hazards regression model. Student’s t-test was performed to analyze the differences between two groups. The Kaplan–Meier method was used to establish survival curves, and the survival differences were compared using the log-rank test. Differences were considered statistically significant for P<0.05 (*P<0.05; **P<0.01; ***P<0.001; ****P<0.0001).
Results
Flow chart of this work
Significance and Venn analysis were performed with R to identify DEGs. We categorized 98 DEGs (13 upregulated genes and 85 downregulated genes) in gene oncology, KEGG, and PPI analyses by using Kaplan–Meier method and Cox regression to identify a four-gene signature that could predict OS for HCC patients according to clinical data from TCGA database. To further evaluate the performance of this gene signature, another GEO cohort (GSE14520) was validated. Finally, we analyzed the key four-gene expression in TCGA, GSE14520, and clinical samples. Methylation analysis, which might display the potential mechanism of regulating expression of those genes, was used (Figure 1).
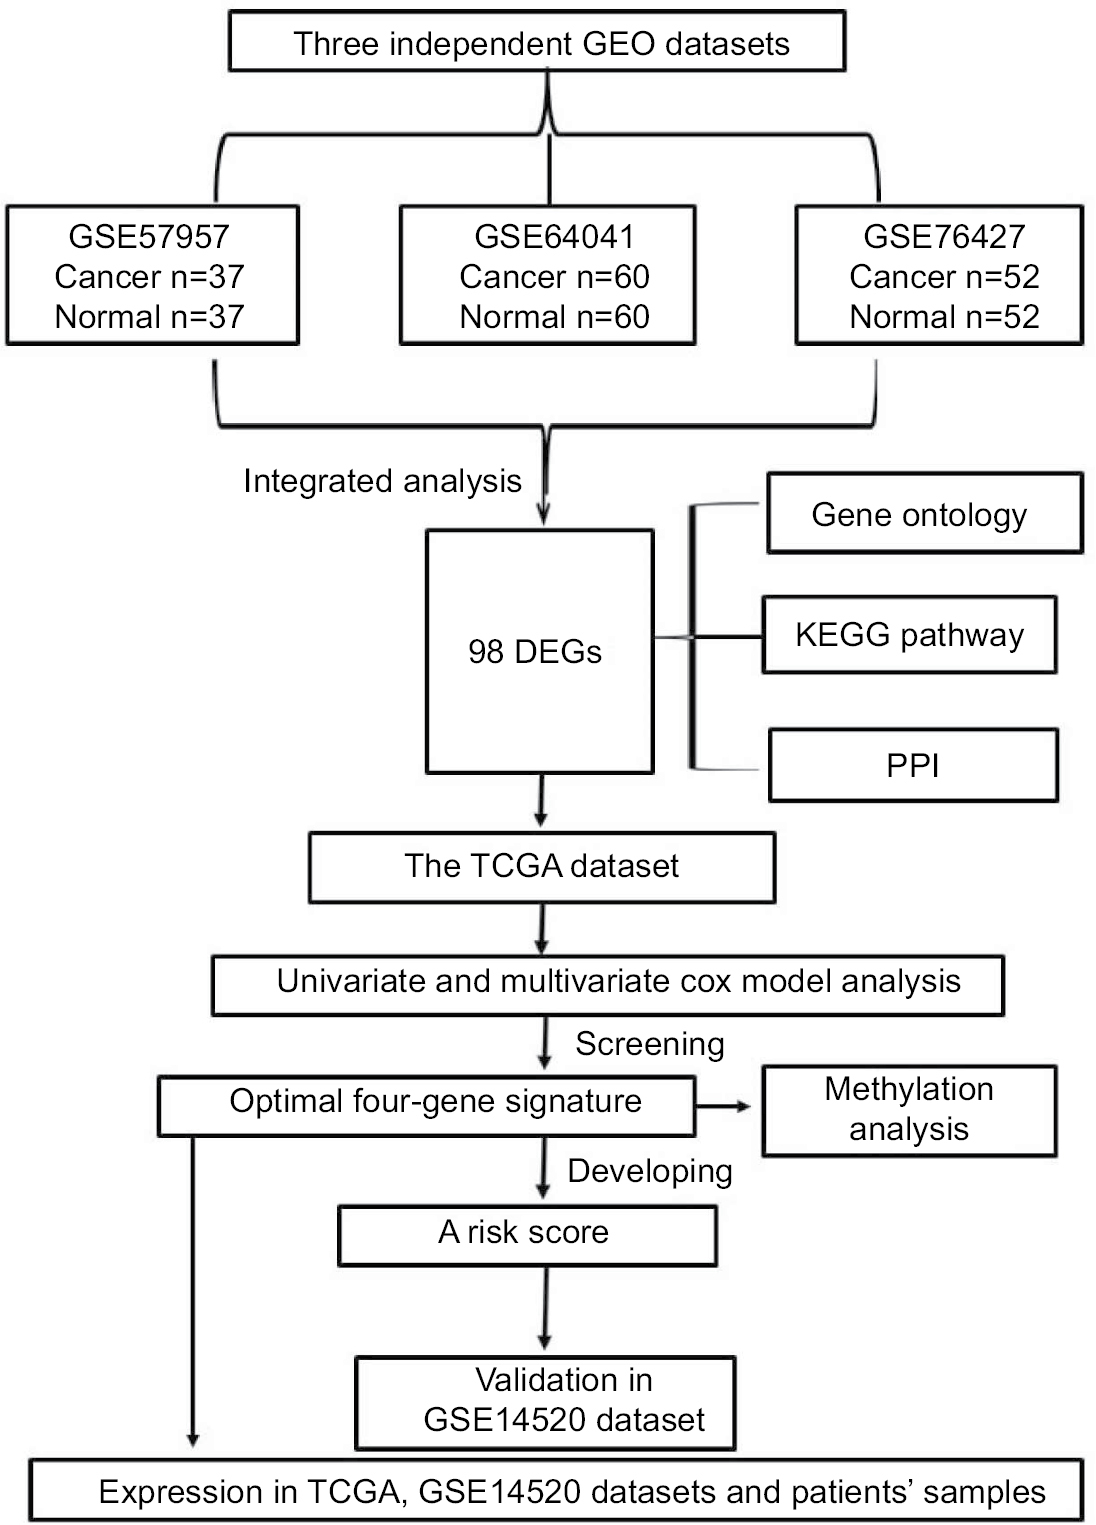 | Figure 1 Flowchart of bioinformatics analysis. Abbreviations: DEGs, differentially expressed genes; GEO, Gene Expression Omnibus; KEGG, Kyoto Encyclopedia of Genes and Genomes; PPI, protein–protein interaction; TCGA, The Cancer Genome Atlas project. |
Identification of differential expression genes
The genes significantly dysregulated in HCC were identified based on the three GEO datasets, with unpaired samples removed. Based on analysis of these three independent cohorts, 397, 298, and 482 DEGs were demonstrated from GSE57957, GSE64041, and GSE76427 datasets, respectively (Figure 2A). In addition, we identified all the DEGs that could differentiate HCC from the adjacent normal tissues in each independent dataset, using hierarchical clustering (Figure 2B).
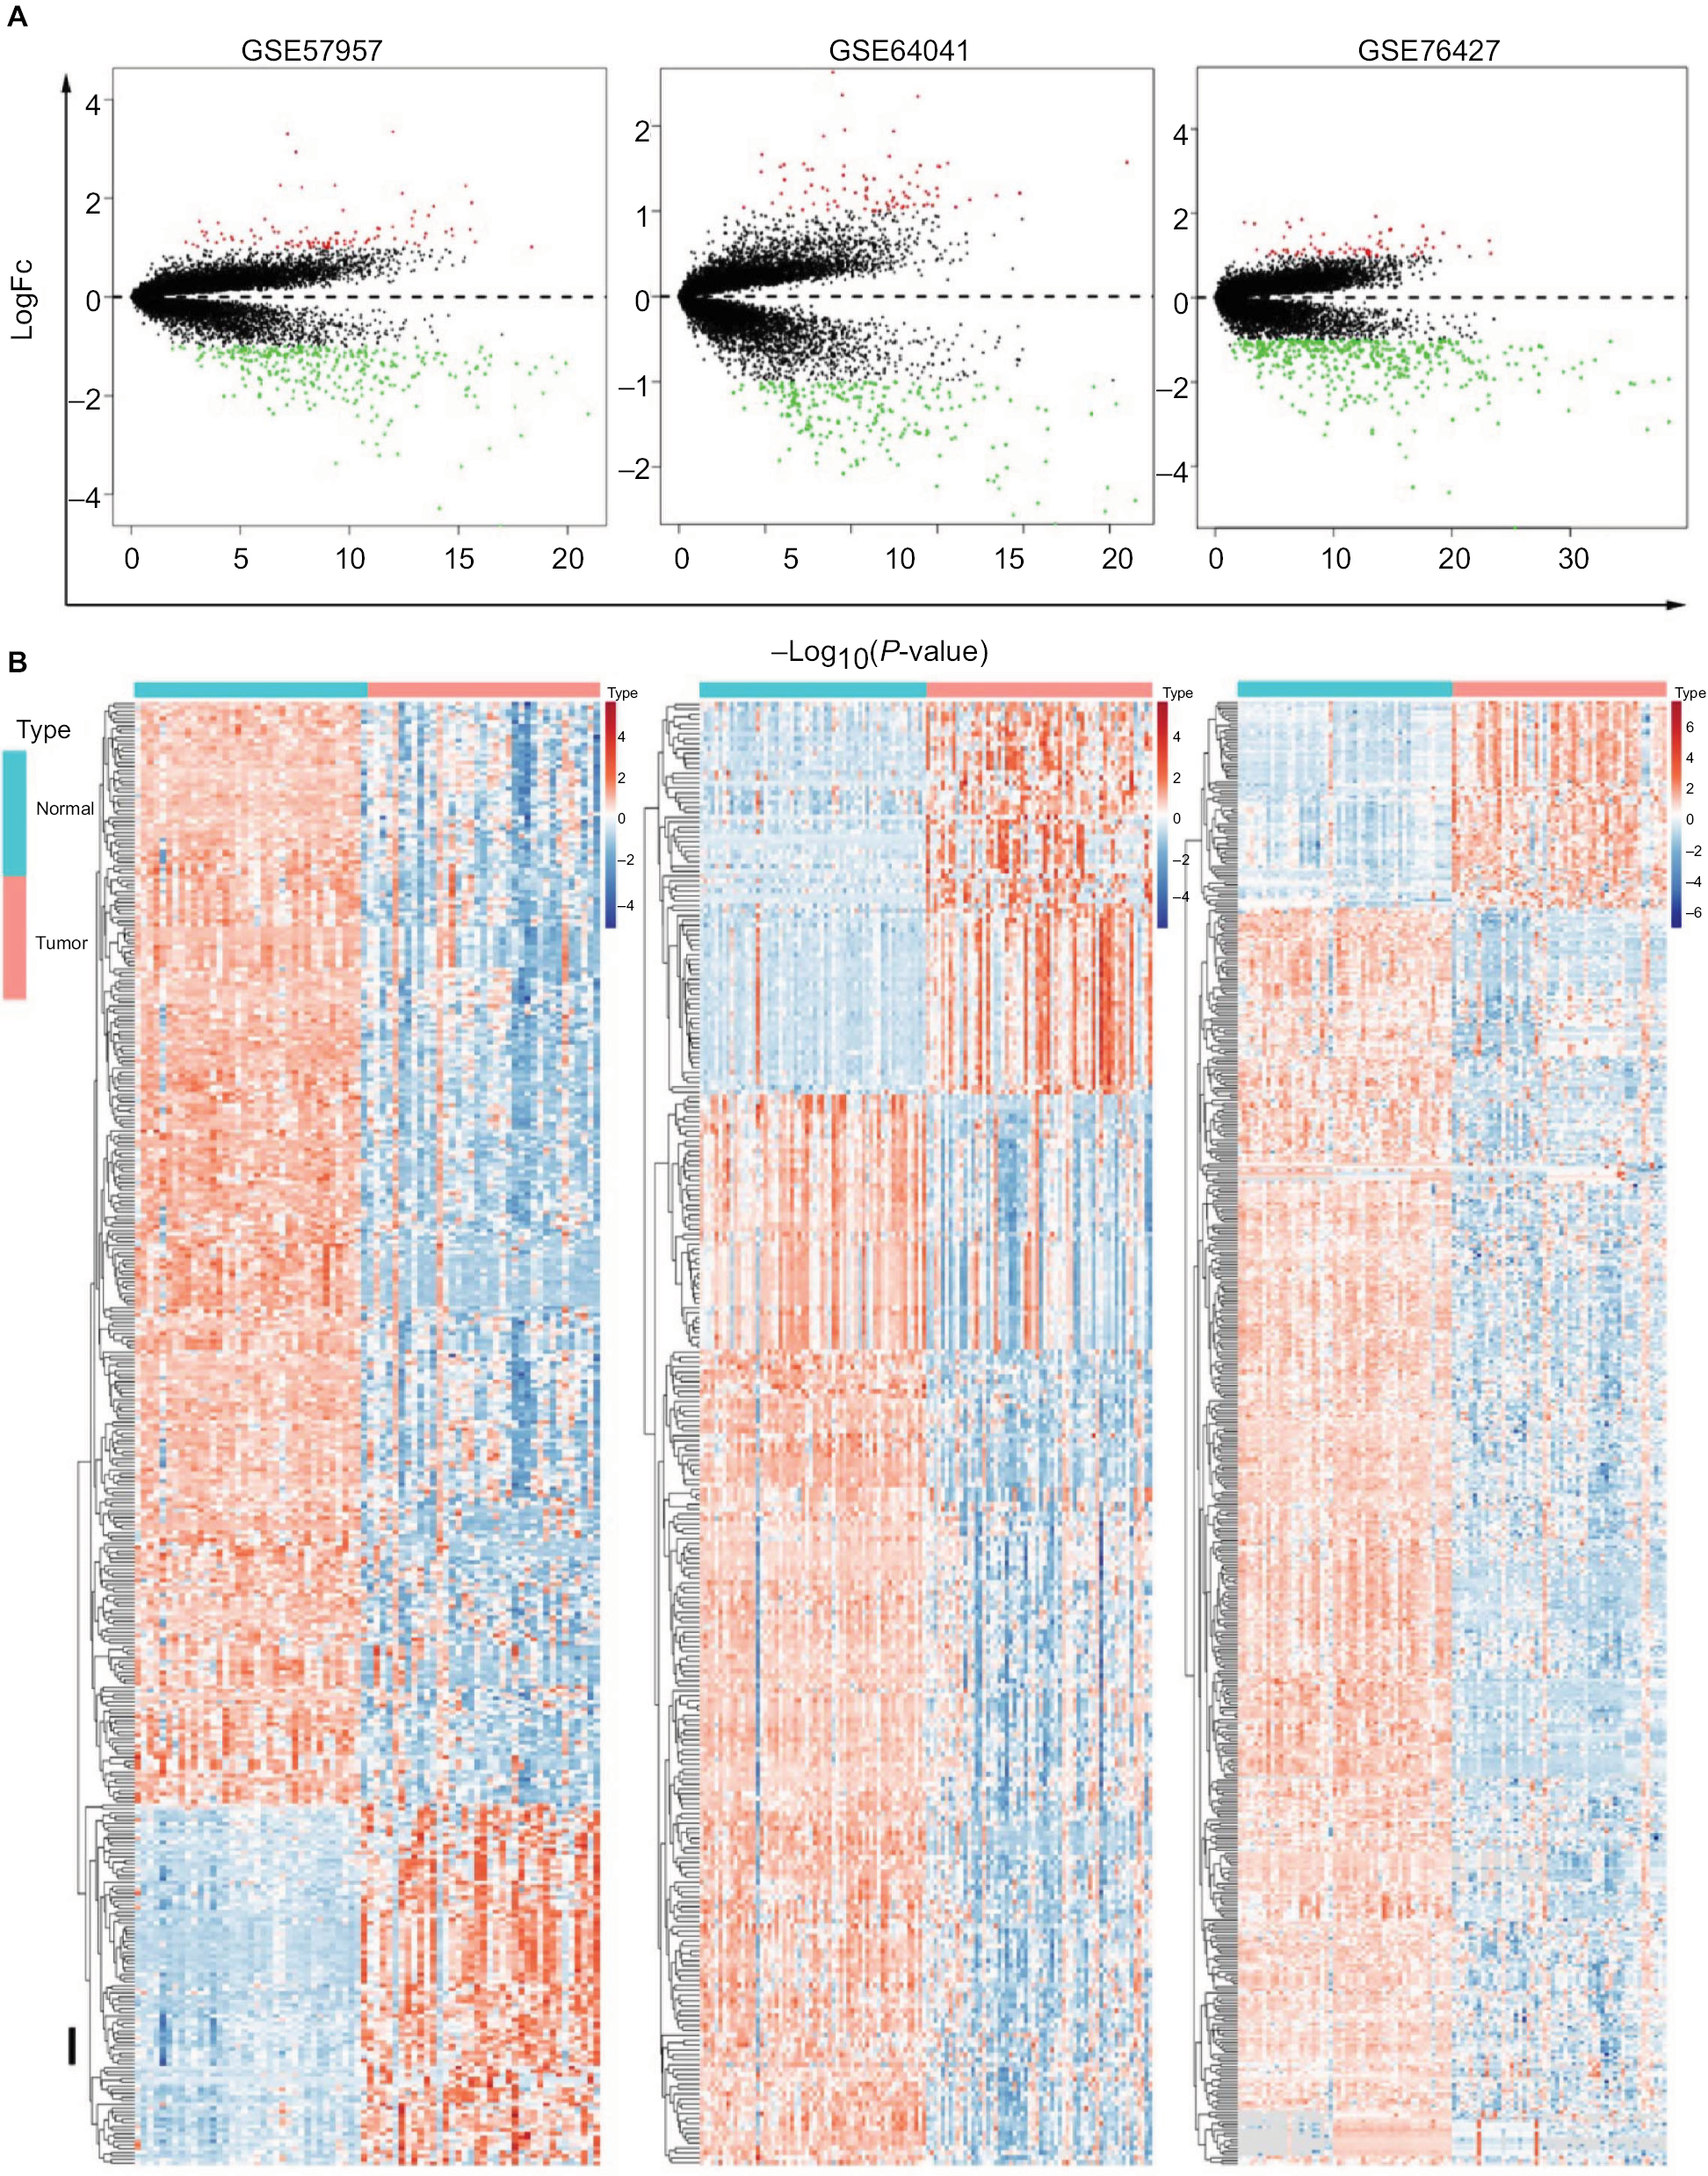 | Figure 2 Identification of DEGs in HCC-mRNA expression profiling datasets. Notes: (A) Volcano plot of DEGs in datasets GSE57957, GSE64041, and GSE76427. (B) Cluster analysis of DEGs in these three GEO datasets. Abbreviations: DEGs, differentially expressed genes; FC, fold change; GEO, Gene Expression Omnibus; HCC, Hepatocellular carcinoma. |
Gene oncology and KEGG pathway enrichment analysis for the intersection genes
Given the abundant DEGs and the muddled data, we wished to find common rules in the three different datasets. First, in GSE57957, GSE64041, and GSE76427 datasets, we divided all the DEGs into upregulated genes and downregulated genes compared with genes in adjacent normal tissues. We then overlapped the upregulated DEGs from the three different datasets and found that there were 13 upregulated genes in all datasets; 85 genes were screened out in the downregulated DEGs (Figure 3A). To further investigate the characteristics of identified DEGs, we used gene oncology and KEGG pathway enrichment methods to analyze the intersection DEGs. No terms were obtained from upregulated genes for the limited numbers of genes. While we observed that the 85 downregulated genes mainly enriched in biological processes associated with the oxidation–reduction process (Figure 3B) and most of the genes were located in extracellular region (Figure S1). Moreover, we had some different findings when performing KEGG pathway enrichment analysis; the 13 upregulated DEGs were mainly related to oocyte meiosis (Figure 3C), and the downregulated DEGs were most strongly correlated with metabolic pathways. And retinol metabolism, tryptophan metabolism, and chemical carcinogenesis also had great significance, which were consistency with analyzing by gene oncology annotation (Figure 3B, C). With the help of KEGG pathway enrichment (https://www.kegg.jp/), we mapped the regulatory network of genes with significant differences (Figure S2).
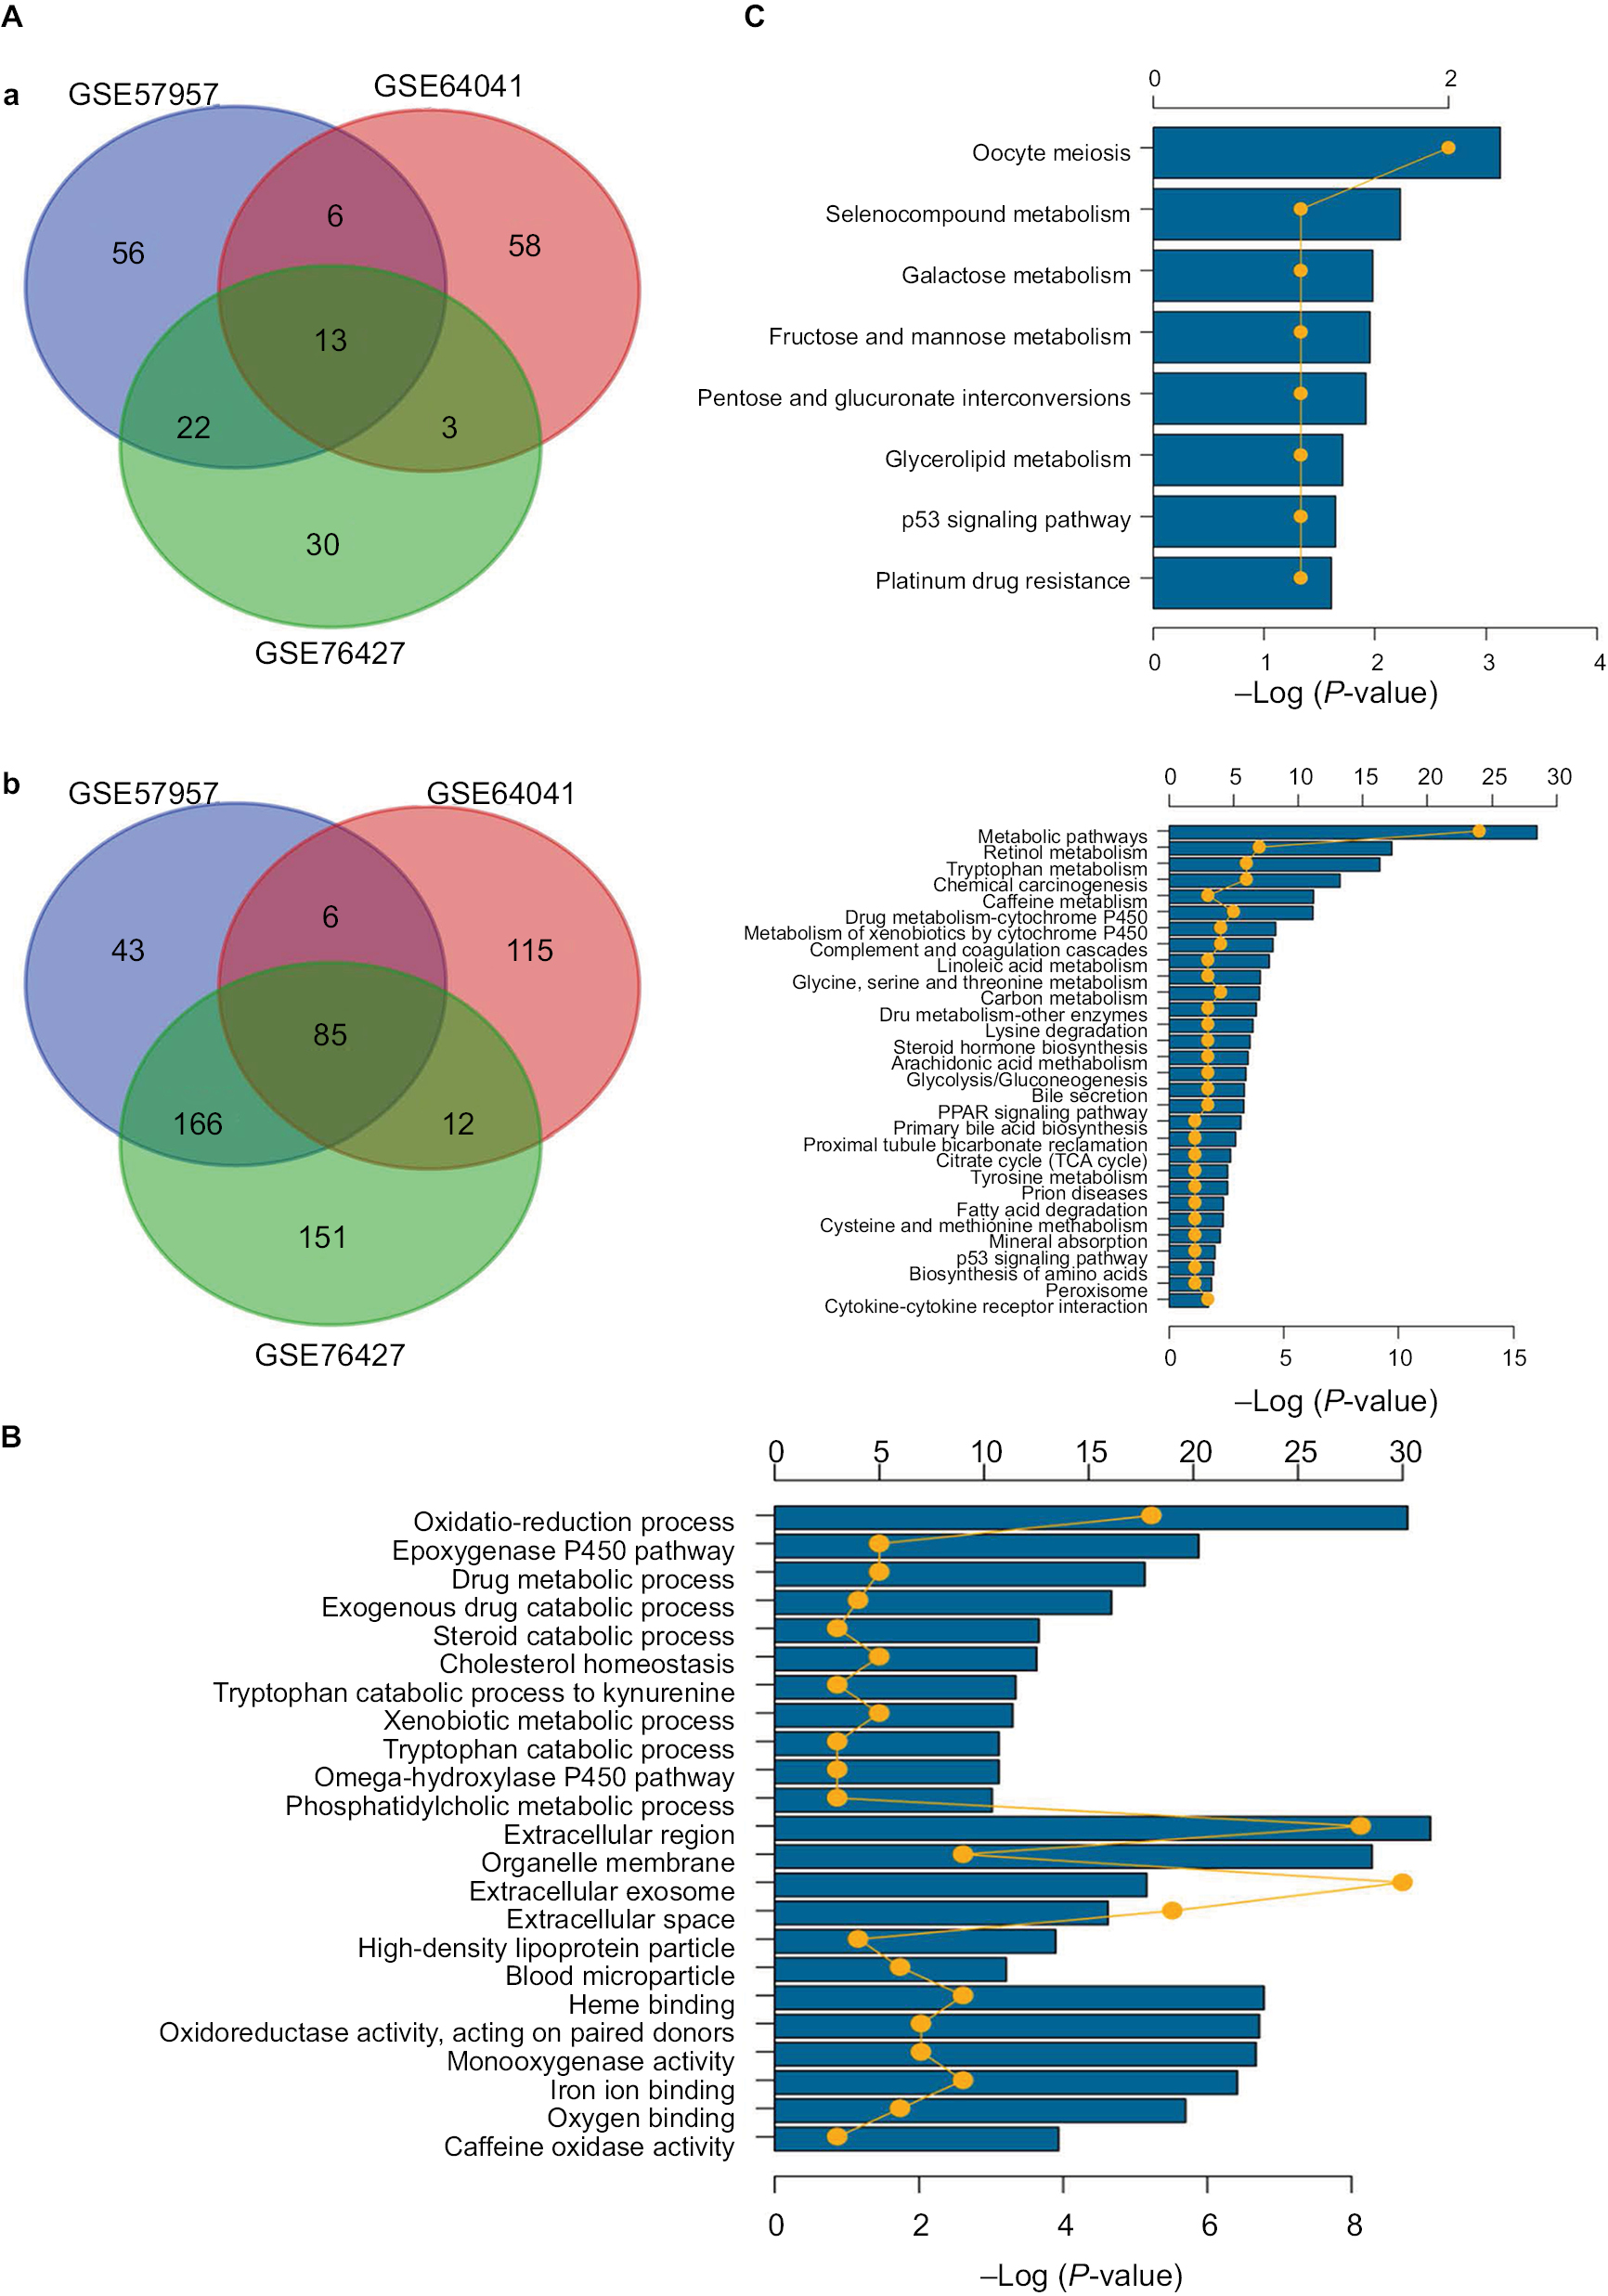 | Figure 3 Gene oncology and KEGG pathway enrichment analysis of intersection mRNAs. Notes: (A) Venn diagram analysis of DEGs in comparison groups (a) upregulated DEGs and (b) downregulated DEGs. (B) Gene oncology analysis of downregulated intersection DEGs. (C) KEGG pathway enrichment analysis of upregulated and downregulated intersection DEGs. Abbreviations: DEGs, differentially expressed genes; KEGG, Kyoto Encyclopedia of Genes and Genomes. |
PPI network analysis
To find the correlation between the corresponding proteins encoded by DEGs, we constructed a PPI network of DEGs, including 85 downregulated genes and 13 upregulated genes (Figure 4). We found that there were 64 nodes and 115 edges in the PPI network (average node degree of 3.58 and average local clustering coefficient = 0.285), and the functional enrichment in this kind of PPI network was similar to gene oncology and KEGG pathway enrichment analysis, which indicates that these genes may play a role not only at the mRNA level but also at the protein level.
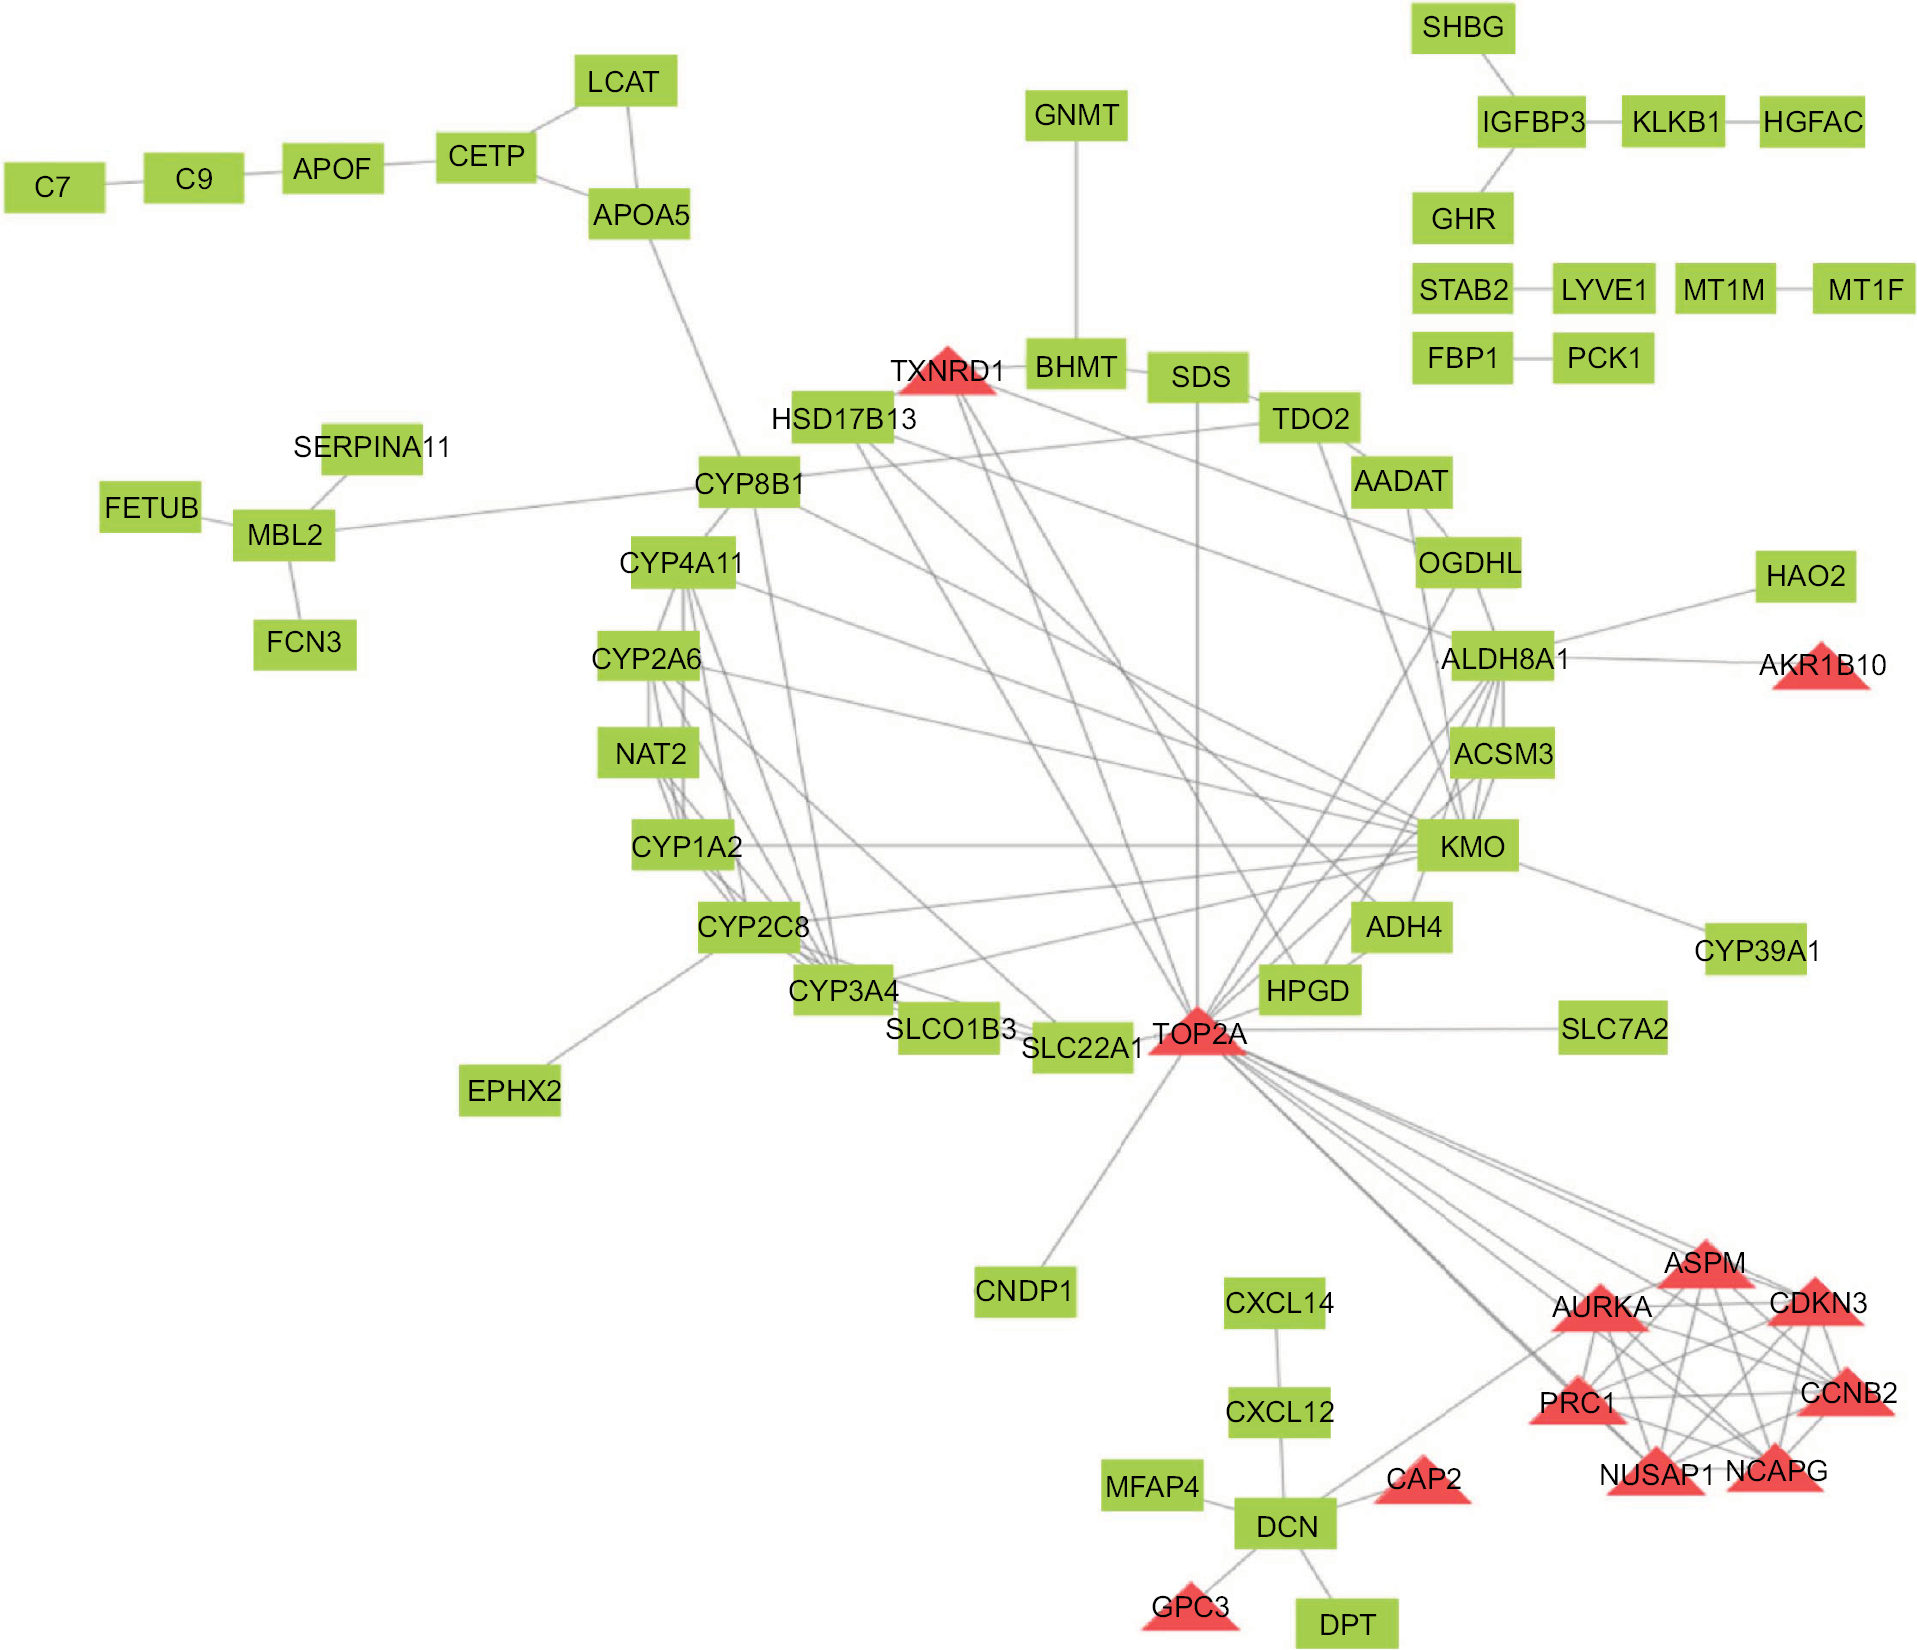 | Figure 4 PPI network of DEGs. Red means upregulated genes and green indicates downregulated genes. Abbreviations: DEGs, differentially expressed genes; PPI, protein–protein interaction. |
Construction of the DEG-based prognostic signature
To further investigate these differential expression genes in identification value and the risk implications of HCC and to guide the subsequent effective treatment for patients as well, we sought to determine which genes could differentiate high-risk from low-risk HCC patients. Most of the previous studies suffered from a lack of systematical evaluation because a single biomarker gene for prognosis may lack sensitivity and specificity. None of the genes or proteins function alone but form a network through interaction. Therefore, we used Cox regression analysis to search for a model that could predict the risk of HCC accurately.
First, we performed univariate Cox regression analysis of the DEGs individually to find which genes were associated with survival. Twenty-nine genes were correlated with prognosis (Table 1). Furthermore, to better understand which of the 29 candidate genes are more critical in evaluation of clinical outcome, multivariate Cox regression analysis was performed using a forward conditional method based on the results of univariate analysis. Only four genes were identified (Table 2): serine peptidase inhibitor Kazal type 1 (SPINK1), thioredoxin reductase 1 (TXNRD1), lecithin-cholesterol acyltransferase (LCAT), and alpha-2-macroglobulin like (PZP). Based on the estimated Cox regression coefficient, we then established a prognostic risk model. The risk score formula was as follows: risk score = 0.06324 × relative expression of SPINK1 + 0.18856 × relative expression of TXNRD1 + (−0.15727) × relative expression of LCAT + (−0.098) × relative expression of PZP.
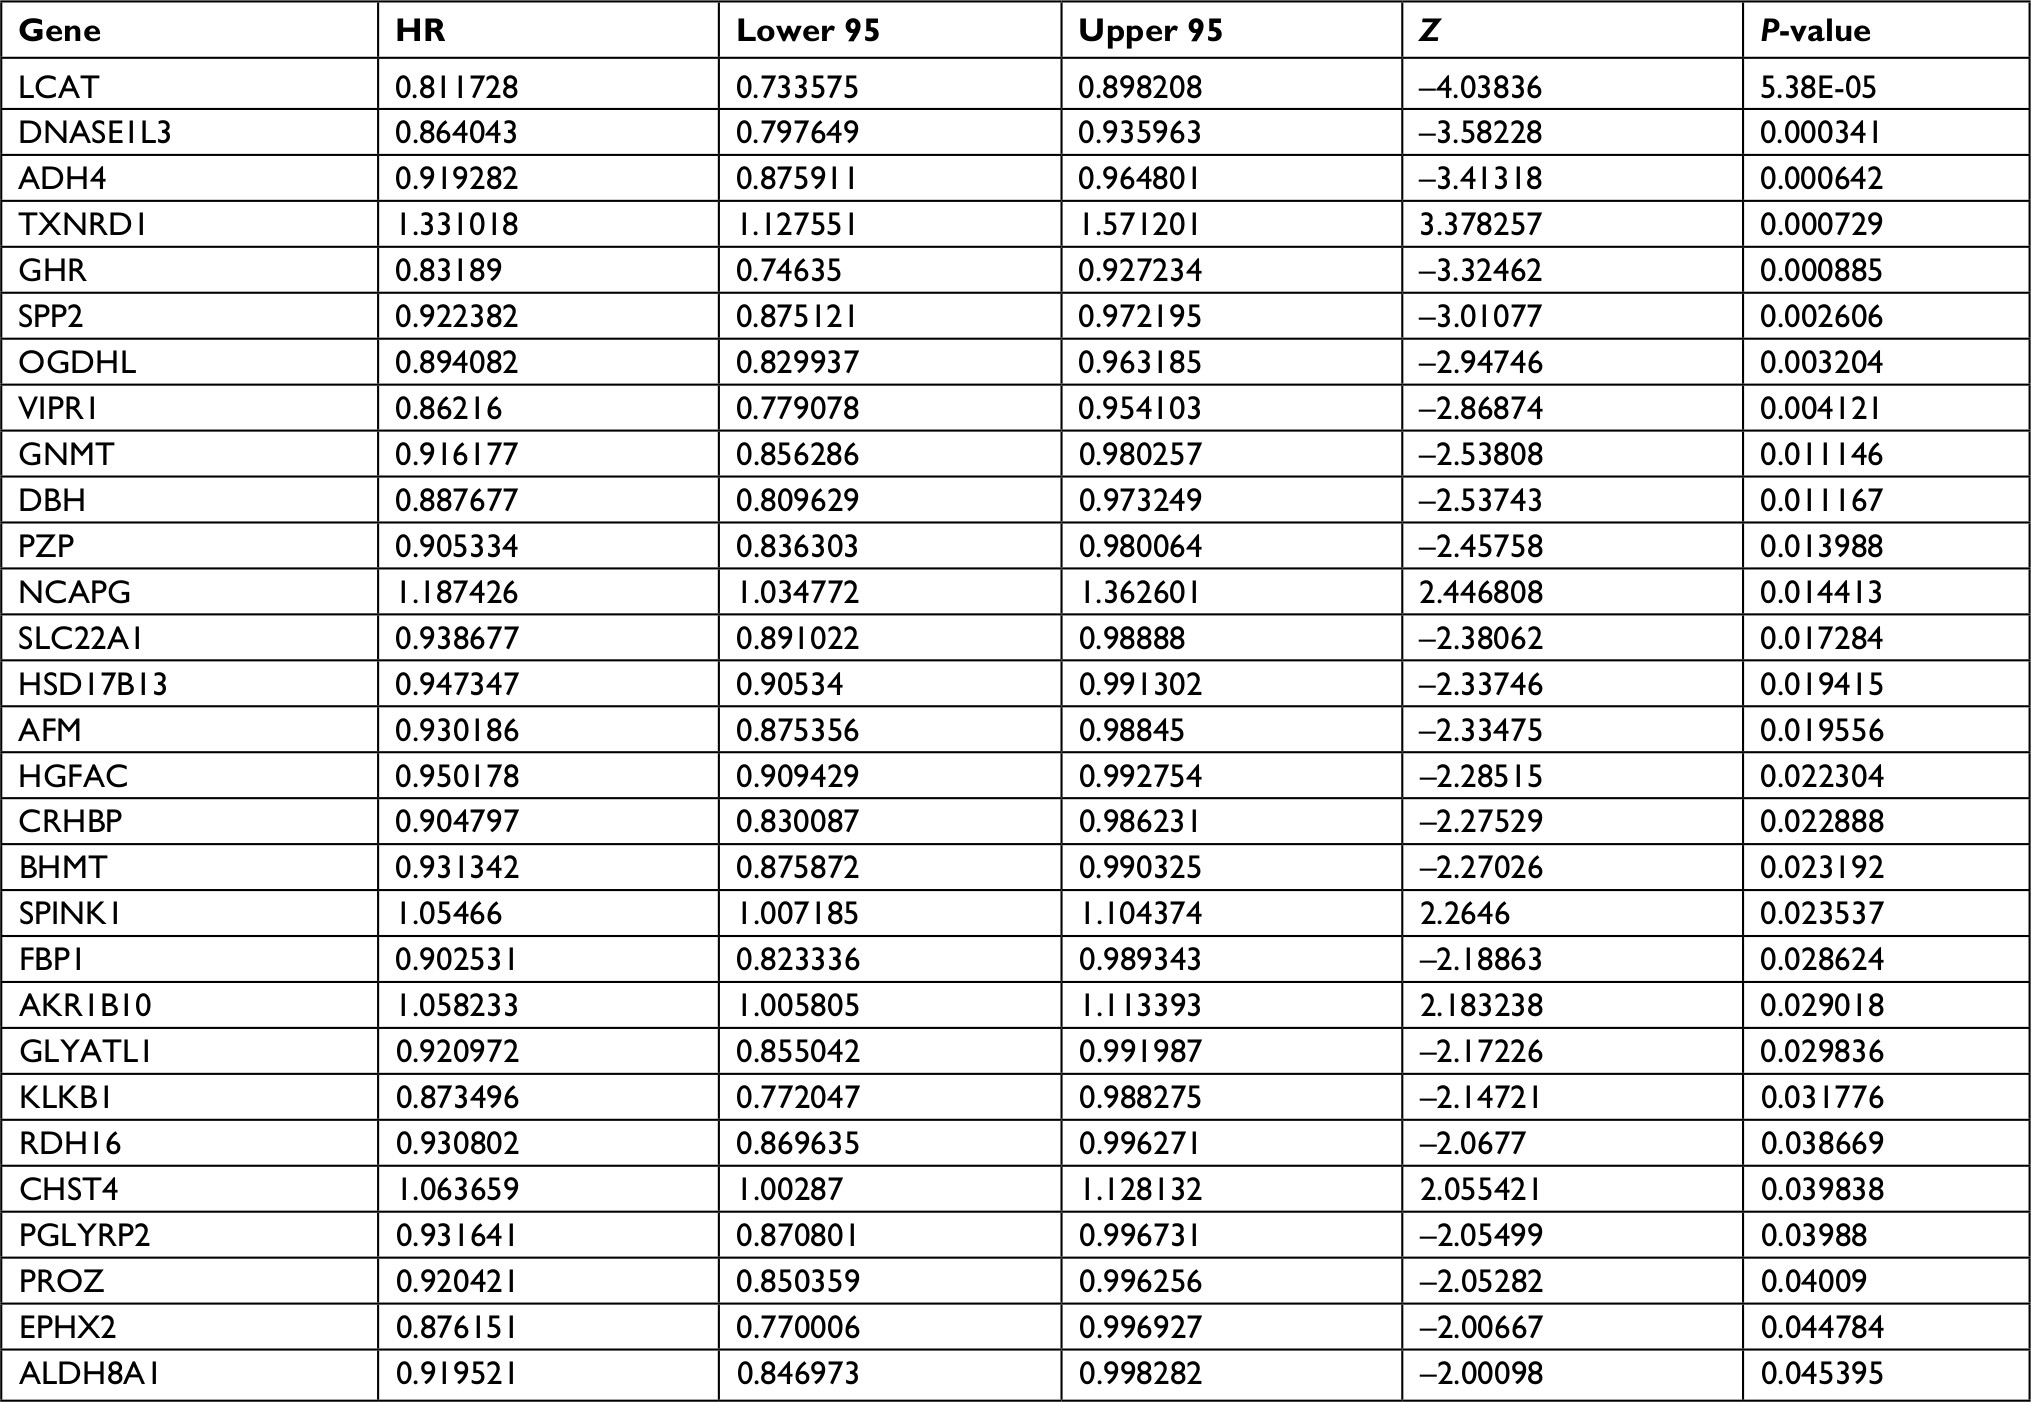 | Table 1 Univariate Cox regression analysis: P<0.05 |
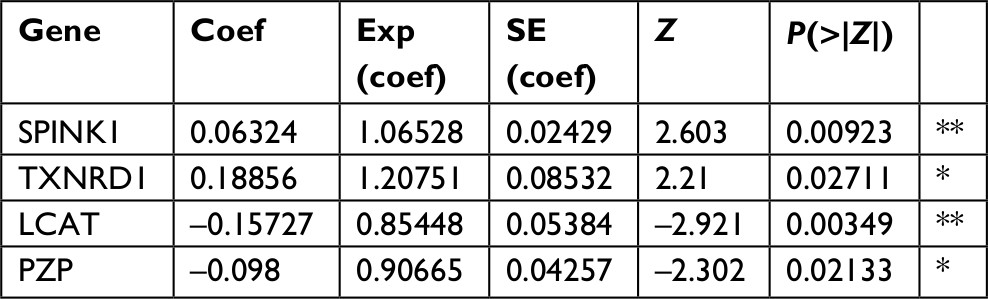 | Table 2 Coefficients of the four-gene signature for the risk score Note: *P<0.05, **P<0.01. Abbreviation: coef, coefficients. |
Next, we used Kaplan–Meier survival analysis to evaluate the prognostic impact of model on both the low-risk and high-risk groups. We found that the association between risk score and survival time of HCC patients was statistically significant, with the low-score patients (n=150) showing a substantial advantage in OS time compared with the high-score group patients (n=180) (Figure 5A, B). Patients with a high-risk score had a significantly increased risk of death. To explore the relationship among these survival-related genes with the risk scores and the true contributions of these genes to the HCC, we performed cluster analysis of every patient’s genes according to their risk scores, as the heat map shown in Figure 5A. Results indicated that SPINK1 and TXNRD1 were augmented in the high-risk score group. While LCAT and PZP mainly contributed to the low-risk scores. It is very easy to verify this conclusion from the risk prediction formula. These results independently predicted the oncogene role of SPINK1 and TXNRD1. In contrast, LCAT and PZP may serve as cancer suppressor gene.
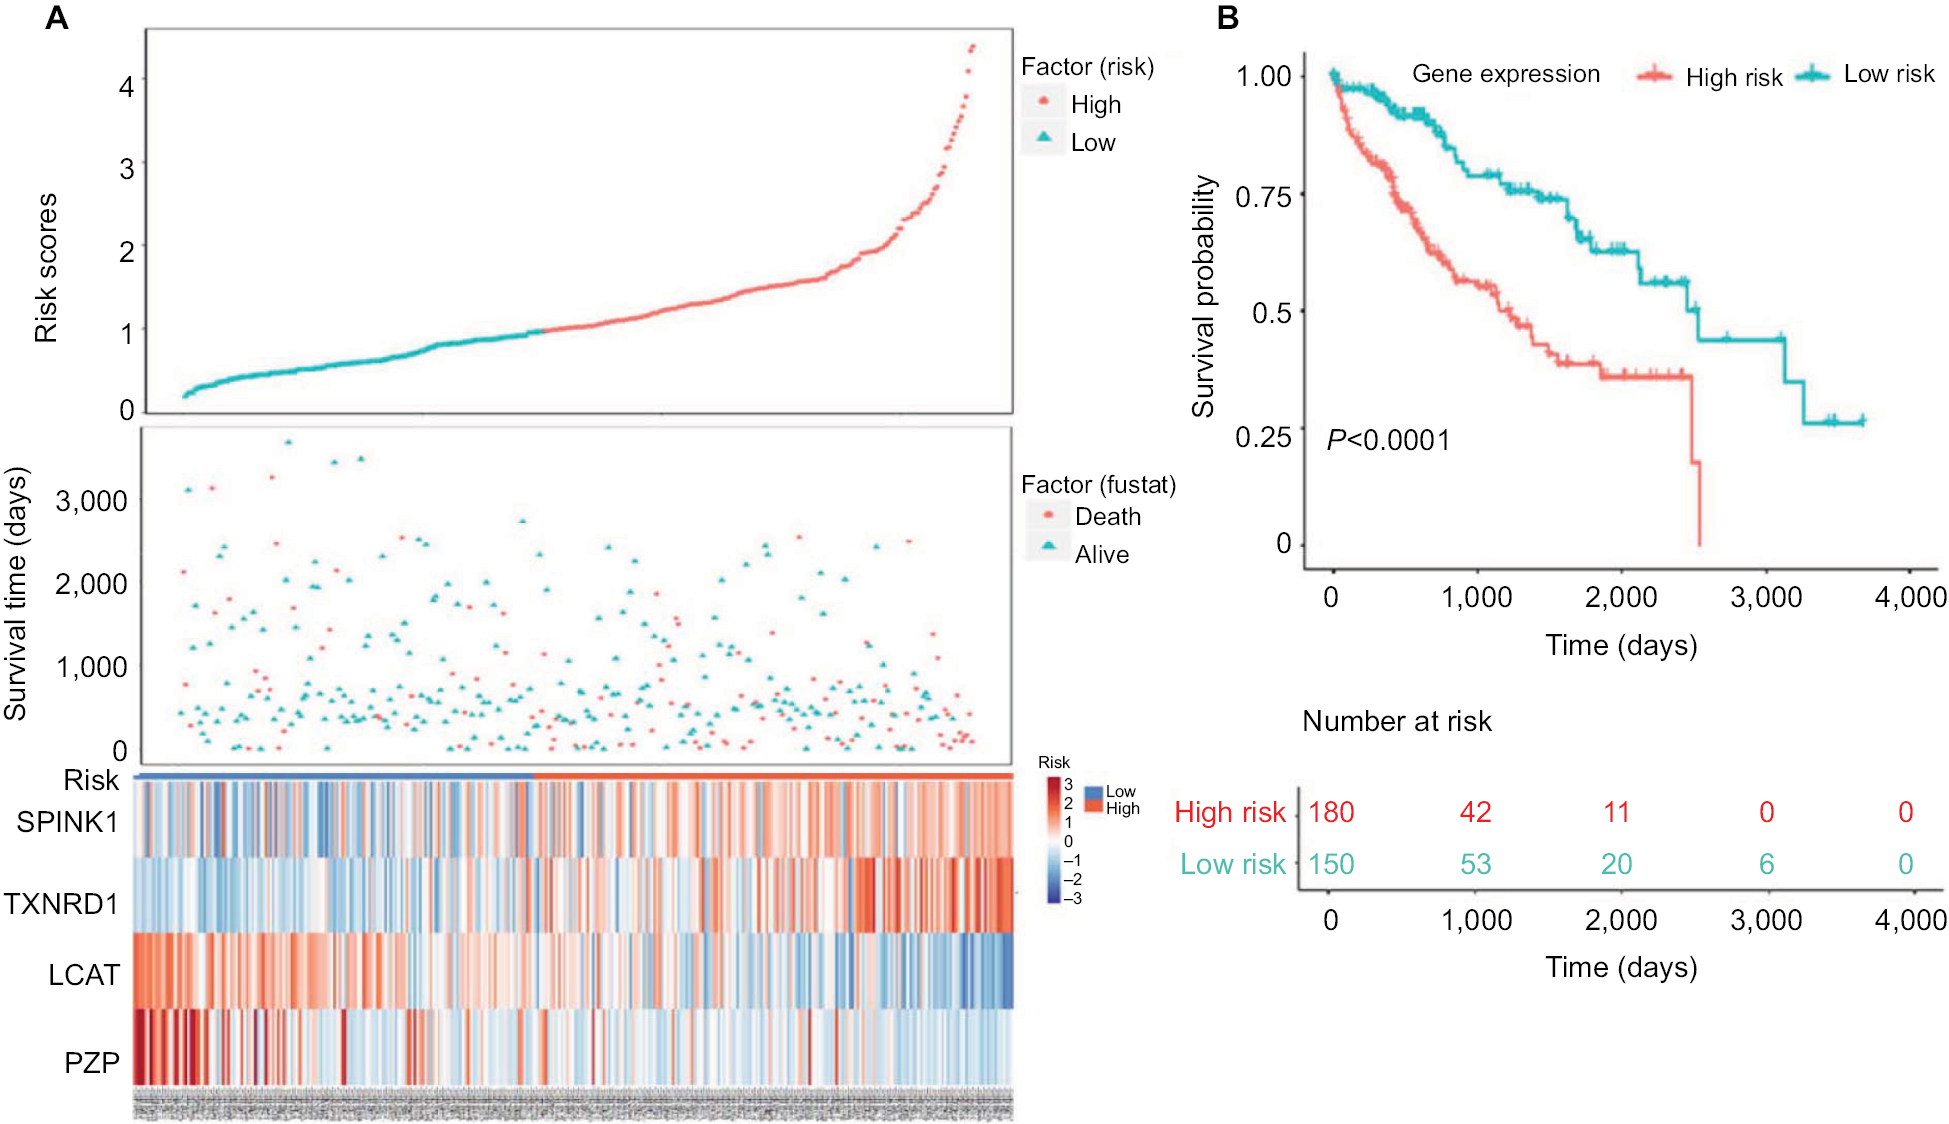 | Figure 5 Four-gene signature prognostic risk scoring model analysis of HCC patients’ prognosis in TCGA dataset. Notes: (A) Distribution of patients’ survival status and four prognostic DEGs’ expression heat map in low-risk and high-risk groups. (B) Kaplan–Meier survival curves for low-risk and high-risk groups. Abbreviations: DEGs, differentially expressed genes; HCC, hepatocellular carcinoma; TCGA, The Cancer Genome Atlas project. |
Validation of the four-gene risk prediction model in GEO dataset
To verify the risk prediction model, we tested this model in the validation cohort. Another microarray dataset GSE1452028 was acquired, which included detailed gene expression information and survival time of HCC patients from the GEO database. The visual diagram and the heat map of the contribution of each gene are illustrated in Figure 6A. The risk scores of every patient were calculated, and the high-risk scores predicted by our model (n=152) were significantly worse than those of low-risk scores (n=69) (Figure 6B). These results were further evidence that we had established a risk prediction model.
 | Figure 6 Validation of four-gene signature prognostic risk scoring model of HCC patients in GSE14520 dataset. Notes: (A) Distribution of patients’ survival status and four prognostic DEG expression heat map in low-risk and high-risk groups. (B) Kaplan–Meier survival curves for low-risk and high-risk groups. Abbreviations: DEGs, differentially expressed genes; HCC, hepatocellular carcinoma. |
Identification of target genes expression
To confirm that the expression trends of SPINK1, TXNRD1, LCAT, and PZP were of identical in TCGA, GEO (GSE14520) databases and tumor tissues of HCC patients. We detected the differential expression of the four genes in tumor tissues and adjacent tissues. We found that SPINK1 and TXNRD1 were highly expressed in tumor tissues, whereas the expression of LCAT and PZP was significantly decreased in tumor tissues of HCC patients compared with nontumor tissues (Figure 7A). These results were further verified by IHC analysis in HCC patients’ samples, which revealed that SPINK1 and TXNRD1 protein are highly expressed, whereas LCAT and PZP are expressed at low levels in primary tumor cells of HCC patients (Figure 7B). In a set of 50 HCC patients for whom OS data were available, patients with higher SPINK1 or TXNRD1 protein expression had shorter OS than did those with lower expression. And in tumor tissues, the higher LCAT or PZP protein expression had longer OS (Figure 7C). Taken together, these data suggest that SPINK1 and TXNRD1 are upregulated, while LCAT and PZP are reduced in tumor tissues. The expression of SPINK1 or TXNRD1 protein is negatively correlated with prognosis, and LCAT or PZP is positively correlated with prognosis.
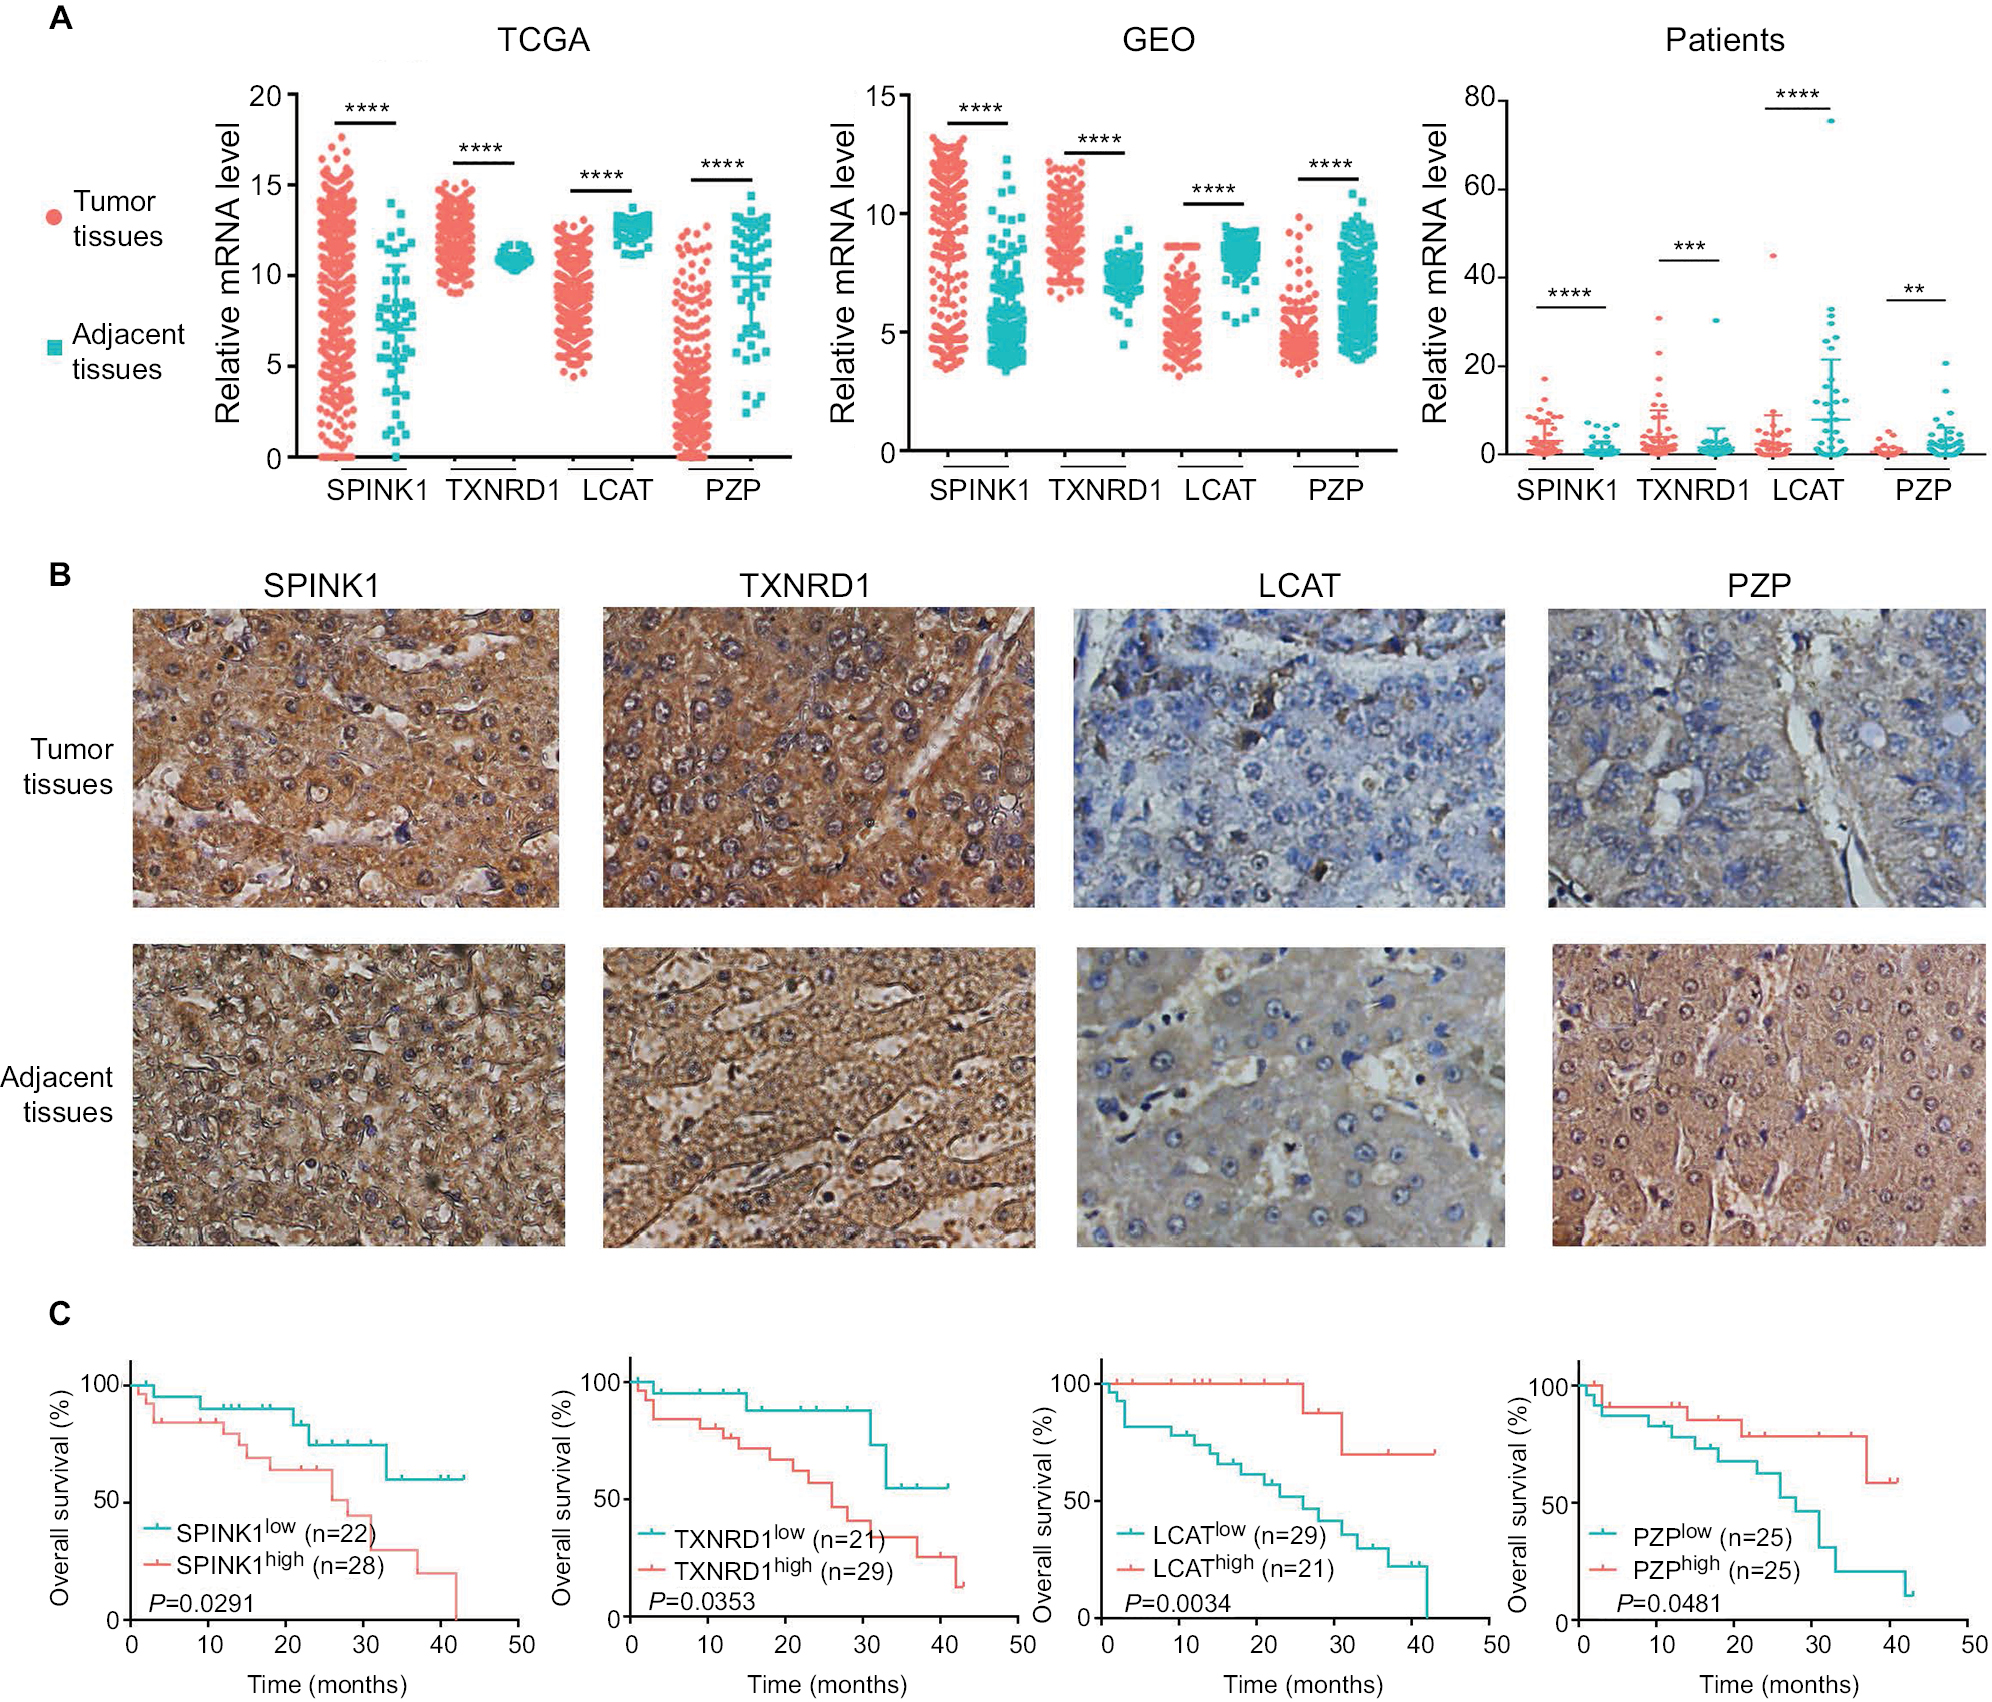 | Figure 7 The expression of SPINK1, TXNRD1, LCAT, and PZP in gene and protein levels. Notes: (A) Relative mRNA levels of SPINK1, TXNRD1, LCAT, and PZP expression in TCGA, GSE14520 dataset, and human liver tumor tissues and adjacent normal tissues in patients (n=50). (B) Immunohistochemistry staining of HCC specimens with antibodies specific for SPINK1, TXNRD1, LCAT, or PZP. Original magnification, ×200. (C) Kaplan–Meier analysis of overall survival was stratified by expression levels of SPINK1, TXNRD1, LCAT, and PZP protein expression. **P<0.01, ***P<0.001, ****P<0.0001. Abbreviations: GEO, Gene Expression Omnibus; HCC, hepatocellular carcinoma; TCGA, The Cancer Genome Atlas project. |
Methylation of the four prognostic genes
As previous copious literature published, aberrant DNA methylation in gene promoter regions plays a crucial role in the pathogenesis of cancer.29,30 To better understand this concept, we analyzed the relationship between the four prognostic genes and methylation. We found that the expression of the genes was significantly negatively correlated with their methylation (Figure 8A, C, D) except for TXNRD1, which had only a trend toward negative correlation (Figure 8B). As methylation is important in hepatocellular carcinogenesis, we want to determine which characteristics of the HCC are associated with the four key genes. Thus, we analyzed these data in MEXPRESS (http://mexpress.be/)31 and found that the methylation of SPINK1 correlated with sample type (Figure S3A). Therefore, we divided the HCC into three sample types: primary solid tumor, normal solid tissue, and recurrent solid tumor. And we found that the methylation of SPINK1 had the strongest correlation with normal solid tissue and recurrent solid tumor, which had higher degree of malignancy than did primary solid tumor. We then analyzed the other three genes in the same way. The methylation of TXNRD1 was mainly correlated with patients’ ages at the time of diagnosis of HCC and Ishak fibrosis score (Figure S3B), and the methylation of PZP also had strong relation with sample type (Figure S3D). As we had documented above, this kind of oncogene was mainly associated with the less malignant type, ie, primary solid tumor, while the methylation of LACT contributes to the pathological stage (Figure S3C). These data confirmed that methylation was of great importance in hepatocellular carcinogenesis in different ways.
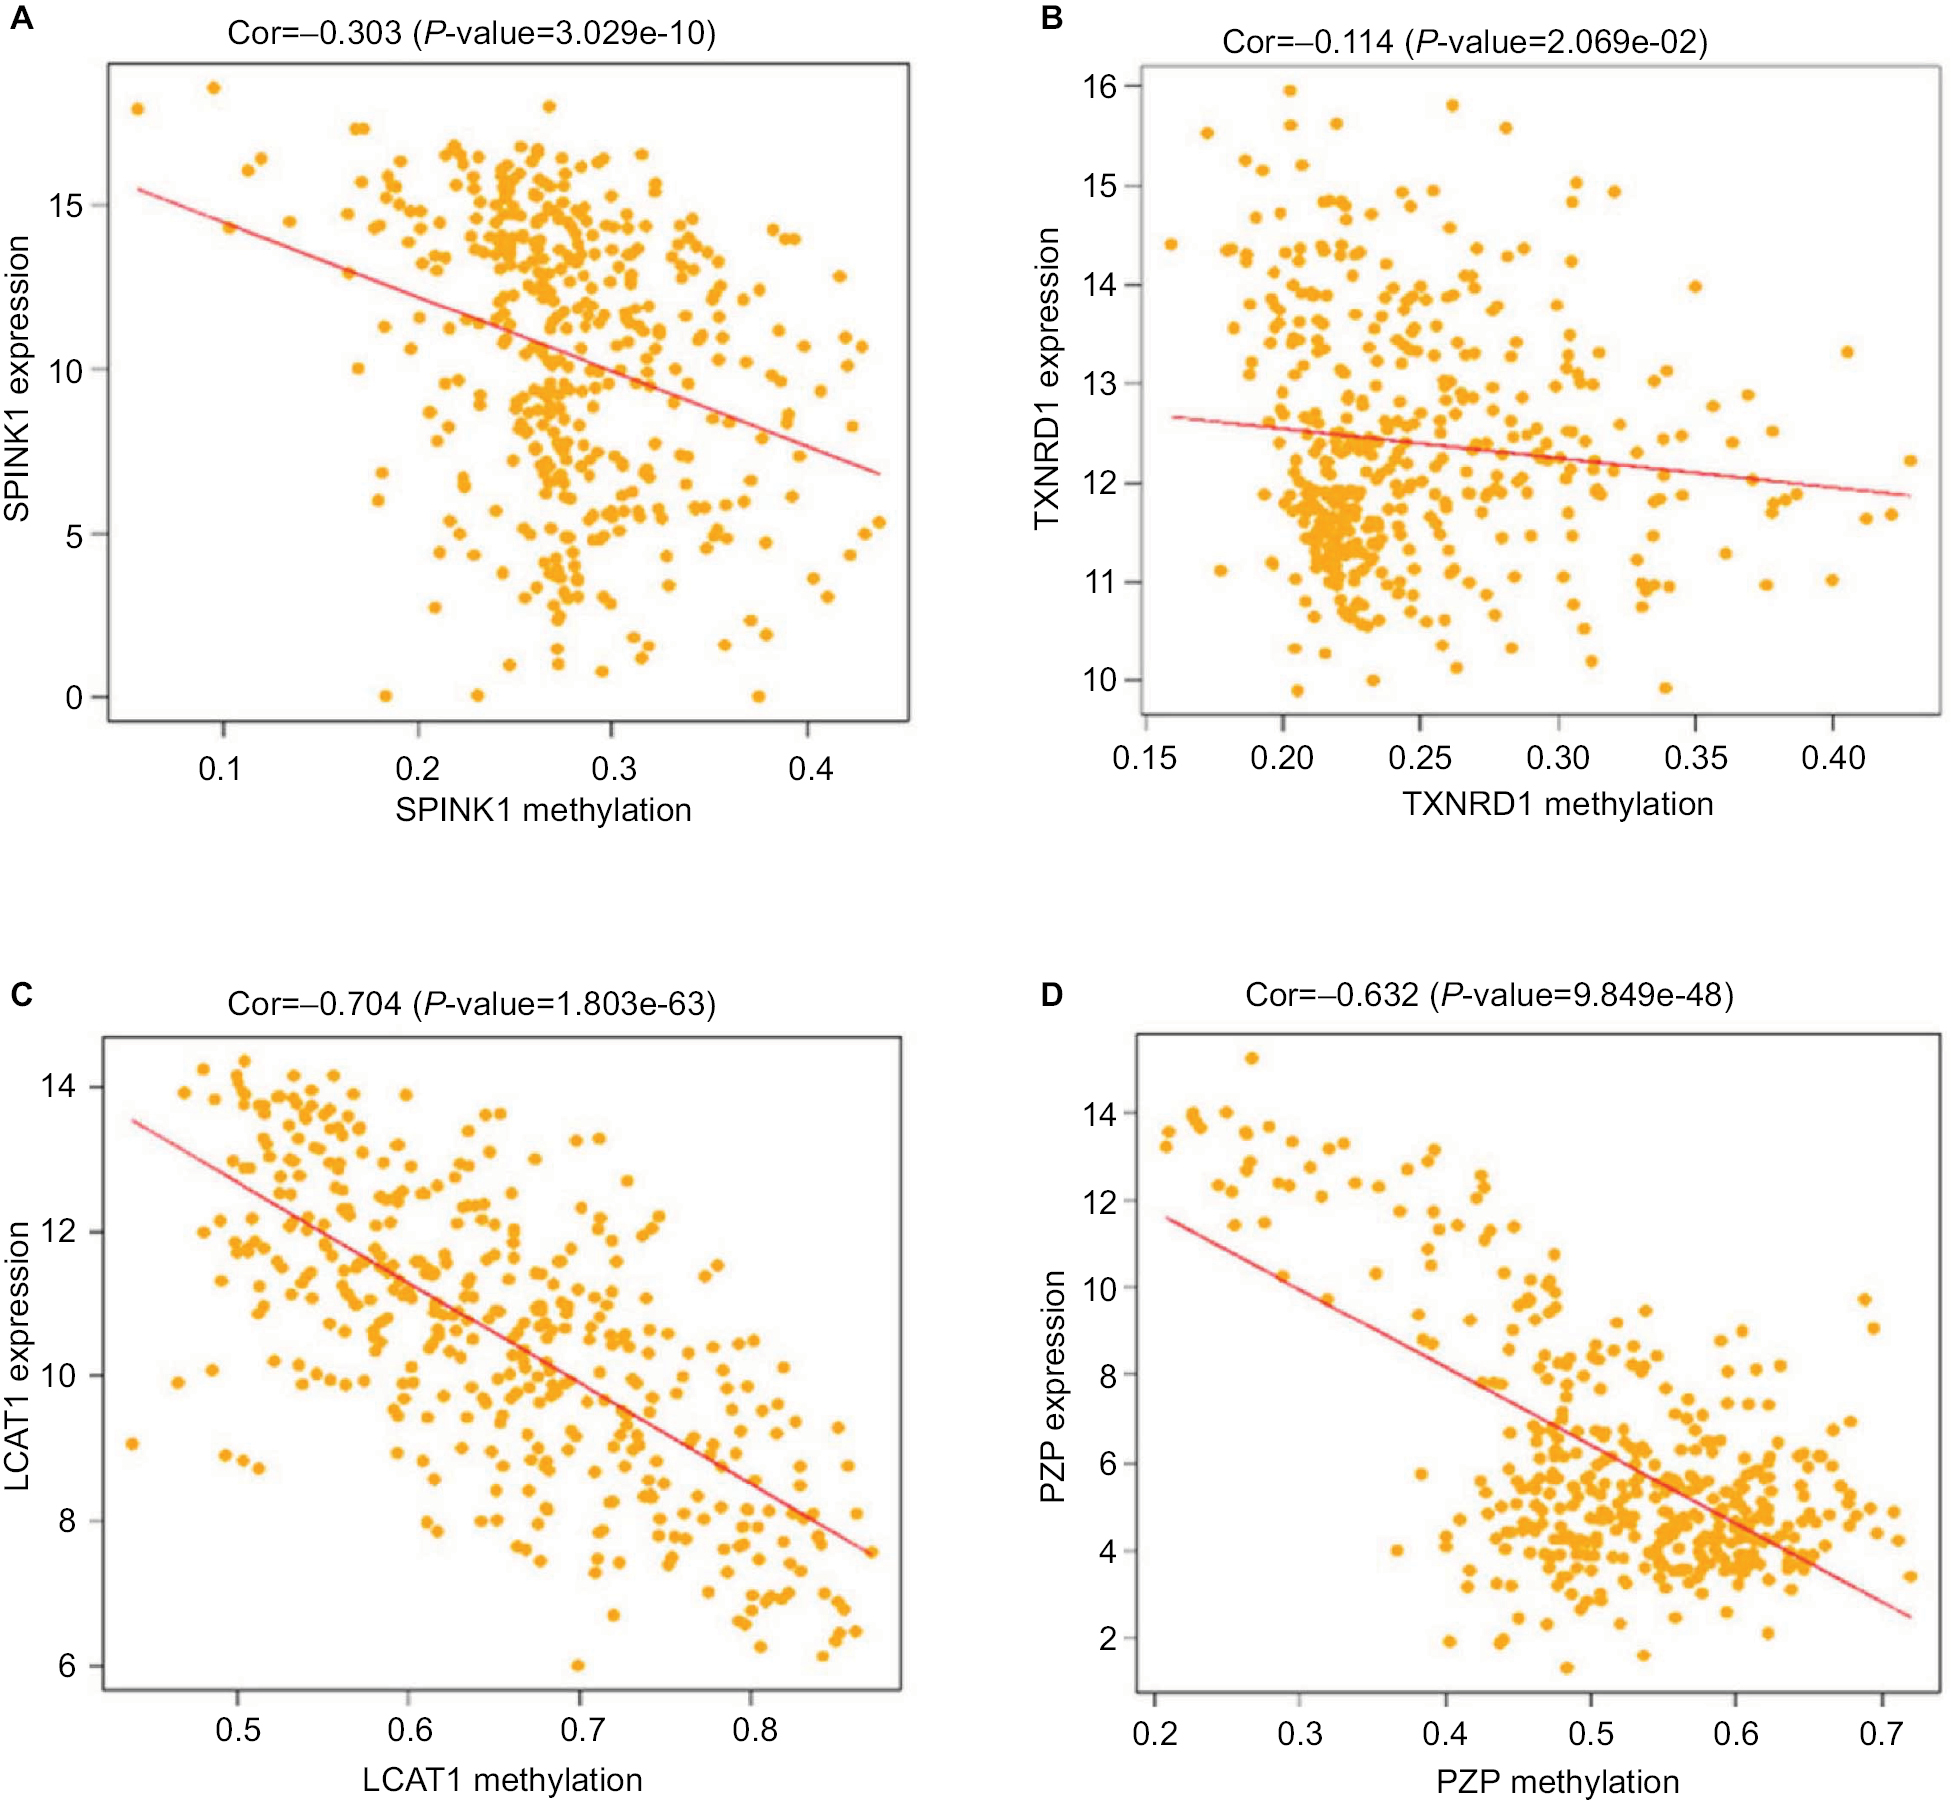 | Figure 8 Correlation analysis between the expression of SPINK1, TXNRD1, LCAT, and PZP and their methylation. Notes: (A) The correlation analysis between SPINK1 and methylation. (B) The correlation analysis between TXNRD1 and methylation. (C) The correlation analysis between LCAT and methylation. (D) The correlation analysis between PZP and methylation. Abbreviations: Cor, correlation; TCGA, The Cancer Genome Atlas project. |
Discussion
HCC is a major contributor to both cancer incidence and mortality, with >700,000 new cases per year.32 Surgical resection, liver transplantation, and ablation by radiofrequency or ethanol injection are now conventional therapies at early disease stages. With these options, survival at 5 years ranges between 50% and 70%.33 The 5-year survival rates for patients with HCC undergoing surgery are low because a large proportion of tumors are unresectable or have already metastasized before diagnosis. This study achieved its goal of finding a valid indicator for predicting the prognosis of HCC, using bioinformatics analysis.
Biomarkers not only serve as accurate tools in cancer prognostication but also have implications for measuring treatment responses, surveilling tumor recurrence, and guiding clinical decision making.34 For selecting suitable therapies and improving prognosis, it is important to find accurate targets that can predict survival. Over the past decades, in-depth analysis of databases to find potential genes for prognosis prediction has been widely used in the management of tumors, such as colon cancer,35,36 lung cancer,37,38 and glioma.39 In HCC, gene expression-based signatures for prognosis prediction have been investigated in many studies, and numerous genetic alterations have been revealed. In this article, a six-gene-based prognostic signature for HCC OS prediction had been demonstrated.32 By performing bioinformatics analysis, 106 DEGs and 21 differentially expressed miRNAs were identified in HCC.40 Based on TCGA database, a three-gene prognostic signature composing of three genes UPB1, SOCS2, and RTN3 had been reported.41 Reuse data have the potential to predict treatment response and disease progression and facilitate the development of precise therapies.42 However, the advantage of this study was that mRNA expression profiles were performed in numerous paired HCC samples from three GEO datasets; more precise DEGs were discovered. Next, by establishing gene oncology, KEGG, and PPI analysis, we provided detailed and comprehensive descriptions of the functional enrichment analysis of these DEGs. Then, according to clinical data from TCGA, the optimum combination of four prognostic genes was investigated. Furthermore, we used another GEO dataset to test the SPINK1, TXNRD1, LCAT, and PZP expression-based prognostic signature to predict HCC clinical outcome. We constructed a more accurate four-gene signature prognostic model and conducted a comprehensive and complete validation. Moreover, because there are few published bioinformatics analyses combining gene expression and methylation profile, we examined the relationship of changes in screened DEG expression and DNA methylation. Finding changes in those genes’ methylation profile influenced the development of HCC. More precise targets and comprehensively annotated possible mechanisms for regulating these biomarkers are given in this article. Therefore, the four-gene signature is promising therapeutic targets and biomarkers that could enhance the clinical responses and the accurate judgment of HCC prognosis.
In this study, three GEO datasets about HCC tissues were used and 98 DEGs were identified by bioinformatics analysis, consisting of 13 upregulated genes and 85 downregulated genes. By performing KEGG analysis, results showed that the upregulated genes were mainly involved in biological processes associated with oocyte meiosis and selenocompound metabolism processes, while the downregulated genes were primarily enriched in metabolic pathways, retinol metabolism, and tryptophan metabolism. The gene oncology term enrichment showed that the downregulated DGEs were involved in those biological processes such as oxidation–reduction process and P450 epoxygenase pathway. And most of the genes were located in extracellular regions. We constructed a PPI to find the correlation between the corresponding proteins encoded by DEGs. Through varieties in analytical methods and means, we have more fully annotated the function of these differential genes, which may help to understand the development of liver cancer.
Currently, age and TNM stage, especially TNM stage, are considered important predictors of survival in HCC patients. However, during clinical treatment, we can find that patients with the same TNM stage may have different prognosis. Therefore, we are committed to pursuing the biomarkers that more precisely predict the prognosis of HCC and consequently improved personalized cancer treatment. For this purpose, we further narrowed down the gene size among these meaningful DEGs and selected an optimal four-gene signature (SPINK1, TXNRD1, LCAT, and PZP) for prognosis prediction. High SPINK1 expression in HCC tumor tissue was significantly associated with increasing risk of death.43 Similar results were also validated by other researchers and concluded that SPINK1 may be a novel prognostic biomarker of HCC.44 TXNRD1 was overexpressed in HCC tissues and cells, and its level was increased with increasing clinical stage.45,46 LACT plays an important role in many cancers, such as Hodgkin lymphoma,47 ovarian cancer,48 and breast cancer.49 Plasma LCAT activity was associated with nonalcoholic fatty liver disease,50 whereas in the tissues PZP was downregulated.51 Others have reported that PZP impacts methylation of H3K79,52 chromatin dynamics, and acetylation.53 However, none of studies on liver cancer has reported the function of LCAT and PZP genes previously. We first combined these four genes to analyze finding that they might be oncogenes or tumor suppressor genes. It has been reported that the potential use of DNA methylation marks as biomarkers for cancer diagnosis. We found that differential expression of SPINK1, TXNRD1, LCAT, and PZP among patients was related to methylation of the gene. Therefore, this four-gene signature is a promising therapeutic target and biomarker that could enhance the clinical responses and the accuracy of HCC prognosis prediction. We have developed an accurate risk score model for HCC prognosis prediction based on the expression of four genes, and their functions need further investigation.
In this work, the predictive signature that comprises SPINK1, TXNRD1, LCAT, and PZP was validated in another independent datasets on a different platform and showed that it has more accurate prediction of survival. Although this model performs well in HCC prognosis prediction, due to the limitation of the number of cohorts, our finding needs to be evaluated against larger datasets. We established a prognostic signature for HCC OS prediction through combined analysis of gene expression datasets from TCGA and GEO. It is more accurate to predict the prognosis of HCC patients. The methods used in this study may be also suitable for other types of cancers.
Conclusion
Overall, based on network and module analysis of mRNA expression data, we constructed a novel four-gene expression signature for prediction of prognosis in HCC. These findings could advance the accuracy of diagnosis and prognosis and might aid in the development of targeted therapy for HCC.
Acknowledgments
We appreciate Dr Xinwei Wang (Center for Cancer Research, National Cancer Institute, USA) for sharing GSE14520 dataset clinical data with us. This study was supported by the First Affiliated Hospital of Zhengzhou University Youth Innovation Fund Project (YNQN2017136).
Author contributions
YY and LA participated in the study concept and design. YZ, YL, and CS helped in coordination and helped to draft the manuscript. YZ and YL contributed to the clinical sample collection. YY, SZ, and ZZ performed the data analysis. YZ and YL conducted the experiments. All authors contributed to data analysis, drafting and revising the article, gave final approval of the version to be published, and agree to be accountable for all aspects of the work.
Disclosure
The authors report no conflicts of interest in this work.
References
Maluccio M, Covey A. Recent progress in understanding, diagnosing, and treating hepatocellular carcinoma. CA Cancer J Clin. 2012;62(6):394–399. | ||
Li Z, Zhang H, Han J, Chen Y, Lin H, Yang T. Surface nanopore engineering of 2D MXenes for targeted and synergistic multitherapies of hepatocellular carcinoma. Adv Mater. 2018;30(25):e1706981. | ||
Chen W, Zheng R, Baade PD, et al. Cancer statistics in China, 2015. CA Cancer J Clin. 2016;66(2):115–132. | ||
Raza A, Sood GK. Hepatocellular carcinoma review: current treatment, and evidence-based medicine. World J Gastroenterol. 2014;20(15):4115–4127. | ||
Byam J, Renz J, Millis JM. Liver transplantation for hepatocellular carcinoma. Hepatobiliary Surg Nutr. 2013;2(1):22–30. | ||
Frenette C, Gish R. Targeted systemic therapies for hepatocellular carcinoma: clinical perspectives, challenges and implications. World J Gastroenterol. 2012;18(6):498–506. | ||
Chen ZH, Yu YP, Zuo ZH, et al. Targeting genomic rearrangements in tumor cells through Cas9-mediated insertion of a suicide gene. Nat Biotechnol. 2017;35(6):543–550. | ||
Sanyal AJ, Yoon SK, Lencioni R. The etiology of hepatocellular carcinoma and consequences for treatment. Oncologist. 2010;15(Suppl 4):14–22. | ||
Negrini S, Gorgoulis VG, Halazonetis TD. Genomic instability – an evolving hallmark of cancer. Nat Rev Mol Cell Biol. 2010;11(3):220–228. | ||
Ezzeldin M, Borrego-Diaz E, Taha M, et al. RalA signaling pathway as a therapeutic target in hepatocellular carcinoma (HCC). Mol Oncol. 2014;8(5):1043–1053. | ||
Hagel M, Miduturu C, Sheets M, et al. First selective small molecule inhibitor of fgfr4 for the treatment of hepatocellular carcinomas with an activated FGFR4 signaling pathway. Cancer Discov. 2015;5(4):424–437. | ||
Yue X, Ai J, Xu Y, et al. Polymeric immunoglobulin receptor promotes tumor growth in hepatocellular carcinoma. Hepatology. 2017;65(6):1948–1962. | ||
Delire B, Stärkel P. The Ras/MAPK pathway and hepatocarcinoma: pathogenesis and therapeutic implications. Eur J Clin Invest. 2015;45(6):609–623. | ||
Liu Y, Song C, Ni H, et al. UBE2L3, a susceptibility gene that plays oncogenic role in hepatitis B related hepatocellular carcinoma. J Viral Hepat. 2018; 25(11):1363–1371. | ||
Han HH, Qiu YJ, Shi YY, et al. Glypican-3-targeted precision diagnosis of hepatocellular carcinoma on clinical sections with a supramolecular 2D imaging probe. Theranostics. 2018;8(12):3268–3274. | ||
Tsuchiya N, Sawada Y, Endo I, Saito K, Uemura Y, Nakatsura T. Biomarkers for the early diagnosis of hepatocellular carcinoma. World J Gastroenterol. 2015;21(37):10573–10583. | ||
Sang L, Wang XM, Xu DY, Zhao WJ. Bioinformatics analysis of aberrantly methylated-differentially expressed genes and pathways in hepatocellular carcinoma. World J Gastroenterol. 2018;24(24):2605–2616. | ||
Ji F, Zhang ZH, Zhang Y, et al. Low expression of c-Myc protein predicts poor outcomes in patients with hepatocellular carcinoma after resection. BMC Cancer. 2018;18(1):460. | ||
Singal AG, El-Serag HB. Hepatocellular carcinoma from epidemiology to prevention: translating knowledge into practice. Clin Gastroenterol Hepatol. 2015;13(12):2140–2151. | ||
Boriack-Sjodin PA, Ribich S, Copeland RA. RNA-modifying proteins as anticancer drug targets. Nat Rev Drug Discov. 2018;17(6):435–453. | ||
You JS, Jones PA. Cancer genetics and epigenetics: two sides of the same coin? Cancer Cell. 2012;22(1):9–20. | ||
Laird PW. The power and the promise of DNA methylation markers. Nat Rev Cancer. 2003;3(4):253–266. | ||
Koch A, Joosten SC, Feng Z, et al. Analysis of DNA methylation in cancer: location revisited. Nat Rev Clin Oncol. 2018;15(7):459–466. | ||
Delpu Y, Cordelier P, Cho WC, Torrisani J. DNA methylation and cancer diagnosis. Int J Mol Sci. 2013;14(7):15029–15058. | ||
Diboun I, Wernisch L, Orengo CA, Koltzenburg M. Microarray analysis after RNA amplification can detect pronounced differences in gene expression using limma. BMC Genomics. 2006;7:252. | ||
Huang da W, Sherman BT, Lempicki RA. Systematic and integrative analysis of large gene lists using DAVID bioinformatics resources. Nat Protoc. 2009;4(1):44–57. | ||
Bader GD, Hogue CW. An automated method for finding molecular complexes in large protein interaction networks. BMC Bioinformatics. 2003;4:2. | ||
Roessler S, Jia HL, Budhu A, et al. A unique metastasis gene signature enables prediction of tumor relapse in early-stage hepatocellular carcinoma patients. Cancer Res. 2010;70(24):10202–10212. | ||
Galm O, Herman JG, Baylin SB. The fundamental role of epigenetics in hematopoietic malignancies. Blood Rev. 2006;20(1):1–13. | ||
Weisenberger DJ, Velicescu M, Preciado-Lopez MA, et al. Identification and characterization of alternatively spliced variants of DNA methyltransferase 3a in mammalian cells. Gene. 2002;298(1):91–99. | ||
Koch A, De Meyer T, Jeschke J, Van Criekinge W. MEXPRESS: visualizing expression, DNA methylation and clinical TCGA data. BMC Genomics. 2015;16:636. | ||
Wang Z, Teng D, Li Y, Hu Z, Liu L, Zheng H. A six-gene-based prognostic signature for hepatocellular carcinoma overall survival prediction. Life Sci. 2018;203:83–91. | ||
Bruix J, Llovet JM. Major achievements in hepatocellular carcinoma. Lancet. 2009;373(9664):614–616. | ||
Wong KF, Xu Z, Chen J, Lee NP, Luk JM. Circulating markers for prognosis of hepatocellular carcinoma. Expert Opin Med Diagn. 2013;7(4):319–329. | ||
Chen H, Sun X, Ge W, Qian Y, Bai R, Zheng S. A seven-gene signature predicts overall survival of patients with colorectal cancer. Oncotarget. 2017;8(56):95054–95065. | ||
Xie XJ, Liu P, Cai CD, Zhuang YR, Zhang L. The generation and validation of a 20-Genes model influencing the prognosis of colorectal cancer. 2017;118(11):3675–3685. | ||
Liu WT, Wang Y, Zhang J, et al. A novel strategy of integrated microarray analysis identifies CENPA, CDK1 and CDC20 as a cluster of diagnostic biomarkers in lung adenocarcinoma. Cancer Lett. 2018;425:43–53. | ||
Győrffy B, Surowiak P, Budczies J, Lánczky A. Online survival analysis software to assess the prognostic value of biomarkers using transcriptomic data in non-small-cell lung cancer. PLoS One. 2013;8(12):e82241. | ||
Lu G, Chang JT, Liu Z, Chen Y, Li M, Zhu JJ. Phospholipase C Beta 1: a candidate signature gene for proneural subtype high-grade glioma. Mol Neurobiol. 2016;53(9):6511–6525. | ||
Zhou L, Du Y, Kong L, Zhang X, Chen Q. Identification of molecular target genes and key pathways in hepatocellular carcinoma by bioinformatics analysis. Onco Targets Ther. 2018;11:1861–1869. | ||
Li B, Feng W, Luo O, et al. Development and validation of a three-gene prognostic signature for patients with hepatocellular carcinoma. Sci Rep. 2017;7(1):5517. | ||
Kannan L, Ramos M, Re A, et al. Public data and open source tools for multi-assay genomic investigation of disease. Brief Bioinform. 2016;17(4):603–615. | ||
Ying HY, Gong CJ, Feng Y, Jing DD, Lu LG. Serine protease inhibitor Kazal type 1 (SPINK1) downregulates E-cadherin and induces EMT of hepatoma cells to promote hepatocellular carcinoma metastasis via the MEK/ERK signaling pathway. J Dig Dis. 2017;18(6):349–358. | ||
Marshall A, Lukk M, Kutter C, Davies S, Alexander G, Odom DT. Global gene expression profiling reveals SPINK1 as a potential hepatocellular carcinoma marker. PLoS One. 2013;8(3):e59459. | ||
Fu B, Meng W, Zeng X, Zhao H, Liu W. TXNRD1 is an unfavorable prognostic factor for patients with hepatocellular carcinoma. Biomed Res Int. 2017;2017:4698167. | ||
Rieswijk L, Claessen SM, Bekers O, et al. Aflatoxin B1 induces persistent epigenomic effects in primary human hepatocytes associated with hepatocellular carcinoma. Toxicology. 2016;350–352:31–39. | ||
Cooke AL, Morris J, Melchior JT, et al. A thumbwheel mechanism for APOA1 activation of LCAT activity in HDL. J Lipid Res. 2018;59(7):1244–1255. | ||
Russell MR, Graham C, D’Amato A, et al. A combined biomarker panel shows improved sensitivity for the early detection of ovarian cancer allowing the identification of the most aggressive type II tumours. Br J Cancer. 2017;117(5):666–674. | ||
Subbaiah PV, Liu M, Witt TR. Impaired cholesterol esterification in the plasma in patients with breast cancer. Lipids. 1997;32(2):157–162. | ||
Nass KJ, van den Berg EH, Gruppen EG, Dullaart RPF. Plasma lecithin:cholesterol acyltransferase and phospholipid transfer protein activity independently associate with nonalcoholic fatty liver disease. Eur J Clin Invest. 2018;48(9):e12988. | ||
Huang S, Sun C, Hou Y, et al. A comprehensive bioinformatics analysis on multiple Gene Expression Omnibus datasets of nonalcoholic fatty liver disease and nonalcoholic steatohepatitis. Sci Rep. 2018;8(1):7630. | ||
Chen S, Yang Z, Wilkinson AW, et al. The PZP domain of AF10 senses unmodified H3K27 to regulate DOT1L-mediated methylation of H3K79. Mol Cell. 2015;60(2):319–327. | ||
Klein BJ, Muthurajan UM, Lalonde ME, et al. Bivalent interaction of the PZP domain of BRPF1 with the nucleosome impacts chromatin dynamics and acetylation. Nucleic Acids Res. 2016;44(1):472–484. |
Supplementary materials
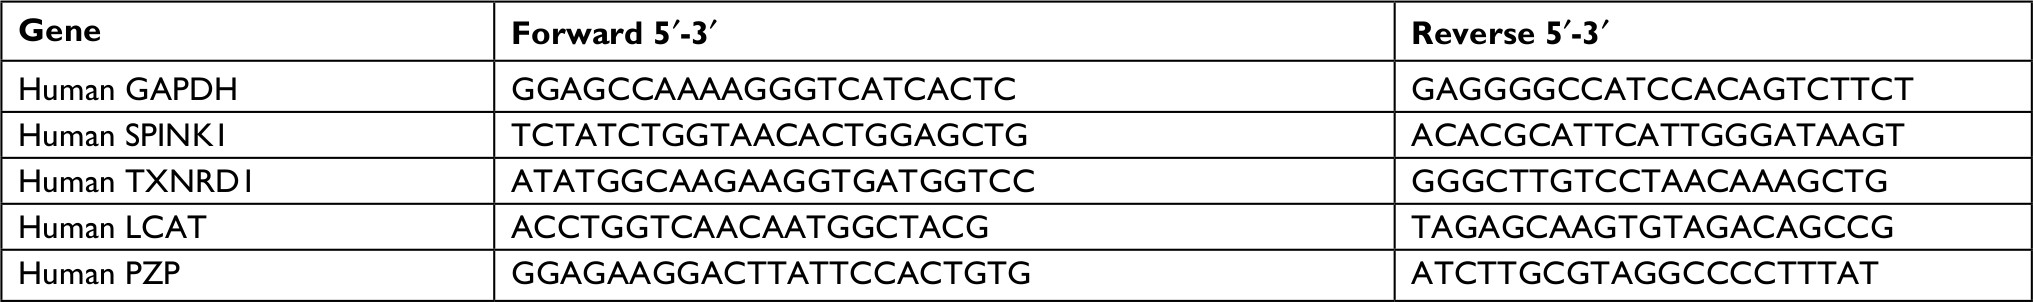 | Table S1 The sequence of PCR primers |
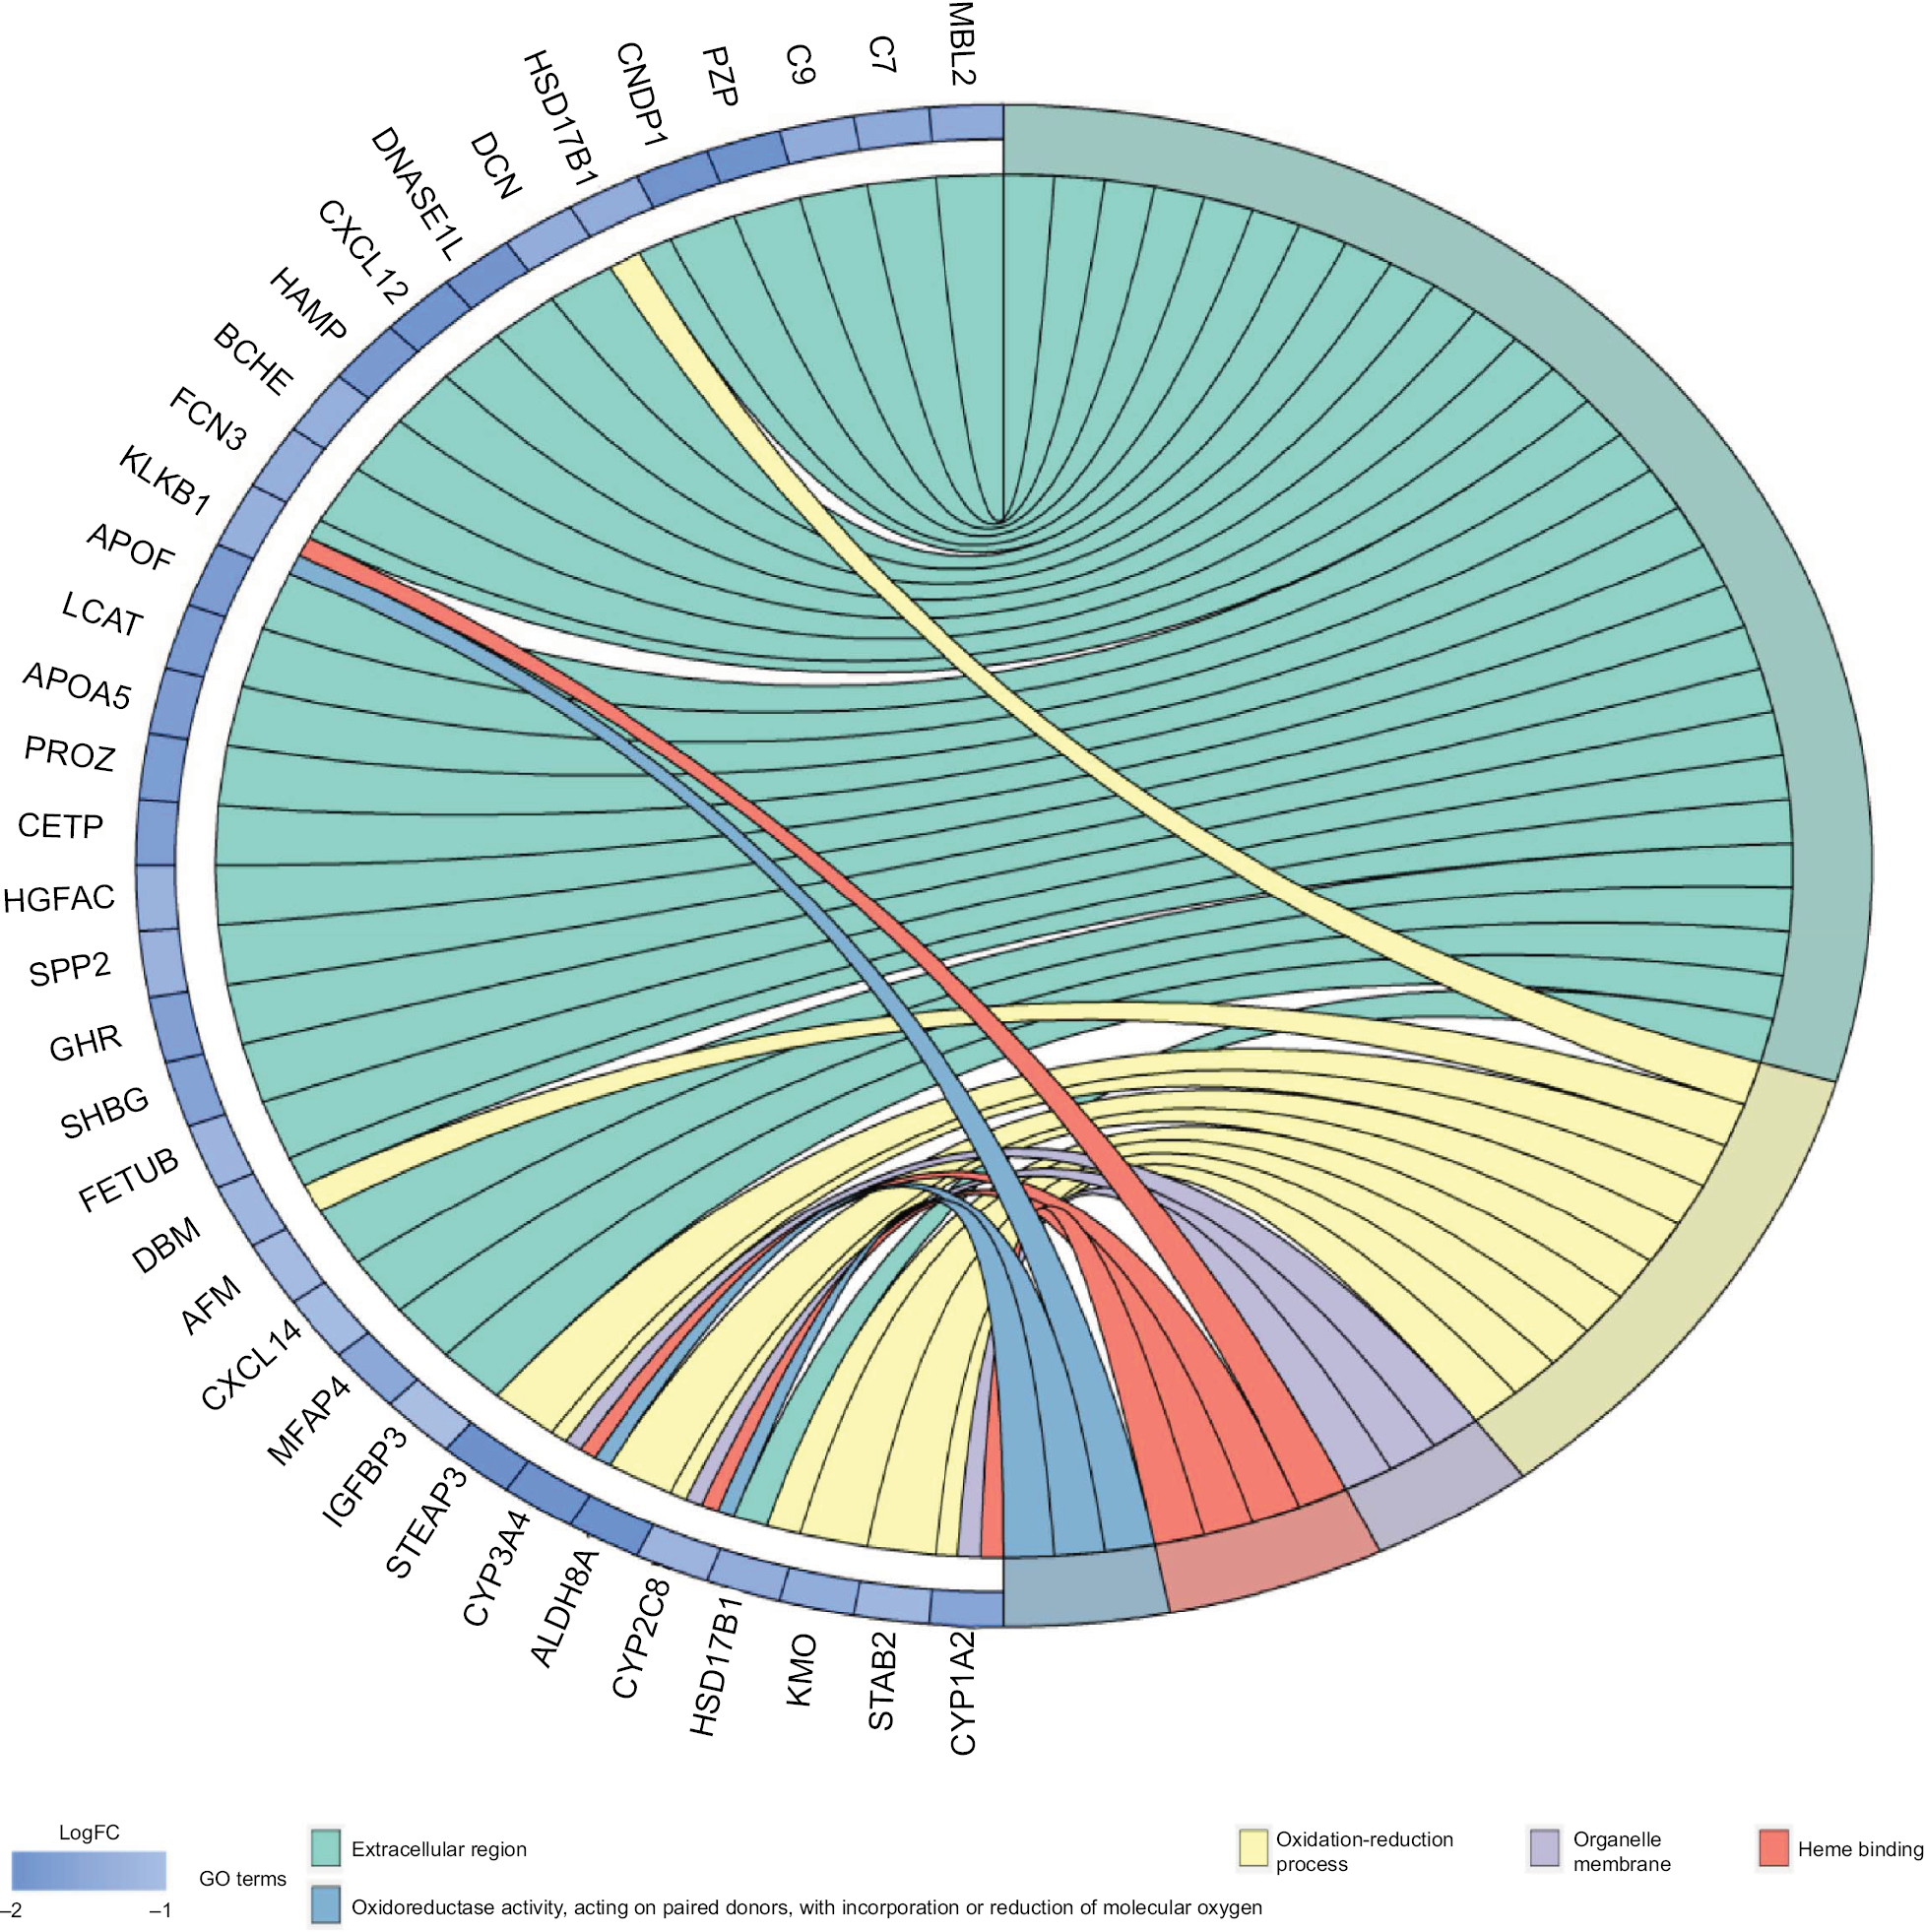 | Figure S1 Gene ontology enrichment terms for DEGs. Abbreviations: DEGs, differentially expressed genes; FC, fold change; GO, gene ontology. |
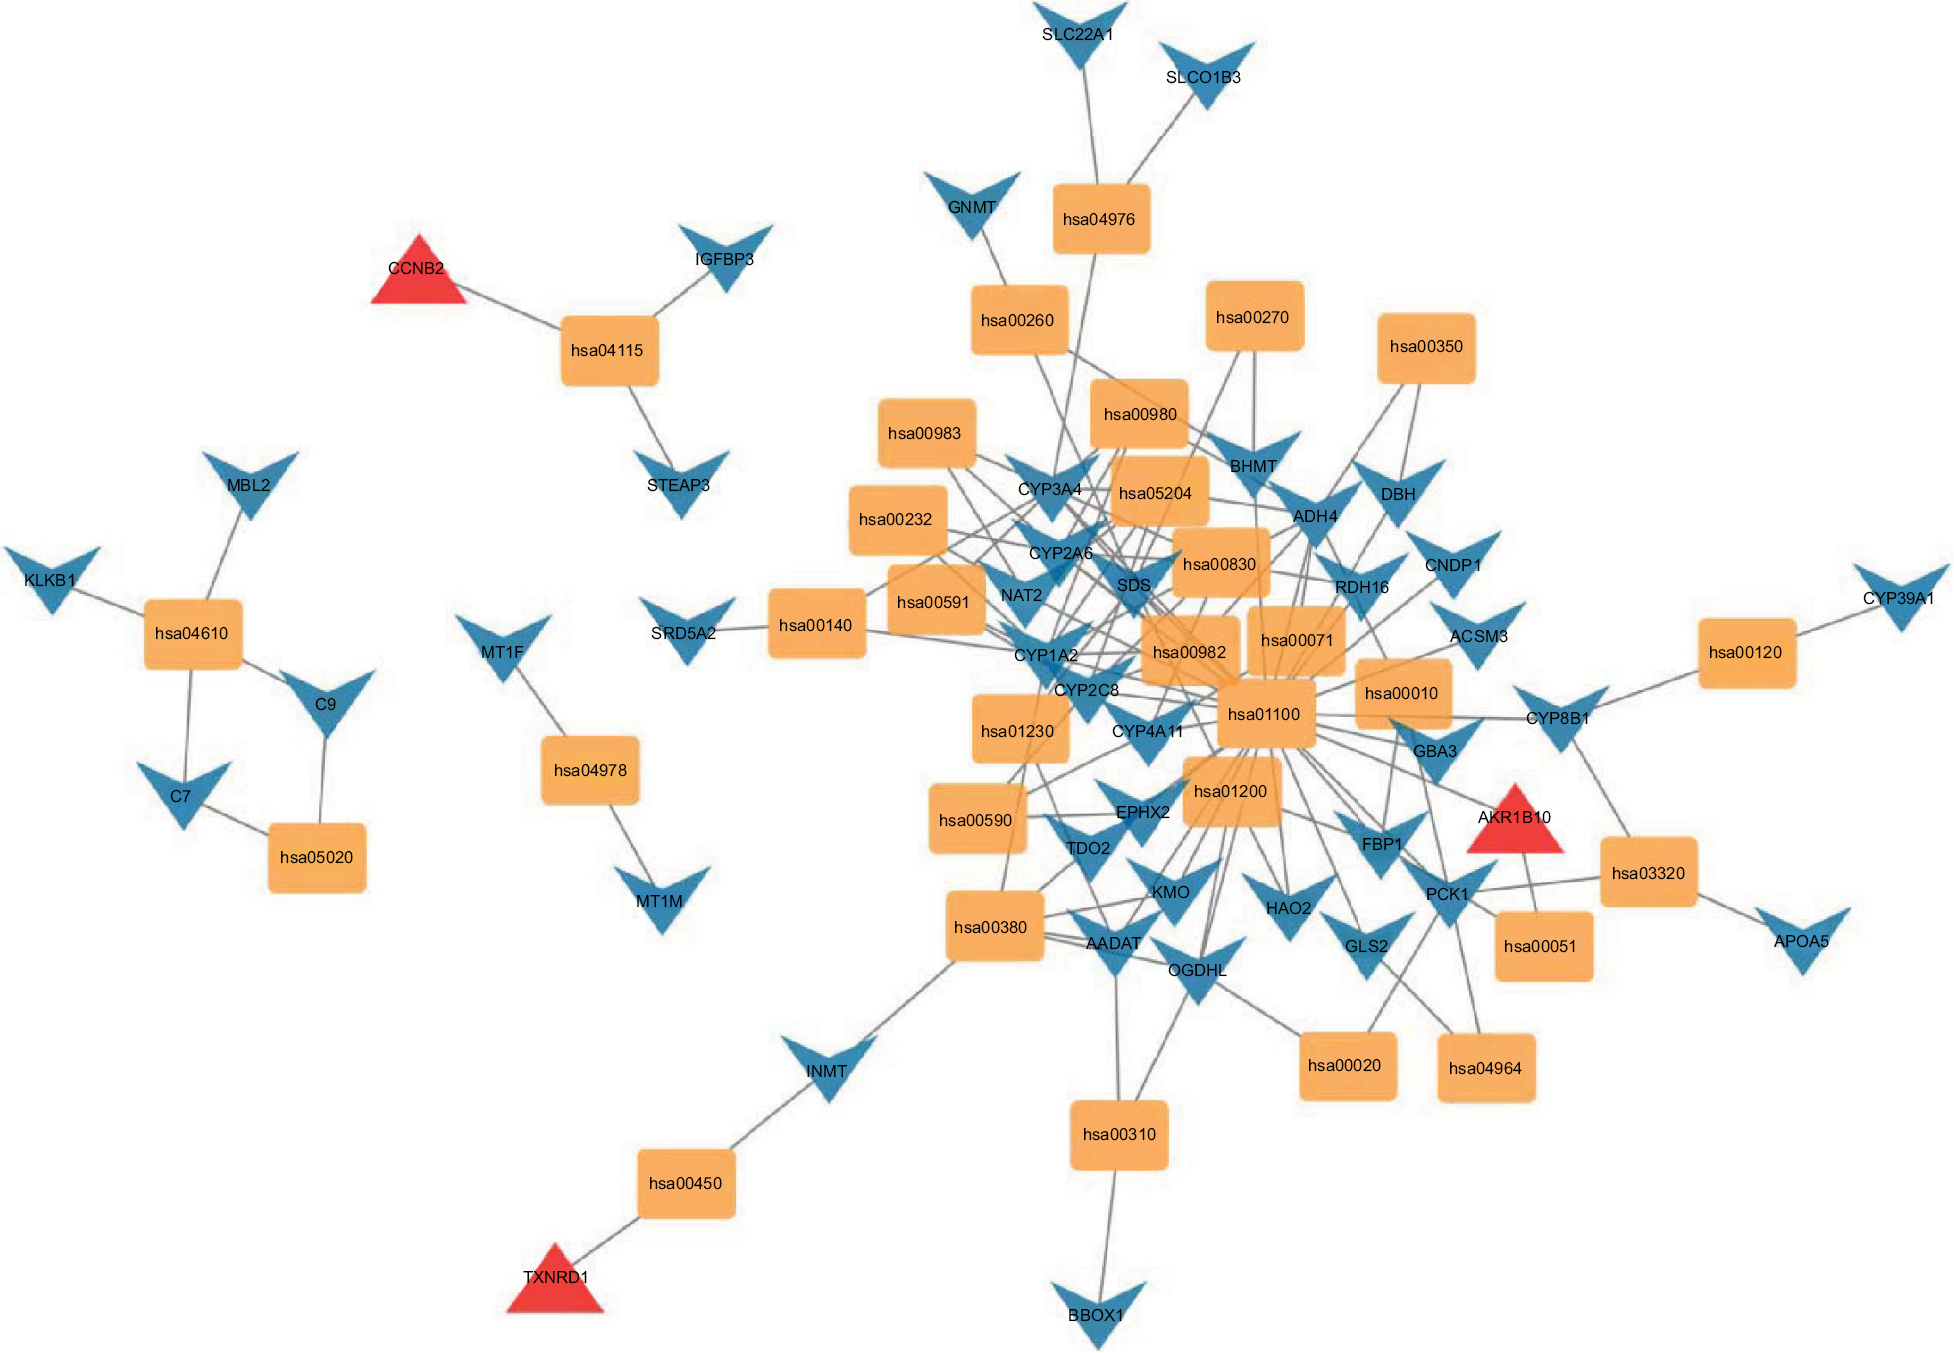 | Figure S2 KEGG network analysis. Abbreviation: KEGG, Kyoto Encyclopedia of Genes and Genomes. |
 | Figure S3 Detailed methylation information of (A) SPINK1, (B) TXNRD1, (C) LCAT, and (D) PZP. |
 © 2018 The Author(s). This work is published and licensed by Dove Medical Press Limited. The
full terms of this license are available at https://www.dovepress.com/terms
and incorporate the Creative Commons Attribution
- Non Commercial (unported, 3.0) License.
By accessing the work you hereby accept the Terms. Non-commercial uses of the work are permitted
without any further permission from Dove Medical Press Limited, provided the work is properly
attributed. For permission for commercial use of this work, please see paragraphs 4.2 and 5 of our Terms.
© 2018 The Author(s). This work is published and licensed by Dove Medical Press Limited. The
full terms of this license are available at https://www.dovepress.com/terms
and incorporate the Creative Commons Attribution
- Non Commercial (unported, 3.0) License.
By accessing the work you hereby accept the Terms. Non-commercial uses of the work are permitted
without any further permission from Dove Medical Press Limited, provided the work is properly
attributed. For permission for commercial use of this work, please see paragraphs 4.2 and 5 of our Terms.