Back to Journals » Journal of Pain Research » Volume 9
Keeping an eye on pain: investigating visual attention biases in individuals with chronic pain using eye-tracking methodology
Received 14 January 2016
Accepted for publication 5 May 2016
Published 10 August 2016 Volume 2016:9 Pages 551—561
DOI https://doi.org/10.2147/JPR.S104268
Checked for plagiarism Yes
Review by Single anonymous peer review
Peer reviewer comments 3
Editor who approved publication: Dr Michael Schatman
Samantha R Fashler, Joel Katz
Department of Psychology, York University, Toronto, Ontario, Canada
Abstract: Attentional biases to painful stimuli are evident in individuals with chronic pain, although the directional tendency of these biases (ie, toward or away from threat-related stimuli) remains unclear. This study used eye-tracking technology, a measure of visual attention, to evaluate the attentional patterns of individuals with and without chronic pain during exposure to injury-related and neutral pictures. Individuals with (N=51) and without chronic pain (N=62) completed a dot-probe task using injury-related and neutral pictures while their eye movements were recorded. Mixed-design analysis of variance evaluated the interaction between group (chronic pain, pain-free) and picture type (injury-related, neutral). Reaction time results showed that regardless of chronic pain status, participants responded faster to trials with neutral stimuli in comparison to trials that included injury-related pictures. Eye-tracking measures showed within-group differences whereby injury-related pictures received more frequent fixations and visits, as well as longer average visit durations. Between-group differences showed that individuals with chronic pain had fewer fixations and shorter average visit durations for all stimuli. An examination of how biases change over the time-course of stimulus presentation showed that during the late phase of attention, individuals with chronic pain had longer average gaze durations on injury pictures relative to pain-free individuals. The results show the advantage of incorporating eye-tracking methodology when examining attentional biases, and suggest future avenues of research.
Keywords: attentional biases, chronic pain, avoidance, hypervigilance, dot probe
Methods
The present study is part of a larger project investigating attentional biases in individuals reporting pain. The methods and data preparation are the same as those used by Fashler and Katz21 with the exception of the section on visual stimuli. The study protocol was approved by the Human Participants Review Subcommittee at York University (ethics certificate number: 2013-048). Written informed consent was obtained from participants before beginning the study.
Participants
Recruitment
Participants were recruited through York University’s Undergraduate Research Participant Pool. Before participants enroll in studies, they complete a prescreening survey composed of questions submitted by various faculty research laboratories. Responses to questions determine the studies that are visible to the student. For the present study, the question “do you experience physical pain on a regular basis?” was included in the prescreening survey. Of the 3,163 students who completed the prescreening survey, 655 (20.71%) positively endorsed the statement, 2,508 (79.29%) did not; 26 declined to respond. In order to recruit equal sample sizes of participants with and without pain, two identical study postings were created: one was visible to students who positively endorsed the prescreen question related to pain and the other was visible only to students who did not. This facilitated recruitment of equal sample sizes of participants with and without pain. Participants received one course credit for completing the study.
Demographic information
The final sample included 113 participants. The age range of the sample was 18–44 years, (Mage = 21.32, SDage = 4.35). Eighty-four participants were female (74.30%) and 29 were male (25.70%). The sample was ethnically diverse, with participants self-identifying as Caucasian (32.54%), South Asian (28.57%), African (10.32%), East Asian (9.53%), Middle Eastern (8.73%), Hispanic/Latino (4.76%), Caribbean (3.97%), aboriginal (0.79%), and undisclosed (0.79%). Forty-nine (39.84%) participants wore vision-correction aids during testing, with 16 (14.20%) using contact lenses and 33 (29.20%) using glasses.
For the purpose of the present study, chronic pain was defined as the presence of ongoing pain that had persisted for 3 months or longer.22 According to this criterion, 51 (45.13%) participants reported chronic pain. Of these, seven (13.70%) participants reported experiencing pain for 3–6 months, five (9.80%) for 6–12 months, and 39 (76.50%) for 12 months or longer. Participants reported pain in one to five body locations (Mlocation =2.16, SDlocation =1.08): 30 reported neck and/or back pain, 22 reported headache/migraine pain, 21 reported ankle and/or knee pain, 15 reported shoulder pain, 12 reported stomach pain, five reported hip pain, two reported arm pain, one reported eye pain, one reported jaw pain, and one declined to respond to this question. Most participants reported that the pain commenced after an injury (47.1%) or that they were unsure how the pain started (35.3%), while 7.8% of participants stated it started due to overuse and/or stress, 5.9% due to an illness, and one (0.79%) due to a hereditary predisposition. Frequency of pain was reported as daily (64.7%), weekly (33.3%), or other (2.0%) with the average intensity as mild (15.7%), moderate (74.5%), or severe (9.8%). When completing the questionnaires, 30 participants reported their present pain intensity as mild (73.3%) or moderate (26.6%) pain. Approximately half (52.9%) of chronic pain participants reported that they used pain medication on a regular basis. Of these participants, 63.0% used nonsteroidal anti-inflammatory drugs, 59.3% used acetaminophen, 7.4% used opioids, and 29.6% reported using other medications to manage their pain.
Participants reporting pain (N=51) did not differ significantly from those not reporting pain (N=62) on age, t (111) =0.71, P=0.705, sex, X2 (2, N=113) =0.001, P=0.969, use of contact lenses, X2 (1, N=113) =0.014, P=0.905, or glasses, X2 (1, N=113) =0.77, P=0.381. Pearson X2 2×4 analysis using pain status (chronic pain, pain-free) and ethnicity (African decent, Asian descent, Caucasian, other) identified a significant difference according to ethnicity, X2 (3, N=113) =18.93, P<0.001. Post hoc comparisons showed a significantly greater proportion of participants self-identifying as Caucasian among those reporting pain.
Materials
Hardware
Eye movements were tracked using a Tobii T60 XL eye-tracker with a 24-inch widescreen monitor and a 60 Hz data rate (Tobii® Technology, Falls Church, VA, USA). The eye-tracker is integrated into the monitor, allowing participants to move their heads freely throughout the study. The Tobii T60 XL has an accuracy rate of 0.5° and <0.03° drift, reducing differences between what the participant is looking at and what the equipment is recording. Two Dell Precision T3400 Intel® Core™ 2 Quad CPUs with 4 GB of RAM were interfaced to facilitate data collection. The display resolution for the dot-probe protocol was 800×600 pixels to optimize video capture and data transfer. The study took place in a windowless room in order to standardize the lighting for all participants.
Software
E-Prime 2.0 Professional (Psychology Software Tools, Inc., Sharpsburg, PA, USA) was used to design, display, collect, and prepare data for the dot-probe task.23 E-Prime provides millisecond precision in the capture of RTs. The protocol was designed in E-Studio, data were combined with E-Merge, and data were prepared for export with E-DataAid. Tobii Studio Professional 2.0 captured participant eye movements with programmed time-sensitive markers (Tobii® Technology, 2010). E-Prime and Tobii Studio software programs were interfaced with E-Prime 2.0 extensions for Tobii (Psychology Software Tools, 2011). Data were analyzed with SPSS 20 (version 20.0, IBM Corporation, Armonk, NY, USA).
Visual stimuli
Sixty pictures were selected from the International Affective Picture System (IAPS)24 to use as visual stimuli for the dot-probe task. IAPS is a collection of over 1,000 pictures that have normative affective ratings on two dimensions of emotion: valence (negative/aversive to positive/attractive) and arousal (calm to excited). Each trial in the dot-probe task consists of two pictures presented simultaneously. The picture pair consisted of either 1) an injury picture and a neutral picture (injury–neutral pair) or 2) two neutral control pictures (control pair). The final set of pictures consisted of 15 injury–neutral pairs and 15 neutral–neutral control pairs for a total of 60 pictures (30 pairs). Following selection of stimuli, the picture size of all pictures was standardized to 341×256 pixels.
Injury–neutral pairs
Fifteen injury-related IAPS pictures were selected (3030, 3103, 3180, 3181, 3185, 3195, 3211, 3213, 3215, 3220, 9042, 9405, 9415, 9592, and 9599). Inclusion criteria were 1) depiction of physical injury to a human (eg, needle insertion, black eye, open wound, burned skin, stitches); 2) low score for valence (ie, negative); and 3) high in arousal (ie, emotionally charged). Mean (SD) scores for arousal and valence were 5.76 (0.57) and 2.63 (0.65), respectively, for the injury pictures.
Fifteen neutral IAPS pictures were paired to the 15 injury IAPS pictures by depicting the same body region as the injury-related picture but without injury (eg, a picture displaying an injured hand was paired with a picture of a hand without any signs of injury) (2200, 2002, 2102, 2372, 2018, 2019, 2104, 7513, 7509, 2570, 2445, 2579, 2393, 2411, and 7092). Inclusion criteria were 1) no evidence of physical injury; 2) neutral valence (ie, neither positive nor negative); and 3) low on arousal (ie, calm). Mean (SD) scores for arousal and valence were 3.57 (0.64) and 5.17 (0.55), respectively, for the neutral pictures. As expected, t-tests confirmed that in comparison to neutral pictures, injury pictures were significantly lower on valence (P<0.001) and significantly higher on arousal (P<0.001).
Control pairs
A set of 30 different control IAPS pictures was selected (7000, 7001, 7002, 7003, 7004, 7006, 7009, 7035, 7019, 7020, 7021, 7010, 7012, 7017, 7041, 5390, 7032, 7030, 7061, 7081, 7025, 7175, 7211, 7150, 7057, 7950, 7026, 7090, 7235, and 7052). Inclusion criteria were 1) an inanimate object (eg, household items, such as spoon and clock); 2) neutral valence (ie, neither positive nor negative); and 3) low on arousal (ie, calm). Mean (SD) scores for arousal and valence were 2.89 (0.62) and 5.05 (0.24), respectively, for all 30 control pictures. As expected, t-tests confirmed that the 15 pairs of control pictures did not differ significantly on valence or arousal (both P>0.450).
Behavioral measures
Reaction time measures
RT (in milliseconds) was recorded to capture the speed of participant responses to the location of the dot probe. For each participant, a congruency index, incongruency index, and neutral comparison index were computed.
Congruent, incongruent, and neutral comparison indexes
These indexes are based on calculations by Koster et al25 and Roelofs et al.26 A trial is considered to be congruent when the dot probe appears in the location on the screen where the target picture (ie, injury picture) was presented and incongruent when the dot probe appears in the location of the neutral picture (Figure 1). The indexes are based on four mean RT scores,  , which are computed by taking the mean of the 15 trials in each of the four conditions (tldr, trdr, trdl, and tldl) where “t” is the target (injury picture), “d” is the dot probe, “l” is the left position on the screen, and “r” is the right position on the screen.
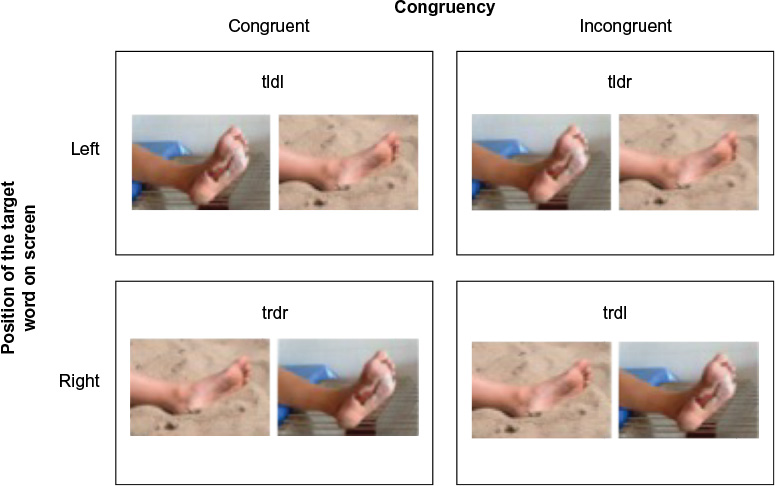 | Figure 1 Visual depiction of counterbalanced trials of pictures presented during the dot-probe task. Notes: Injury-related picture (target, t) on left (l) side of screen followed by the dot (d) on the left side of the screen (left, congruent or “tldl”); injury-related picture on left side of screen followed by the dot on the right (r) side of the screen (left, incongruent or “tldr”); injury-related picture on right side of screen followed by the dot on the right side of the screen (right, congruent or “trdr”); and injury-related picture on right side of screen followed by the dot on the left side of the screen (right, incongruent or “trdl”). The images depicted are not drawn from the IAPS database but are similar to the stimuli used in the study protocol (photo credits: Mariusz Jurgielewicz © 123RF.com, Sarit Wuttisan © 123RF.com). Abbreviation: IAPS, International Affective Picture System. |
The congruency index is calculated by taking the grand mean of the mean RTs of congruent trials that are presented on the right and left sides of the computer screen:  . Similarly, the incongruent index is calculated by taking the grand mean of the mean RTs of the responses of incongruent trials that are presented on the right and left sides of the computer screen:
  . The neutral comparison index is calculated to permit comparison with the congruent and incongruent indexes. It is calculated by taking the grand mean of the mean RTs for the neutral control picture pairs:
  .
.
Visual attention measures
Tobii I-VT fixation filter settings were used to classify fixations as they provide validated and robust function parameter values that are easily replicated for future research. As such, maximum gap interpolation (ie, merging) of fixations was set to 75 ms, the max angle between fixations was 0.5°, and fixations had to be >60 ms.27 These settings provide accurate fixation classifications for most research.26,27 Additionally, data were screened for validity and only used if the data collected were associated with the correct eye.
Gaze patterns were recorded for the duration of the dot-probe task. Data were based on eye movements recorded within a region on the left and right sides of the screen defined by the experimenter as an “area of interest” (AOI). An AOI, 250 pixels in length by 107 pixels in height, was demarcated at mirror image regions on the center and midline of the left and right sides of the screen within which picture stimuli (injury-related, neutral, or control) were presented. Seven visual attention variables were calculated. Two measured the frequency of eye movements within an AOI: number of fixations assessed the number of times the participant’s eyes focused on an injury or neutral picture and number of visits assessed the total number of times the gaze left an AOI (ie, a “visit” is defined by one or more contiguous eye movements within an AOI and ends when the eyes move outside the AOI). Two variables measured attentional maintenance within an AOI: mean fixation duration assessed the mean time associated with all fixations and mean visit duration assessed the mean time spent looking during all visits. Three variables measured the mean gaze duration per injury and neutral pictures according to three time intervals that spanned the 2,000 ms that the pictures appeared on the screen: early phase mean gaze duration (between 0 and 500 ms); middle phase mean gaze duration (between 500 and 1,000 ms); and late-phase mean gaze duration (between 1,000 and 2,000 ms).
Self-report measures
Demographics and Pain History Questionnaire
Participants were asked basic demographic questions and questions related to their pain history and current pain complaints, including the duration, location, frequency, and cause of any pain.
Questionnaires
Participants completed nine questionnaires assessing health, anxiety, and pain-related variables. The Pain Disability Index28 is a seven-item scale that assesses the degree of daily interference due to pain. The Pain Catastrophizing Scale29 is a 13-item scale that assesses an individual’s tendency to ruminate and magnify painful experiences. The Fear of Pain Questionnaire-III30 is a 30-item scale that measures fear related to the experience of severe pain, minor pain, and medical pain. The Pain Vigilance and Awareness Questionnaire31 is a 16-item scale that assesses an individual’s daily preoccupation with pain. The State-Trait Anxiety Inventory32 is a 20-item scale that assesses general levels of trait anxiety. The Anxiety Sensitivity Index-333 is a 16-item scale that assesses fear of anxiety-related sensations. The Health Anxiety Questionnaire34 is a 21-item scale that measures daily functioning interference related to worry and preoccupation regarding health, illness, and death. The Illness Sensitivity Index-Short Version35 is a six-item scale that assesses the fear of experiencing illness. The Sensitivity to Pain Traumatization Scale36 is a 20-item scale that assesses anxiety-related cognitive, emotional, and behavioral reactions to pain that resemble symptoms of posttraumatic stress disorder. For all scales, higher scores are related to feelings of higher disability, anxiety, hypervigilance, or impairment.
Procedure
After arriving at the lab and providing informed consent, participants completed a computer-administered survey consisting of the ten questionnaires described earlier. The demographic and pain history questions appeared at the beginning of the survey for all participants. The order of the remaining questionnaires was randomized within participants using an online survey manager (Sona Systems, Bethesda, MD, USA). Participants were led to a windowless room to complete the dot-probe task. They were positioned ∼60 cm in front of the screen with eyes leveled with the center of the screen. Five-point eye calibration was performed with Tobii Studio software to customize the eye-tracking specifications to each participant. The computer input was adjusted to run E-Prime from a second computer whereupon a second eye calibration was performed. Next, the dot-probe task was introduced and described. Participants were told that they were to fix their gaze at the central fixation cross, that a pair of pictures would appear briefly on the screen, and that a dot would be presented in the location of one of the pictures. Their task was to identify the location of the dot as quickly and accurately as possible. Participants then completed 12 practice trials to familiarize themselves with the task.
The protocol for each trial consisted of three parts: 1) a fixation cross (“+”) appeared at the center of the screen for 500 ms; 2) two pictures (injury–neutral or neutral–neutral) were presented simultaneously, one on the left, and the other on the right side of the screen for 2,000 ms; and 3) immediately after the offset of the pictures, a dot probe (“•”) appeared on the left or right side of the screen (in the prior location of the picture) for 2,000 ms or until the participant responded by pressing one of two keyboard keys. Participants were told to press the “P” with their right index finger if the dot probe was on the right side of the screen and the “Q” with their left index finger if the dot probe was on the left. All text and symbols appeared in black on a white background. Presentation of picture pairs was counterbalanced, controlling for picture type location (left, right) and dot-probe location (left, right), so that each picture pair was presented four times (Figure 1). In total, participants completed 120 trials (four trials each of the 15 injury–neutral picture pairs and four trials each of the 15 neutral–neutral picture pairs). The presentation order of trials was randomly generated by E-Prime (ie, the order selection was set to “random”) for each participant.
Statistical analysis
Comparisons of nominal variables were made with X2 tests of independence. Reaction time (RT) indexes were analyzed using a mixed-design 2×3 analysis of variance using group (chronic pain, pain-free) as the independent samples factor and index type (congruent, incongruent, neutral) as the within-subjects factor. Number of fixations and number of visits were each analyzed with a 2×2 mixed-design analysis of variances using group (chronic pain, pain-free) as the between-subjects factor and picture type (injury–neutral) as the within-subjects factor. Significant interactions were broken down with simple main effects analyses.
Results
Data preparation
Reaction time measures
Incorrect trials or trials that had RIs >2,000 ms were excluded from the calculation of the mean RI scores.25 According to these criteria, 1.02% of trials were excluded from the calculation of the mean RI scores. Missing RIs scores were prorated if 80% or more of trials were available.37,38 One participant with insufficient data was excluded from the analysis of the RI data.
Visual attention measures
Eye-tracking recordings were screened for the quality of visual gaze capture. Of the 135 participants who were recruited, only those whose gaze capture exceeded 75% were included, consistent with previous eye-tracking research.39 Lower gaze capture may be related to compromised attention, consistently lowered/closed eyelids, or reflections off glasses (eye-wear) that obscure the visual recording.40 This led to the exclusion of 20 participants with poor capture (Mcapture =60.90%, SDcapture =12.52%) and two participants who were unable to be calibrated. The mean eye capture rate for included participants (N=113) was 88.44%, SD =5.34%.
Participants included in the final analysis did not differ significantly from those with insufficient gaze data (N=22) on age, use of contact lenses, glasses, or presence of chronic pain (P>0.064 for all). A greater proportion of males (100%) than females (80%) had sufficient gaze data, X2 (1, N=134) =6.88, P=0.009. The omnibus X2 analysis showed a significant effect according to ethnicity (African, Asian, Caucasian, other), c2 (3, N=135) =11.690, P=0.009. Analysis of residuals showed that a significantly greater proportion of Asian and Caucasian participants had sufficient gaze data compared with African and other ethnicity participants (P<0.05).
Questionnaires
Missing questionnaire items were prorated if 80% or more of questions were available.37,38 One participant responded to fewer than 80% of the questions on the Anxiety Sensitivity Index, State-Trait Anxiety Inventory (state version), and Sensitivity to Pain Traumatization Scale, and was consequently excluded from the analysis of these questionnaires.
Reaction time measures
Mauchly’s test of sphericity was significant, X2 (2) =11.308, P=0.004. As the estimate of sphericity was >0.75, the Huynh–Feldt correction was used (Huynh and Feldt, 1976).41 Only the main effect of index type was significant, F (1.87, 207.29) =9.296, P<0.001, ηp2 =0.077 (Table 1). Follow-up analyses showed that the neutral index (M =568.87, SD =10.43) was significantly shorter than both the congruency index (M =590.41, SD =12.04, P<0.001) and the incongruency index (M =591.60, SD =12.38, P=0.003).
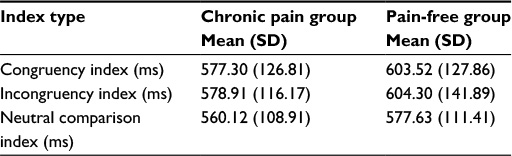 | Table 1 Reaction time index scores (in ms) for individuals with (N=51) and without chronic pain (N=62) Abbreviation: SD, standard deviation. |
Frequency of eye movements
For number of fixations, the main effect of picture type was significant, F (1, 111) =83.94, P<0.001, ηp2 =0.431, with more fixations on injury pictures (M =235.52, standard error [SE] =5.62) than neutral pictures (M =176.66, SE =3.75). The main effect of group was also significant, F (1, 111) =4.79, P=0.031, ηp2 =0.041, with fewer fixations overall by individuals with chronic pain (M =198.34, SE =5.24) than pain-free individuals (M =213.83, SE =4.76). For number of visits, the main effect of picture type was significant, F (1, 111) =76.58, P<0.001, ηp2 =0.408, with more visits to injury pictures (M =130.60, SE =2.37) than neutral pictures (M =109.37, SE =1.87).
Maintenance of visual attention
For mean visit duration, the main effect of picture type, F (1, 111) =15.26, P<0.001, ηp2 =0.121, was significant with longer visits for injury pictures (M =0.357, SE =0.005) than neutral pictures (M =0.325, SE =0.007). The main effect of group was significant, F (1, 111) =4.23, P=0.042, ηp2 =0.037, with shorter visit durations for individuals with chronic pain (M =0.332, SE =0.007) than by pain-free individuals (M =0.351, SE =0.006). None of the effects were significant for mean fixation duration (Table 2).
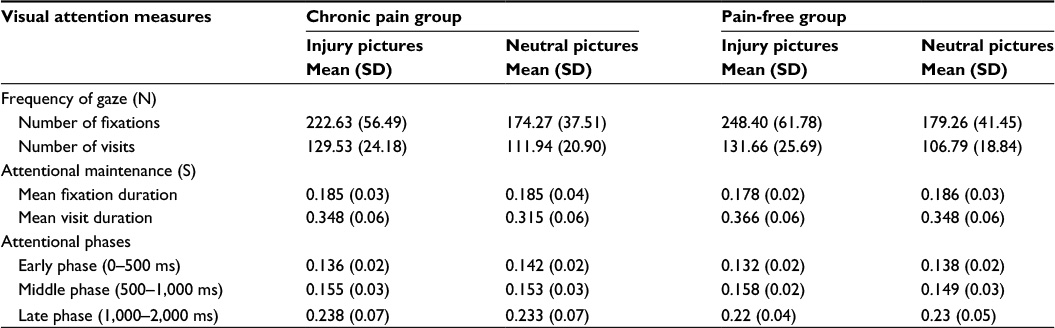 | Table 2 Eye-tracking variables for individuals with (N=51) and without chronic pain (N=62) Abbreviations: SD, standard deviation; N, number; S, second. |
Attentional phases
For early phase (0–500 ms) mean gaze duration, the main effect of picture type was significant, F (1, 111) =16.58, P<0.001, ηp2 =0.130, with longer mean gaze duration on neutral pictures (M =0.140, SE =0.002) than injury pictures (M =0.134, SE =0.002). For middle phase (500–1,000 ms) mean gaze duration, the main effect of picture type was also significant, F (1, 111) =7.81, P=0.006, ηp2 =0.066, but in this case, there was a longer mean gaze duration on injury pictures (M =0.157, SE =0.002) than neutral pictures (M =0.151, SE =0.003). For late-phase mean gaze duration, the picture by group interaction was significant, F (1, 111) =6.46, P=0.012, ηp2 =0.055. Simple main effects analysis showed that for injury pictures, individuals with chronic pain (M =0.238, SD =0.067) had significantly longer mean gaze durations than pain-free individuals (M =0.217, SD =0.035, P=0.038).
Group differences
Participants with and without pain were compared on questionnaire data (Table 3). Individuals with chronic pain reported significantly great pain disability (P<0.001), acceptance of chronic pain (P<0.001), state levels of anxiety (P=0.014), and pain vigilance (P=0.011). To examine the possible effect of pain medication use on task performance and eye movements, individuals with chronic pain who reported frequently using pain medications were compared with those who did not. No significant group or interaction differences were found according to RI, eye movements, or psychological variables.
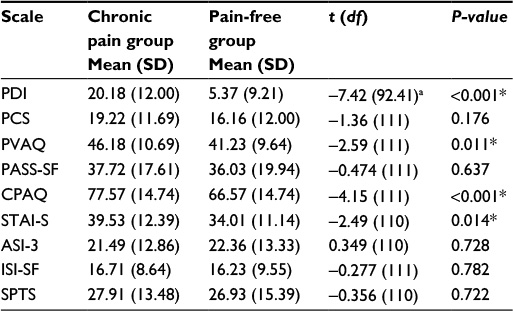 | Table 3 Comparison of questionnaire data for individuals with chronic pain (N=51) and without chronic pain (N=62) Notes: *Indicates a significant difference in scores at an adjusted P=0.01 to correct for multiple comparisons. aAdjusted t-test score reported due to a violation in Levene’s test of equality of variance, F (2, 108) = 5.75, P=0.018. Abbreviations: ASI-3, Anxiety Sensitivity Index-3; CPAQ, Chronic Pain Acceptance Questionnaire; df, degrees of freedom; ISI-SF, Illness Sensitivity Index-Short Version; PASS-SF, Pain Anxiety Symptoms Scale-Short Form; PCS, Pain Catastrophizing Scale; PDI, Pain Disability Index; PVAQ, Pain Vigilance and Awareness Questionnaire; SD, standard deviation; SPTS, Sensitivity to Pain Traumatization Scale; STAI-S, State-Trait Anxiety Inventory (state version). |
Discussion
The purpose of this study was to investigate patterns of visual attention biases to threat-related pictures of injuries in individuals with and without chronic pain using two measures of biases, RI and eye-tracking methodology. RI measures showed that participants responded faster on neutral trials in comparison to congruent or incongruent trials regardless of chronic pain status. Likewise, eye-tracking measures showed that participants displayed an overall bias toward looking at injury-related pictures based on frequency of looks (including both fixations and visits) and attentional maintenance (including mean visit duration) but this did not differ among those with or without chronic pain. An examination of results within the three phases of attentional processing showed longer mean total gaze duration toward neutral and injury pictures during the early and middle phases, respectively, regardless of chronic pain status. In contrast, during the late phase of attention, individuals with chronic pain, but not the pain-free controls, displayed longer mean total gaze duration to injury-related than neutral pictures. The sample additionally showed unsurprising differences according to pain status for several psychological measures: pain disability, pain acceptance, state levels of anxiety, and pain vigilance were significantly higher for individuals with chronic pain. Together, the present results highlight the advantages of monitoring eye movements over simple RI to measure pain-related visual attention. Moreover, they provide novel data pointing to a pattern of late-phase attentional hypervigilance to injury-related pictures for individuals with chronic pain.
Until recently, the primary measure of attentional processing used in the dot-probe paradigm has been RI.13 Specifically, it predicts that faster RIs on congruent trials compared to neutral trials indicate vigilance to threat, which was not supported by the results of the present study, and that slower RIs on incongruent trials compared to neutral trials indicate difficulty disengaging from threat, which was supported in the present study.25 Difficulty disengaging attention from a threat occurs when there is a struggle to redirect attention after a stimulus has been processed42 and this has been proposed to describe the nature of the attentional bias in anxiety,25,43,44 pain catastrophization,18 and rheumatoid arthritis.45 It is not possible to determine with certainty, based on RI alone, whether participants in the present study had difficulty disengaging attention or were actively engaged. The delay on trials containing injury-related images may have been related to a negative emotional reaction, distraction (ie, full attention toward something else was impaired), or curiosity. Distinguishing between types of attentional biases, such as hypervigilance and difficulty disengaging from threat, is important from both a theoretical and clinical perspective. Knowing the nature of the bias will help improve our understanding of possible maladaptive attentional processing or dysfunction that, in turn, may inform effective treatment strategies. It is also noteworthy that we did not find a significant interaction effect for RI variables, but as described earlier, this was the case with eye-tracking variables. This shows that eye-tracking measures can be more sensitive than RI in identifying differences in attentional processes between individuals with and without chronic pain, demonstrating its utility as a complementary form of measurement of attentional biases.
Measures of eye-tracking frequency showed that injury-related pictures received more frequent fixations and visits than other neutral pictures. Although this provides support for the notion that humans are evolutionarily predisposed to attend to threatening stimuli in the environment,46 it does not provide support for the Schema Enmeshment Model of Pain, which predicts that individuals with pain will show increased attentional processing of injury-related stimuli.1 In fact, there was evidence of fewer fixations for individuals with chronic pain. Although the absence of an interaction effect shows that attention was increased for both injury- and neutral-related pictures, this may indicate a pattern of overall avoidance. A similar pattern emerged for measures of attentional maintenance. Although no findings were significant for mean fixation duration, all participants had longer mean visit durations on injury-related pictures, with individuals with chronic pain looking at all pictures for shorter sustained period of time.
The use of eye-tracking in the present study permitted novel analysis that assessed how visual attention biases may differ across visual attention phases. The orientation phase of attention is considered to be the initial period of attentional activation toward a new stimulus and hypothesized to occur before the first 500 ms of looking at a stimulus.3,20,47 In the present study, during the orientation phase, the results showed that regardless of chronic pain status, participants had longer mean gaze durations to neutral pictures compared to injury pictures. This finding adds to the mixed evidence of previous RT-based dot-probe investigations regarding biases in early stages of processing,3 including toward threat,8 away from threat,10 or no effect.48,49 Interestingly, during the middle phase of attentional processing (500–1,000 ms), the total gaze duration shifted toward injury-related pictures, providing evidence that the nature of attentional patterns can change across attentional phases (ie, orientation versus maintenance) and supporting the frequency and maintenance findings earlier. During the late phase of attention (1,000–2,000 ms), the significant interaction showed that individuals with chronic pain had a longer mean gaze duration to injury-related pictures than did pain-free individuals. This differential pattern of attention over time supports the findings of a recent meta-analysis by Schoth et al3 of ten studies that used the visual dot probe. They found only a modest effect (Hedge’s adjusted g=0.29) for orientation attentional biases in individuals with chronic pain (stimulus presentation time between 300 and 500 ms), which was more pronounced for maintained attention (stimulus presentation time of 1,250 ms; Hedges’ adjusted g=0.42). Similar conclusions were drawn from a recent meta-analysis by Crombez et al2 examining the effect of subliminal and supraliminal exposure durations, with the authors concluding that “conscious and elaborative processes are critical for attentional biases to emerge”.
The present study has a number of limitations. Eye-tracking methodology relies on the assumption that eye movements reflect visual attention. However, visual attention can occur in the absence of eye movements.50,51 This effect may be accentuated when exposed to a distracting task, leading to “inattentional blindness”, whereby individuals may not recall exposure to a stimulus even when they looked directly at it.52,53 Therefore, although tracking eye movements is considered a strong indicator of visual attention,51,54 it is not a perfect reflection of overt attentional engagement. This study used a sample of undergraduate students who likely experience pain and disability that is not as severe as clinical samples.7 Therefore, further studies should evaluate attentional patterns in clinical populations. Finally, the present study was cross-sectional, evaluating differences between individuals with and without pain rather than how specific attentional patterns may predict pain. Longitudinal study designs are needed to establish how attention may contribute to the development and maintenance of chronic pain.
This study examined attentional biases in individuals with and without chronic pain. Using eye-tracking technology provided more direct measures of visual attention than traditional dot-probe investigations. We found that overall, individuals with and without pain responded faster to neutral stimuli contrary to the assumptions of the dot-probe paradigm, implying a difficulty to disengage from injury-related pictures. On measures of frequency and attentional maintenance, participants showed greater attention toward injury-related pictures regardless of pain status, and individuals with chronic pain had fewer fixations and shorter average visit durations than those without pain. The pattern of attentional biases changed over the course of stimuli presentation, showing initial avoidance of injury-related pictures followed by increased vigilance. During late-phase attention, only individuals with pain showed a residual bias toward injury-related pictures. Taken together, the novel use of examining attention over time with eye-tracking technology provides insight into how visual attention biases can change over time. Further research is needed to validate the present findings with clinical samples and with a longitudinal design.
Acknowledgments
We are grateful to Dr Paul Ritvo for his assistance. Samantha Fashler was supported by an Ontario Graduate Scholarship, a Canadian Institutes of Health Research (CIHR) CGS Master’s Award, and a CIHR Vanier Canada Graduate Scholarship. Joel Katz is supported by a CIHR Canada Research Chair (CRC) in Health Psychology. Funds to support the project were obtained from Dr Katz’s CRC and Dr Ritvo’s Federal Development Program. This article was derived, in part, from Samantha Fashler’s Master’s thesis. The research in this manuscript was presented as a poster presentation at the Canadian Pain Society in May 2014. An abstract of the poster was published in Pain Research & Management (vol 19,
issue 3, e31–e102, 2014).
Disclosure
The authors report no conflicts of interest in this work.
References
Pincus T, Morley S. Cognitive-processing bias in chronic pain: a review and integration. Psychol Bull. 2001;127(5):599–617. | ||
Crombez G, Van Ryckeghem DM, Eccleston C, Van Damme S. Attentional bias to pain-related information: a meta-analysis. Pain. 2013;154(4):497–510. | ||
Schoth DE, Nunes VD, Liossi C. Attentional bias towards pain-related information in chronic pain: a meta-analysis of visual-probe investigations. Clin Psychol Rev. 2012;32(1):13–25. | ||
Asmundson GJ, Carleton RN, Ekong J. Dot-probe evaluation of selective attentional processing of pain cues in patients with chronic headaches. Pain. 2005;114(1):250–256. | ||
Dear BF, Sharpe L, Nicholas MK, Refshauge K. The psychometric properties of the dot-probe paradigm when used in pain-related attentional bias research. J Pain. 2011;12(12):1247–1254. | ||
Haggman SP, Sharpe LA, Nicholas MK, Refshauge KM. Attentional biases toward sensory pain words in acute and chronic pain patients. J Pain. 2010;11(11):1136–1145. | ||
Dehghani M, Sharpe L, Nicholas MK. Selective attention to pain-related information in chronic musculoskeletal pain patients. Pain. 2003;105(1):37–46. | ||
Khatibi A, Dehghani M, Sharpe L, Asmundson GJ, Pouretemad H. Selective attention towards painful faces among chronic pain patients: evidence from a modified version of the dot-probe. Pain. 2009;142(1):42–47. | ||
Schoth DE, Liossi C. Attentional bias toward pictorial representations of pain in individuals with chronic headache. Clin J Pain. 2010;26(3):244–250. | ||
Baum C, Schneider R, Keogh E, Lautenbacher S. Different stages in attentional processing of facial expressions of pain: a dot-probe task modification. J Pain. 2013;14(3):223–232. | ||
Lautenbacher S, Huber C, Schöfer D, et al. Attentional and emotional mechanisms related to pain as predictors of chronic postoperative pain: a comparison with other psychological and physiological predictors. Pain. 2010;151(3):722–731. | ||
Asmundson GJ, Wright KD, Hadjistavropoulos HD. Hypervigilance and attentional fixedness in chronic musculoskeletal pain: consistency of findings across modified stroop and dot-probe tasks. J Pain. 2005;6(8):497–506. | ||
MacLeod C, Mathews A, Tata P. Attentional bias in emotional disorders. J Abnorm Psychol. 1986;95(1):15–20. | ||
Posner MI. Orienting of attention. Q J Exp Psychol. 1980;32(1):3–25. | ||
Posner MI. Attention: the mechanisms of consciousness. Proc Natl Acad Sci. 1994;91(16):7398–7403. | ||
Koster EH, Crombez G, Verschuere B, Van Damme S, Wiersema JR. Components of attentional bias to threat in high trait anxiety: facilitated engagement, impaired disengagement, and attentional avoidance. Behav Res Ther. 2006;44(12):1757–1771. | ||
Mathews A. Why worry? The cognitive function of anxiety. Behav Res Ther. 1990;28(6):455–468. | ||
Van Damme S, Crombez G, Eccleston C. Disengagement from pain: the role of catastrophic thinking about pain. Pain. 2004;107(1):70–76. | ||
Heeren A, Lievens L, Philippot P. How does attention training work in social phobia: disengagement from threat or re-engagement to non-threat? J Anxiety Disord. 2011;25(8):1108–1115. | ||
Bradley BP, Mogg K, Millar NH. Covert and overt orienting of attention to emotional faces in anxiety. Cogn Emot. 2000;14(6):789–808. | ||
Fashler SR, Katz J. More than meets the eye: visual attention biases in individuals reporting chronic pain. J Pain Res. 2014;7:557–570. | ||
Merskey H, Bogduk N. Classification of Chronic Pain, IASP Task Force on Taxonomy. Seattle, WA: IASP Press; 1994. | ||
Schneider W, Eschman A, Zuccolotto A. E-Prime User’s Guide. Pittsburgh, PA: Psychology Software Tools Inc; 2002. | ||
Lang PJ, Bradley MM, Cuthbert BN. International Affective Picture System (IAPS): Affective Ratings of Pictures and Instruction Manual. Technical report A-8. Gainesville, FL: University of Florida; 2008. | ||
Koster EH, Crombez G, Verschuere B, De Houwer J. Selective attention to threat in the dot probe paradigm: differentiating vigilance and difficulty to disengage. Behav Res Ther. 2004;42(10):1183–1192. | ||
Roelofs J, Peters ML, Fassaert T, Vlaeyen JW. The role of fear of movement and injury in selective attentional processing in patients with chronic low back pain: a dot-probe evaluation. J Pain. 2005;6(5):294–300. | ||
Komogortsev OV, Gobert DV, Jayarathna S, Koh DH, Gowda SM. Standardization of automated analyses of oculomotor fixation and saccadic behaviors. IEEE Trans Biomed Eng. 2010;57(11):2635–2645. | ||
Pollard CA. Preliminary validity study of the pain disability index. Percept Mot Skill. 1984;59(3):974. | ||
Sullivan MJ, Bishop SR, Pivik J. The pain catastrophizing scale: development and validation. Psychol Assess. 1995;7(4):524–532. | ||
McNeil DW, Rainwater AJ. Development of the fear of pain questionnaire-III. J Behav Med. 1998;21(4):389–410. | ||
McCracken LM. “Attention” to pain in persons with chronic pain: a behavioral approach. Behav Ther. 1997;28(2):271–284. | ||
Spielberger CD. Manual for the State-Trait Anxiety Inventory. Palo Alto, CA: Consulting Psychologists Press; 1983. | ||
Taylor S, Zvolensky MJ, Cox BJ, et al. Robust dimensions of anxiety sensitivity: development and initial validation of the Anxiety Sensitivity Index-3. Psychol Assess. 2007;19(2):176–188. | ||
Lucock MP, Morley S. The health anxiety questionnaire. Br J Health Psychol. 1996;1(2):137–150. | ||
Taylor S. The structure of fundamental fears. J Behav Ther Exp Psychiatry. 1993;24(4):289–299. | ||
Kleiman V, Clarke H, Katz J. Sensitivity to pain traumatization: a higher-order factor underlying pain-related anxiety, pain catastrophizing and anxiety sensitivity among patients scheduled for major surgery. Pain Res Manag. 2011;16(3):169–177. | ||
Heckman JJ. Sample selection bias as a specification error. Econometrica. 1979;47(1):153–161. | ||
Rubin DB. Inference and missing data. Biometrika. 1976;63(3):581–592. | ||
Vervoort T, Trost Z, Prkachin KM, Mueller SC. Attentional processing of other’s facial display of pain: an eye tracking study. Pain. 2013;154(6):836–844. | ||
Duchowski A. Eye Tracking Methodology: Theory and Practice. New York, NY: Springer Science & Business Media; 2007. | ||
Huynh H, Feldt LS. Estimation of the Box correction for degrees of freedom from sample data in randomized block and split-plot designs. J Educ Behav Stat. 1976;1(1):69–82. | ||
Fox E, Russo R, Bowles R, Dutton K. Do threatening stimuli draw or hold visual attention in subclinical anxiety? J Exp Psychol. 2001;130(4):681–700. | ||
Amir N, Elias J, Klumpp H, Przeworski A. Attentional bias to threat in social phobia: facilitated processing of threat or difficulty disengaging attention from threat? Behav Res Ther. 2003;41(11): | ||
Salemink E, van den Hout MA, Kindt M. Selective attention and threat: quick orienting versus slow disengagement and two versions of the dot probe task. Behav Res Ther. 2007;45(3):607–615. | ||
Sharpe L, Dear BF, Schrieber L. Attentional biases in chronic pain associated with rheumatoid arthritis: hypervigilance or difficulties disengaging? J Pain. 2009;10(3):329–335. | ||
Öhman A, Flykt A, Esteves F. Emotion drives attention: detecting the snake in the grass. J Exp Psychol Gen. 2001;130(3):466. | ||
Gamble AL, Rapee RM. The time-course of attentional bias in anxious children and adolescents. J Anxiety Disord. 2009;23(7):841–847. | ||
Liossi C, Schoth DE, Bradley BP, Mogg K. Time-course of attentional bias for pain-related cues in chronic daily headache sufferers. Eur J Pain. 2009;13(9):963–969. | ||
Asmundson GJ, Kuperos JL, Norton GR. Do patients with chronic pain selectively attend to pain-related information? Preliminary evidence for the mediating role of fear. Pain. 1997;72(1):27–32. | ||
von Helmholtz H. Treatise on Physiological Optics. 3rd ed. New York, NY: Dover; 1925. | ||
Zhao M, Gersch TM, Schnitzer BS, Dosher BA, Kowler E. Eye movements and attention: the role of pre-saccadic shifts of attention in perception, memory and the control of saccades. Vision Res. 2012;74: | ||
Simons DJ, Chabris CF. Gorillas in our midst: sustained inattentional blindness for dynamic events. Perception. 1999;28(9):1059–1074. | ||
Mack A. Inattentional blindness looking without seeing. Curr Dir Psychol. 2003;12(5):180–184. | ||
Duc AH, Bays P, Husain M. Eye movements as a probe of attention. Prog Brain Res. 2008;171:403–411. |
 © 2016 The Author(s). This work is published and licensed by Dove Medical Press Limited. The
full terms of this license are available at https://www.dovepress.com/terms
and incorporate the Creative Commons Attribution
- Non Commercial (unported, 3.0) License.
By accessing the work you hereby accept the Terms. Non-commercial uses of the work are permitted
without any further permission from Dove Medical Press Limited, provided the work is properly
attributed. For permission for commercial use of this work, please see paragraphs 4.2 and 5 of our Terms.
© 2016 The Author(s). This work is published and licensed by Dove Medical Press Limited. The
full terms of this license are available at https://www.dovepress.com/terms
and incorporate the Creative Commons Attribution
- Non Commercial (unported, 3.0) License.
By accessing the work you hereby accept the Terms. Non-commercial uses of the work are permitted
without any further permission from Dove Medical Press Limited, provided the work is properly
attributed. For permission for commercial use of this work, please see paragraphs 4.2 and 5 of our Terms.