Back to Journals » Infection and Drug Resistance » Volume 19
K-Means Cluster Identification of Nutritional Phenotypes in Patients with Nontuberculous Mycobacterial Pulmonary Disease and Correlation Analysis with Runyon Classification
Authors Hua M, Zhang T, Zhu F ![]() , Ding Y
, Ding Y
Received 16 January 2026
Accepted for publication 27 March 2026
Published 8 April 2026 Volume 2026:19 596606
DOI https://doi.org/10.2147/IDR.S596606
Checked for plagiarism Yes
Review by Single anonymous peer review
Peer reviewer comments 3
Editor who approved publication: Dr Hazrat Bilal
Meng Hua,1,* Tiantian Zhang,2,* Feng Zhu,1,* Yu Ding3
1Department of Respiratory and Critical Care Medicine, Affiliated Wuxi Fifth Hospital of Jiangnan University, Wuxi Fifth People’s Hospital, Wuxi, 214000, People’s Republic of China; 2Department of Tuberculosis, Huai’an Fourth People’s Hospital, Huai’an, 223002, People’s Republic of China; 3Department of Medical Laboratory, the Third Affiliated Hospital of Soochow University, Changzhou, 213003, People’s Republic of China
*These authors contributed equally to this work
Correspondence: Yu Ding, Department of Medical Laboratory, the Third Affiliated Hospital of Soochow University, Changzhou, 213003, People’s Republic of China, Tel +86-18661231618, Email [email protected]
Background and Aims: To explore nutritional heterogeneity among patients with nontuberculous mycobacterial (NTM) pulmonary disease by identifying nutritional phenotypes using K-means clustering, and to compare nutritional and inflammatory markers, Runyon classification, and comorbidities across phenotypes.
Methods: A retrospective analysis of 457 patients diagnosed with NTM pulmonary disease was conducted. Nine nutritional and inflammatory indicators were collected: body mass index (BMI), hemoglobin (HGB), lymphocyte count (LY), C-reactive protein (CRP), prealbumin (PAB), albumin (ALB), total protein (TP), triglycerides (TG), and total cholesterol (TC). The candidate clusters were initially evaluated using the elbow method and silhouette scores. In the absence of a distinct inflection point in the elbow method, the solution with the highest silhouette coefficient was regarded as the most compact candidate solution. An exploratory final clustering scheme was then determined by further incorporating bootstrap internal stability analysis and clinical interpretability. Subsequently, nutritional and inflammatory profiles, Runyon classification (Groups I and III), and comorbidity distributions were compared among phenotypes. Ordinal logistic regression analysis was employed to identify factors associated with nutritional phenotype grade.
Results: Four nutritional phenotypes were identified: Healthy–Low Inflammation (24.5%), Hyperlipidemic–Well-nourished (18.8%), Lean–Moderate Inflammation (42.5%), and Severely Emaciated–High Inflammation (14.2%). Significant differences existed in nutritional and inflammatory markers (all P< 0.001). The Severely Emaciated–High Inflammation type exhibited the lowest BMI, HGB, ALB, and TP levels; highest CRP level; highest proportion of Runyon Group III [mainly represented by the Mycobacterium avium complex (MAC)] infections (67.7%, P=0.011); and more severe comorbidities (malignancy, renal insufficiency; P< 0.05). The Healthy–Low Inflammation type displayed optimal nutritional profiles, highest proportion of Runyon Group I (predominated by Mycobacterium kansasii and Mycobacterium marinum) infections (44.6%, P=0.003), and few severe comorbidities. Ordinal logistic regression analysis demonstrated that age ≥ 60 years, malignant tumor, respiratory diseases, and renal diseases were significantly associated with an increased cumulative odds of progressing to a poorer nutritional phenotype grade (all P < 0.05).
Conclusion: Nutritional status in patients with NTM pulmonary disease shows significant heterogeneity closely associated with inflammation, bacterial strain type, and comorbidities. The Severely Emaciated–High Inflammation type exhibited the most unfavorable nutritional-inflammatory profile, suggesting that early identification, nutritional assessment, and comprehensive intervention should be strengthened clinically for such patients.
Keywords: nontuberculous mycobacterial pulmonary disease, nutritional phenotype, K-means clustering, Runyon classification, malnutrition, inflammatory response
Introduction
Nontuberculous mycobacteria (NTM) are opportunistic pathogens widely present in the environment.1 With advances in diagnostic technologies, an increasing number of immunocompromised individuals, and an aging global population, the incidence of NTM infections has steadily risen worldwide.2,3 NTM can affect multiple organs, with pulmonary infection (hereafter referred to as “NTM pulmonary disease”) being the most common and representing a significant public health concern.4 Although current guidelines recommend antibiotic therapy as the first-line treatment, the regimen is lengthy and associated with a high relapse rate.5 This challenge stems not only from the intrinsic resistance of NTM to conventional antimycobacterial drugs6 but also from the close association with the host’s immune-metabolic status.
Nutritional status is a key regulatory factor of host immune responses and plays a critical role in the progression and outcome of NTM pulmonary disease. Previous studies have shown that malnutrition is a significant risk factor for NTM infection; low body mass index (BMI) is not only associated with an increased incidence of NTM but also serves as an independent predictor of poor prognosis in affected patients.7 Moreover, albumin, a commonly used biomarker of nutritional status, has been linked to adverse outcomes in various diseases.8,9 A prospective study of 207 patients with NTM pulmonary disease indicated that hypoalbuminemia is a risk factor for disease progression.10 However, traditional nutritional assessment tools have notable limitations. BMI does not differentiate or quantify muscle and fat composition,11 and it tends to underestimate the risk of malnutrition in patients with high BMI.12 Albumin, a negative acute-phase protein, is influenced by multiple factors such as inflammation and liver function.13 When used alone to assess nutritional status, albumin misclassifies approximately 80% of individuals.14 These findings highlight the insufficiency of single indicators in accurately identifying nutritional status.
In recent years, research on NTM has primarily focused on epidemiology, pathogen identification, and optimization of antimicrobial regimens.15–17 However, comprehensive assessments of the host’s nutritional status remain insufficient, and existing studies primarily rely on single indicators,10,18 lacking integrated multi-parameter analyses. Given the wide range of nutrition-related markers, we propose the concept of “nutritional phenotypes” to enhance the evaluation of patients’ nutritional status. In this study, we employed an unsupervised clustering analysis strategy based on multidimensional nutritional indicators. K-means clustering was used to identify potential nutritional phenotypes, and principal component analysis (PCA) was performed for result visualization, thereby providing a theoretical foundation for precision nutrition interventions. This approach can aid in rapidly identifying high-risk patients and developing individualized nutritional strategies, ultimately improving patients’ quality of life and reducing healthcare costs. Notably, this study aimed to delineate nutritional-inflammatory heterogeneity within a cohort of patients with NTM pulmonary disease, rather than constructing a discriminant model between patients and healthy individuals. Therefore, healthy individuals were not included as controls in this study.
Materials and Methods
Clinical Data
A retrospective analysis was conducted on 512 patients hospitalized with NTM pulmonary disease at Wuxi Fifth People’s Hospital between January 2018 and December 2024. Inclusion criteria: Patients diagnosed with NTM pulmonary disease based on the 2020 edition of the Guidelines for the Diagnosis and Treatment of Nontuberculous Mycobacterial Diseases.19 Exclusion criteria: 1. Patients infected with unidentified NTM species; 2. Patients with unclear treatment regimens. 457 patients met the criteria and were included in the analysis (see Figure 1 for the enrollment flowchart). This study was an intragroup cluster analysis focusing on the heterogeneity within a cohort of patients with NTM pulmonary disease, and no healthy individuals were included as controls. General clinical information and laboratory test results were collected for all participants. This study was conducted in accordance with the principles of the Declaration of Helsinki and was approved by the Ethics Committee of our hospital [ethics number: YXKY-2025-014-01]. Since all patients were anonymized, informed consent was not required.
 |
Figure 1 Patient enrollment flowchart. |
NTM Classification and Diagnosis
The Runyon classification categorizes NTM species into four groups based on their growth temperature, growth rate, colony morphology, pigment production, and response to light in vitro (Group I: Photochromogens; Group II: Scotochromogens; Group III: Non- photochromogens; Group IV: Rapidly growing mycobacteria). The first three groups are considered slow-growing mycobacteria, whereas Group IV consists of rapid-growing mycobacteria.20
The diagnosis of NTM pulmonary disease is based on clinical symptoms (such as cough, sputum production, fever, weight loss), radiological findings (nodular or cavitary lesions in the lungs), microbiological evidence (positive sputum culture confirmed by molecular identification of NTM species), and, when necessary, histopathological examination. A comprehensive assessment of these factors establishes the diagnosis.19
Laboratory Tests
General information of enrolled patients was collected, including age, sex, height, weight, comorbidities, etc. Body mass index (BMI) was calculated as BMI = weight (kg) / height (m2).
On the second day after hospital admission, venous blood samples were collected. Complete blood count was analyzed using the Sysmex XN9000 hematology analyzer (Hyogo, Japan). CRP, liver function, blood biochemistry, and lipid profile were measured using the BECKMAN COULTER AU5800 analyzer (Brea, CA, USA).
Bronchoalveolar lavage fluid (BALF) was collected via bronchoscopy. After centrifugation and enrichment, the samples were subjected to mechanical cell lysis with the addition of 2 g of 0.5 μm glass beads and an appropriate amount of lytic enzyme. Nucleic acids were extracted using a DNA/RNA co-extraction kit (Tiangen, DP307), and purity was assessed using a NanoDrop spectrophotometer (samples were considered acceptable only if A260/A280 > 1.8 and A260/A230 > 2.0). Subsequently, multiplex PCR was performed to amplify the mycobacterial 16S rRNA, rpoB, and hsp65 gene fragments for targeted sequencing library construction. After magnetic bead purification, the amplified products were subjected to a second PCR to incorporate sequencing adapters and index sequences. Following library quality control, sequencing was performed on the MGISEQ-200 platform using the single-end 60 bp (SE 60 bp) mode.A custom NTM database was constructed for taxonomic annotation using publicly available mycobacterial reference sequences, primarily integrated from representative sequences associated with the identification of clinically prevalent NTM species in the NCBI nt, GenBank, and RefSeq databases. The database contained reference sequences for 16S rRNA, rpoB, and hsp65, which were uniformly curated according to the latest taxonomic nomenclature. Sequencing data were processed to remove low-quality reads, reads shorter than 60 bp, and human contaminant sequences. High-quality amplicons were mapped to the designed target regions and aligned against the custom NTM database. For species identification, consensus across multiple genes (similarity ≥ 99%) and a relative abundance threshold (≥ 0.1%) were applied as the criteria; drug resistance genes were analyzed simultaneously. Negative controls, positive controls, and sensitivity controls were included throughout the detection procedure. In this study, Runyon classification was assigned based on the Runyon group to which the detected NTM species belonged, reflecting species characteristics rather than bacterial load. For patients with mixed infections, counts were allocated to the corresponding Runyon groups for relevant analyses.
Statistical Methods
Statistical analyses were performed using R software (version 4.2.0; http://www.R-project.org/). Unsupervised clustering analysis, PCA visualization, and bootstrap stability analysis were performed in the Python 3.9 environment, primarily implemented using tools such as pandas, numpy, scikit-learn, and matplotlib. Continuous variables were tested for normality and expressed as mean ± standard deviation or median (interquartile range), as appropriate. Group comparisons were conducted using one-way analysis of variance (ANOVA) or non-parametric tests (such as the Kruskal–Wallis H-test). Categorical variables were expressed as percentages (%) and compared using the chi-square test (χ2-test) or Fisher’s exact test. Prior to formal statistical analysis, missing value checks were performed on the 9 nutritional/inflammatory indicators used for clustering analysis and the clinical variables involved in subsequent analyses. All relevant variables for the 457 patients ultimately included in the study were complete, so no missing value imputation was conducted.
Nutritional indicator data were standardized using Z-scores, and K-means clustering was used to identify nutritional phenotypes. Given that all 9 indicators included were continuous clinical variables, and the study aimed to identify clinically interpretable nutritional phenotypes in a moderate-sized sample, K-means clustering was adopted as the primary clustering approach. K-means clustering can intuitively reflect the nutritional and inflammatory characteristics of different phenotypes via cluster centers, facilitating subsequent phenotype naming and clinical interpretation. In comparison, hierarchical clustering involves a certain degree of subjectivity in dendrogram cutting for the sample size of this study, whereas Gaussian mixture models, although capable of handling more complex cluster shapes, are more sensitive to distribution assumptions and parameter estimation. The detailed analytical procedure was performed as follows. K-means clustering was conducted on the standardized data matrix, with pairwise sample similarity quantified using Euclidean distance, and the number of candidate clusters was set from k = 2∼9. To mitigate bias introduced by random initialization of cluster centroids, the random seed was set to 42, and 50 random initializations were implemented. The partition yielding the minimum sum of squared errors (SSE) was retained as the optimal solution for each given k. An elbow plot was subsequently constructed based on SSE values, and the average silhouette score was calculated to preliminarily evaluate candidate clustering solutions. In parallel, PCA was applied to provide two-dimensional visualization of the clustering results. In the absence of a distinct inflection point in the elbow plot, the solution with the highest silhouette score was identified as the most compact clustering structure. In the present study, the silhouette score was maximized at k = 2, which was thus determined as the most statistically optimal clustering scheme. To avoid excessive simplification of nutritional-inflammatory heterogeneity across patients, the adjacent candidate partitions of k = 3 and k = 4 were also retained for comparative analysis.
To assess the internal stability of the candidate clustering solutions, bootstrap resampling validation was conducted on the 9 standardized nutritional/inflammatory indicators for the candidate partitions (k = 2, 3, and 4). A total of 1000 resampled datasets were generated via sampling with replacement, and K-means clustering was repeated on each resampled dataset. Subsequently, the cluster centers derived from bootstrap resampling were applied to the full dataset for reclassification, and the adjusted Rand index (ARI) was employed to evaluate the concordance between the resampled clustering results and the original clustering outcomes. A higher ARI value indicates greater stability of the clustering structure. It should be noted that PCA was utilized solely for visualization purposes and was not involved in variable selection, cluster assignment, or the determination of the final k value. The statistical significance of differences in clinical variables among different candidate partitions was only used to assist in interpreting their clinical relevance, rather than serving as the primary criterion for determining the optimal k value. Considering the silhouette score, bootstrap stability, and clinical interpretability comprehensively, k = 4 was ultimately retained as the exploratory final clustering solution in the present study.
In the analysis of factors related to nutritional phenotypes, the 4 nutritional phenotypes were treated as ordinal categorical outcomes due to their clinical gradient from favorable to poor nutritional status and inflammatory levels. Ordinal logistic regression analysis was thereby used to identify correlates of nutritional phenotype grades. Prior to model fitting, the proportional odds assumption (such as the Brant test/parallel lines test) was used to verify model adequacy. The model results were presented as odds ratios (OR) with 95% confidence intervals (95% CI). An OR > 1 indicated an increased cumulative odds of being classified into a poorer nutritional phenotype grade, whereas an OR < 1 indicated a decreased cumulative odds of falling into a poorer nutritional phenotype grade. All statistical tests were two-sided, and a P-value < 0.05 was considered statistically significant for all tests.
Results
Comparison of General Characteristics and Laboratory Indicators
This was a retrospective cross-sectional study, and 457 patients were ultimately included. The mean age was 59.4 ± 15.6 years, with a slightly higher number of males than females (252 cases, 55.1% vs. 205 cases, 44.9%). The mean body weight was 54.4 ± 10.9 kg, and the mean BMI was 19.6 ± 3.3 kg/m2, indicating an overall trend toward underweight status. Among common comorbidities, respiratory diseases were the most prevalent (298 cases, 65.2%), followed by cardiovascular disease (123 cases, 26.9%), liver disorders (87 cases, 19.0%), and malignancies (24 cases, 5.3%); diabetes (36 cases, 7.9%) and renal disorders (9 cases, 2.0%) were relatively less common (Table 1).
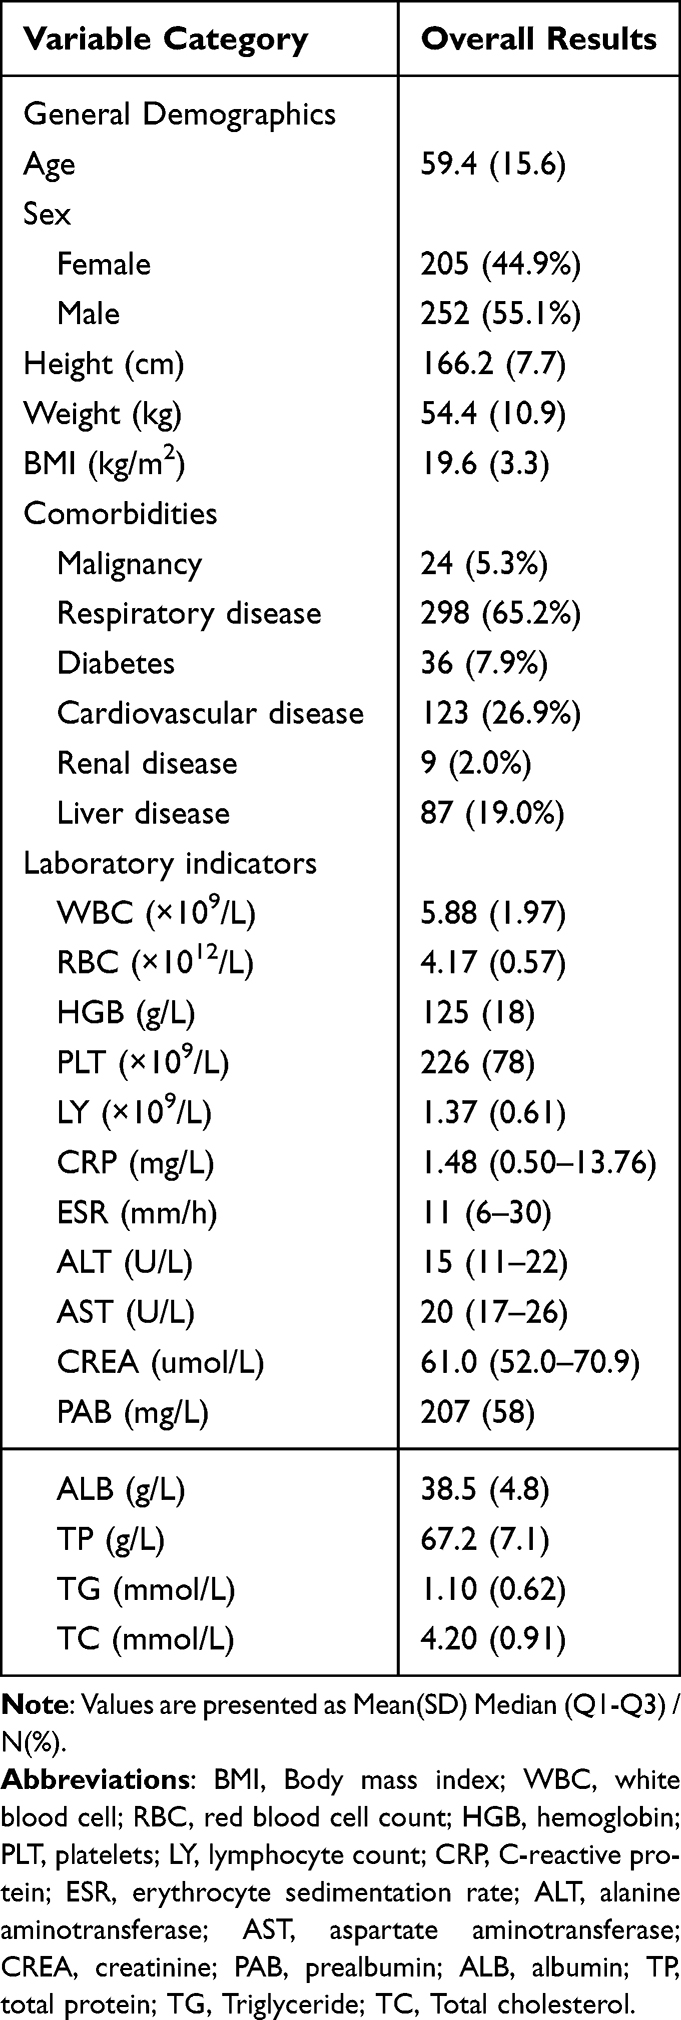 |
Table 1 General Characteristics and Laboratory Indicators of the Study Population |
Laboratory results showed a median CRP level of 1.48 mg/L and a median ESR of 11 mm/h, suggesting some patients may have mild to moderate inflammation or infection. Regarding nutritional indicators, the mean PAB was 207 ± 58 mg/L, ALB was 38.5 ± 4.8 g/L, and TP was 67.2 ± 7.1 g/L, indicating generally low protein nutritional status. For lipid profiles, TG was 1.10 ± 0.62 mmol/L and TC was 4.20 ± 0.91 mmol/L (Table 1).
Among the classifications of NTM into slow- and fast-growing types, the majority were slow-growing strains (401 cases, 87.7%), while fast-growing strains and mixed infections accounted for 10.1% and 2.2%, respectively. Based on the Runyon classification, Group I (31.7%) and Group III (60.0%) made up the most significant proportions, whereas Group II (0.9%) and Group IV (12.3%) were relatively uncommon. Regarding antibiotic treatment, most patients (396 cases, 86.7%) received combination therapy with two or more antibiotics. Monotherapy and observation groups accounted for 1.8% and 11.6%, respectively (see Figure 2). Further comparison of the distribution of antibiotic treatment regimens among different nutritional phenotypes revealed no statistically significant difference (Fisher’s exact test, P = 0.801) (Table 2), suggesting that the overall distribution of drug exposure among various phenotypes was similar in terms of treatment regimen categories.
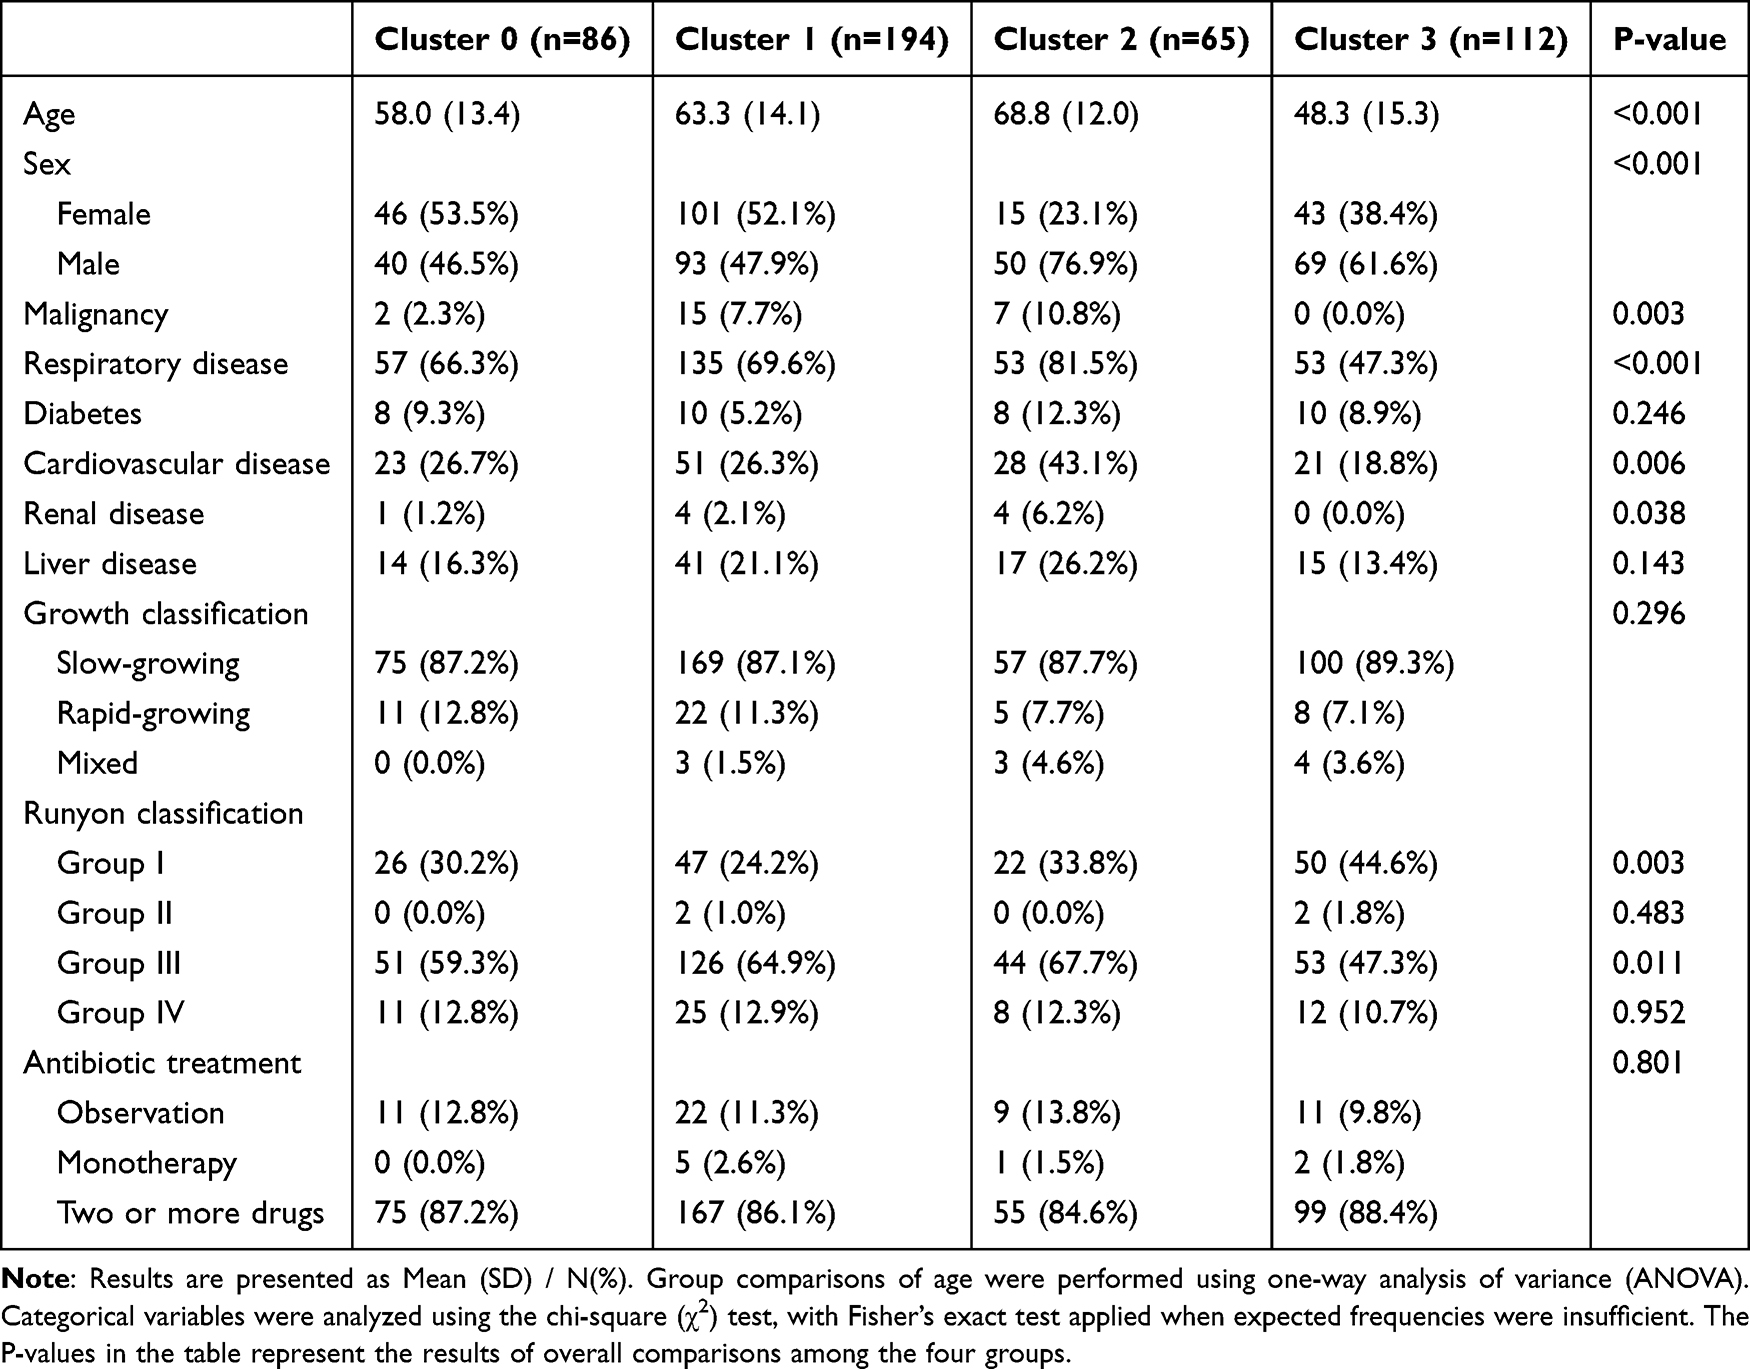 |
Table 2 Comparison of General Characteristics Across Four Nutritional Phenotype Clusters |
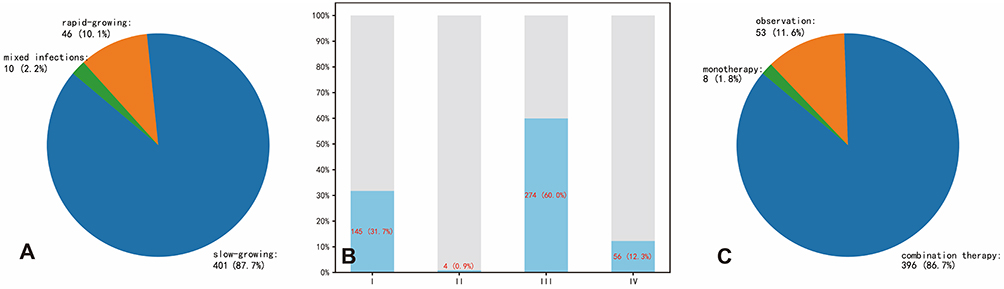 |
Figure 2 Distribution of NTM strain growth types, Runyon classification, and antibiotic treatment regimens. (A) Distribution of NTM strain types by growth rate (slow-growing, rapid-growing, and mixed infections); (B) Proportion of NTM strains categorized by Runyon classification (Groups I–IV); (C) Antibiotic treatment strategies utilized among patients (observation, monotherapy, and combination therapy). |
Selection of Indicators for Nutritional Clustering
Based on prior literature and clinical expertise, 11 nutrition/inflammation-related indicators were initially selected: Weight, BMI, RBC, HGB, LY, CRP, PAB, ALB, TP, TG, and TC. Spearman correlation analysis (with a threshold of |r| > 0.8) was then conducted to assess multicollinearity among variables. The results indicated strong correlations between Weight, BMI, RBC, and HGB. Therefore, Weight and RBC were excluded to reduce redundancy. A total of 9 variables were ultimately included for clustering analysis:
- BMI: reflects body constitution or energy balance
- HGB: assesses hematological status or degree of anemia
- LY: indicates immune-nutritional status
- CRP: represents inflammation and acute-phase response
- PAB, ALB, TP: collectively evaluate acute and chronic protein nutritional status
- TG, TC: represent lipid metabolism status
These nine indicators are complementary and provide a multidimensional assessment of the patient’s nutritional and inflammatory status. These variables were subsequently used for unsupervised clustering to explore potential nutritional phenotypes.
Unsupervised Clustering of 9 Nutritional Indicators
The 9 previously selected variables (BMI, HGB, LY, CRP, PAB, ALB, TP, TG, TC) were first standardized using Z-score transformation to identify potential nutritional phenotypes from multidimensional nutritional indicators. K-means clustering was then performed with different numbers of clusters (k = 2 to 9), and the results were evaluated using the elbow method (inertia) and silhouette score (silhouette) (Figure 3). The inertia value decreased continuously with increasing k, as shown by the elbow method, but no distinct “elbow point” was observed. The silhouette score was highest at k = 2 and declined overall as the number of clusters increased. Based on the outcomes of the elbow method and silhouette coefficient, this study initially regarded k = 2 as the statistically optimal compact candidate solution, while retaining the adjacent k = 3 and k = 4 as pre-specified candidate schemes. Further comparisons were conducted by integrating bootstrap internal stability and clinical interpretability, and PCA-based scatter plots were generated to visualize the clustering results (Figure 4).
 |
Figure 3 Evaluation plots of the elbow method and silhouette score for different cluster numbers (k = 2–9). This figure was used for descriptive assessment of candidate clustering schemes, and no statistical significance test was performed. (A) Elbow method evaluation based on inertia (sum of squared errors, SSE) showing changes in within-cluster variance for different numbers of clusters. (B) Silhouette coefficient evaluation indicating cluster cohesion and separation at varying numbers of clusters. |
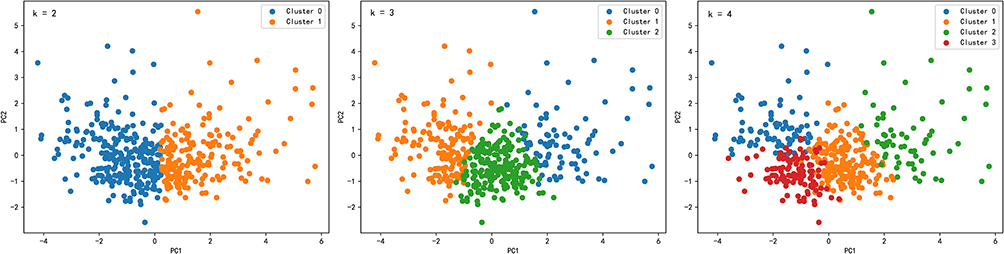 |
Figure 4 Two-dimensional PCA visualization scatter plots for different numbers of clusters (k = 2–4). These plots were only used to illustrate the distribution patterns of different candidate clustering schemes along the first two principal components, with no additional statistical significance testing performed. |
Comparison of Candidate Clustering Schemes and Determination of the Final Clustering Solution
Among the candidate clustering solutions (k =2, 3, and 4), k =2 achieved the highest silhouette score, indicative of a coarse-grained clustering solution with optimal internal compactness. Further bootstrap internal validation demonstrated that the ARI for the k =4 solution was higher than those for the k =2 and k =3 solutions (see Supplementary Figure S1), implying superior internal stability. Notably, the k =4 clustering scheme identified four distinct subgroups characterized by divergent nutrition-inflammation phenotypes, allowing for a more granular depiction of clinical heterogeneity compared with the k =2 solution. Of note, the optimal k value in the present study was not determined directly according to the number of statistically significant differences in downstream clinical variables. Comparisons of clinical characteristics in Table 2 and Supplementary Tables S1 and S2 served only to aid interpretation of the clinical implications of each candidate clustering scheme, rather than to identify the optimal k value. By comprehensively considering the silhouette coefficient, bootstrap-derived stability, and clinical interpretability, we ultimately selected k = 4 as the exploratory final clustering solution. Specifically, k = 2 represented a more compact coarse clustering solution, whereas k = 4 represented a refined clustering solution with superior stability and better clinical resolution among all candidate solutions.
Statistically significant differences were observed across the four nutritional phenotypes for BMI, HGB, LY, PAB, ALB, TP, TG, and TC (all P < 0.001, one-way ANOVA), as well as for CRP (P < 0.001, Kruskal–Wallis H-test) (Table 3, Figure 5). Based on the clustering results for k = 4 and the feature comparisons (Table 2 and Table 3, Figure 5), patients were categorized into four nutrition–inflammation phenotypes, summarized as follows:
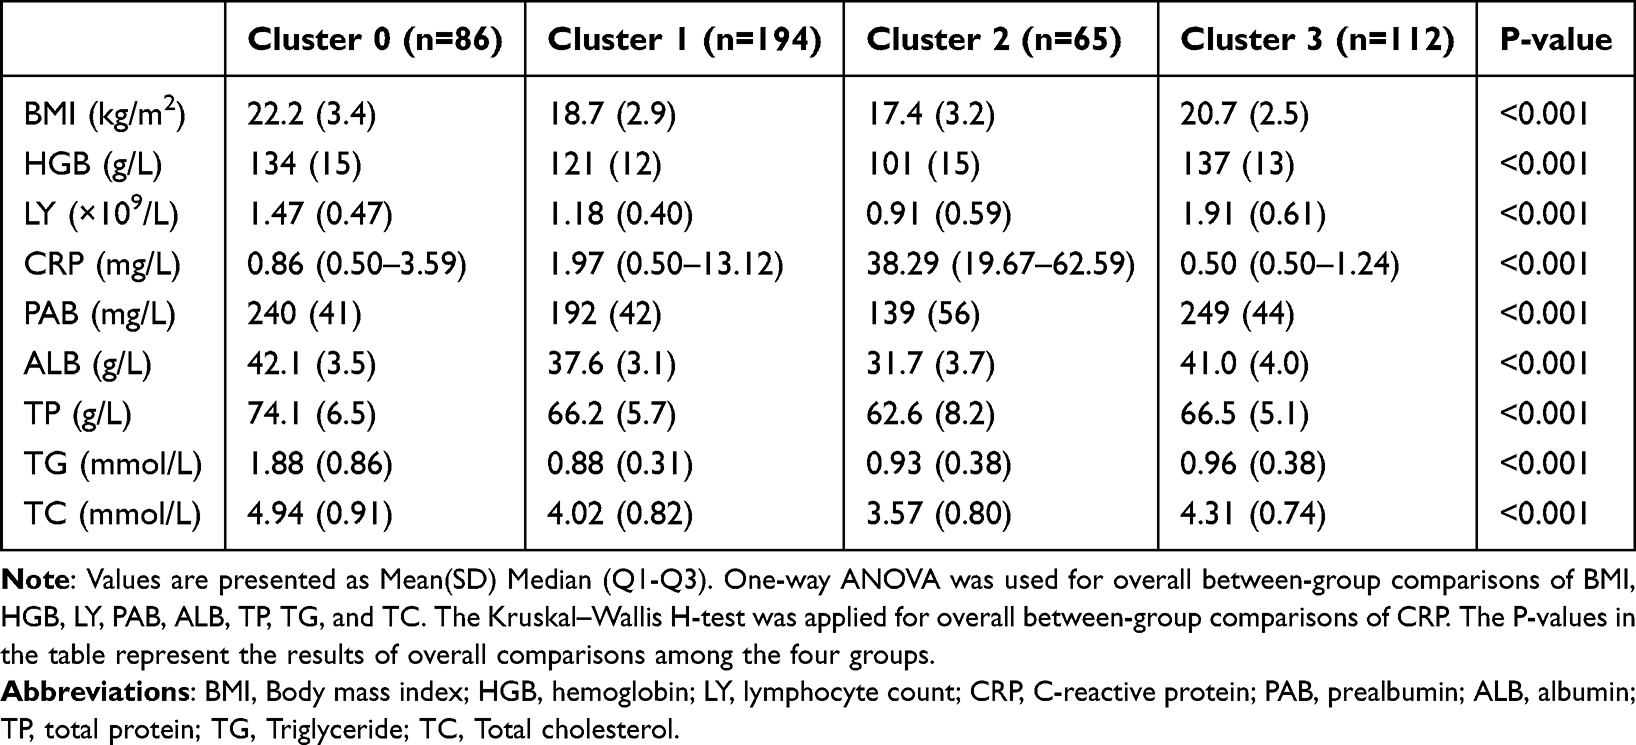 |
Table 3 Comparison of Nutritional Indicators Across Four Nutritional Phenotype Clusters |
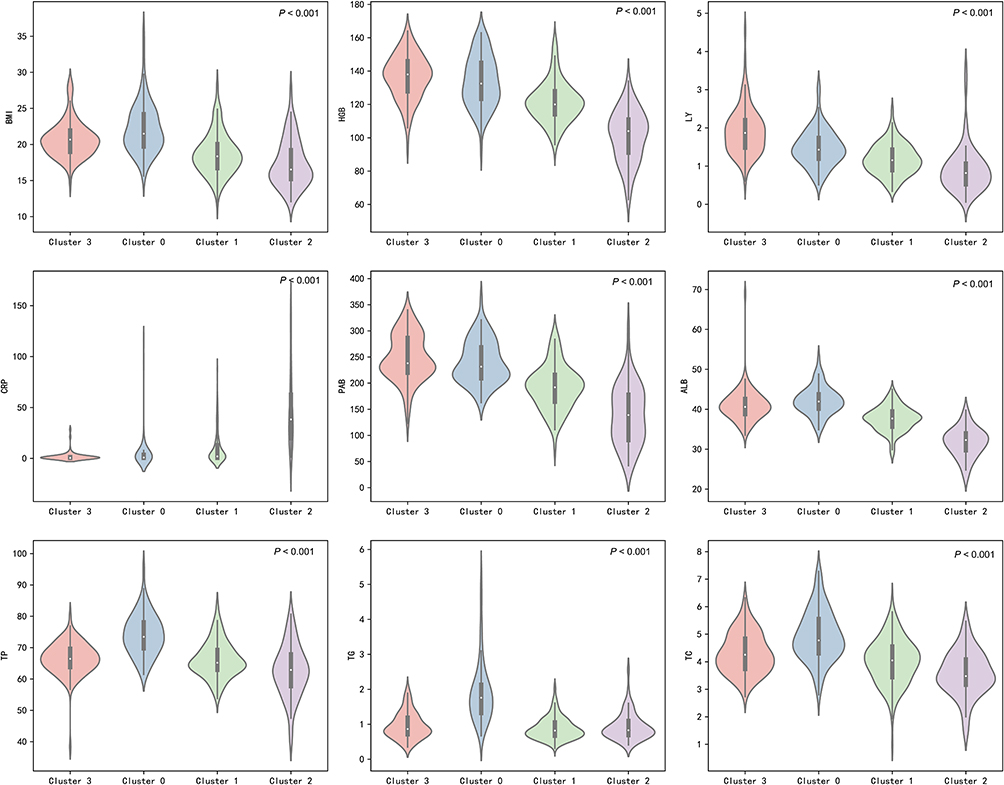 |
Figure 5 Distribution of nutritional and inflammatory indicators among the four nutritional phenotype clusters illustrated by violin plots. Indicators include body mass index (BMI), hemoglobin (HGB), lymphocyte count (LY), C-reactive protein (CRP), prealbumin (PAB), albumin (ALB), total protein (TP), triglyceride (TG), and total cholesterol (TC). One-way ANOVA was used for between-group comparisons of BMI, HGB, LY, PAB, ALB, TP, TG, and TC, while the Kruskal–Wallis H-test was adopted for CRP. |
Cluster 0: Hyperlipidemic–Relatively Well-Nourished Type
Patients in this group had relatively high body weight and lipid metabolism indicators. BMI was the highest (around 22.2), with significantly elevated serum TG and TC levels. Protein nutrition indicators such as ALB and PAB were also relatively favorable. The median CRP level was 0.86 mg/L, and the average age was approximately 58 years, falling in the midrange among the groups. The distribution of comorbidities was also moderate, reflecting a phenotype with decent nutritional status but relatively elevated lipid levels.
Cluster 1: Lean–Moderate Inflammation Type
This group had a relatively low BMI (around 18.7) and HGB levels. ALB and PAB were moderately low, though still better than those in the most severely affected group. The median CRP level was 1.97 mg/L, indicating a moderate inflammatory response. The average age was around 63 years, showing a trend toward older age, but not the highest. This group can be characterized as having “mild to moderate malnutrition with moderate inflammation.”
Cluster 2: Severely Emaciated–High Inflammation Type
Among all groups, patients in this cluster had the lowest BMI, HGB, ALB, and PAB levels, while the median CRP was the highest (up to 38.29 mg/L). The average age was also the highest (69 years), and multiple chronic comorbidities were commonly present. This phenotype presents a classic “severe malnutrition with high inflammation” profile, indicating that these patients are in the most critical condition and require more aggressive nutritional and therapeutic interventions.
Cluster 3: Healthy–Low Inflammation Type
Patients in this group had overall good nutritional status. BMI and protein nutrition levels (ALB, PAB) were normal or slightly above normal. The median CRP level was extremely low (around 0.50 mg/L), suggesting only a mild inflammatory response. The average age was about 48 years, making this the cluster’s youngest group. These patients had almost no severe comorbidities such as malignancy or renal impairment, and thus can be considered a “relatively healthy, low-inflammation” nutritional phenotype.
Meanwhile, when comparing the association between nutritional phenotypes and NTM infection subtypes, significant overall between-group differences were observed in the infection proportion of Group I (χ2-test, P = 0.003), with Cluster 3 (Healthy–Low Inflammation Type) accounting for the highest proportion (44.6%). Similarly, the overall between-group difference in the infection proportion of Group III was statistically significant (χ2-test, P = 0.011), and Cluster 2 (Severely Emaciated–High Inflammation Type) constituted the largest proportion (67.7%) (Table 2). These findings suggested that distinct nutrition–inflammation phenotypes were associated with the distribution of the Runyon classification. The Healthy–Low Inflammation Type was more prevalent in Group I infections, whereas the Severely Emaciation–High Inflammation Type was more common in Group III infections. This indicated that nutritional and inflammatory status may contribute to the phenotypic heterogeneity of NTM infection. Clinically, emphasis should be placed on the early identification and intervention of patients with severe malnutrition and prominent inflammation.
Univariate and Multivariate Analyses of Nutritional Phenotypes
Given that the four nutritional phenotypes identified above exhibited a clinical gradient from favorable to poor in terms of nutritional status and inflammatory levels, the present study treated them as ordinal categorical outcome variables (0= Healthy–Low Inflammation Type, 1= Hyperlipidemic–Relatively Well-nourished Type, 2= Lean–Moderate Inflammation Type, 3= Severely Emaciated–High Inflammation Type). Ordinal logistic regression analysis was performed to identify factors associated with the nutritional phenotype grade (Table 4). Before modeling, the Brant test and parallel lines test were used to evaluate the proportional odds assumption, and the results indicated that the assumption was not rejected (global test, P > 0.05).
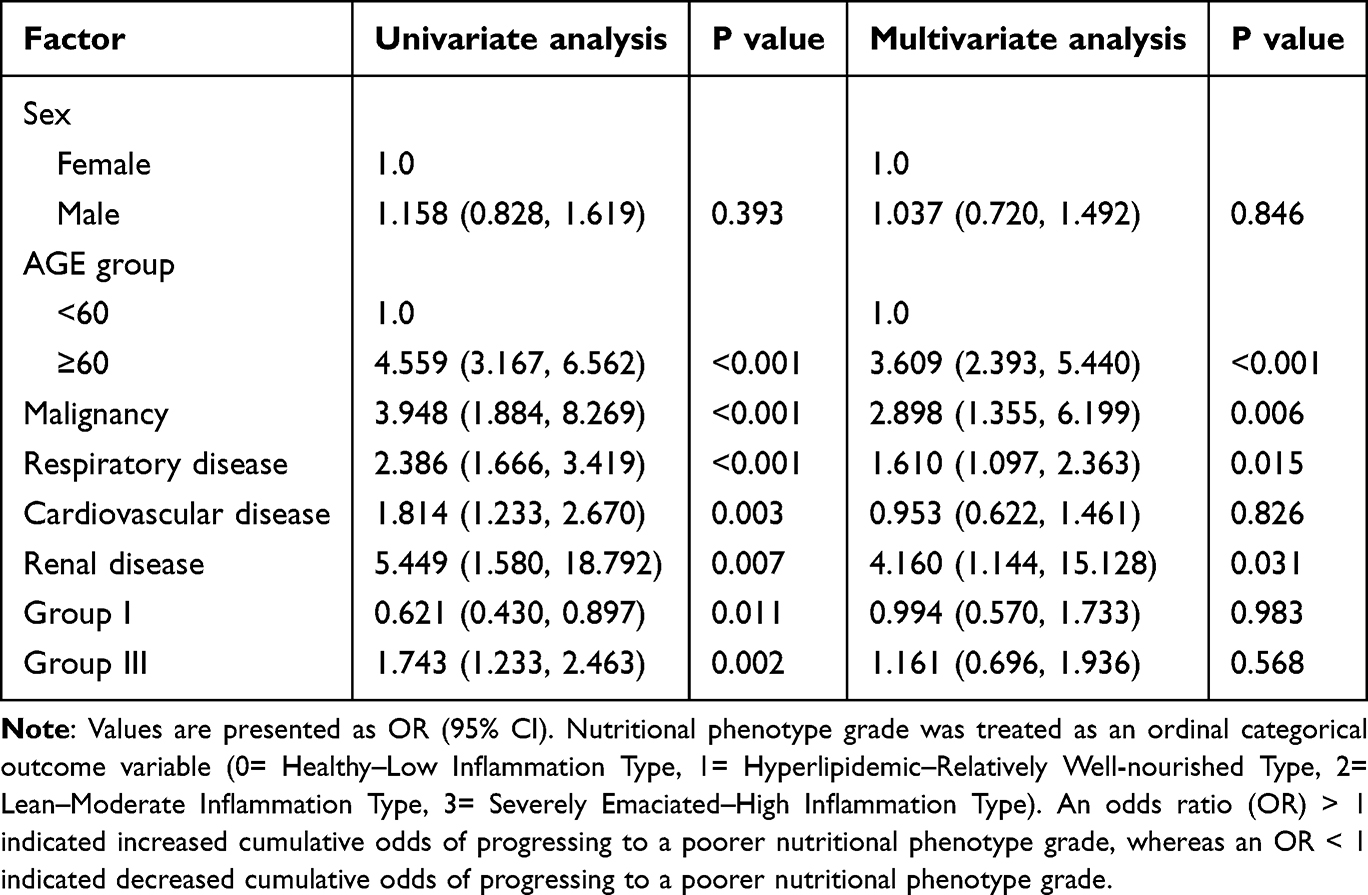 |
Table 4 Univariate and Multivariate Ordinal Logistic Regression Analyses of Factors Associated with Nutritional Phenotype Grade |
Univariate ordinal logistic regression analysis demonstrated that age ≥ 60 years, malignant tumor, respiratory disease, heart disease, renal disease, and Runyon Group III infection were significantly associated with increased cumulative odds of progressing to a poorer nutritional phenotype grade, whereas Runyon Group I infection was significantly associated with decreased cumulative odds (all P < 0.05). After further adjustment in the multivariate model, age ≥ 60 years (OR = 3.609, 95% CI: 2.393–5.440, P < 0.001), malignant tumor (OR = 2.898, 95% CI: 1.355–6.199, P = 0.006), respiratory disease (OR = 1.610, 95% CI: 1.097–2.363, P = 0.015), and renal disease (OR = 4.160, 95% CI: 1.144–15.128, P = 0.031) remained significantly associated with increased cumulative odds of a poorer nutritional phenotype grade. In contrast, sex, heart disease, and Runyon Group I/III infection status were not significantly associated after adjusting for confounding factors (all P > 0.05). These findings indicated that advanced age, comorbid malignant tumor, and chronic respiratory or renal disease were associated with a poorer nutritional phenotype grade.
Discussion
In this study, an unsupervised clustering analysis was conducted on NTM pulmonary disease patients using multidimensional nutritional indicators, identifying four distinct nutritional phenotypes. Patients with different phenotypes exhibited significant differences in nutritional status, inflammatory response, and infection type. These findings offer new insights into the regulatory role of host condition in NTM infection and support individualized management strategies.
Malnutrition may result from inadequate nutrient intake or absorption disorders and disease-related inflammation, which can trigger anorexia, reduced intake, and muscle catabolism, among other mechanisms.21 In light of this, the Global Leadership Initiative on Malnutrition (GLIM) recommends incorporating markers of inflammation as a core component of malnutrition diagnosis.22 In this study, we included nine nutrition- and inflammation-related indicators to comprehensively evaluate patients’ heterogeneous nutritional phenotypes. The results showed that both the hyperlipidemic–relatively well-nourished type and the healthy–low inflammation type presented relatively favorable protein and lipid nutritional levels, with the former tending toward hyperlipidemia and the latter characterized by younger age and lower inflammation markers. Previous studies have reported that total cholesterol levels are generally lower in NTM pulmonary disease patients.18 A study from South Korea also found that decreased cholesterol levels were associated with disease progression in NTM pulmonary disease.23 The reduction in total cholesterol may involve multiple mechanisms, including decreased synthesis and increased catabolism.24 Additionally, it has been reported that cholesterol-rich diets may accelerate sputum culture conversion in pulmonary tuberculosis patients.25 Our findings further suggest that although patients in the hyperlipidemic–relatively well-nourished group had elevated lipid metabolism indicators, their nutritional status remained relatively good. This implies that moderately increased lipid levels may serve as an energy reserve for immune cells and do not appear to exacerbate NTM infection.26
This study also found that patients in the severely emaciated–high-inflammation cluster had the lowest nutritional indices and the highest inflammatory indices. A low BMI is a well-established risk factor for NTM infection.27 Kim et al28 observed that patients with NTM infection were generally taller and slimmer than controls, suggesting that a lean, tall body type might predispose to the disease. Ikegame et al29 likewise noted that BMI is an excellent indicator for nutritional assessment and predicting disease spread in NTM pulmonary disease. Although a low BMI may be a consequence of NTM infection itself,30 loss of adipose tissue and dysregulation of adipokines involved in immune responses (eg., leptin and adiponectin) could also increase susceptibility to NTM.10,11 Some studies, however, report no significant association between overall body weight or BMI and disease severity, whereas nutritional status assessed by serum albumin correlates well with severity.31,32 The inflammatory response triggered by NTM infection can suppress protein synthesis, accelerate catabolism, and alter albumin distribution in the body.33 Siedner et al34 found that low albumin levels are significantly associated with elevated interleukin-6 (IL-6), suggesting immune system activation. Malnutrition also leads to lymphopenia, and lymphocytes are essential for both humoral and cellular immunity.35 Persistent antigenic stimulation may induce T-lymphocyte exhaustion, impairing effective immune responses to chronic infectious diseases.36 Furuuchi et al37 proposed that lymphopenia could be a biomarker for predicting the course of NTM pulmonary disease. The outcome of NTM infection depends on the interaction between the pathogen and the host immune system. It may promote disease progression by compromising nutritional and immune function.35,38 Therefore, relying on a single indicator cannot fully reflect the interaction between nutrition and inflammation in these patients. This study overcame the limitations of traditional single-index assessments by applying unsupervised clustering to integrate multidimensional nutritional indicators. Through comparing nutritional and inflammatory characteristics among different groups, a simplified nutritional phenotype scoring system could be developed in the future to enable rapid nutritional risk stratification, assist in formulating individualized clinical treatment decisions, particularly for those in the severely emaciated–high-inflammation cluster who require closer clinical monitoring and comprehensive intervention.
We further examined the association between different nutritional phenotypes and NTM infection subtypes and found that patients in the healthy–low inflammation group had a higher proportion of Runyon Group I infections, whereas those in the severely emaciated–high inflammation group were more likely to present with Group III infections. Group I NTM species are mainly Mycobacterium kansasii and Mycobacterium marinum. M. kansasii is the most common NTM species found in patients without comorbidities39 and shows high sensitivity to most first- and second-line antibiotics, leading to relatively high treatment success rates.40 This study also found that patients in the healthy–low inflammation group had an overall good nutritional status and almost no severe comorbidities such as malignancy or renal impairment, consistent with previous findings. Group III NTM primarily comprises the Mycobacterium avium complex (MAC), which is more frequently observed in patients with underlying pulmonary diseases or immune deficiencies. Morimoto et al41 reported that MAC pulmonary disease is often accompanied by malnutrition, and poor nutritional status is closely linked to impaired cell-mediated immunity, constituting an essential pathogenic factor in MAC lung disease.42 In addition, inflammatory cytokines can inhibit macrophage autophagy, reducing their ability to clear NTM.43 MAC pulmonary disease is also known for its relatively low treatment success rate and poor treatment tolerance, both of which are key clinical challenges. Even when treatment is initially successful, the recurrence rate of MAC infection remains high.44,45 These characteristics suggest that patients with this phenotype face greater therapeutic complexity, underscoring the need for early identification and nutritional intervention. Of note, the nutritional phenotypes identified in the present study reflect relative heterogeneity within the cohort of patients with NTM pulmonary disease, rather than absolute deviation from healthy individuals. Meanwhile, some patients had already received antimicrobial therapy at the time of sample collection. Therefore, the findings regarding the association between nutritional phenotypes and Runyon classification should be interpreted as exploratory, and further validation is warranted in future studies involving healthy controls and pretreatment samples.
Further analysis revealed that age ≥ 60 years, comorbid malignancy, respiratory disease, and renal disease were significantly associated with increased cumulative odds of progressing to a poorer nutritional phenotype grade. These findings indicated that elderly patients and those with malignancies, chronic respiratory diseases, or renal diseases among individuals with NTM pulmonary disease exhibited an unfavorable nutrition-inflammation phenotype. The underlying mechanisms may involve inadequate protein intake, weakened respiratory muscle strength, impaired mucociliary clearance, suppressed cell-mediated immunity, reduced cytokine production, and weakened phagocytic activity. These changes collectively undermine the host’s protective barrier against NTM infection and contribute to a vicious cycle of disease progression.46,47
This study has several limitations. First, it was a single-center retrospective study, and thus cannot establish causal relationships. Second, the nutritional indicators included were limited to serum biochemical and inflammatory markers; measures of skeletal muscle mass or function (such as grip strength or muscle area) were not assessed, which may have limited the comprehensiveness of nutritional and functional status evaluation. Third, the lack of a healthy control group in the present study precluded direct comparisons of the identified nutritional phenotypes with the normative nutrition-inflammation profile of healthy individuals, thereby limiting the ability to ascertain the degree to which these phenotypes constitute disease-specific alterations in NTM pulmonary disease. Future case-control or prospective multicenter studies incorporating healthy controls and patients with other respiratory diseases are warranted to further validate the disease specificity and external generalizability of our findings. In addition, a proportion of patients had received antimicrobial therapy before sample collection. Although the distribution of antibiotic regimens did not differ significantly across nutritional phenotypes, prior or ongoing treatment may still have affected bacterial load and detection rates, potentially introducing bias into Runyon classification and its observed association with nutritional phenotypes. Accordingly, future investigations should prioritize the enrollment of treatment-naive patients and perform sensitivity analyses stratified by treatment duration, drug exposure intensity, and serial sampling. Fourth, the present study utilized the K-means clustering algorithm to derive nutritional phenotypes. This approach is inherently sensitive to outliers and assumes approximately regular cluster geometries. Although bootstrap resampling was performed to assess the internal stability of the candidate clustering solutions, and the findings supported satisfactory stability of the final 4-cluster structure, this classification should still be regarded as an exploratory, clinically driven clustering solution rather than a unique mathematically optimal partition. Moreover, given the absence of validation in an independent external cohort, the generalizability and robustness of the identified clustering structure remain to be further corroborated in subsequent multicenter investigations. Fifth, this study could not directly assess the relationship between different nutritional phenotypes and clinical outcomes due to the lack of long-term clinical follow-up data. Lastly, the study population consisted of a single ethnic group in China, limiting the findings’ generalizability. Future prospective multicenter studies are warranted to enroll healthy controls and treatment-naive patients, integrate comprehensive body composition and functional measures, perform independent external validation, and conduct long-term follow-up to further validate the conclusions of the present study.
Conclusion
Nutritional phenotypes among patients with NTM pulmonary disease exhibit significant heterogeneity. Four clinically interpretable nutritional phenotypes were identified based on multidimensional nutritional and inflammatory biomarkers. The severely emaciated–high inflammation phenotype demonstrated the most adverse nutrition-inflammatory profile, indicating that these patients may necessitate earlier nutritional evaluation, intensive surveillance, and multidisciplinary intervention. Further prospective longitudinal studies with independent external validation are warranted to ascertain the clinical utility of nutrition phenotype–stratified management strategies in patients with NTM pulmonary disease.
Data Sharing Statement
The datasets used and/or analyzed during the current study are available from the corresponding author upon reasonable request.
Ethics Approval and Consent to Participate
This study followed the principles of the Declaration of Helsinki and was approved by the Institutional Ethics Committee of Wuxi Fifth People’s Hospital [ethics number: YXKY-2025-014-01]. Since all patients were anonymized, the need for consent to participate was waived by the Institutional Ethics Committee of Wuxi Fifth People’s Hospital.
Funding
This study was supported by Medical Key Strategic Project of Wuxi Health Commission.
Disclosure
The authors declare that they have no competing interests relevant to the content of this article.
References
1. Gross JE, Jones MC, Buige A, Prevots DR, Kasperbauer S. Pulmonary nontuberculous mycobacterial infections among women with cystic fibrosis and non-cystic fibrosis bronchiectasis. Therap Adv Respir Dis. 2025;19:17534666251323181. doi:10.1177/17534666251323181
2. Niederman MS, Zumla A. Editorial: toward improving the diagnosis, treatment and prevention of community acquired and nosocomial respiratory tract infections. Curr Opin Pulm Med. 2019;25(3):217–15. doi:10.1097/MCP.0000000000000577
3. Ko RE, Moon SM, Ahn S, et al. Changing epidemiology of nontuberculous mycobacterial lung diseases in a tertiary referral hospital in Korea between 2001 and 2015. J Korean Med Sci. 2018;33(8):e65. doi:10.3346/jkms.2018.33.e65
4. Kwak N, Kim SA, Choi SM, Lee J, Lee CH, Yim JJ. Longitudinal changes in health-related quality of life according to clinical course among patients with non-tuberculous mycobacterial pulmonary disease: a prospective cohort study. BMC Pulm Med. 2020;20(1):126. doi:10.1186/s12890-020-1165-3
5. Waters V, Ratjen F. Antibiotic treatment for nontuberculous mycobacteria lung infection in people with cystic fibrosis. Cochrane Database Syst Rev. 2020;6(6):Cd010004. doi:10.1002/14651858.CD010004.pub5
6. Johansen MD, Herrmann JL, Kremer L. Non-tuberculous mycobacteria and the rise of Mycobacterium abscessus. Nat Rev Microbiol. 2020;18(7):392–407. doi:10.1038/s41579-020-0331-1
7. Song JH, Kim BS, Kwak N, Han K, Yim JJ. Impact of body mass index on development of nontuberculous mycobacterial pulmonary disease. Eur Respir J. 2021;57(2):2000454. doi:10.1183/13993003.00454-2020
8. Mori S, Usami N, Fukumoto K, et al. The significance of the prognostic nutritional index in patients with completely resected non-small cell lung cancer. PLoS One. 2015;10(9):e0136897. doi:10.1371/journal.pone.0136897
9. Jellinge ME, Henriksen DP, Hallas P, Brabrand M. Hypoalbuminemia is a strong predictor of 30-day all-cause mortality in acutely admitted medical patients: a prospective, observational, cohort study. PLoS One. 2014;9(8):e105983. doi:10.1371/journal.pone.0105983
10. Kim SJ, Yoon SH, Choi SM, et al. Characteristics associated with progression in patients with of nontuberculous mycobacterial lung disease: a prospective cohort study. BMC Pulm Med. 2017;17(1):5. doi:10.1186/s12890-016-0349-3
11. Lim SY, Lee YJ, Park JS, et al. Association of low fat mass with nontuberculous mycobacterial infection in patients with bronchiectasis. Medicine. 2021;100(14):e25193. doi:10.1097/MD.0000000000025193
12. Saitoh M, Ogawa M, Kondo H, et al. Sarcopenic obesity and its association with frailty and protein-energy wasting in hemodialysis patients: preliminary data from a single center in Japan. Ren Replace Ther. 2019;5(1):46. doi:10.1186/s41100-019-0240-9
13. Bharadwaj S, Ginoya S, Tandon P, et al. Malnutrition: laboratory markers vs nutritional assessment. Gastroenterol Rep. 2016;4(4):272–280. doi:10.1093/gastro/gow013
14. Biercewicz M, Slusarz R, Kedziora-Kornatowska K, Filipska K, Bielawski K, Ruszkowska-Ciastek B. Assessment of leptin-to-adiponectin ratio in prediction of insulin resistance and nutrition status in a geriatric female population. J Physiol Pharmacol. 2020;71(1). doi:10.26402/jpp.2020.1.02
15. Zhou Y, Mu W, Zhang J, Wen SW, Pakhale S. Global prevalence of non-tuberculous mycobacteria in adults with non-cystic fibrosis bronchiectasis 2006-2021: a systematic review and meta-analysis. BMJ Open. 2022;12(8):e055672. doi:10.1136/bmjopen-2021-055672
16. Licata MA, Mencarini P, Mastrobattista A, et al. Clinical utility of induced sputum and bronchoalveolar lavage cultures in diagnosing nontuberculous mycobacterial pulmonary disease. Pathogens. 2024;13(12). doi:10.3390/pathogens13121064
17. Sreekumar A, Kumar A, Biswas R, Biswas L. Emerging and alternative strategies for the treatment of nontuberculous mycobacterial infections. Exp Rev Anti-Infective Ther. 2024;22(10):835–853. doi:10.1080/14787210.2024.2395003
18. Oh J, Park HD, Kim SY, Koh WJ, Lee SY. Assessment of vitamin status in patients with nontuberculous mycobacterial pulmonary disease: potential role of vitamin A as a risk factor. Nutrients. 2019;11(2):343. doi:10.3390/nu11020343
19. Tuberculosis Branch of the Chinese Medical Association. Guidelines for the diagnosis and treatment of nontuberculous Mycobacterial diseases (2020 Edition). Chin J Tubercul Respirat Dis. 2020;43(11):918–946. [in Chinese].
20. Chin KL, Sarmiento ME, Alvarez-Cabrera N, Norazmi MN, Acosta A. Pulmonary non-tuberculous mycobacterial infections: current state and future management. Eur J Clin Microbiol Infect Dis. 2020;39(5):799–826. doi:10.1007/s10096-019-03771-0
21. Cederholm T, Barazzoni R, Austin P, et al. ESPEN guidelines on definitions and terminology of clinical nutrition. Clin Nutr. 2017;36(1):49–64. doi:10.1016/j.clnu.2016.09.004
22. Cederholm T, Jensen GL, Correia M, et al. GLIM criteria for the diagnosis of malnutrition - A consensus report from the global clinical nutrition community. Clin Nutr. 2019;38(1):1–9. doi:10.1016/j.clnu.2018.08.002
23. Hong JY, Yang GE, Ko Y, et al. Changes in cholesterol level correlate with the course of pulmonary nontuberculous mycobacterial disease. J Thoracic Dis. 2016;8(10):2885–2894. doi:10.21037/jtd.2016.10.75
24. Oh J, Shin SH, Choi R, et al. Assessment of 7 trace elements in serum of patients with nontuberculous mycobacterial lung disease. J Trace Elem Med Biol. 2019;53:84–90. doi:10.1016/j.jtemb.2019.02.004
25. Pérez-Guzmán C, Vargas MH, Quiñonez F, Bazavilvazo N, Aguilar A. A cholesterol-rich diet accelerates bacteriologic sterilization in pulmonary tuberculosis. Chest. 2005;127(2):643–651. doi:10.1378/chest.127.2.643
26. Norheim F, Gjelstad IM, Hjorth M, et al. Molecular nutrition research: the modern way of performing nutritional science. Nutrients. 2012;4(12):1898–1944. doi:10.3390/nu4121898
27. Pease C, Alvarez GG. A case of relapsed Mycobacterium chelonae pulmonary infection presenting with severe weight loss and treated with a combination of antibiotic therapy and percutaneous feeding. J Clin Tuberculosis Other Mycobacterial Dis. 2021;22:100209. doi:10.1016/j.jctube.2020.100209
28. Kim RD, Greenberg DE, Ehrmantraut ME, et al. Pulmonary nontuberculous mycobacterial disease: prospective study of a distinct preexisting syndrome. Am J Respir Crit Care Med. 2008;178(10):1066–1074. doi:10.1164/rccm.200805-686OC
29. Ikegame S, Maki S, Wakamatsu K, et al. Nutritional assessment in patients with pulmonary nontuberculous mycobacteriosis. Internal Med. 2011;50(21):2541–2546. doi:10.2169/internalmedicine.50.5853
30. Yin H, Gu X, Wang Y, et al. Clinical characteristics of patients with bronchiectasis with nontuberculous mycobacterial disease in Mainland China: a single center cross-sectional study. BMC Infect Dis. 2021;21(1):1216. doi:10.1186/s12879-021-06917-8
31. Wang X, Villa C, Dobarganes Y, et al. Phenotypic clustering in non-cystic fibrosis bronchiectasis patients: the role of eosinophils in disease severity. Int J Environ Res Public Health. 2021;18(16).
32. Wilm J, Costa JHC, Neave HW, Weary DM, von Keyserlingk MAG. Technical note: serum total protein and immunoglobulin G concentrations in neonatal dairy calves over the first 10 days of age. J Dairy Sci. 2018;101(7):6430–6436. doi:10.3168/jds.2017-13553
33. Frajman A, Izhakian S, Mekiten O, et al. Phenotypical characteristics of nontuberculous mycobacterial infection in patients with bronchiectasis. Respir Res. 2024;25(1):278. doi:10.1186/s12931-024-02904-0
34. Siedner MJ, Hunt PW. All about the Albumin? Prognostic capacity of serum albumin in patients with treated HIV infection. J Infect Dis. 2018;217(3):347–349. doi:10.1093/infdis/jix463
35. Moon SW, Lee EH, Choi JS, et al. Impact of prognostic nutritional index on outcomes in patients with Mycobacterium avium complex pulmonary disease. PLoS One. 2020;15(5):e0232714. doi:10.1371/journal.pone.0232714
36. Saeidi A, Zandi K, Cheok YY, et al. T-Cell exhaustion in chronic infections: reversing the state of exhaustion and reinvigorating optimal protective immune responses. Front Immunol. 2018;9:2569. doi:10.3389/fimmu.2018.02569
37. Furuuchi K, Fujiwara K, Uesgi F, et al. Posttreatment lymphopenia is associated with an increased risk of redeveloping nontuberculous lung disease in patients with Mycobacterium avium complex lung disease. Clin Infect Dis. 2021;73(1):e152–e157. doi:10.1093/cid/ciaa729
38. Torrado E, Robinson RT, Cooper AM. Cellular response to mycobacteria: balancing protection and pathology. Trends Immunol. 2011;32(2):66–72. doi:10.1016/j.it.2010.12.001
39. Martínez González S, Cano Cortés A, Sota Yoldi LA, García García JM, Alba Álvarez LM, Palacios Gutiérrez JJ. Non-tuberculous Mycobacteria. An emerging threat? Archivos de bronconeumologia. 2017;53(10):554–560. doi:10.1016/j.arbr.2017.08.004
40. Liu CF, Song YM, He WC, et al. Nontuberculous mycobacteria in China: incidence and antimicrobial resistance spectrum from a nationwide survey. Infect Dis Poverty. 2021;10(1):59. doi:10.1186/s40249-021-00844-1
41. Morimoto K, Yoshiyama T, Kurashima A, et al. Nutritional indicators are correlated with the radiological severity score in patients with Mycobacterium avium complex pulmonary disease: a cross-sectional study. Internal Med. 2014;53(5):397–401. doi:10.2169/internalmedicine.53.1277
42. Portillo K, Morera J. Nutritional status and eating disorders: neglected risks factor for nontuberculous mycobacterial lung disease? Med Hypotheses. 2012;78(1):39–41. doi:10.1016/j.mehy.2011.09.037
43. Singh B, Saqib M, Gupta A, Kumar P, Bhaskar S. Autophagy induction by Mycobacterium indicus pranii promotes Mycobacterium tuberculosis clearance from RAW 264.7 macrophages. PLoS One. 2017;12(12):e0189606. doi:10.1371/journal.pone.0189606
44. Furuuchi K, Morimoto K, Kurashima A, et al. Treatment duration and disease recurrence following the successful treatment of patients with Mycobacterium avium complex lung disease. Chest. 2020;157(6):1442–1445. doi:10.1016/j.chest.2019.12.016
45. Kim HJ. Nonpharmacological treatment for nontuberculous mycobacterial pulmonary disease. Tuberculosis Respir Dis. 2024;87(4):451–457. doi:10.4046/trd.2024.0033
46. Fifor A, Krukowski K, Honda JR. Sex, ancestry, senescence, and aging (SAnSA) are stark drivers of nontuberculous mycobacterial pulmonary disease. J Clin Tuberculosis Other Mycobacterial Dis. 2022;26:100297. doi:10.1016/j.jctube.2022.100297
47. Wong MMY, Zheng Y, Renouf D, Sheriff Z, Levin A. Trajectories of nutritional parameters before and after prescribed oral nutritional supplements: a longitudinal cohort study of patients with chronic kidney disease not requiring dialysis. Can J Kidney Health Dis. 2022;9:20543581211069008. doi:10.1177/20543581211069008
 © 2026 The Author(s). This work is published and licensed by Dove Medical Press Limited. The
full terms of this license are available at https://www.dovepress.com/terms
and incorporate the Creative Commons Attribution
- Non Commercial (unported, 4.0) License.
By accessing the work you hereby accept the Terms. Non-commercial uses of the work are permitted
without any further permission from Dove Medical Press Limited, provided the work is properly
attributed. For permission for commercial use of this work, please see paragraphs 4.2 and 5 of our Terms.
© 2026 The Author(s). This work is published and licensed by Dove Medical Press Limited. The
full terms of this license are available at https://www.dovepress.com/terms
and incorporate the Creative Commons Attribution
- Non Commercial (unported, 4.0) License.
By accessing the work you hereby accept the Terms. Non-commercial uses of the work are permitted
without any further permission from Dove Medical Press Limited, provided the work is properly
attributed. For permission for commercial use of this work, please see paragraphs 4.2 and 5 of our Terms.