Back to Journals » Cancer Management and Research » Volume 11
ITLN1 identified by comprehensive bioinformatic analysis as a hub candidate biological target in human epithelial ovarian cancer
Authors Liu JH, Li SY, Liang JY, Jiang Y, Wan YC, Zhou SL, Cheng WJ ![]()
Received 4 October 2018
Accepted for publication 24 January 2019
Published 25 March 2019 Volume 2019:11 Pages 2379—2392
DOI https://doi.org/10.2147/CMAR.S189784
Checked for plagiarism Yes
Review by Single anonymous peer review
Peer reviewer comments 3
Editor who approved publication: Dr Kenan Onel
JinHui Liu,1 SiYue Li,1 JunYa Liang,2 Yi Jiang,1 YiCong Wan,1 ShuLin Zhou,1 WenJun Cheng1
1Department of Gynecology, The First Affiliated Hospital of Nanjing Medical University, Nanjing 210029, Jiangsu, China; 2Hypertension Research Center, Affiliated Hospital of Nanjing University of Chinese Medicine, Nanjing 210029, Jiangsu, China
Background: Epithelial ovarian cancer (EOC) is a female malignant tumor. Bioinformatics has been widely utilized to analyze genes related to cancer progression. Targeted therapy for specific biological factors has become more valuable.
Materials and methods: Gene expression profiles of GSE18520 and GSE27651 were downloaded from Gene Expression Omnibus. We used the “limma” package to screen differentially expressed genes (DEGs) between EOC and normal ovarian tissue samples and then used Clusterprofiler to do functional and pathway enrichment analyses. We utilized Search Tool for the Retrieval of Interacting Genes Database to assess protein–protein interaction (PPI) information and the plug-in Molecular Complex Detection to screen hub modules of PPI network in Cytoscape, and then performed functional analysis on the genes in the hub module. Next, we utilized the Weighted Gene Expression Network Analysis package to establish a co-expression network. Validation of the key genes in databases and Gene Expression Profiling Interactive Analysis (GEPIA) were completed. Finally, we used quantitative real-time PCR to validate hub gene expression in clinical tissue samples.
Results: We analyzed the DEGs (96 samples of EOC tissue and 16 samples of normal ovarian tissue) for functional analysis, which showed that upregulated DEGs were strikingly enriched in phosphate ion binding and the downregulated DEGs were significantly enriched in glycosaminoglycan binding. In the PPI network, CDK1 was screened as the most relevant protein. In the co-expression network, one EOC-related module was identified. For survival analysis, database and clinical sample validation of genes in the turquoise module, we found that ITLN1 was positively correlated with EOC prognosis and had lower level in EOC than in normal tissues, which was consistent with the results predicted in GEPIA.
Conclusion: In this study, we exhibited the key genes and pathways involved in EOC and speculated that ITLN1 was a tumor suppressor which could be used as a potential biomarker for treating EOC, Gene Expression Omnibus, prognosis.
Keywords: bioinformatics analysis, epithelial ovarian cancer, PPI, WGCNA, ITLN1
Introduction
Epithelial ovarian cancer (EOC) is a female malignant tumor with a high mortality rate. In recent years, its incidence has been soaring worldwide.1 EOC lacks significant symptoms in the early stage, leading to poor prognosis, so the biggest challenge of curing EOC is early diagnosis.2 Surgical and adjuvant therapies have limited function in improving the prognosis for advanced EOC, and there is growing evidence that targeted therapy for specific biological factors has greater value.3
Gene expression profiling has been widely applied to screen and analyze genes in linkage to various types of cancer progression,4,5 and researchers have used a comprehensive approach to further explore the changes in biological factors in the development of EOC.6 Many genes with similar expression patterns affect each other and even have a regulatory relationship.7 Most studies only focus on the differential expression of genes, but ignore the connection between genes. Weighted Gene Expression Network Analysis (WGCNA) is a systematic biological method which is utilized to describe the pattern of gene association between different samples.7,8 It can be used to identify highly synergistically altered gene sets and to identify candidate biomarker genes or therapeutic targets based on the association of gene sets and associations between gene sets and phenotypes. Recently, WGCNA has been comprehensively used in cancer-related research.9 For instance, Zhou et al10 revealed that TOP2A might be used as a potential biological target for the prognosis and progression of pancreatic ductal adenocarcinoma. Wang et al12 found that the abnormal spindle-like microcephaly gene (ASPM), the human ortholog of the Drosophila melanogaster “abnormal spindle” gene (asp), encodes ASPM, a protein localized at the centrosome of apical neuroprogenitor cells and involved in spindle pole positioning during neurogenesis, and may cause cirrhosis, then further produce hepatocellular carcinoma. In this research, we first screened differentially expressed genes (DEGs) using WGCNA-based systems biology methods, and then constructed a protein–protein interaction (PPI) network and a co-expression network of genes, to discover the essential genes and pathways involved in the carcinogenic mechanism of EOC.13
Materials and methods
Data collection
We downloaded the gene expression profile from the Gene Expression Omnibus (GEO) database (http://www.ncbi.nlm.nih.gov/geo/), Dataset GSE1852014 and GSE2765115 (Table S1) were processed by Affymetrix Human Genome U133 Plus 2.0 Array [transcript (gene) version] (Affymetrix, Santa Clara, CA, USA).16 We used the processed data to filter DEGs, and set up PPI networks and co-expression networks in order to identify hub genes and pathways in this research. Dataset GSE18520 included 10 normal ovarian tissue samples and 53 high-grade primary EOC tissue samples. Dataset GSE27651 included 6 normal ovarian tissue samples and 43 EOC tissue samples including 8 microdissected serous borderline ovarian tumor tissue samples, 13 low-grade serous ovarian carcinomas tissue samples and 22 high-grade serous ovarian carcinomas tissue samples. The genomic data and clinical data of EOC from The Cancer Genome Atlas (TCGA; https://cancergenome.nih.gov/) were also downloaded. These RNA sequencing data from Illumina HiSeq RNASeq platform included 379 tumor sample specimens from patients with EOC. There were no normal ovarian tissue samples in the TCGA database.
Research design and data preprocessing
The research was designed according to the flowchart (Figure 1). These two datasets were chosen for integrated analysis because they have the same platform and are crucial for combining data from different datasets. The raw data for these two datasets were integrated for the analysis, including RMA background correction,17 log2 transformation, quantile normalization and median polish algorithm summarization by the “affy” R language package.18 The microarray data probe was transformed to gene symbols with Bioconductor Annotation Data software packages. If several probes were mapped to one gene symbol, the mean value was set as the final expression value of this gene. The combat function in the sva package was applied to remove the batch effects of these two datasets19 (Table S2). Microarray quality was evaluated by sample clustering in light of the distance between different samples in Pearson’ s correlation matrices.20 GSM461376 were removed from subsequent analysis in the test dataset. (Figure S1).
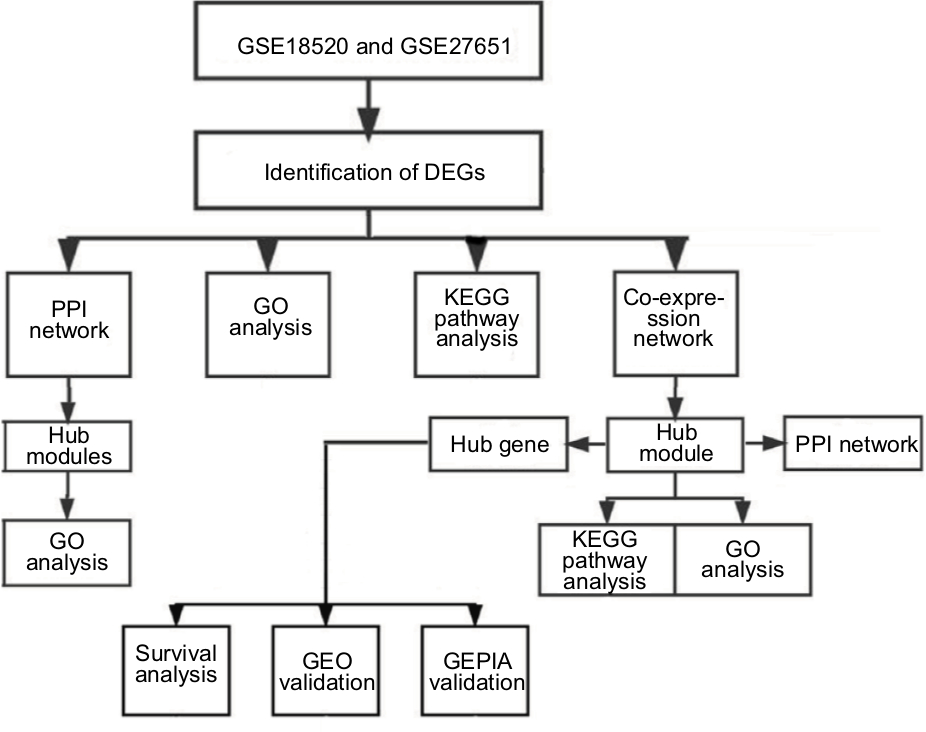 | Figure 1 Study design and data preprocessing. Note: Flow diagram of study. Abbreviations: DEGs, differentially expressed genes; EOC, epithelial ovarian cancer; GEO, Gene Expression Omnibus; GEPIA, Gene Expression Profiling Interactive Analysis; GO, gene ontology; KEGG, Kyoto Encyclopedia of Genes and Genomes; PPI, protein–protein interaction. |
Differentially expressed genes
We utilized the “limma” R language package21 to screen the DEGs between EOC samples and normal ovarian samples. The adjusted P<0.05 and |log2fold change (FC)|>1 were chosen as the cutoff criteria. Adjusted P-value (adj. P) was applied to help correct false-positives. Drawing of heatmap was performed through the “heatmap” package in R 3.4.422
Gene ontology (GO) term and Kyoto Encyclopedia of Genes and Genomes (KEGG) pathway enrichment analysis
The KEGG is a reference knowledge base involving systems information, genomic information and chemical information. GO is a framework for the model of biology, which describes gene functions and classifies. To further explore the biological significance of DEGs, we used a package called Clusterprofiler23 with the ability to analyze and visualize data to perform enrichment analysis of functions and pathways.23 P-value <0.05 was considered a significant enrichment.
Comprehensive analysis of PPI network and functional analysis
We used Search Tool for the Retrieval of Interacting Genes Database (STRING) (http://www.string-db.org/) to assess PPI information.24 In addition, in order to explore the relationship between DEGs, we used the STRING database for analysis, and visually converted the results using Cytoscape software. The “Experiments” and “Databases” sources have been used for building the network, and we have set the threshold for interaction score at 0.95, which indicated the highest confidence of two protein interaction occurrences. The Cytoscape Molecular Complex Detection (MCODE) plug-in was used for searching clustered sub-networks.25 The default parameters were as follows: degree cutoff =5, node score cutoff =0.2, k-core =2, and max. depth =100. Next we used the Clusterprofiler to perform functional analysis of the genes in the hub module.
Co-expression network creation and module functional analysis
The first step was to test the expression data profile of the DEGs to see if they were suitable samples and genes. Next, we used the WGCNA11 package in the R language to create the co-expression network for DEGs.26,27 The Pearson’ s correlation matrices were both functioned for all pair-wise genes. After that, a power function amn = |cmn|β (cmn = Pearson’ s correlation between gene m and gene n; amn = adjacency between gene m and gene n) was utilized to erect a weighted adjacency matrix. We used a soft-thresholding parameter β=15 (scale free R2=0.84) to emphasize strong correlations between genes and penalize weak correlations. Then, we converted the adjacency to topological overlap matrix (TOM) to measure network connectivity of a gene which was defined as the sum of its adjacency with all other genes for network generation. We created average linkage hierarchical clustering due to the TOM-based dissimilarity measure with a minimum size (gene group) of 20 for the gene dendrogram, thereby classifying genes with similar expression profiles into the same gene module. Eigengenes were the principal components of microarray gene expression data, which represented the oscillatory characteristics of gene expression patterns.28 We calculated the dissimilarity of module eigengenes, selected a cut line for module dendrogram, and merged some modules. In order to find relevant modules that have an impact on EOC, we further conducted functional enrichment analysis on these gene modules.
Validation of hub genes
The key genes were identified as the intersecting genes of the turquoise module in WGCNA and DEGs. Survival analysis was performed using a standard Kaplan–Meier univariate curve through the “survival” package in R 3.4.4. P-value <0.05 was considered as having statistical significance. The hub gene was finally validated in GEPIA (Gene Expression Profiling Interactive Analysis).29 GEPIA is a web-based tool to deliver fast and customizable functionalities based on TCGA and Genotype-Tissue Expression databases data.
Preparation for human EOC samples
During the course of the study, we received informed consent for tissue sample analysis for each patient and were approved by the Institutional Review Board of Nanjing Medical University. Once the tissue of the EOC patient was removed, it was immediately stored at –80°C until use. From June 2017 to January 2018, the Department of Gynecology and Obstetrics, the First Affiliated Hospital of Nanjing Medical University, removed tissue samples from patients with informed consent, including 17 EOC tissues and 10 normal ovarian tissues.
Quantitative real-time RT-PCR (qRT-PCR) analysis
We extracted total RNA from tissue samples using TRizol reagent (Thermo Fisher Scientific, Waltham, MA, USA). We used the Agilent Bioanalyzer 2,100 with RNA 6000 Nano kit (Agilent Technologies, Santa Clara, CA, USA) to assess the integrity of the isolated RNA. We used the high-capacity cDNA reverse transcription kits (Thermo Fisher Scientific) to react RNA, synthesize single-stranded cDNA from RNA, and then perform real-time quantification using the SYBR Green PCR kit (Thermo Fisher Scientific). The cycle threshold (Ct) of each gene was recorded. The relative expression of ITLN1 was calculated using the 2−ΔΔCt method (ΔCt = Cttarget gene – Ctinternal control). The forward primer of ITLN1 is ACGTGCCCAATAAGTCCCC. The reverse primer of ITLN1 is CCGTTGTCAGTCCAACACTTTC. All procedures for qRT-PCR are performed according to the manufacturer’s protocol.
Statistical analyses
All analyses were conducted three times and represent data from three separate experiments. Two-tailed Student’s t-test was utilized for significance of differences between subgroups. Statistical analysis processed via SPSS 16.0 (SPSS Inc., Chicago, IL, USA) and R software 3.4.4 (https://www.r-project.org/). Graphs were generated using Graph-Pad Prism 6.0 (GraphPad Software, Inc., La Jolla, CA, USA). Statistical significance was set at probability values of P<0.05.
Results
Identification of DEGs in EOC and the enrichment of these genes
After preprocessing and removing batch effects, we analyzed the DEGs of GSE18520 and GSE27651 using the limma package, using adjusted P<0.05 and |logFC| >1 as the cutoff criterion. We screened 1,700 DEGs, including 943 upregulated genes and 757 downregulated genes in EOC samples compared to normal ovarian samples (Figure 2A). We identified the top 100 DEGs according to |logFC| >1 and then displayed on a heatmap (Figure 2B, Table S3). The Clusterprofiler package was applied to compare gene clusters according to their enriched biological processes, with a cutoff criterion of P<0.05 on the 1,700 DEGs (Table S4). In GO analysis, the upregulated genes were mostly enriched in phosphate ion binding (Figure 2C), and the downregulated genes were highly enriched in glycosaminoglycan binding, heparin binding and sulfur compound binding (Figure 2D). The KEGG is a reference knowledge base involving systems information, genomic information and chemical information. Using the Clusterprofiler package30 (http://bioconductor.org/packages/release/bioc/html/clusterProfiler.html), KEGG pathway enrichment analyses were conducted separately for the DEGs. The upregulated genes were mostly enriched in oxidative phosphorylation and cell cycle (Figure 2E). The downregulated genes were mostly enriched in complement and coagulation cascades, proteoglycans in cancer, histidine metabolism, Staphylococcus aureus infection, and tyrosine metabolism (Figure 2F). The above enrichment analysis results can help us further study the role of DEGs in EOC.
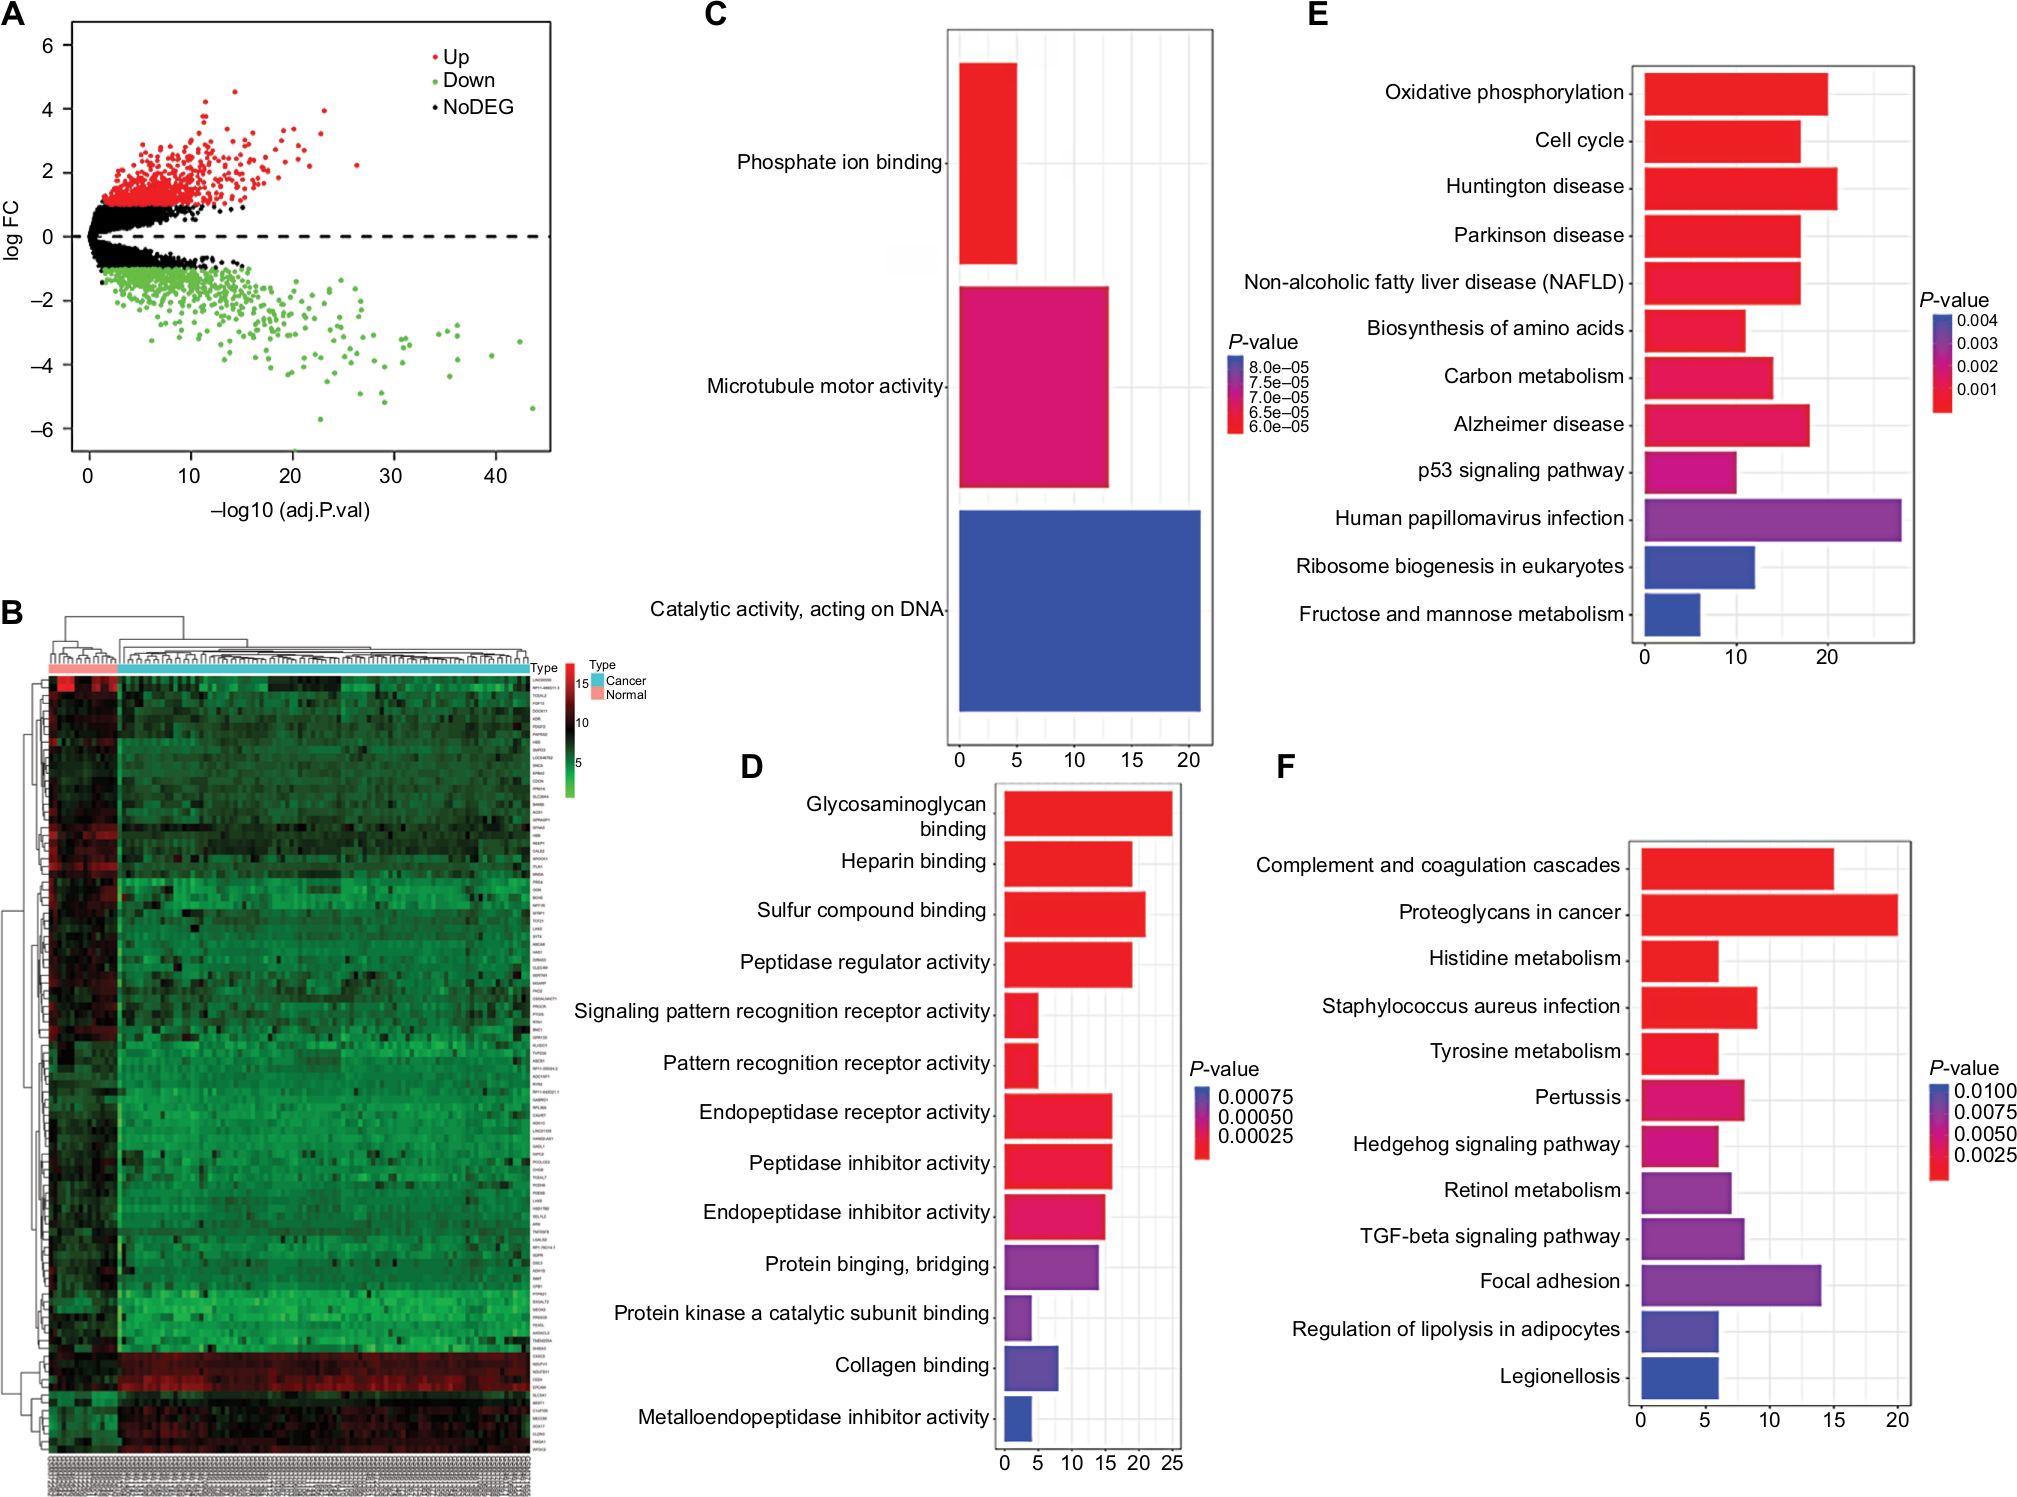 | Figure 2 Identification of DEGs in EOC and the enrichment of these genes. Notes: (A) The volcano plot of all DEGs. (B) Heatmap of the top 100 DEGs according to the value of |logFC|. Drawing of heatmap was performed through the “heatmap” package in R 3.4.4. (C) In GO analysis of DEGs, upregulated DEGs with fold change >1. (D) In GO analysis of DEGs, downregulated DEGs with fold change >1. (E) In KEGG analysis of DEGs, upregulated DEGs with fold change >1. (F) In KEGG analysis of DEGs, downregulated DEGs with fold change >1. Abbreviations: adj.P.val, adjusted P-value; DEGs, differentially expressed genes; FC, fold change; GO, gene ontology; KEGG, Kyoto Encyclopedia of Genes and Genomes; NoDEG, non-DEG. |
PPI network and cluster analysis
Via the STRING website, 1700 DEGs were screened into the DEGs PPI network complex, which contained 1467 nodes and 185 edges (Figure 3A). With PPI analysis using STRING software, 10 prominent proteins were identified. In these identified proteins, CDK1 was considered to be the most important protein and contacted 11 nodes (Fig. 3B).
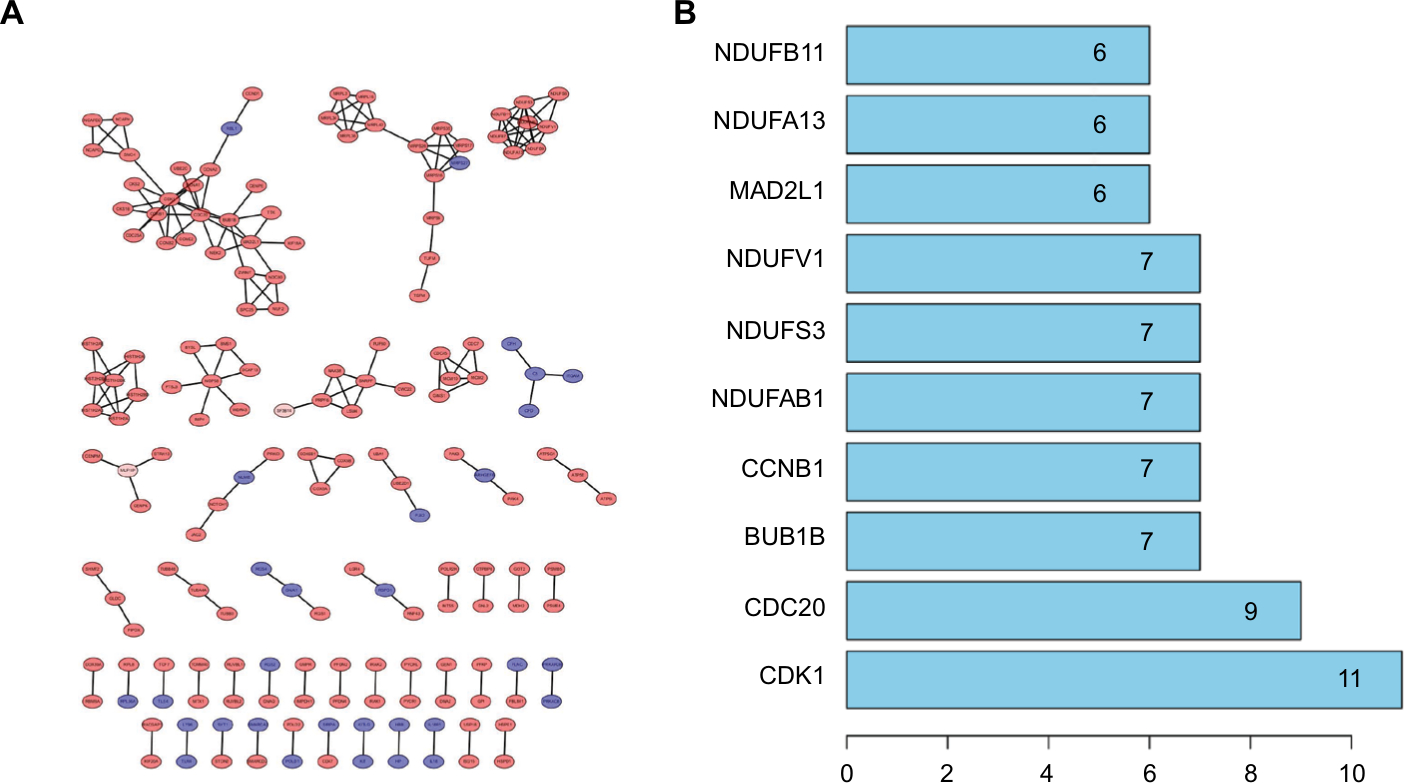 | Figure 3 Cluster analysis of the PPI network. Notes: (A) 1,700 DEGs were filtered into the DEGs PPI network complex that contained 1,467 nodes and 185 edges. (B) Histogram of key proteins. The y-axis represents the name of genes, the x-axis represents the number of adjacent genes, and height is the number of gene connections. Abbreviations: DEGs, differentially expressed genes; PPI, protein–protein interaction. |
After that, we applied the MCODE, a plug-in using scoring and finding parameters that have been optimized to produce the best results for the network, to find clusters in the network. Seven clusters were calculated according to k-core =2. Among them, cluster 1 contained 7 nodes and 21 edges and had the highest score in these clusters (Figure 4A). This result may suggest that the above 7 DEGs play a critical role in EOC. Cluster 2, contained 5 nodes and 10 edges and got the second highest score in these clusters (Figure 4B). The genes in cluster 2 may also be associated with EOC.
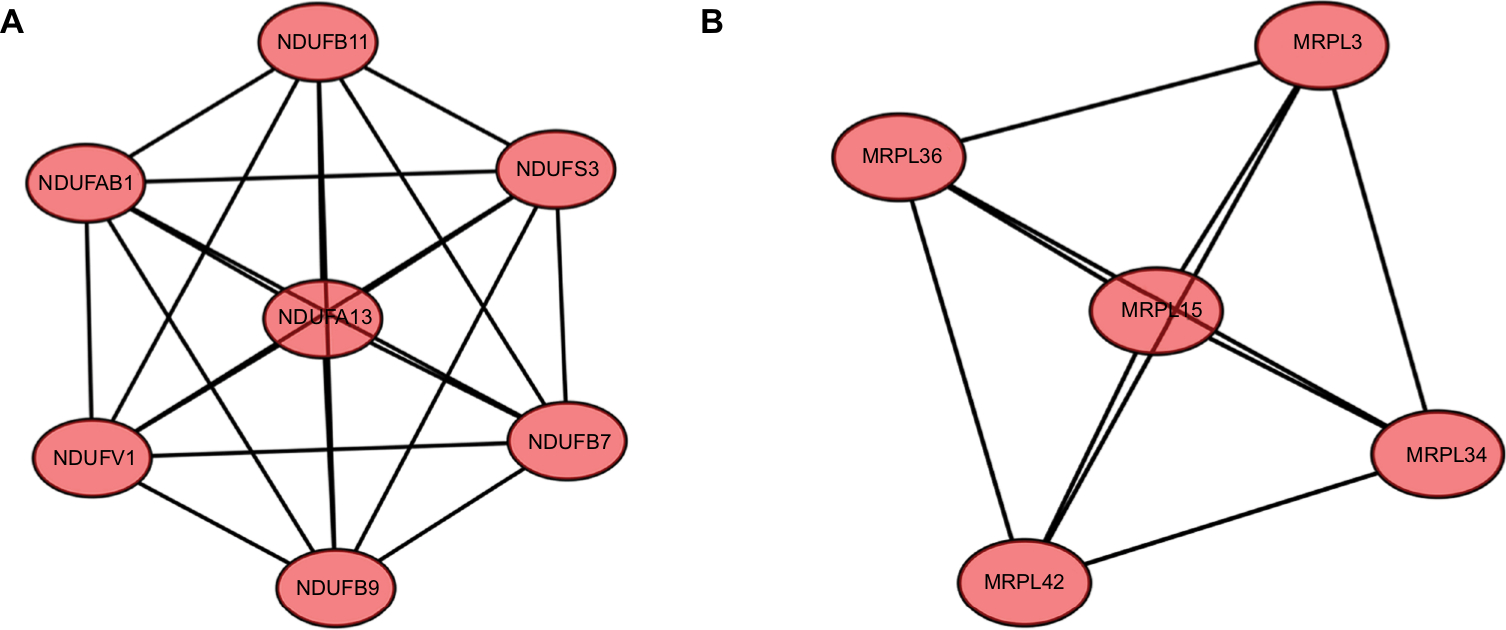 | Figure 4 Module analysis of PPI network. Notes: (A) Module rank 1. This cluster contained 7 nodes and 21 edges and has the highest score in those clusters. (B) Module rank 2. This cluster contained 5 nodes and 10 edges and had the second highest score in those clusters. Abbreviation: PPI, protein–protein interaction. |
Plug-in MCODE was used for the top two significant modules of the PPI network. Because the number of genes in cluster 2 was too small, we only performed functional analysis on the genes in cluster 1. GO and KEGG analysis of module 1 were performed by Clusterprofiler (Figure 5A and B).
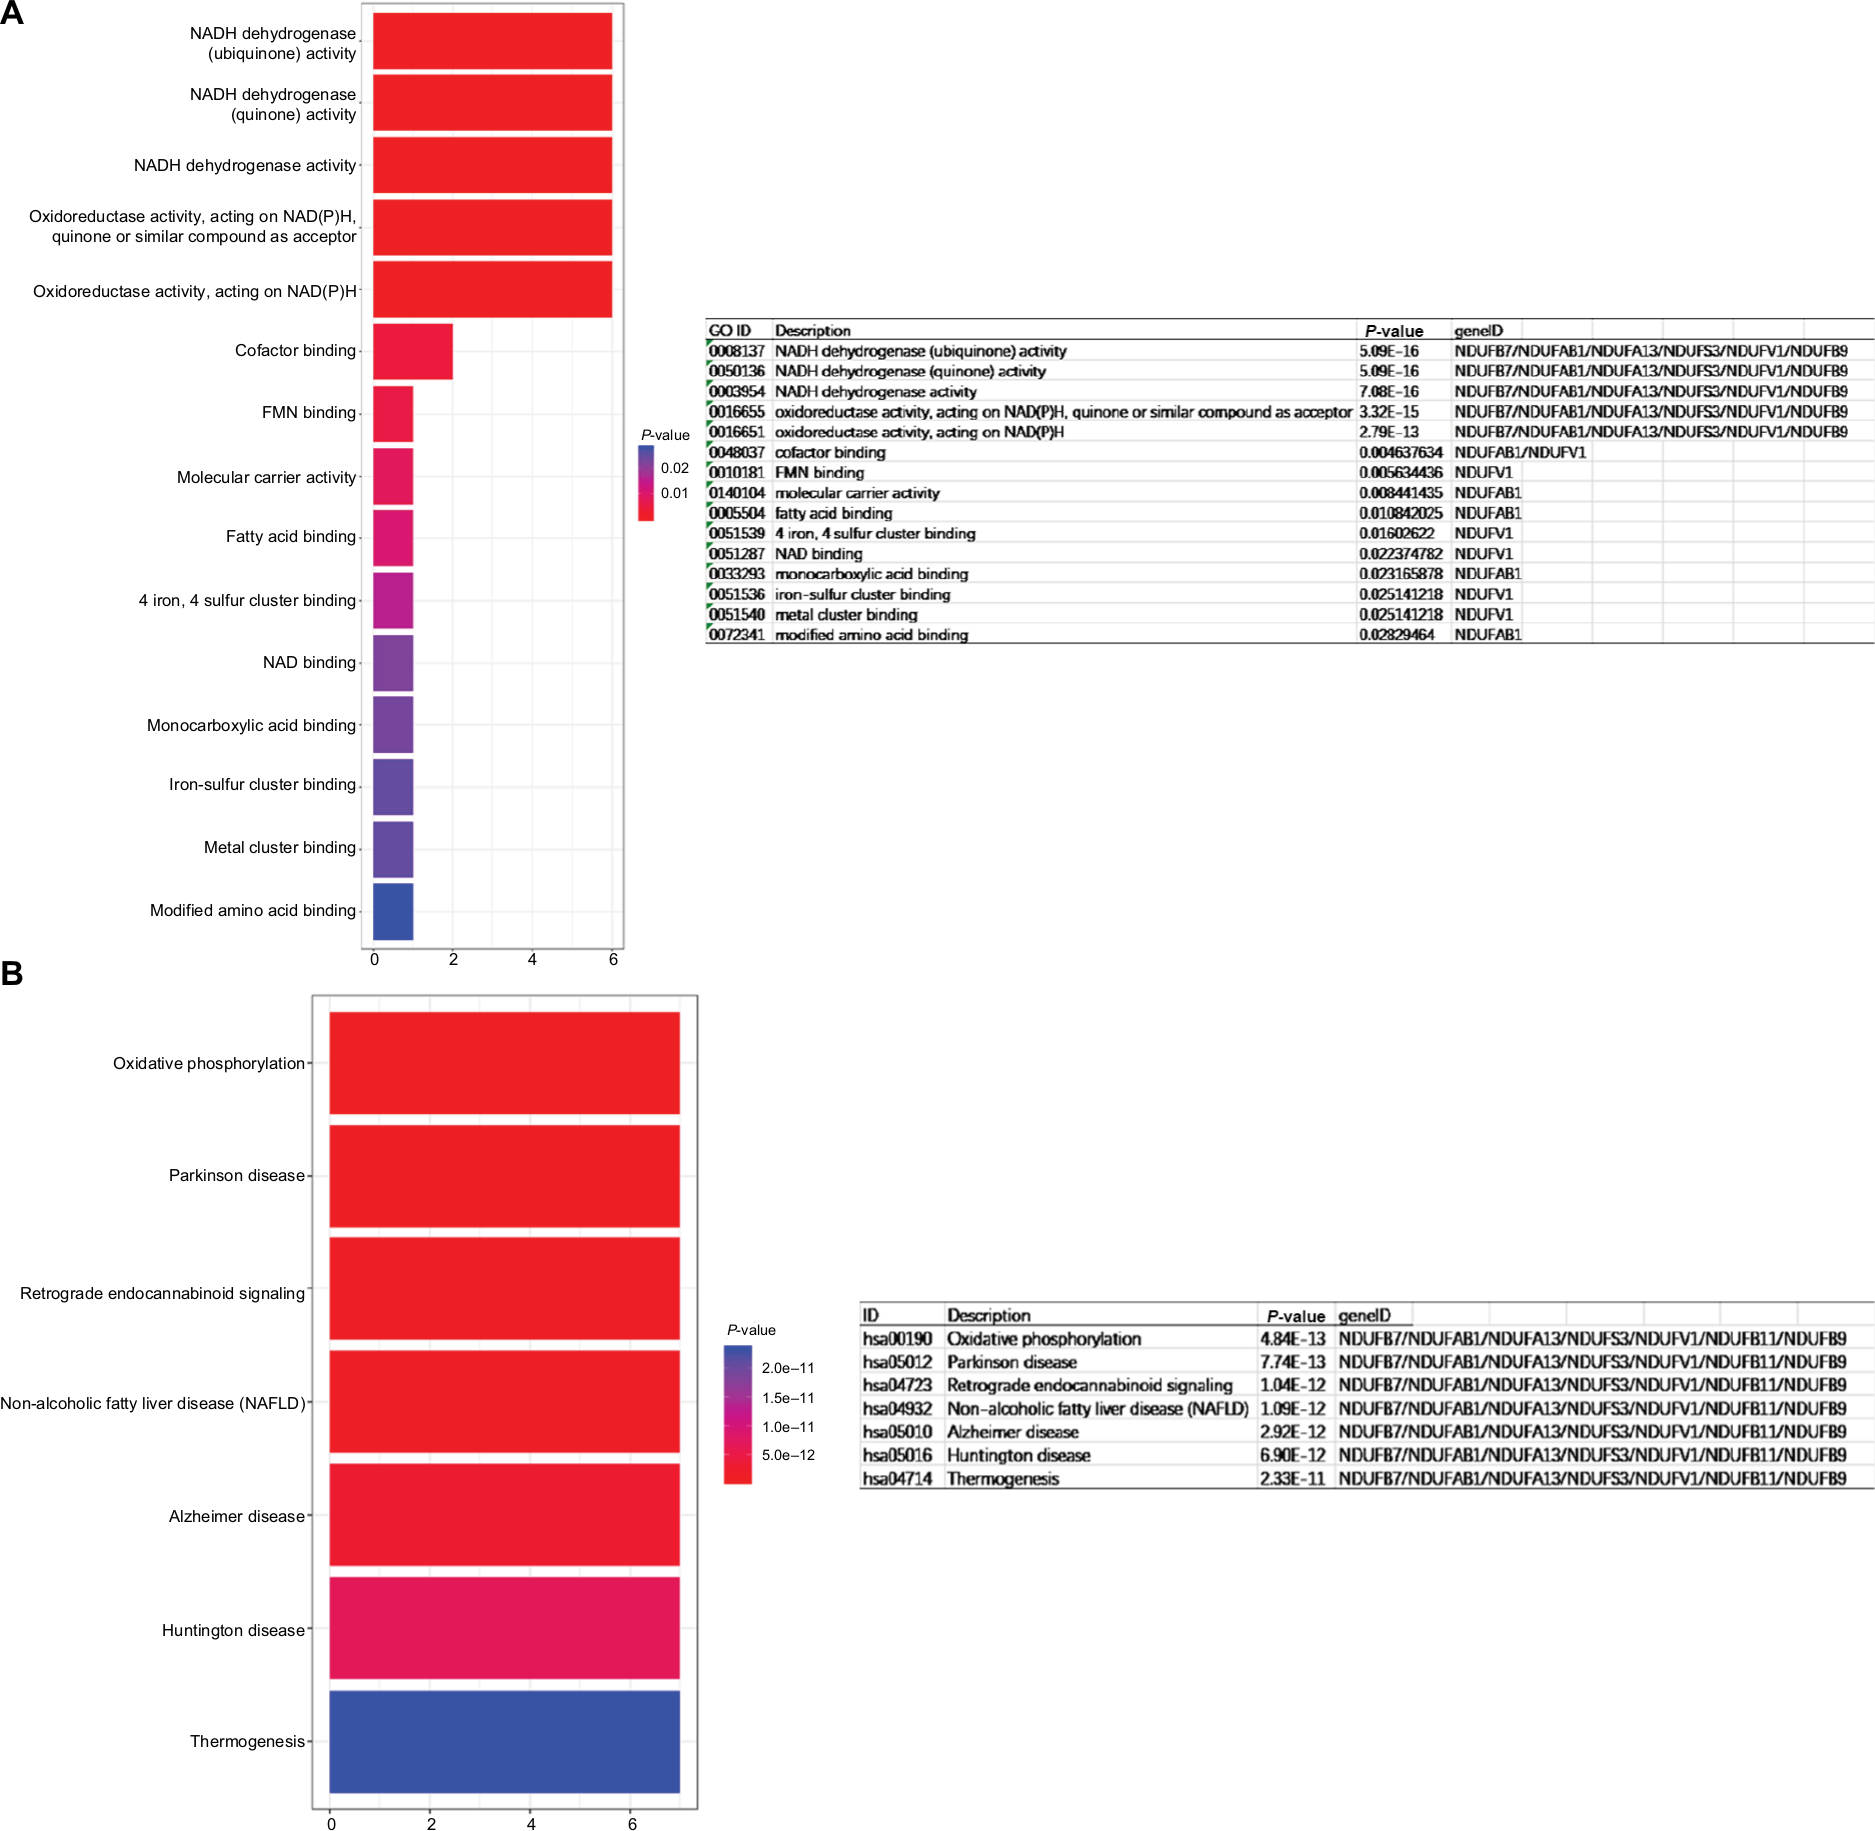 | Figure 5 Determination of soft-thresholding power in WGCNA. Notes: (A) GO enrichment analysis of module rank 1, (B) KEGG analysis of module rank 1. Abbreviations: GO, gene ontology; KEGG, Kyoto Encyclopedia of Genes and Genomes; WGCNA, Weighted Gene Expression Network Analysis. |
Weighted co-expression network construction and analysis
As a result, the expression values of the 1,700 genes exhibiting a 1-fold change in the 112 tissues samples were used to construct co-expression modules using the WGCNA algorithms. Hierarchical clustering analysis was performed with the flashClust function and the results are presented in Figure S1B. We found one obvious outlier (GSM461376) which was removed from the cohort. The remaining 111 samples were divided into two clusters including normal ovarian tissue samples and EOC tissue samples. GSM462643, GSM462644, GSM462645, GSM462646, GSM462647, GSM462648, GSM462649, GSM462650, GSM462651, GSM462652, GSM372258, GSM372259, GSM372260, GSM372261, GSM372262, and GSM372263 are normal ovarian tissue samples, the rest were EOC tissue samples (Figure 6A). We evaluated the quality for the expression data matrix of GSE18520 and GSE27651, and then used the WGCNA package in the R language to ensure a scalefree network (Figure S2). After removing the batch effect, we preprocessed the data and then further analyzed the modules with highly related genes, ten modules were excavated (Figure 6B). We set the MEDissThres as 0.25 to merge similar modules (Figure 6C), and 7 modules were generated. The gray module was a collection of genes that did not belong to any of the functional modules and therefore did not require analysis. Module black contained 161 genes, module blue contained 341 genes, module brown contained 254 genes, module magenta contained 29 genes, and module yellow contained 118 genes. Moreover, an intramodular analysis of GS and MM of the genes in the ten modules was followed. As GS and MM illustrated a very meaningful correlation, this finding indicated that among the top 6 modules, the 325 genes in the turquoise module tend to be remarkably correlated with tumor (Figure 6D). Defined by module connectivity, measured by absolute value of the Pearson’s correlation (cor.geneModuleMembership >0.85) and cancer trait relationship, measured by absolute value of the Pearson’s correlation (cor.geneTraitSignificance >0.2). In the end, 40 hub genes belong to the turquoise module were selected for further research (Figure 7A). Among the modules, module turquoise has the highest negative correlation with cancer traits, and all genes were identified for the heatmap (Figure 7B). The number of genes in each module is shown in Figure S3.
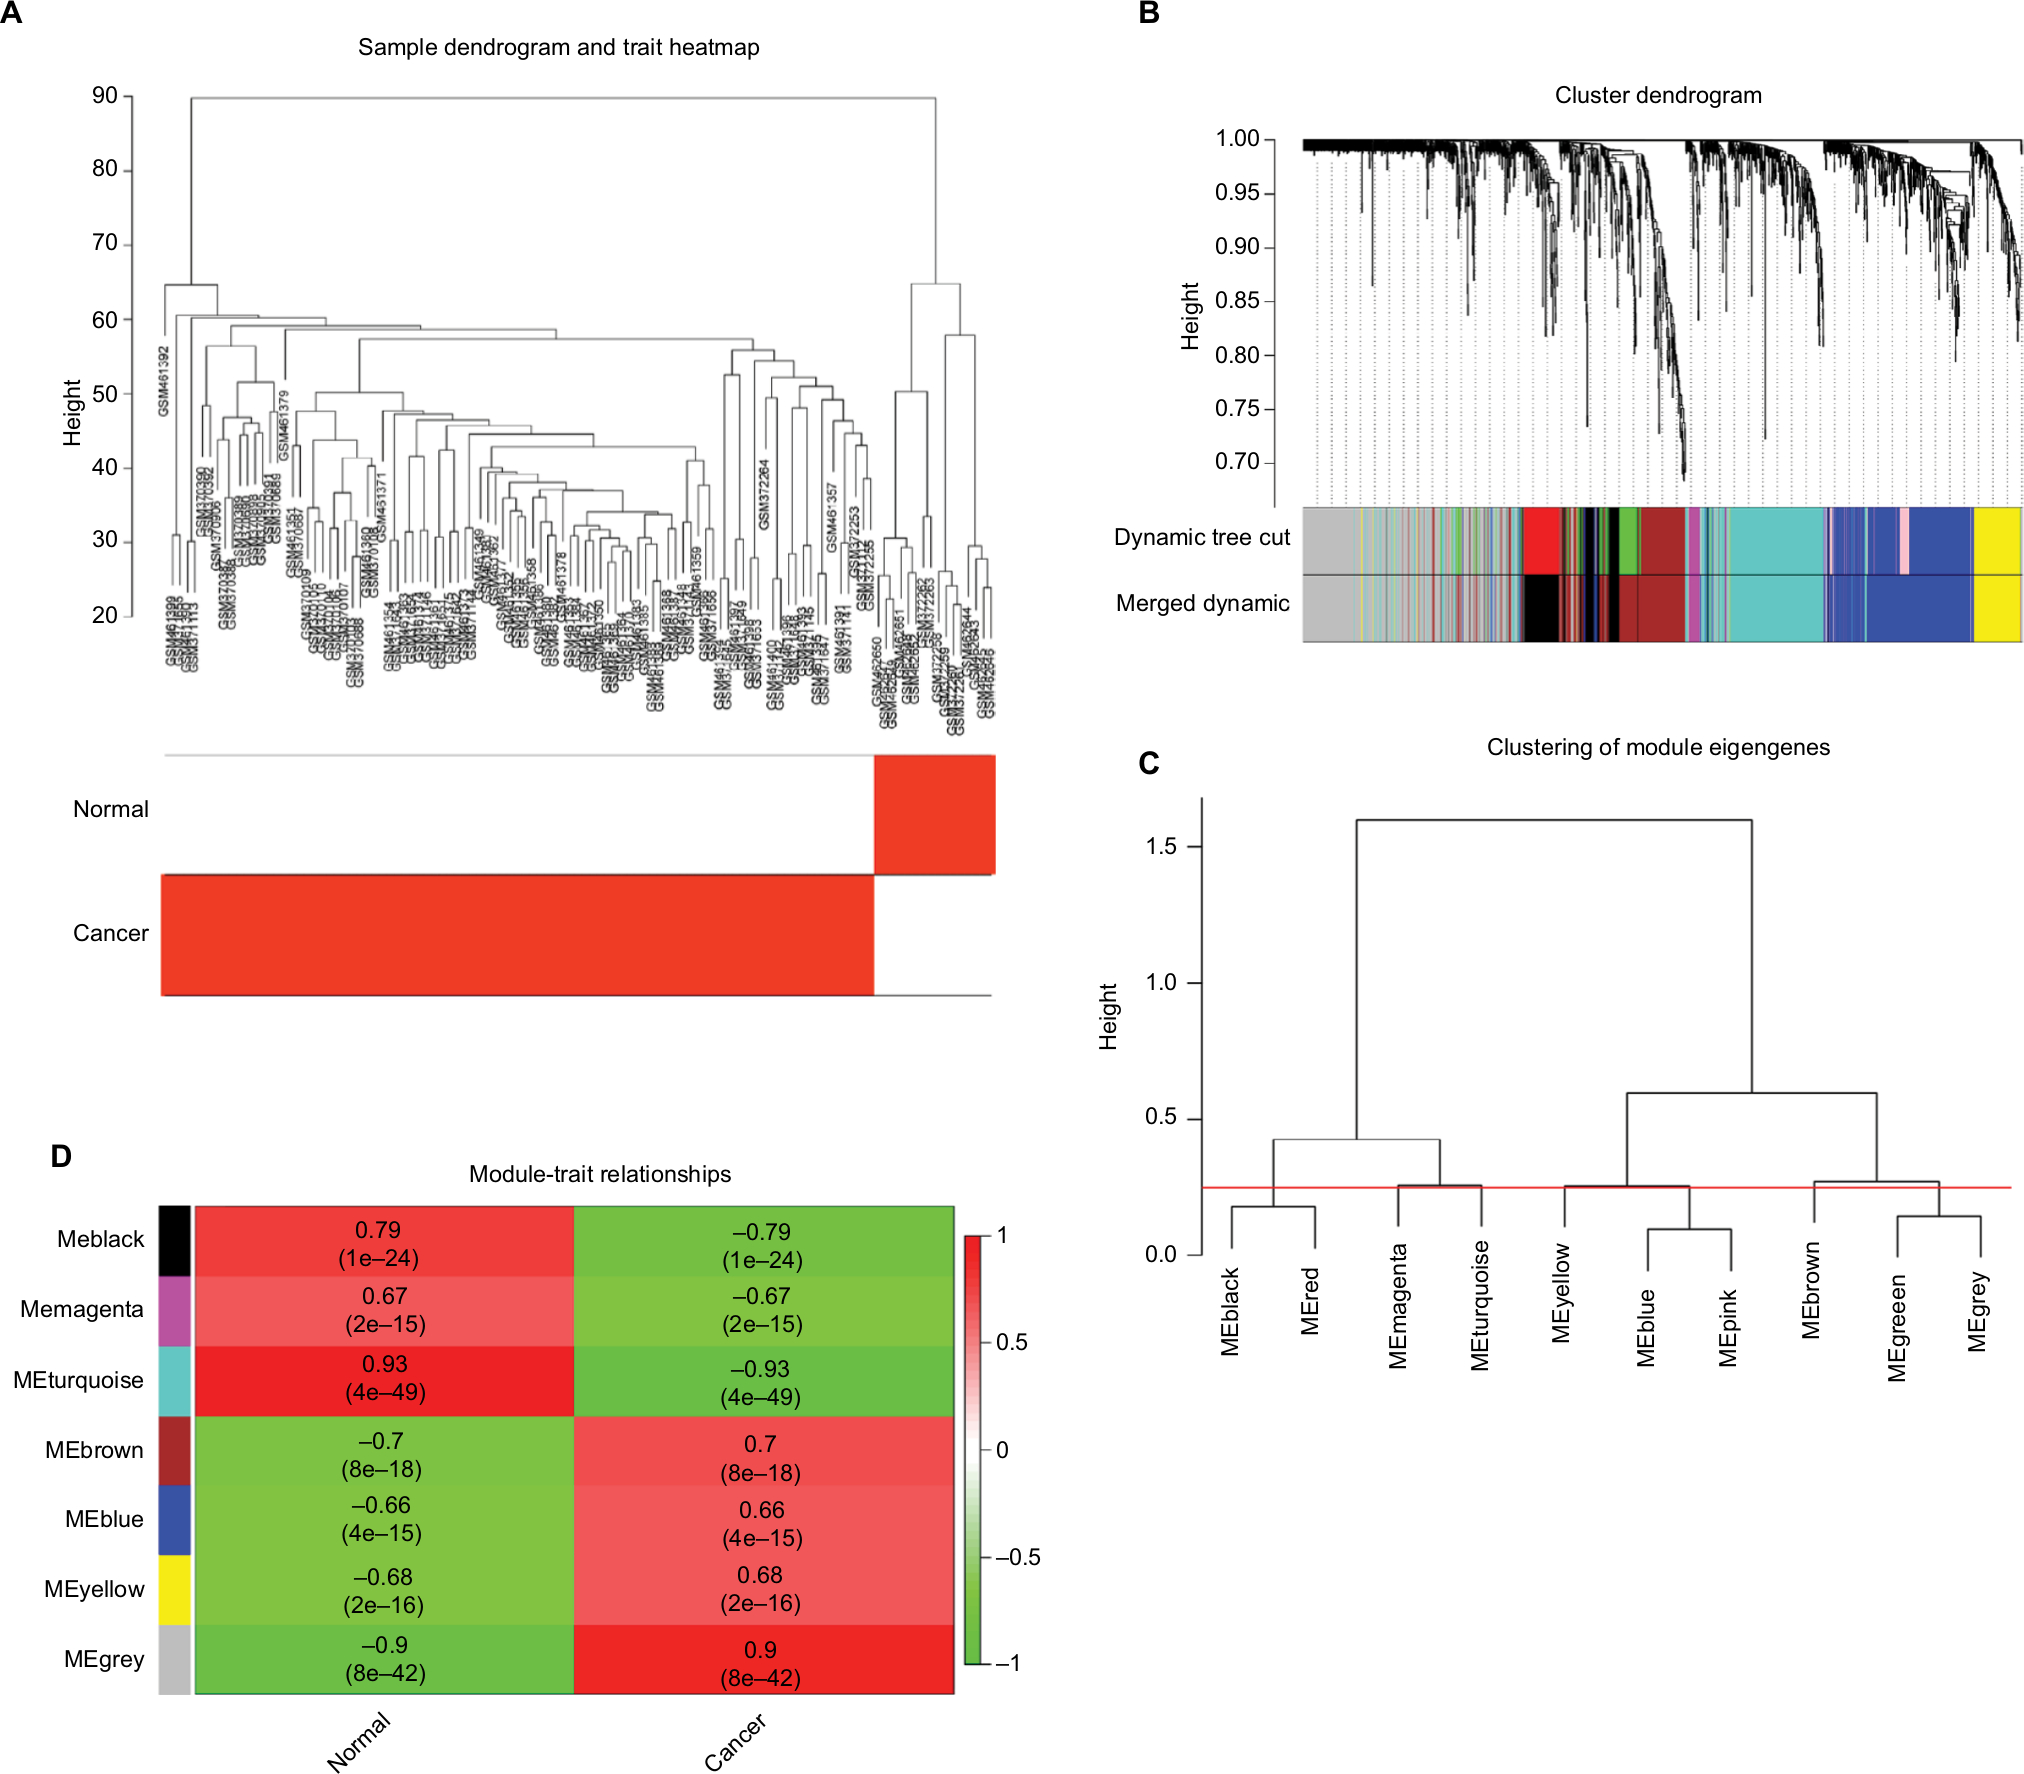 | Figure 6 Hub module selection. Notes: (A) Samples clustering of GSE18520 and GSE27651. The clustering was based on the expression data of differentially expressed genes between tumor samples and normal samples in EOC. The color intensity was proportional to tumor samples and normal samples. (B) Dendrogram of all differentially expressed genes clustered based on a dissimilarity measure (1-TOM). (C) Dendrogram of consensus module eigengenes obtained by WGCNA on the consensus correlation. The red line was the merging threshold, and groups of eigengenes below the threshold represent modules whose expressions profiles should be merged due to their similarity. (D) Correlation between modules and traits. The upper number in each cell referred to the correlation coefficient of each module in the trait, and the lower number was the corresponding P-value. Among them, the turquoise module was the most relevant module with cancer traits. Abbreviation: TOM, topological overlap matrix. |
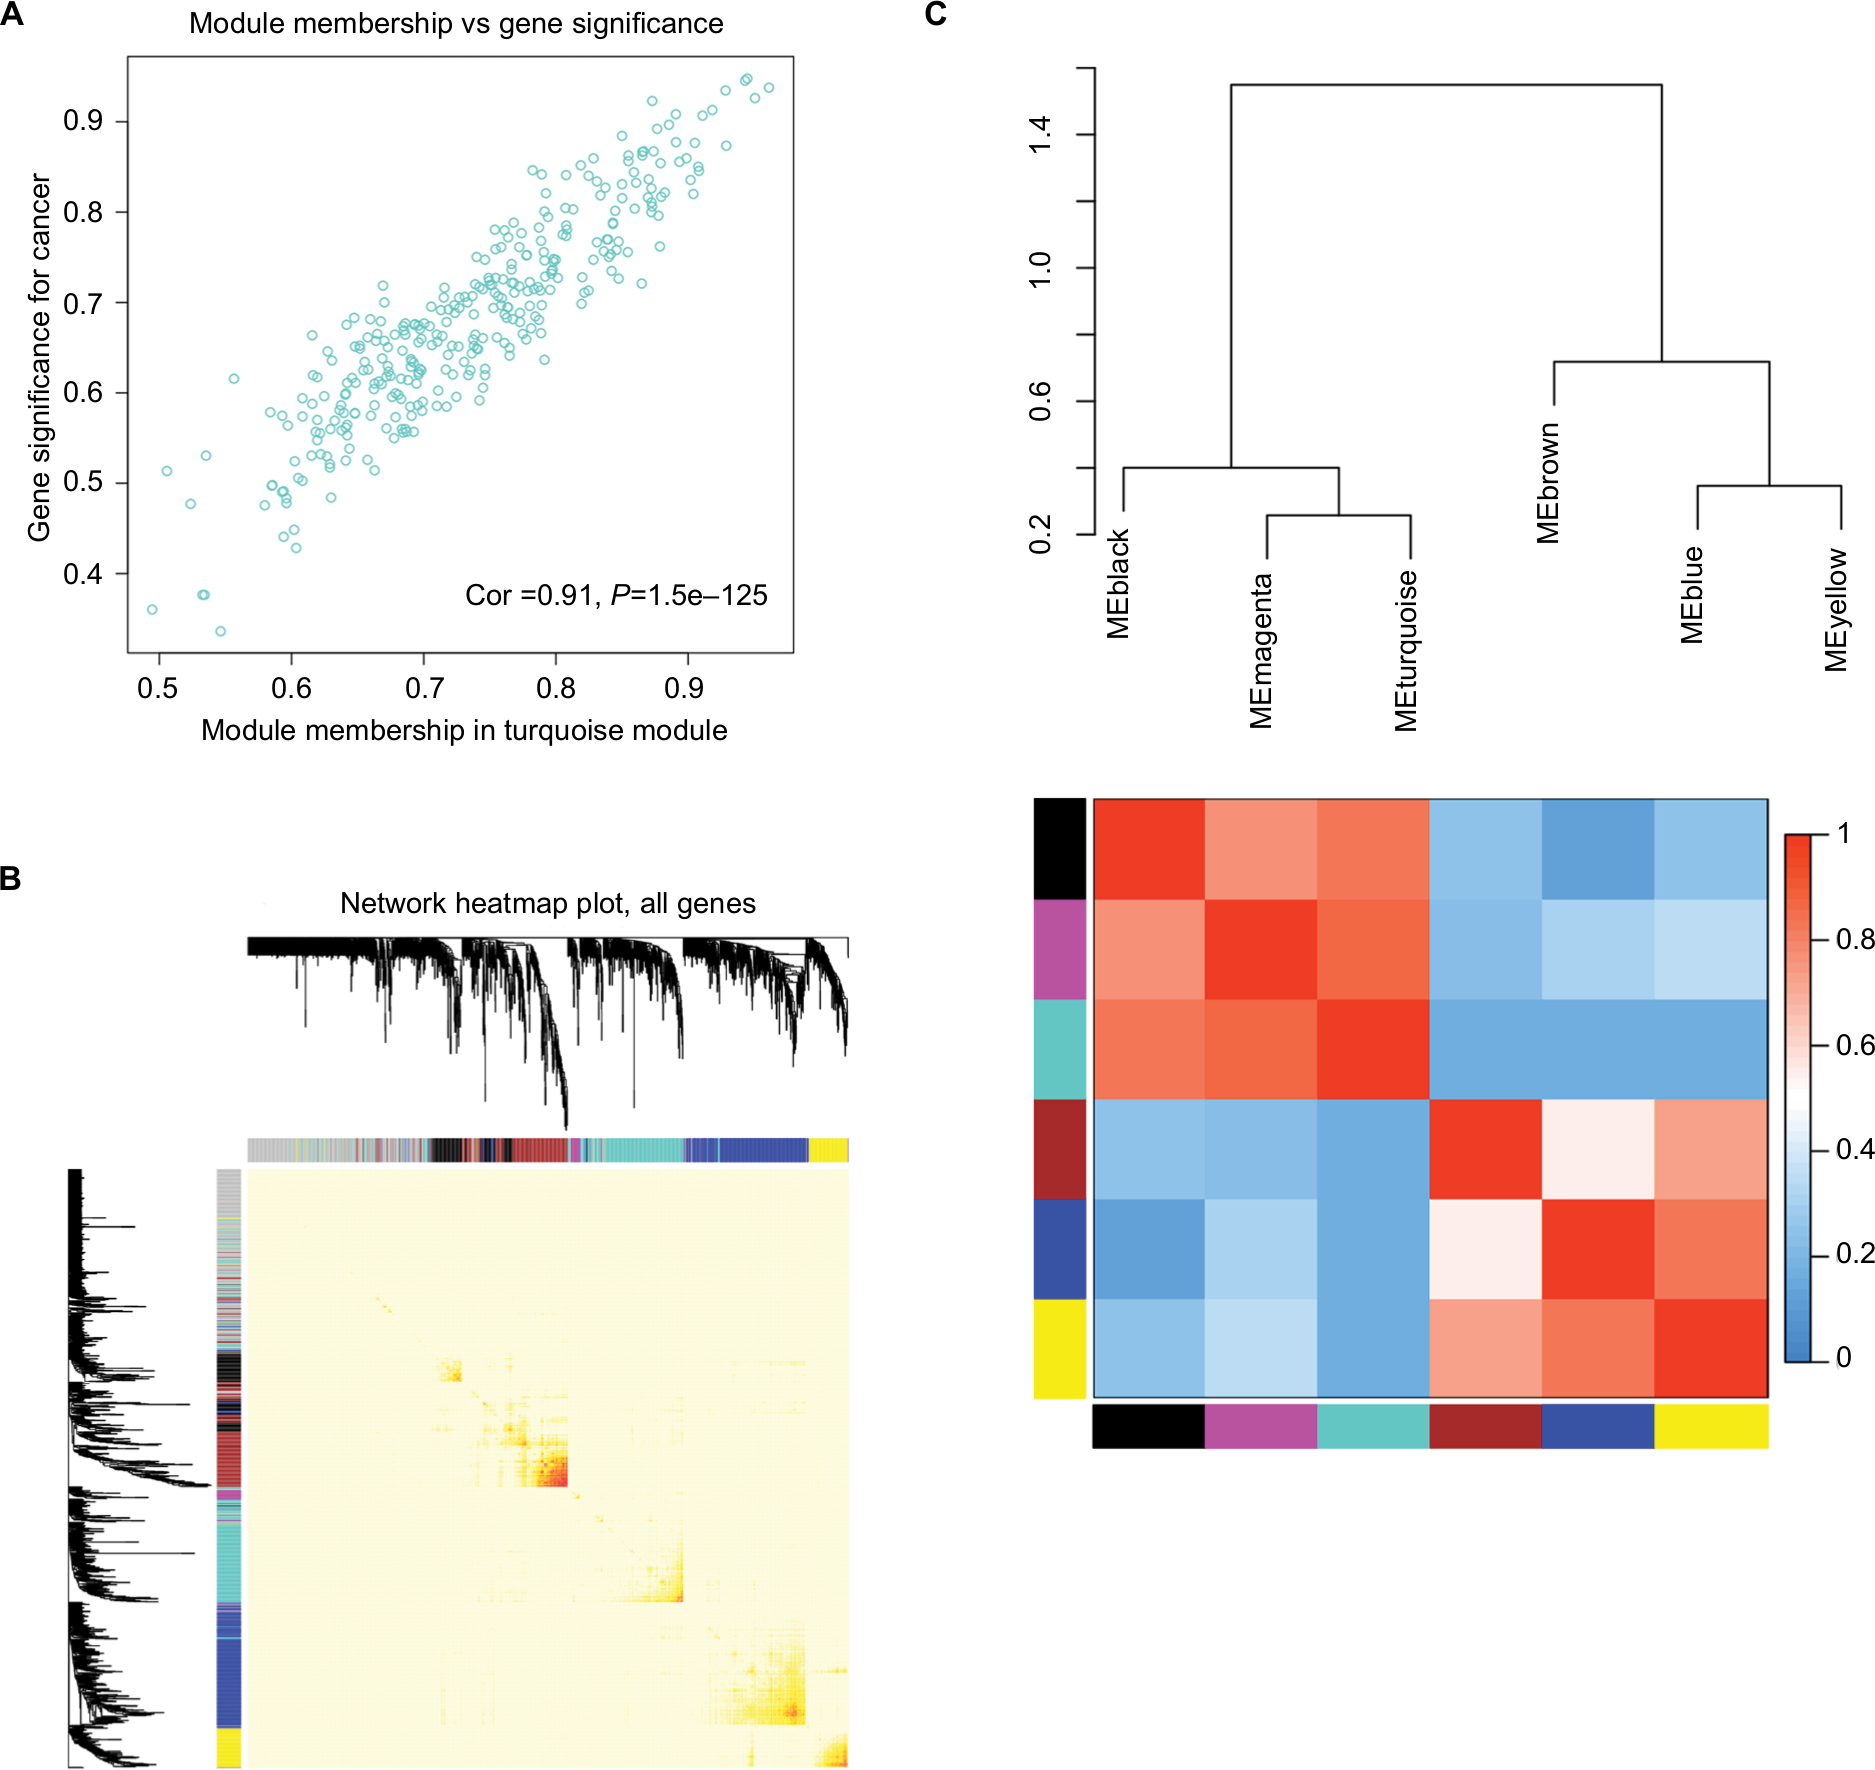 | Figure 7 Select hub genes in hub modules. Notes: (A) A scatter plot of GS for epithelial ovarian cancer vs the MM in the turquoise module. Intramodular analysis of the genes found in the turquoise module, which contained genes that had a high correlation with epithelial ovarian cancer, with P<1.5e–125 and correlation =0.91. (B) A heatmap of all genes. The intensity of the red color indicated the strength of the correlation between pairs of modules on a linear scale. (C) Dendrogram of merged module eigengenes obtained by WGCNA. Heatmap plot of the adjacencies of modules. Red represented high adjacency (positive correlation) and blue represented low adjacency (negative correlation). Abbreviations: GS, gene significance; MM, module membership; WGCNA, Weighted Gene Expression Network Analysis. |
Interestingly, some of these gene modules had similar expression profiles. To find out the connections and interactions among these top six co-expressed modules, we analyzed the connectivity of eigengenes. A cluster analysis was completed. In general, six clusters were classified into two clusters, and each contained three branches (Figure 7C). The top 3 relevant modules including the turquoise, brown and black modules were visualized by STRING database and Cytoscape with a combined score >0.4, which was considered to be meaningful (Figure 8A-C).
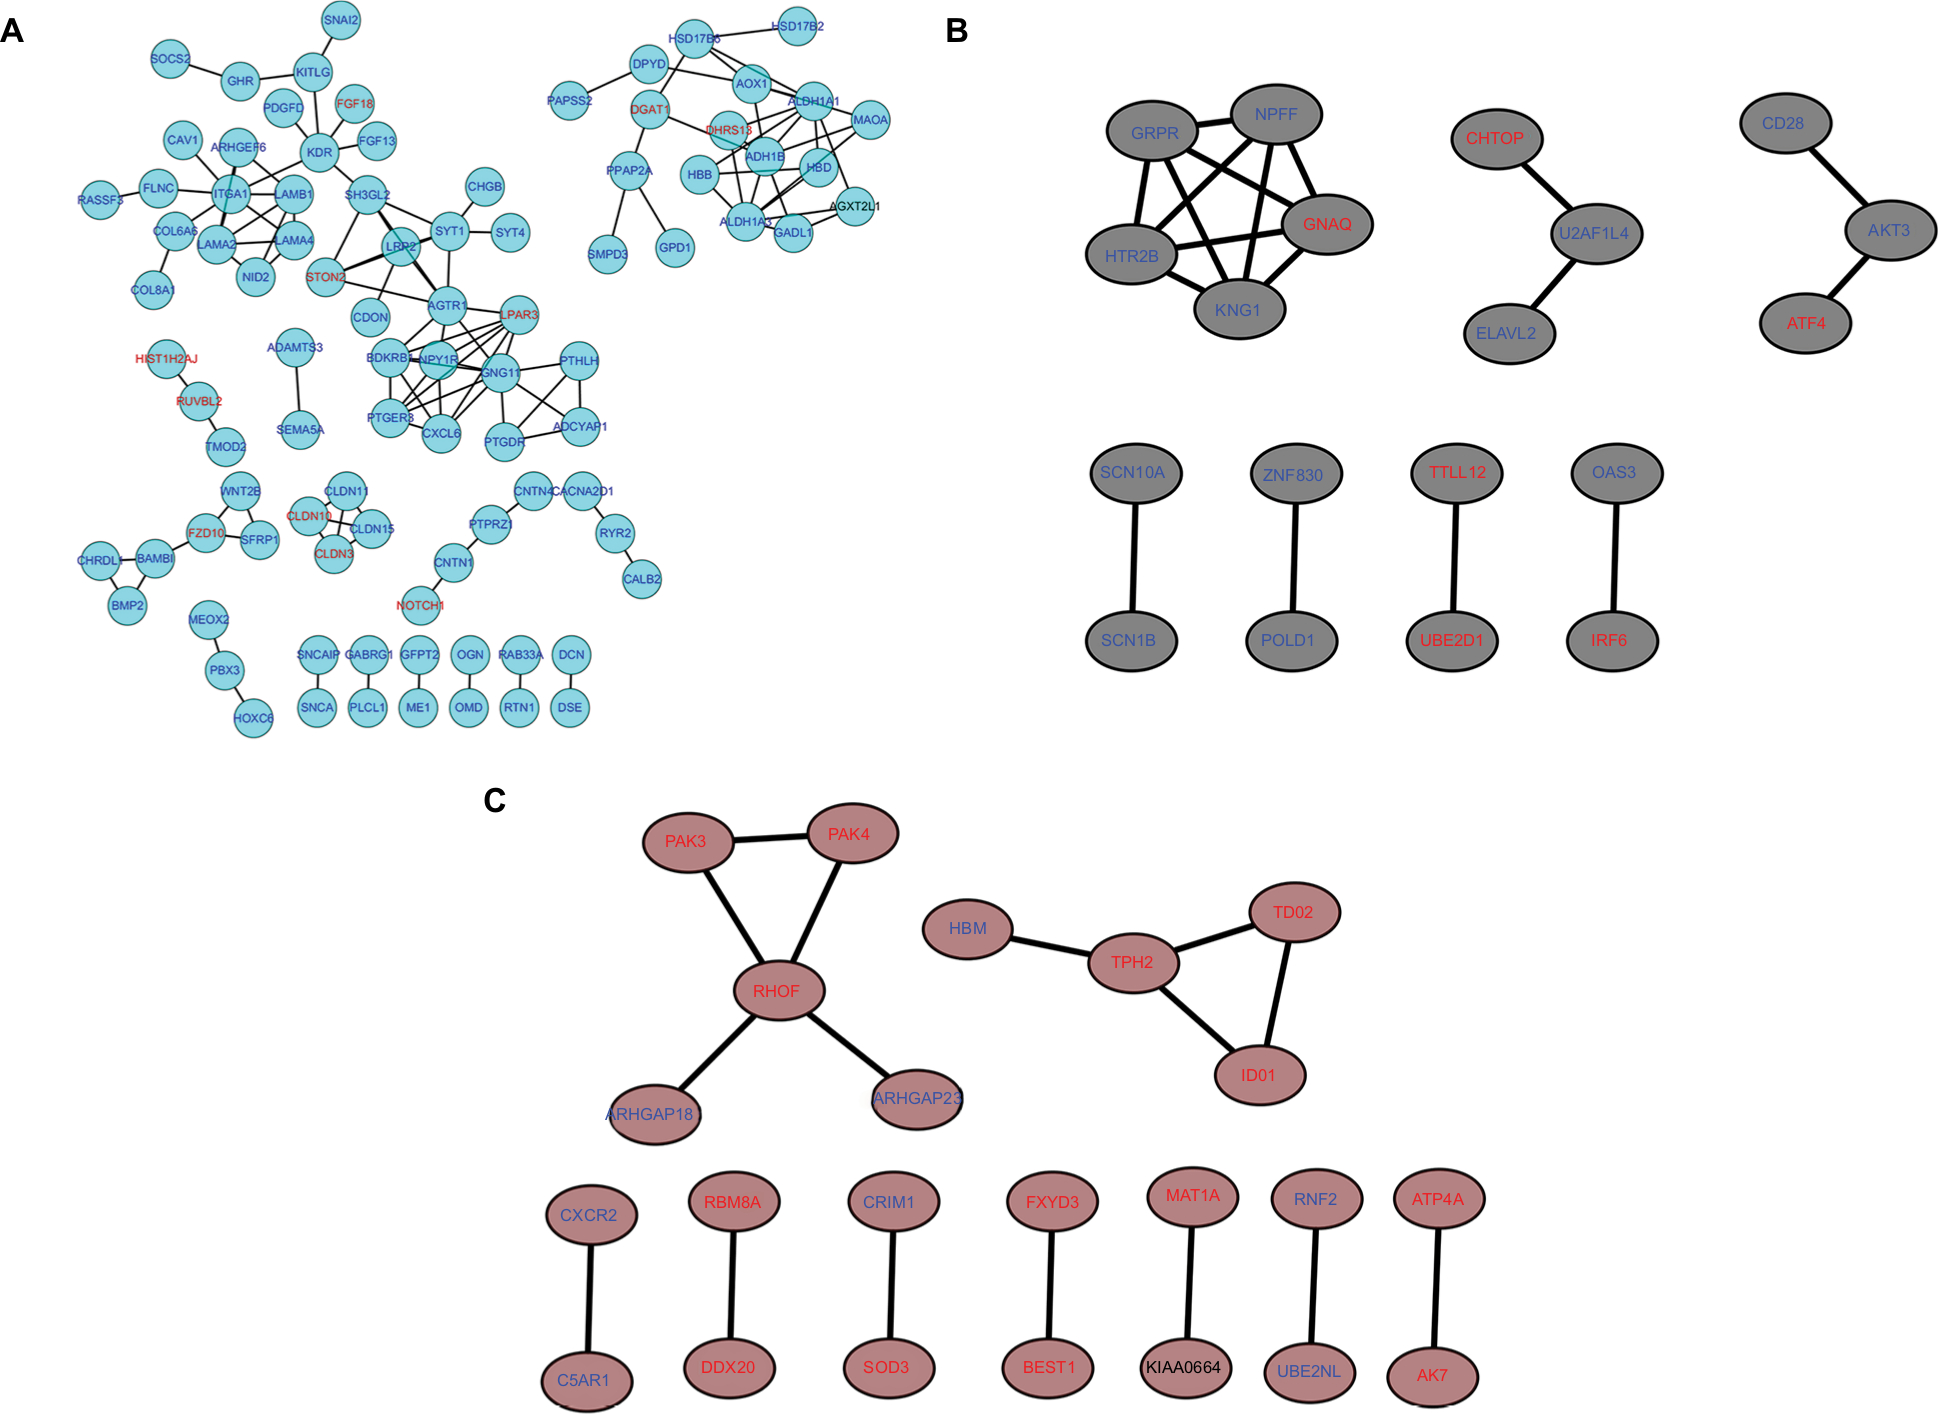 | Figure 8 PPI network of genes in the top three modules. Notes: The turquoise nodes represent the genes in turquoise module. The black nodes represent the genes in black module. The brown nodes represent the genes in brown module. Red words represent upregulated genes and blue words represent downregulated genes. The network was constructed using Cytoscape 3.4 software. Abbreviation: PPI, protein–protein interaction. |
GO was performed on these modules in order to explore the potential biological pathway that is correlated to EOC (Table S5). In GO analysis, we found that DEGs in the turquoise module were mostly enriched in collagen binding (Figure 9A). The DEGs in the black module were significantly enriched in SH3/SH2 adaptor activity and GTPase activator activity (Figure 9B). The DEGs in the brown module were significantly enriched in anion channel activity (Figure 9C). In KEGG analysis, we found that DEGs in turquoise module were significantly enriched in retinol metabolism, tyrosine metabolism and drug metabolism (Figure 9D). The DEGs in the black module were significantly enriched in adrenergic signaling in cardiomyocytes (Figure 9E). The DEGs in the brown module were significantly enriched in NOD-like receptor signaling pathway and tryptophan metabolism (Figure 9F).
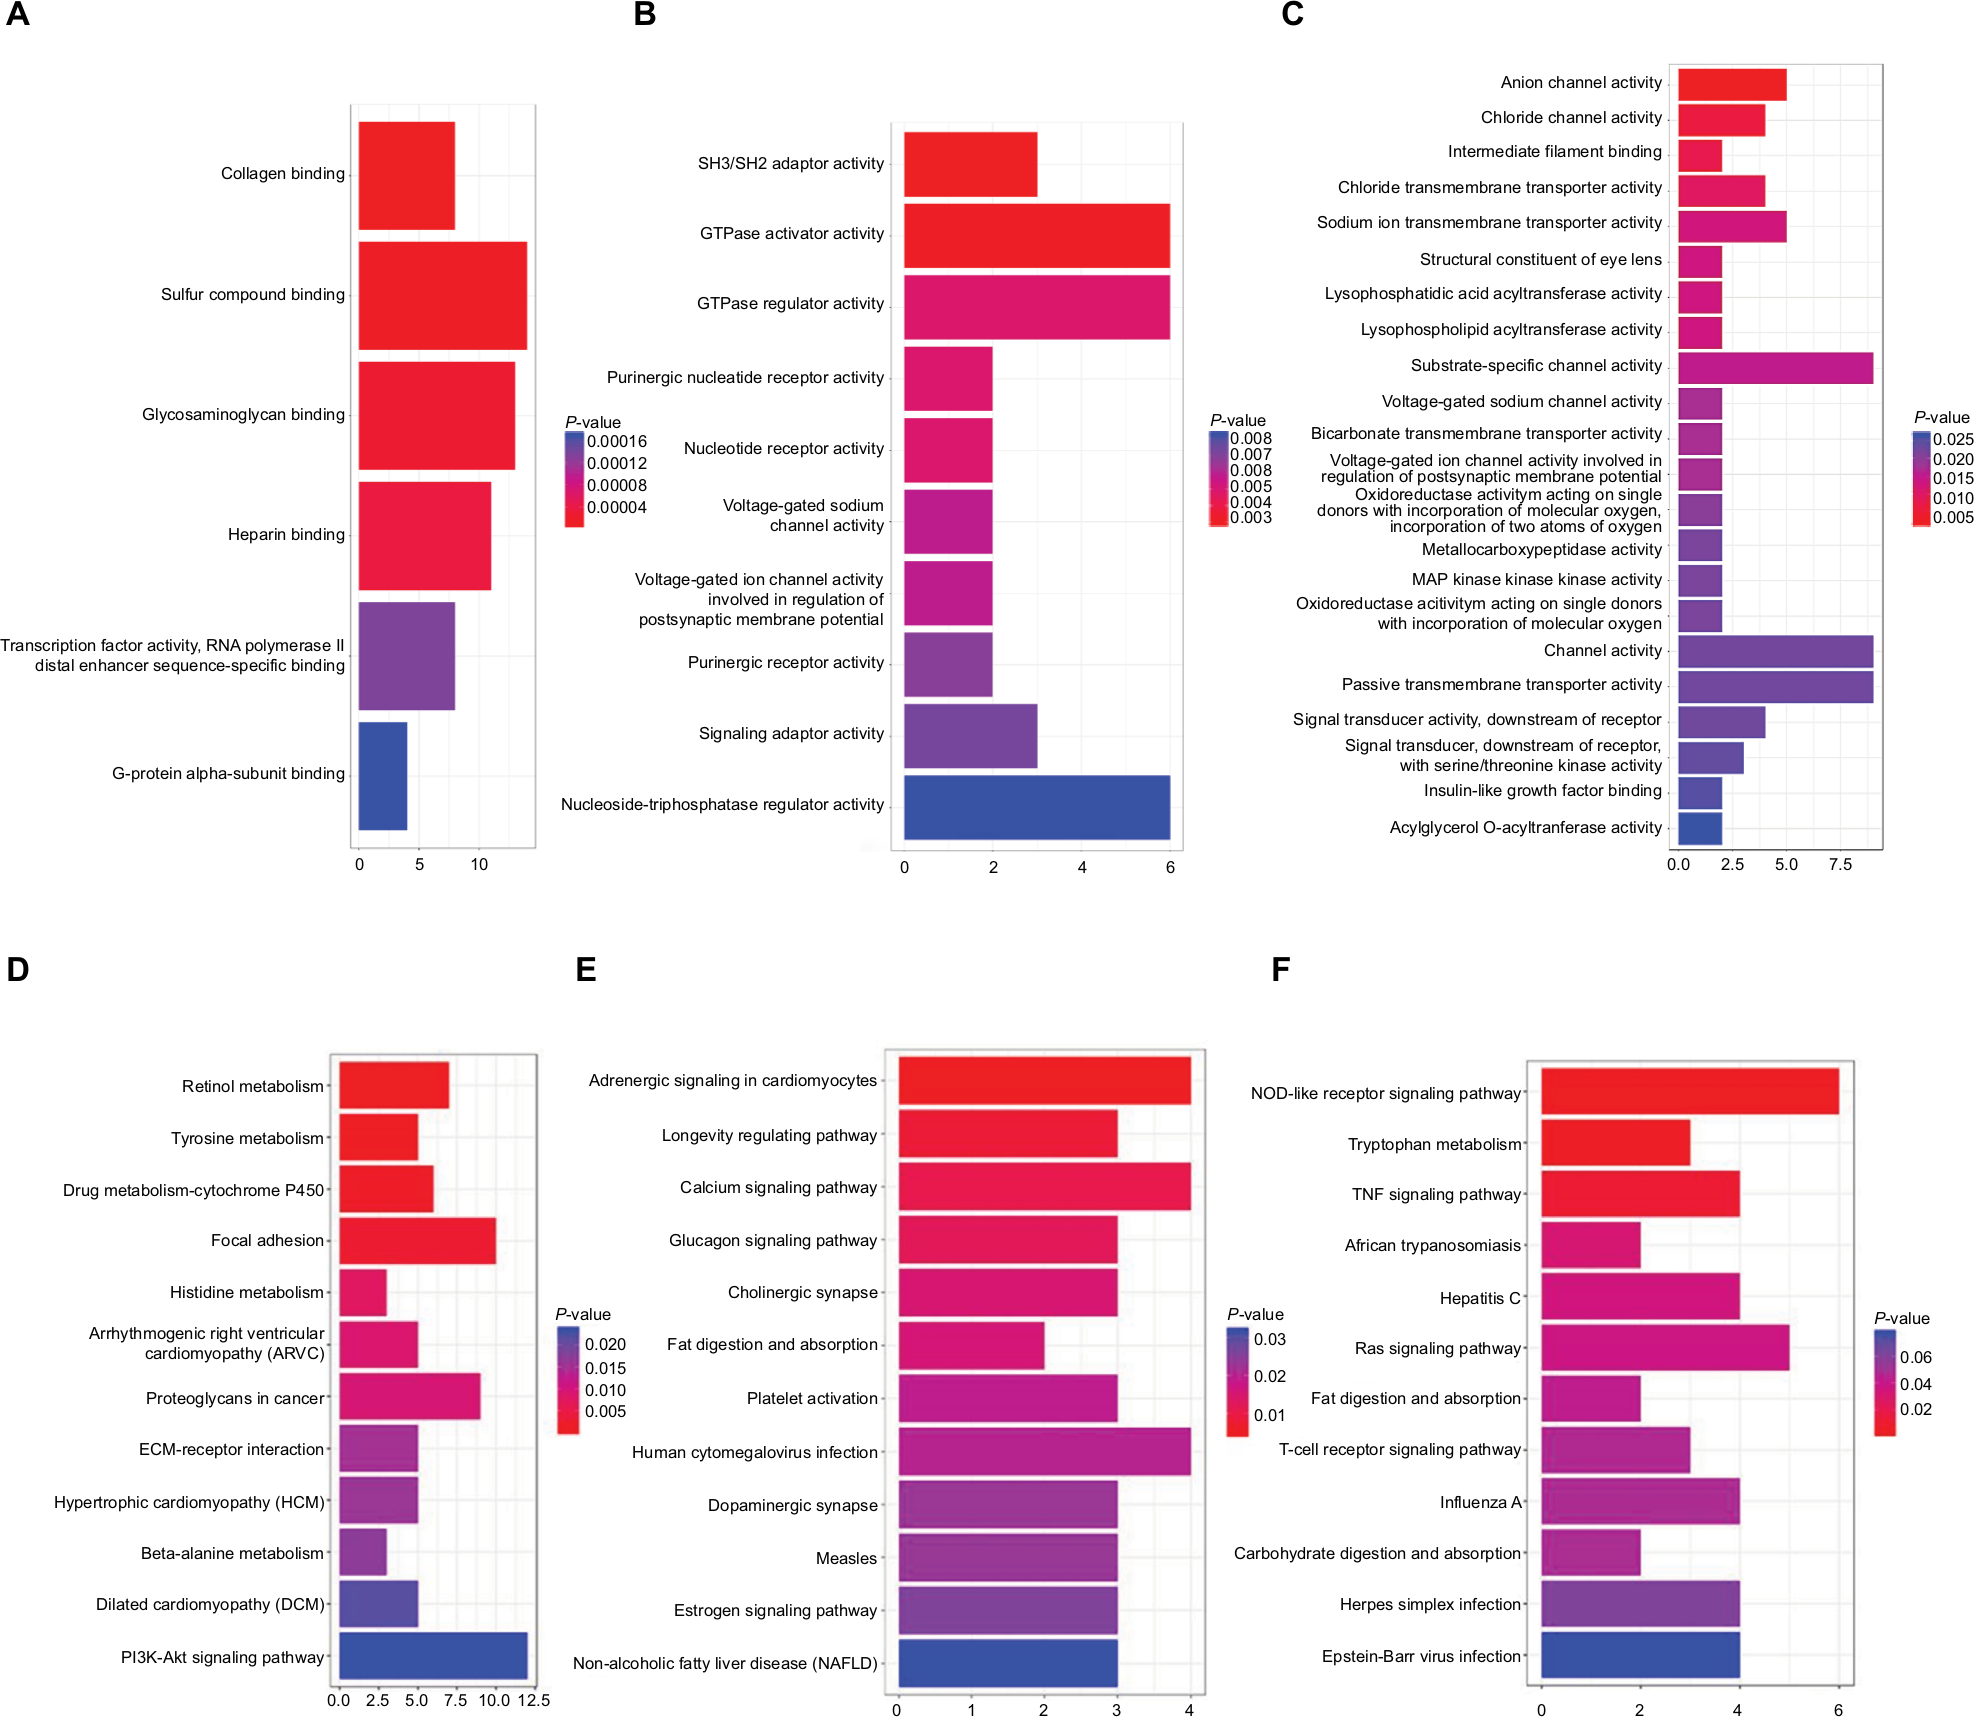 | Figure 9 GO and KEGG enrichment analysis of three genes modules. Note: (A) GO analysis of turquoise module; (B) GO analysis of black module; (C) GO analysis of brown module; (D) KEGG analysis of turquoise module; (E) KEGG analysis of black module; (F) KEGG analysis of brown module. Abbreviations: GO, gene ontology; KEGG, Kyoto Encyclopedia of Genes and Genomes. |
Hub genes validation
Using the WGCNA package, we found that the turquoise module had the highest correlation and negative correlation with EOC. We speculated that the genes in the turquoise module may act as tumor suppressors. Defined by module connectivity, measured by absolute value of the Pearson’s correlation (cor.geneModuleMembership >0.85) and defined by tumor trait relationship, measured by absolute value of the Pearson’s correlation (cor.geneTraitSignificance >0.2), we found 40 hub genes belong to turquoise module. Next we combined survival analysis (Table S6) and found that expression levels of ADH1C, SNCA, ITLN1, PRSS35, and OGN were significantly related to the overall survival of patients with EOC (P<0.05) (Figure S4). Furthermore, we found that patients with higher levels of ITLN1 expression in vivo had longer overall survival than patients with lower expression levels (Figure 10A). Among the above five genes, only ITLN1 was consistent with our speculation. Finally, we used qRT-PCR to perform the ITLN1 validation. We found ITLN1 was downregulated in EOC tissues that was compared with the normal ovarian tissues (Figure 10B).
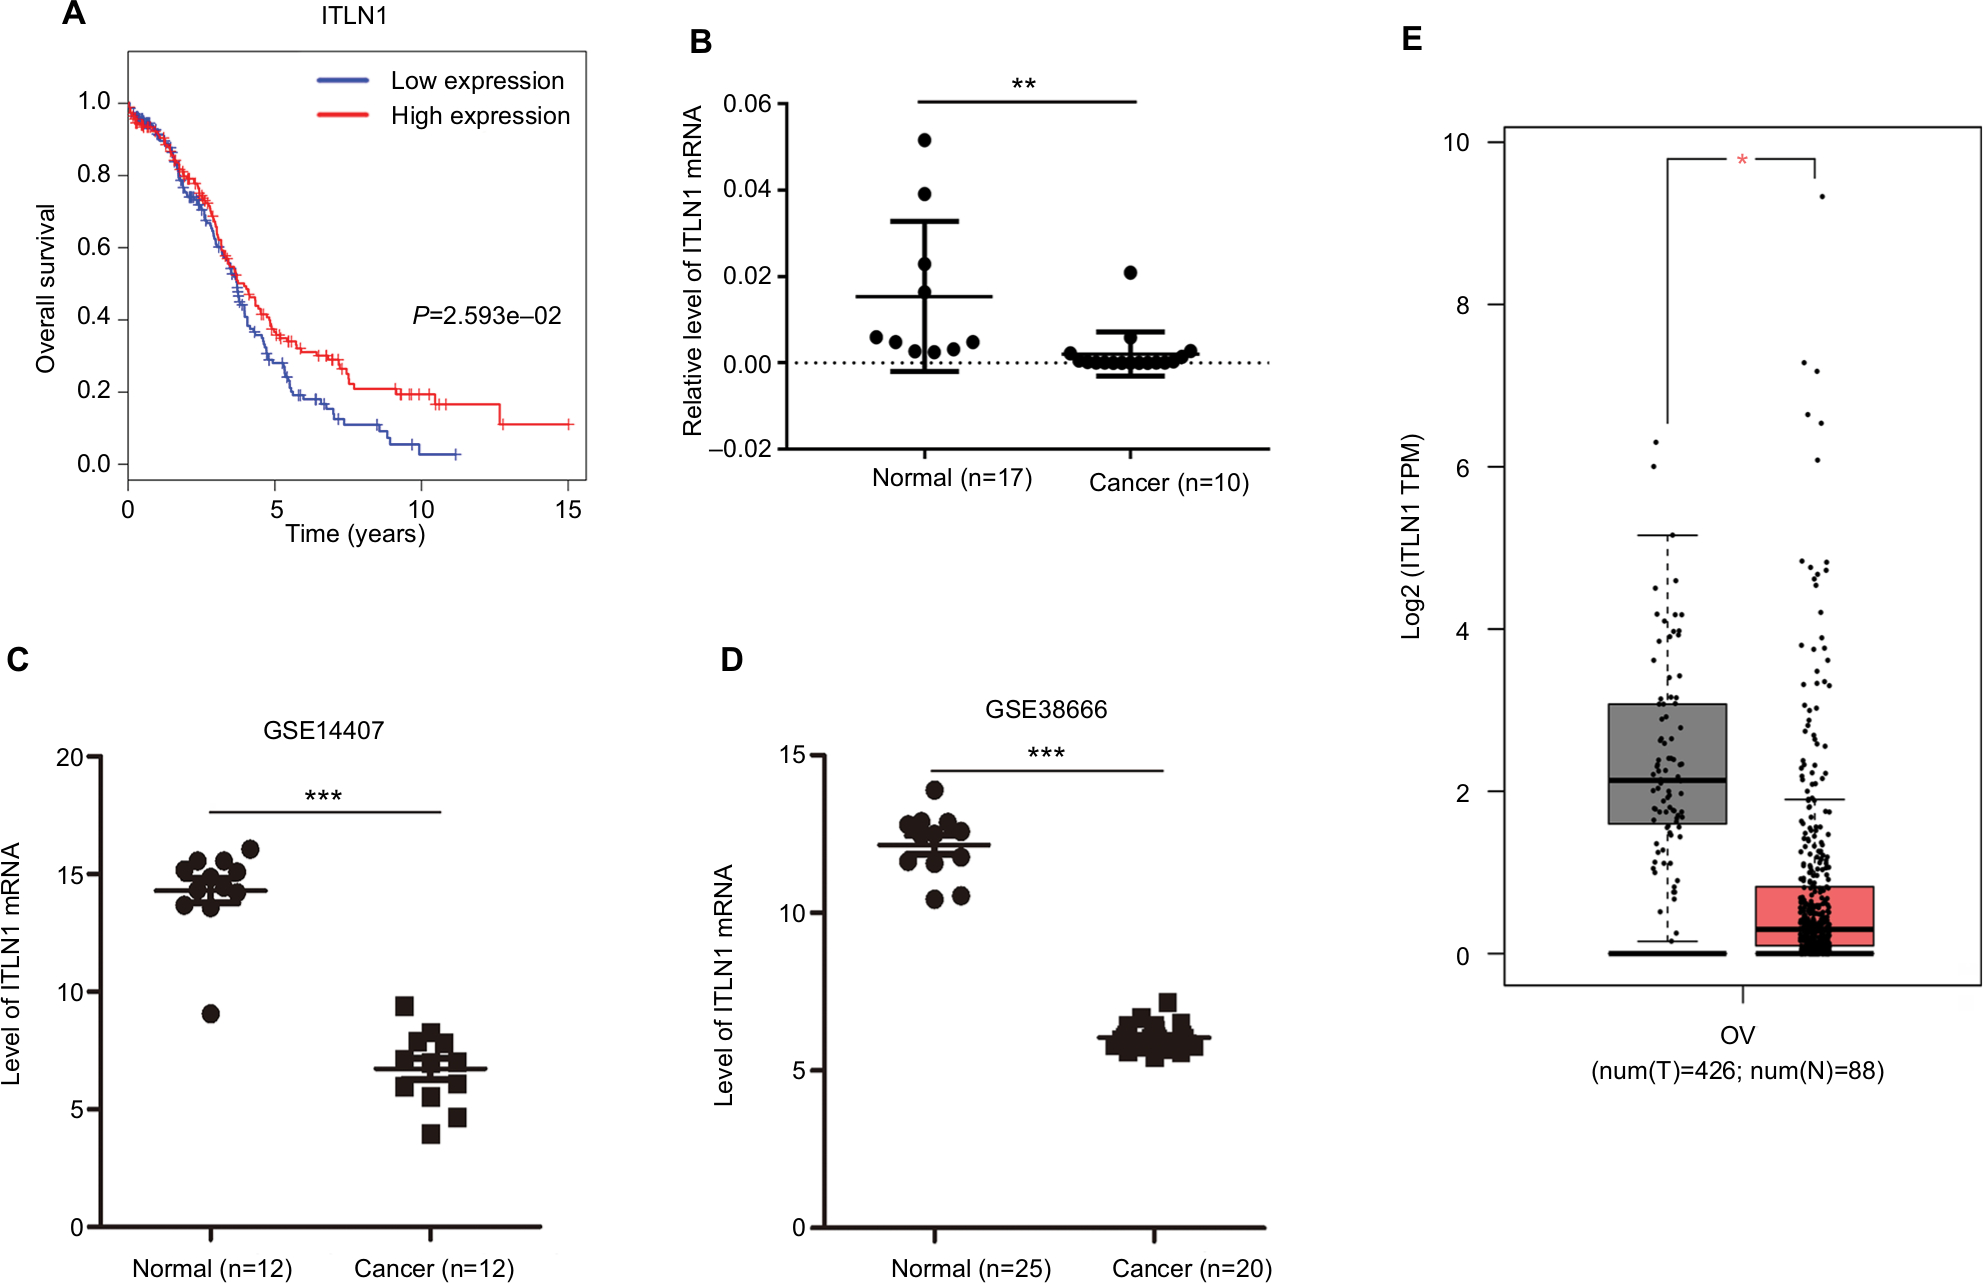 | Figure 10 Validation of hub genes. Notes: (A) Survival analysis indicated that ITLN1 was a positive prognosis factor in epithelial ovarian cancer, while patients with a higher expression of ITLN1 had significantly longer overall survival compared to those with higher expression (P=2.593e–02). (B) ITLN1 validation using qRT-PCR analysis. (C, D) Validation of ITLN1 expression from the GEO databases. Two datasets showed lower expression of ITLN1 in epithelial ovarian cancer tissues compared with normal ovarian tissues (P<0.001). (E) Validation of ITLN1 expression in GEPIA. Lower expression of ITLN1 in tumor tissues compared with normal ovarian tissues. ***P<0.001; **P<0.01; *P<0.05. Abbreviations: GEO, Gene Expression Omnibus; GEPIA, Gene Expression Profiling Interactive Analysis; num(T), number of tumor sample, num(N), number of normal sample; OV, ovarian cancer; qRT-PCR, quantitative real-time RT-PCR. |
Two other datasets and GEPIA were utilized to validate the expression of this gene. The results showed that ITLN1 expression was strikingly higher in normal tissues compared to that of EOC tissues (P<0.05) (Figure 10C–E).
Discussion
EOC is a malignant tumor with high malignancy and extremely high mortality. Its progression and development have complex mechanisms. Little is known about it. Surgery and adjuvant therapy have limited prognosis for advanced EOC. Targeted therapy has become the most promising treatment for EOC. Therefore, it is very important to study biomarkers and related regulatory pathways that affect the development of EOC. In this research, we examined the gene expression profile of GSE18520 and GSE27651 that contained 96 samples of EOC tissue and 16 samples of normal ovarian tissue samples to identify the molecular mechanism of EOC and seek some biomarkers. Bioinformatics analysis of these biological factors is used to seek genes that are beneficial to treatment.
In these findings, we identified 1,700 DEGs associated with EOC, including 943 upregulated genes and 757 downregulated genes using P<0.05 and |logFC|≥1 as the cutoff criteria, as shown in the volcano map (Figure 2A). We identified the top 100 DEGs according to |logFC|≥1 and then displayed on a heatmap. In GO analysis, the upregulated genes were mostly enriched in phosphate ion binding, the downregulated genes were highly enriched in glycosaminoglycan binding, heparin binding and sulfur compound binding. In the KEGG analysis, the upregulated genes were mostly enriched in oxidative phosphorylation and cell cycle. The downregulated genes were mostly enriched in complement and coagulation cascades, and proteoglycans in cancer. The above enrichment analysis results can help us further study the role of DEGs in EOC.
Most of the above GO terms and pathways had a certain relationship with ovarian function. Li et al31 found that sphingosine-1-phosphate could prevent chemotherapy-induced human primordial follicle death. Giordano et al32 performed the evaluation of endometrial sulfate glycosaminoglycans in patients with polycystic ovary syndrome and found that they were closely related. Cree-Green et al33 found that peripheral insulin resistance in obese girls with hyperandrogenism was related to oxidative phosphorylation and elevated serum free fatty acids. As is known, obesity and elevated androgen are also the causes of weakening ovarian function. Oxidative metabolism and oxidative damage were widely considered as significant pathways in cancers, including EOC.34 Chen et al35 found that chemically modified heparin inhibited in vitro L-selectin-mediated human ovarian carcinoma cell adhesion. And the change of cell cycle was one of the factors that induced the occurrence of ovarian cancer. Many studies were also aimed at the cell cycle to find ways to treat ovarian cancer, for instance, Xiong et al36 found that ferruginol exhibited anticancer effects in OVCAR-3 human ovary cancer cells by inducing apoptosis, inhibition of cancer cell migration and G2/M phase cell cycle arrest.
We utilized PPI network analysis and WGCNA analysis to select PPI and gene co-expression modules that are linked to the clinical development of EOC. The PPI network was built on the DEGs that is analyzed by STRING website and Cytoscape software. Referring to cutoff of a k-core of 2, we found 7 clusters, among which cluster 1 had the highest score, and included 7 nodes and 21 edges in this subnetwork. Ten prominent proteins were also identified, among which CDK1 was considered to be the most important protein.
WGCNA analysis showed that three modules possessed exceedingly relevant expression pattern. For each module, GO and KEGG analysis were used to explore the biological process and pathway. The most relevant turquoise module contains 40 key genes. Through GO analysis, they were mainly enriched in collagen binding. In KEGG analysis, we found that DEGs in the turquoise module were highly enriched in retinol metabolism, tyrosine metabolism and drug metabolism. We performed further survival analysis and database validation of these genes. Interestingly, ITLN1 was positively associated with the prognosis of EOC. We further performed the validation in the clinical tissues samples, and then found the expression level of ITLN1 was lower in EOC tissues, consistent with the results predicted in GEPIA.
Our research found that CDK1 has 94 nodes in the PPI network, and ranked first. Cdk1 (cyclin-dependent kinase 1) is essential regulator of the G2-M checkpoint. Cyclin-dependent kinase pathways are considered potential targets for cancer treatment.37,38 Sung et al39 found that high nuclear/cytoplasmic ratio of Cdk1 expression predicts poor prognosis in colorectal cancer patients. It also has been identified as a clinically functional prognostic biomarker in non-small-cell lung cancer and breast cancer.40–44 CDK1 has been shown to be involved in the development of EOC in multiple studies, and its high expression levels lead to poor prognosis45,46 and CDK1 affects drug resistance in EOC.47 These results indicate that CDK1 may be an independent biomarker for the diagnosis of EOC as well as a potential therapeutic target, and this result is consistent with our findings.
Intelectin 1 (ITLN1), a secretory lectin, is also a plasma adipokine that is synthesized in visceral adipose tissue. ITLN1 has anti-inflammatory, antiatherogenic, anti-cardiovascular disease and antidiabetic propertiesits.48 Plasma concentration changes in colorectal cancer and conditions associated with insulin resistance.49,50 Circulating ITLN1 levels were negatively correlated with WHR and BMI and significantly decreased in renal cancer patients.51 It has been proved that circulating ITLN1 levels were elevated in patients with Prostate cancer.52 ITLN1 was demonstrated to be a tumor suppressor and is associated with improved survival in gastric cancer.53 Li et al54 illustrated that intelectin 1 suppresses the growth, invasion and metastasis of neuroblastoma cells. Zhang and Zhou55 illustrated that ITLN1 promotes apoptosis through regulating Sirt1-dependent p53 deacetylation in hepatocellular carcinoma cells. Therefore, Szydło et al56 stated that it is reasonable to use ITLN1 as a biomarker for predicting individual conditions, such as obesity, type 2 diabetes, pancreatitis, gastric cancer, lung cancer or colon cancer. However, the role of ITLN1 in EOC has not been verified.
There were some limitations to this study. First, we did not analyze the detailed classification of tumors, such as tumor size, staging, grading, and prognosis. We will explore key genes and pathways in detail based on this clinical information in future research.
Conclusion
Through a series of comprehensive analysis of bioinformatics, we can roughly screen the hub genes and pathways related to the progression of EOC, and target therapy for the extracted hub gene ITLN1 and hub protein CDK1 which might greatly promote the prognosis of advanced EOC. However, these key genes and pathways still need to be tested in a large quantity of clinical specimens, and need to be analyzed and validated in combination with the individual conditions of clinical patients in order to finally determine the biological targets that are most beneficial to EOC.
Ethics approval and consent to participate
The study was approved by the Ethics Committee of the Nanjing Medical University. Samples were obtained with written informed consent from all patients and the study was conducted in accordance with Declaration of Helsinki guidelines.
Acknowledgment
This work was supported by the National Natural Science Foundation of China (81472442 and 81272871).
Disclosure
The authors report no conflicts of interest in this work.
References
Fang F, Munck J, Tang J, et al. The novel, small-molecule DNA methylation inhibitor SGI-110 as an ovarian cancer chemosensitizer. Clin Cancer Res. 2014;20(24):6504–6516. | ||
Dong X, Men X, Zhang W, Lei P. Advances in tumor markers of ovarian cancer for early diagnosis. Indian J Cancer. 2014;51(Suppl 3):e72–76. | ||
Unni SK, Schauerhamer MB, Deka R, et al. BRCA testing, treatment patterns and survival in platinum-sensitive recurrent ovarian cancer - an observational cohort study. J Ovarian Res. 2016;9(1):18. | ||
Xia L, Su X, Shen J, et al. ANLN functions as a key candidate gene in cervical cancer as determined by integrated bioinformatic analysis. Cancer Manag Res. 2018;10:663–670. | ||
Yuan L, Zeng G, Chen L, et al. Identification of key genes and pathways in human clear cell renal cell carcinoma (ccRCC) by co-expression analysis. Int J Biol Sci. 2018;14(3):266–279. | ||
Liu J, Matulonis UA. New strategies in ovarian cancer: translating the molecular complexity of ovarian cancer into treatment advances. Clin Cancer Res. 2014;20(20):5150–5156. | ||
Yin L, Cai Z, Zhu B, Xu C. Identification of key pathways and genes in the dynamic progression of HCC based on WGCNA. Genes (Basel). 2018;9(2):92. | ||
Zhang J, Lan Q, Lin J. Identification of key gene modules for human osteosarcoma by co-expression analysis. World J Surg Oncol. 2018;16(1):89. | ||
Yao S, Liu T. Analysis of differential gene expression caused by cervical intraepithelial neoplasia based on GEO database. Oncol Lett. 2018;15(6):8319–8324. | ||
Zhou Z, Liu S, Zhang M, et al. Overexpression of Topoisomerase 2-Alpha Confers a Poor Prognosis in Pancreatic Adenocarcinoma Identified by Co-Expression Analysis. Dig Dis Sci. 2017;62(10):2790–2800. | ||
Langfelder P, Horvath S. WGCNA: an R package for weighted correlation network analysis. BMC Bioinformatics. 2008;9(1):559. | ||
Wang F, Chang Y, Li J, et al. Strong correlation between ASPM gene expression and HCV cirrhosis progression identified by co-expression analysis. Dig Liver Dis. 2017;49(1):70–76. | ||
Clarke C, Madden SF, Doolan P, et al. Correlating transcriptional networks to breast cancer survival: a large-scale coexpression analysis. Carcinogenesis. 2013;34(10):2300–2308. | ||
Mok SC, Bonome T, Vathipadiekal V, et al. A gene signature predictive for outcome in advanced ovarian cancer identifies a survival factor: microfibril-associated glycoprotein 2. Cancer Cell. 2009;16(6):521–532. | ||
King ER, Tung CS, Tsang YT, et al. The anterior gradient homolog 3 (AGR3) gene is associated with differentiation and survival in ovarian cancer. Am J Surg Pathol. 2011;35(6):904–912. | ||
Harbig J, Sprinkle R, Enkemann SA. A sequence-based identification of the genes detected by probesets on the Affymetrix U133 plus 2.0 array. Nucleic Acids Res. 2005;33(3):e31. | ||
Irizarry RA, Hobbs B, Collin F, et al. Exploration, normalization, and summaries of high density oligonucleotide array probe level data. Biostatistics. 2003;4(2):249–264. | ||
Gautier L, Cope L, Bolstad BM, Irizarry RA. affy–analysis of Affymetrix GeneChip data at the probe level. Bioinformatics. 2004;20(3):307–315. | ||
Leek JT, Johnson WE, Parker HS, Jaffe AE, Storey JD. The SVA package for removing batch effects and other unwanted variation in high-throughput experiments. Bioinformatics. 2012;28(6):882–883. | ||
Minati L, Zacà D, D’Incerti L, Jovicich J. Fast computation of voxel-level brain connectivity maps from resting-state functional MRI using l1-norm as approximation of Pearson’s temporal correlation: proof-of-concept and example vector hardware implementation. Med Eng Phys. 2014;36(9):1212–1217. | ||
Ritchie ME, Phipson B, Wu D, et al. limma powers differential expression analyses for RNA-sequencing and microarray studies. Nucleic Acids Res. 2015;43(7):e47. | ||
Galili T, O’Callaghan A, Sidi J, Sievert C. heatmaply: an R package for creating interactive cluster heatmaps for online publishing. Bioinformatics. 2018;34(9):1600–1602. | ||
Yu G, Wang LG, Han Y, He QY. clusterProfiler: an R package for comparing biological themes among gene clusters. OMICS. 2012;16(5):284–287. | ||
Szklarczyk D, Franceschini A, Wyder S, et al. String v10: protein-protein interaction networks, integrated over the tree of life. Nucleic Acids Res. 2015;43(Database issue):D447–D452. | ||
Shannon P, Markiel A, Ozier O, et al. Cytoscape: a software environment for integrated models of biomolecular interaction networks. Genome Res. 2003;13(11):2498–2504. | ||
Mason MJ, Fan G, Plath K, Zhou Q, Horvath S. Signed weighted gene co-expression network analysis of transcriptional regulation in murine embryonic stem cells. BMC Genomics. 2009;10(1):327. | ||
Horvath S, Dong J. Geometric interpretation of gene coexpression network analysis. PLoS Comput Biol. 2008;4(8):e1000117. | ||
Alter O, Brown PO, Botstein D. Singular value decomposition for genome-wide expression data processing and modeling. Proc Natl Acad Sci U S A. 2000;97(18):10101–10106. | ||
Tang Z, Li C, Kang B, Gao G, Li C, Zhang Z. GEPIA: a web server for cancer and normal gene expression profiling and interactive analyses. Nucleic Acids Res. 2017;45(W1):W98–W102. | ||
Kanehisa M, Goto S, Sato Y, Furumichi M, Tanabe M. KEGG for integration and interpretation of large-scale molecular data sets. Nucleic Acids Res. 2012;40(Database issue):D109–D114. | ||
Li F, Turan V, Lierman S, Cuvelier C, De Sutter P, Oktay K. Sphingosine-1-phosphate prevents chemotherapy-induced human primordial follicle death. Hum Reprod. 2014;29(1):107–113. | ||
Giordano MV, Giordano LA, Gomes RC, et al. The evaluation of endometrial sulfate glycosaminoglycans in women with polycystic ovary syndrome. Gynecol Endocrinol. 2015;31(4):278–281. | ||
Cree-Green M, Newcomer BR, Coe G, et al. Peripheral insulin resistance in obese girls with hyperandrogenism is related to oxidative phosphorylation and elevated serum free fatty acids. Am J Physiol Endocrinol Metab. 2015;308(9):E726–E733. | ||
Bukhari SA, Zafar K, Rajoka M, Ibrahim Z, Javed S, Sadiq R. Oxidative stress-induced DNA damage and homocysteine accumulation may beinvolved in ovarian cancer progression in both young and old patients. Turk J Med Sci. 2016;46(3):583–589. | ||
Chen Z, Jing Y, Song B, Han Y, Chu Y. Chemically modified heparin inhibits in vitro L-selectin-mediated human ovarian carcinoma cell adhesion. Int J Gynecol Cancer. 2009;19(4):540–546. | ||
Xiong WD, Gong J, Xing C. Ferruginol exhibits anticancer effects in OVCAR3 human ovary cancer cells by inducing apoptosis, inhibition of cancer cell migration and G2/M phase cell cycle arrest. Mol Med Rep. 2017;16(5):7013–7017. | ||
Shapiro GI. Cyclin-dependent kinase pathways as targets for cancer treatment. J Clin Oncol. 2006;24(11):1770–1783. | ||
Malumbres M, Barbacid M. Cell cycle, CDKs and cancer: a changing paradigm. Nat Rev Cancer. 2009;9(3):153–166. | ||
Sung WW, Lin YM, Wu PR, et al. High nuclear/cytoplasmic ratio of CDK1 expression predicts poor prognosis in colorectal cancer patients. BMC Cancer. 2014;14(1):951. | ||
Kim SJ, Nakayama S, Miyoshi Y, et al. Determination of the specific activity of CDK1 and CDK2 as a novel prognostic indicator for early breast cancer. Ann Oncol. 2008;19(1):68–72. | ||
van Nes JG, Smit VT, Putter H, et al. Validation study of the prognostic value of cyclin-dependent kinase (CDK)-based risk in Caucasian breast cancer patients. Br J Cancer. 2009;100(3):494–500. | ||
Kim SJ, Nakayama S, Shimazu K, et al. Recurrence risk score based on the specific activity of CDK1 and CDK2 predicts response to neoadjuvant paclitaxel followed by 5-fluorouracil, epirubicin and cyclophosphamide in breast cancers. Ann Oncol. 2012;23(4):891–897. | ||
Perumal D, Singh S, Yoder SJ, Bloom GC, Chellappan SP. A novel five gene signature derived from stem-like side population cells predicts overall and recurrence-free survival in NSCLC. PLoS One. 2012;7(8):e43589. | ||
Zhang C, Elkahloun AG, Robertson M, et al. Loss of cytoplasmic CDK1 predicts poor survival in human lung cancer and confers chemotherapeutic resistance. PLoS One. 2011;6(8):e23849. | ||
Xi Q, Huang M, Wang Y, et al. The expression of CDK1 is associated with proliferation and can be a prognostic factor in epithelial ovarian cancer. Tumour Biol. 2015;36(7):4939–4948. | ||
Yang W, Cho H, Shin HY, et al. Accumulation of cytoplasmic Cdk1 is associated with cancer growth and survival rate in epithelial ovarian cancer. Oncotarget. 2016;7(31):49481–49497. | ||
Bae T, Weon KY, Lee JW, Eum KH, Kim S, Choi JW. Restoration of paclitaxel resistance by Cdk1 intervention in drug-resistant ovarian cancer. Carcinogenesis. 2015;36(12):1561–1571. | ||
Zhou JY, Chan L, Zhou SW. Omentin: linking metabolic syndrome and cardiovascular disease. Curr Vasc Pharmacol. 2014;12(1):136–143. | ||
Aleksandrova K, di Giuseppe R, Isermann B, et al. Circulating omentin as a novel biomarker for colorectal cancer risk: data from the EPIC-Potsdam cohort study. Cancer Res. 2016;76(13):3862–3871. | ||
Booth A, Magnuson A, Fouts J, Foster M. Adipose tissue, obesity and adipokines: role in cancer promotion. Horm Mol Biol Clin Investig. 2015;21(1):57–74. | ||
Shen XD, Zhang L, Che H, et al. Circulating levels of adipocytokine omentin-1 in patients with renal cell cancer. Cytokine. 2016;77:50–55. | ||
Uyeturk U, Sarıcı H, Kın Tekce B, et al. Serum omentin level in patients with prostate cancer. Med Oncol. 2014;31(4):923. | ||
Li D, Zhao X, Xiao Y, et al. Intelectin 1 suppresses tumor progression and is associated with improved survival in gastric cancer. Oncotarget. 2015;6(18):16168–16182. | ||
Li D, Mei H, Pu J, et al. Intelectin 1 suppresses the growth, invasion and metastasis of neuroblastoma cells through up-regulation of N-Myc downstream regulated gene 2. Mol Cancer. 2015;14(1):47. | ||
Zhang YY, Zhou LM. Omentin-1, a new adipokine, promotes apoptosis through regulating Sirt1-dependent p53 deacetylation in hepatocellular carcinoma cells. Eur J Pharmacol. 2013;698(1–3):137–144. | ||
Szydło B, Kiczmer P, Świętochowska E, Ostrowska Z. Role of omentin and chemerin in metabolic syndrome and tumor diseases. Postepy Hig Med Dosw (Online). 2016;70(0):844–849. |
 © 2019 The Author(s). This work is published and licensed by Dove Medical Press Limited. The
full terms of this license are available at https://www.dovepress.com/terms
and incorporate the Creative Commons Attribution
- Non Commercial (unported, 3.0) License.
By accessing the work you hereby accept the Terms. Non-commercial uses of the work are permitted
without any further permission from Dove Medical Press Limited, provided the work is properly
attributed. For permission for commercial use of this work, please see paragraphs 4.2 and 5 of our Terms.
© 2019 The Author(s). This work is published and licensed by Dove Medical Press Limited. The
full terms of this license are available at https://www.dovepress.com/terms
and incorporate the Creative Commons Attribution
- Non Commercial (unported, 3.0) License.
By accessing the work you hereby accept the Terms. Non-commercial uses of the work are permitted
without any further permission from Dove Medical Press Limited, provided the work is properly
attributed. For permission for commercial use of this work, please see paragraphs 4.2 and 5 of our Terms.