Back to Journals » Drug Design, Development and Therapy » Volume 20
Isobolographic Analysis of the Interaction Between Remimazolam and Etomidate in General Anesthesia Induction: A Prospective, Sequential Allocation Study Based on the Dixon Up-and-Down Method
Authors Yue W, Huang J ![]() , Wang Q, Zheng F, Yin P, Jin Y, Wang Y, Zhang L
, Wang Q, Zheng F, Yin P, Jin Y, Wang Y, Zhang L
Received 20 January 2026
Accepted for publication 2 June 2026
Published 10 June 2026 Volume 2026:20 597710
DOI https://doi.org/10.2147/DDDT.S597710
Checked for plagiarism Yes
Review by Single anonymous peer review
Peer reviewer comments 2
Editor who approved publication: Dr Leonidas Panos
Wei Yue,1,* Jiayan Huang,2,* Qi Wang,2 Furong Zheng,2 Pengfei Yin,3 Yaohua Jin,2 Yue Wang,4 Linzhong Zhang1
1College of Anesthesiology, Shanxi Medical University and Department of Anesthesiology, Second Hospital of Shanxi Medical University, Taiyuan, Shanxi, People’s Republic of China; 2College of Anesthesiology, Shanxi Medical University, Taiyuan, Shanxi, People’s Republic of China; 3Department of Anesthesiology, Second Hospital of Shanxi Medical University, Taiyuan, Shanxi, People’s Republic of China; 4Department of Anesthesiology, China Railway 17th Bureau Group Central Hospital, Taiyuan, Shanxi, People’s Republic of China
*Wei Yue and Jiayan Huang contributed equally to this manuscript
Correspondence: Wei Yue, College of Anesthesiology, Shanxi Medical University and Department of Anesthesiology, Second Hospital of Shanxi Medical University, Taiyuan, Shanxi, People’s Republic of China, Email [email protected]
Purpose: This study aimed to investigate the sedative interaction between the new benzodiazepine derivative remimazolam and etomidate during general anesthesia induction and determine the appropriate dose ratio for their combined use.
Patients and Methods: Patients scheduled for general anesthesia, aged 18 to 60 years with a BMI of 18 to 28 kg/m2 and American Society of Anesthesiologists (ASA) physical status I–II, were randomly divided into five groups using a random number table. The modified Dixon up-and-down method was employed to determine the median effective dose (ED50) of remimazolam in Group A (remimazolam group) and etomidate in Group B (etomidate group). For the combined medication groups: Group C (0.25 ED50 remimazolam + 0.75 ED50 etomidate), Group D (0.5 ED50 remimazolam + 0.5 ED50 etomidate), and Group E (0.75 ED50 remimazolam + 0.25 ED50 etomidate), the dose of remimazolam was fixed in each group, and the ED50 of etomidate in each group was calculated. Isobolographic analysis was utilized to assess the sedative interaction between the two drugs, and the interaction index and optimal dose ratio for synergism were calculated.
Results: The ED50 of remimazolam and its 95% confidence interval (95% CI) in Group A were 0.193 (0.167– 0.253) mg/kg, while those of etomidate in Group B were 0.155 (0.118– 0.20) mg/kg. Isobolographic analysis revealed remimazolam and etomidate produced a synergistic effect in Groups C and D, and an additive effect in Group E. When combined at 0.048 mg/kg remimazolam and 0.062 mg/kg etomidate, the optimal dose ratio for the strongest synergism was 1:1.29.
Conclusion: During general anesthesia induction, when the dose ratios of remimazolam to etomidate are approximately 1:1.29 and 1:0.39, the two drugs exert a synergistic sedative effect, with the strongest synergism observed at the dose ratio of 1:1.29.
Keywords: isobolographic analysis, drug-drug interaction, remimazolam, etomidate
Introduction
During anesthesia induction, single-agent sedation typically requires higher doses, leading to hemodynamic depression.1,2 Combining anesthetics may reduce drug dosages and associated adverse reactions while enhancing cardiovascular stability.3 Remimazolam is a new benzodiazepine derivative drug that can alleviate preoperative anxiety in patients.4 Compared with traditional sedatives, remimazolam exhibits superior hemodynamic stability and can be antagonized by flumazenil.5 However, its sedation success rate is lower than that of propofol.6 Etomidate is a non-barbiturate intravenous general anesthetic that provides adequate sedation depth and stable hemodynamics during induction,7 but it is associated with a high incidence of myoclonus and convulsions.
Isobolographic analysis is a simple and accurate method for evaluating drug interactions, enabling quantitative confirmation of changes in drug effects after combined administration.8 This study used isobolographic analysis to explore the interaction between remimazolam and etomidate, providing a rational reference for clinical medication.
Materials and Methods
Inclusion and Exclusion Criteria
Eligible patients were those undergoing elective surgery under general anesthesia, of any gender, aged 18–60 years, with ASA physical status I–II and a BMI of 18–28 kg/m2.
Exclusion criteria included: hypersensitivity to remimazolam or etomidate; pregnancy or lactation; severe cardiovascular diseases; chronic alcoholism; patients unfit for elective surgery; use of sedatives or opioids within 24 hours; severe mental illness; and myasthenia gravis.
Sample Size Calculation
The Dixon up-and-down method can effectively reduce the number of subjects required for a study. Its sample size is not determined by traditional power analysis but by a predefined stopping rule.9 When this method is adopted, the type of experiment does not influence the calculation of sample size. A stable and reliable estimate of the median effective dose (ED50) can be achieved when at least six crossover points are observed—defined as a transition from a positive response to a negative response, or vice versa.10 To ensure statistical robustness, this study pre-specified that after the first crossover point was observed, subject enrollment would continue until a total of seven crossover points were recorded, which served as the trial termination criterion. Thus, the sample size was determined sequentially rather than as a fixed pre-calculated value.
Ethics
This was a prospective, sequential allocation study based on the Dixon up-and-down method. A total of 135 patients who underwent general anesthesia at the Second Hospital of Shanxi Medical University during the period from June 19 to July 19, 2025, were enrolled in the present study. It was approved by the Ethics Committee of the Second Hospital of Shanxi Medical University (Approval No.: [2025] YX No. 208, Approval Date: June 3, 2025) and registered at ClinicalTrials.gov (NCT07012902, Registration Date: June 8, 2025). Written informed consent was obtained from all patients and their family members. The study adhered to the principles of the Declaration of Helsinki.
Grouping and Intervention
The experiment was divided into two phases. In Phase 1, patients were randomly divided into two groups using a random number table: Group A (remimazolam group) and Group B (etomidate group). The initial doses of remimazolam in Group A11 and etomidate in Group B12 were 0.2 mg/kg and 0.12 mg/kg, respectively, with adjacent dose ratios of 1:0.8 and 1:0.6. The ED50 values of Group A and Group B were calculated using the Dixon up-and-down method.13 In Phase 2, the calculated ED50 values of remimazolam and etomidate were used as the initial doses for the subgroups. Patients were randomly divided into three combined medication groups using a random number table: Group C (0.25 ED50 remimazolam + 0.75 ED50 etomidate), Group D (0.5 ED50 remimazolam + 0.5 ED50 etomidate), and Group E (0.75 ED50 remimazolam + 0.25 ED50 etomidate). The dose of remimazolam was fixed in each group, and the ED50 of etomidate in Groups C, D, and E was calculated using the modified Dixon up-and-down method.
Anesthesia Method and Observation Indicators
All patients fasted for 8 hours and abstained from water for 2 hours preoperatively; and no special preoperative medications were administered. Upon entering the operating room, blood pressure, heart rate, oxygen saturation, and bispectral index (BIS) were monitored, and oxygen was administered via face mask at 5 L/min. After triple verification, an intravenous access was established in the upper limb for fluid infusion, followed by anesthesia induction. Remimazolam (Bath: 250727AP, Hengrui Pharmaceutical, Jiangsu, China) was diluted with 0.9% sodium chloride solution to 2 mg/mL, and etomidate (Bath: TVT25D11, Enhuai Pharmaceutical, Jiangsu, China) was administered by slow intravenous injection directly. According to the dose of each group, remimazolam and etomidate were injected over no more than 10 seconds. For combined medication, the two drugs were injected with an interval of more than 10 seconds, and the infusion tube was flushed with 5 mL of normal saline after the injection of each drug. Evaluation was performed 1 minute after the completion of injection. A positive response, indicating successful sedation, was defined as a BIS value of 45–6014 and a Modified Observer’s Assessment of Alertness/Sedation (MOAA/S) score ≤ 1.15 For a positive response, the dose was reduced by one gradient for the next patient; otherwise, the dose was increased by one gradient. Observation in Phase 1 ended when the 7th crossover (from positive to negative response) was observed after the first crossover. If the patient showed a negative response, 0.05 mg/kg of remimazolam or etomidate was added for rescue sedation. If the patient showed a positive response, sufentanil (Bath: AB5950700821, Renfu Pharmaceutical, Hubei, China) 0.45 μg/kg and rocuronium (Bath: 251202, Fuan Pharmaceutical, Hubei, Chongqing, China) 0.6 mg/kg were administered sequentially, followed by controlled ventilation. After mask ventilation with positive pressure for 3 minutes, tracheal intubation and mechanical ventilation were performed, and then the surgical procedure was carried out.
The incidence of adverse reactions including myoclonus and hiccups was recorded in each subgroup.
Statistical Analysis
The Shapiro–Wilk test was used to assess the normality of continuous data. Normally distributed data were expressed as mean ± standard deviation ( ), while skewed data were expressed as median (interquartile range, IQR).
The unit of analysis was the individual patient, and all observations were independent. All data were analyzed using SPSS 27.0. For intergroup comparisons, normally distributed data were analyzed using one-way analysis of variance (ANOVA). Before performing ANOVA, the Levene test was used to assess the homogeneity of variances. If the variances were homogeneous (P > 0.05), standard ANOVA was applied; if the variances were heterogeneous (P < 0.05), Welch’s ANOVA was used as a correction. Skewed Data were analyzed using the Kruskal–Wallis test. Categorical variables were compared between groups using the chi-square test. A P value < 0.05 was considered statistically significant.
The ED50 and its 95% CI for each group were calculated using the Probit method in SPSS 27.0, with non-overlapping CIs being interpreted as statistically significant.
Isobolograms were drawn to reflect the results of the isobolographic analysis. The ED50 and its 95% CI of etomidate in Group B were plotted on the abscissa, and the ED50 and its 95% CI of remimazolam in Group A were plotted on the ordinate. The line connecting the two ED50 values constituted the additive line, and the line connecting the 95% confidence limits of the two ED50 values constituted the 95% confidence region. The interaction was judged according to the position of the combination point: points to the left and outside the confidence region indicated synergy, points inside indicated additivity, and points to the right and outside the confidence region indicated antagonism. GraphPad Prism 9.0 software was used to draw the sequential plots of ED50 and isobolograms for each group.
The interaction index (R) was used to evaluate the intensity of drug interaction, where R = 1, R > 1, and R < 1 represented additive, synergistic, and antagonistic effects, respectively. The larger the R value, the stronger the synergistic effect. The interaction index values (R) for Groups C, D, and E were calculated by algebraic analysis, as shown in the following formula:

Results
A total of 135 patients were enrolled and randomly assigned to Groups A, B, C, D, and E. Comparisons of age, BMI, and Sex among the five groups are presented in Table 1.
 |
Table 1 Comparison of General Information Among Five Groups |
Age and BMI met the assumptions of normality and homogeneity of variance. ANOVA showed no statistically significant differences in age (F = 0.242, P = 0.914) or BMI (F = 0.434, P = 0.784) among the five groups. No post-hoc pairwise comparisons were performed following ANOVA. The chi-square test revealed no statistically significant difference in sex distribution among the five groups (X2 = 4.098, P = 0.401).
The ED50 (95% CI) of remimazolam for sedation in Group A was 0.193 (0.167–0.253) mg/kg, with the sequential plot shown in Figure 1. The ED50 (95% CI) of etomidate for sedation in Group B was 0.155 (0.118–0.20) mg/kg, with the sequential plot shown in Figure 2. For combined medication: in Group C, the initial dose of remimazolam was 25% of its ED50 (0.048 mg/kg) and that of etomidate was 75% of its ED50; the ED50 (95% CI) of etomidate for sedation in Group C was 0.062 (0.047–0.082) mg/kg calculated by the Probit method. In Group D, the initial dose of remimazolam was 50% of its ED50 (0.096 mg/kg) and that of etomidate was 50% of its ED50; the ED50 (95% CI) of etomidate for sedation in Group D was 0.037 (0.021–0.061) mg/kg. In Group E, the initial dose of remimazolam was 75% of its ED50 (0.147 mg/kg) and that of etomidate was 25% of its ED50; the ED50 (95% CI) of etomidate for sedation in Group E was 0.019 (0.013–0.025) mg/kg. The sequential plots of Groups C, D, and E are shown in Figure 3.
 |
Figure 1 Sequential plot of Group A. Solid black square represents the positive dose; white circle represents the negative dose. |
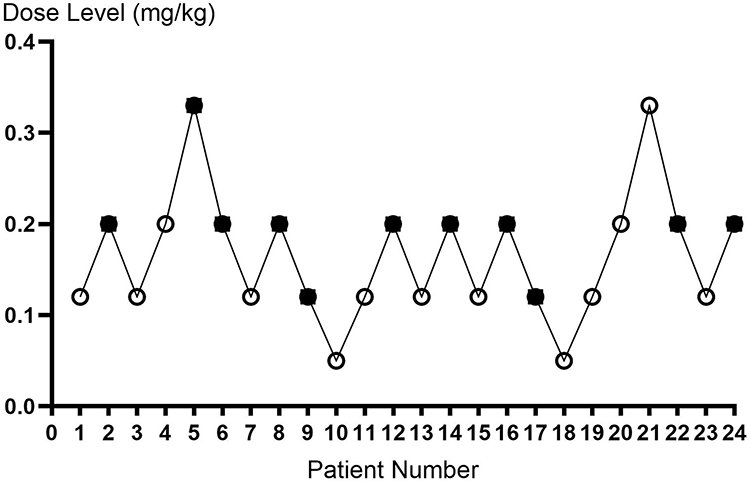 |
Figure 2 Sequential plot of Group B. Solid black square represents the positive dose; white circle represents the negative dose. |
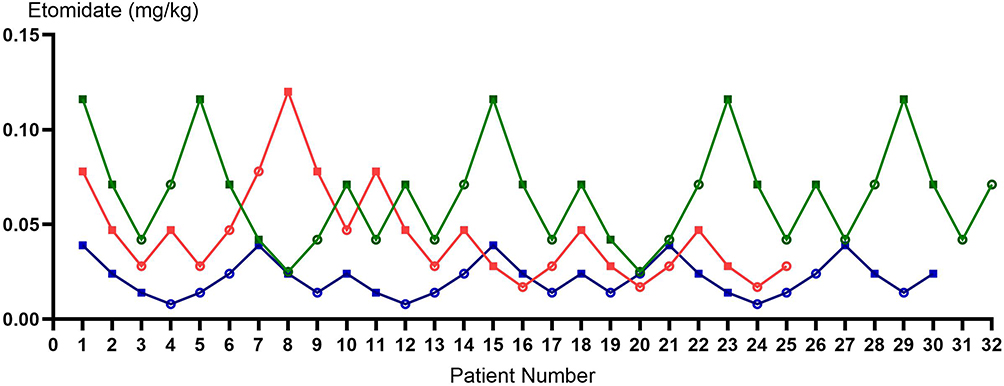 |
Figure 3 Sequential plots of Group C, D, E Green line: Group C; red line: Group D; blue line: Group E. |
Isobolographic analysis showed that Groups C and D exhibited synergistic effects, while Group E exhibited an additive effect, as shown in Figure 4.
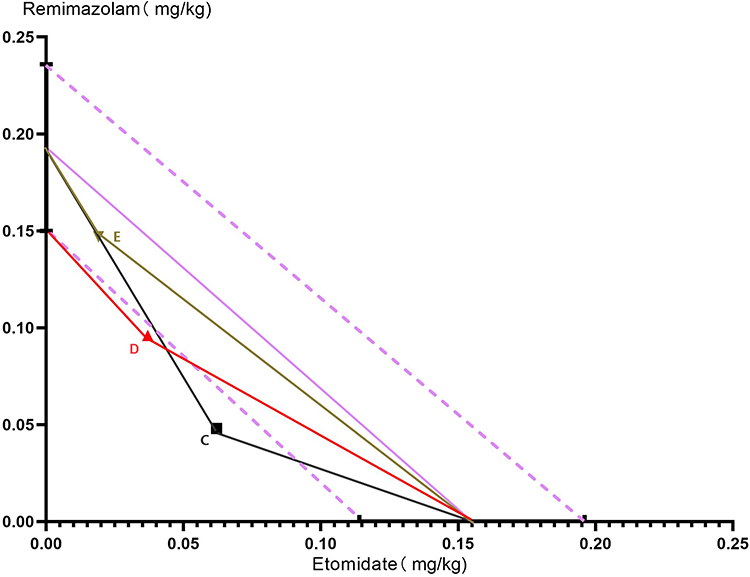 |
Figure 4 Isobologram. Solid purple line: additive isobole; dashed purple line: 95% CI; Solid black square: experimental interaction line of Group C; solid red upright triangle: experimental interaction line of Group D; brown inverted triangle: experimental interaction line of Group E. |
Through algebraic analysis, the interaction indices for the three groups were 1.54, 1.36, and 1.13. Although the calculated value of R for Group E was >1, its 95% CI included 1, so isobolographic analysis classified Group E as additive.
When the doses of remimazolam and etomidate were set at 0.048 mg/kg and 0.062 mg/kg, respectively, the interaction index of the combined administration reached the maximum value, with the strongest synergistic effect observed; accordingly, the optimal dose ratio of remimazolam to etomidate was approximately 1:1.29 (remimazolam: etomidate).
One case of hiccup was observed in Group A, and two cases of myoclonus were observed in Group B. No adverse reactions of remimazolam or etomidate were observed in Groups C, D, and E where remimazolam was administered first.
Discussion
Isobolographic analysis is a commonly used and accurate method for evaluating drug interactions.16 This method first measures the median effective dose of each drug for a specific effect, marks them on the X-axis and Y-axis (representing the potency of the two drugs, respectively), then connects the two single-agent ED50 values to draw a straight line. The type of interaction between them can be accurately determined based on the position of the dose required to achieve the “median effect” (acting on 50% of patients) after combined administration of the two drugs on the isobologram. If the effect point after combined administration of the two drugs lies on the line connecting the two drugs, it indicates an additive effect of the two drugs; if the effect point lies below and to the left of the line, it indicates a synergistic effect; if the effect point lies above and to the right of the line, it indicates an antagonistic effect. This study employed three distinct dose combinations of the two drugs. The results showed that the ED50 intersection points of Groups C and D were to the left of the isobologram line and the 95% confidence interval, suggesting that these two drug dose combinations exhibited synergistic effects, while the ED50 intersection point of Group E was within the isobologram line and its 95% confidence interval, suggesting that this drug dose combination exhibited an additive effect.
Synergism is defined as the combined effect of clinical drugs that substantially exceeds the sum of their individual effects,16 and the interaction index represents the degree of synergism.17 In the present study, the interaction index R was used, where R > 1 indicates synergy and a larger R corresponds to a stronger synergistic effect. Among the three subgroups, Group C had the strongest synergistic effect, indicating that when the dose ratio of remimazolam to etomidate was approximately 1:1.29, the side effects were minimal and the combination was most suitable for clinical application.
BIS was initially developed and validated based on propofol, and its application in benzodiazepines has been questioned.18,19 BIS has a strong dose correlation with anesthetics such as propofol,20 but a weak dose correlation with remimazolam.21 Administration of remimazolam can induce frontal β-wave activation, which may result in relatively high BIS values in some patients even with adequate sedation.22 Unlike other commonly used intravenous anesthetics, the magnitude of BIS values is not entirely equivalent to the depth of anesthesia.18 The sedation-alertness index is evaluated based on the patient’s actual behavioral responses, which is less affected by individual physiological differences,15 and there is a strong positive correlation between BIS and OAA/S in the use of benzodiazepines.23 Their combined use can integrate electroencephalographic signals and behavioral states, reducing evaluation errors caused by individual differences.
Etomidate alone has a high incidence of myoclonus and convulsions. Literature reports that the incidence of myoclonus during etomidate induction is 50–80% in patients without preoperative sedation, while the use of sedatives can reduce the incidence to 25%.24 Remimazolam can reduce etomidate-induced myoclonus.25 As early as 1992, it was known that preoperative use of low-dose sedatives can reduce the incidence of etomidate-induced myoclonus.26 In this study, low-dose remimazolam was administered first for sedation in Groups C, D, and E, which significantly reduced the incidence of etomidate-induced myoclonus.
Chen et al performed isobolographic analysis and demonstrated that etomidate and midazolam exhibited an additive hypnotic effect at a dose ratio of 2:1.27 In the present study, the dose ratios of remimazolam to etomidate were 1:1.29 in Group C, 1:0.39 in Group D, and 1:0.129 in Group E, which showed synergistic, synergistic, and additive effects, respectively. This indicates that the differential drug interactions seen in this study may be related to the predetermined dose of remimazolam.
Both remimazolam and etomidate target the GABAA receptor as the core. However, they act on distinct subunits.28 The molecular structure of remimazolam contains a benzodiazepine ring, which can bind to the extracellular domain interface between the α subunit and γ subunit of the GABAA receptor. After binding, the side chain of the molecule can form hydrogen bonds and hydrophobic interactions with the amino acid residues of the receptor subunit, inducing conformational changes in the receptor. This conformational regulation does not directly open the chloride channel, but enhances the affinity of endogenous GABA for the receptor binding site, improves the efficiency of GABA-mediated channel activation, and ultimately indirectly promotes chloride ion influx, enhancing the central inhibitory effect.29 The etomidate molecule contains an imidazole ring and an ester group, and its active conformation can accurately embed the extracellular-transmembrane junction zone of the β2/β3 subunit of the GABAA receptor. This site does not overlap with the BZ site and is spatially independent. After binding, the etomidate molecule can form specific interactions with key amino acid residues of the β subunit, directly stabilizing the activated conformation of the receptor, prolonging the opening time of the chloride channel without relying on endogenous GABA, significantly increasing the total influx of chloride ions, and producing a potent sedative-anesthetic effect.30
Population pharmacokinetic/pharmacodynamic (PK/PD) modeling of remimazolam for general anesthesia induction and population PK/PD modeling of short-term etomidate infusion in healthy volunteers have both shown that the dose-effect relationships of the two drugs conform to the E-max model,31,32 suggesting that the binding sites of GABAA receptors are limited.
We hypothesize that under sub-saturating conditions at GABAA receptors, remimazolam increases the channel opening frequency, while etomidate prolongs the mean open duration. By independently modulating these two distinct kinetic parameters, the drugs produce a molecular-level superposition of effects. This synergy significantly enhances total chloride influx per unit time, thereby intensifying neuronal membrane hyperpolarization and amplifying central inhibition. Crucially, since neither agent has reached receptor saturation, this synergistic potentiation operates below the ceiling effect imposed by limited receptor availability.
However, when a higher concentration of remimazolam is administered first, although the binding sites of the two are independent, there may be molecular-level spatial conflicts between the receptor conformations induced by the two. The GABAA receptor has saturation. It is speculated that after high-concentration remimazolam occupies most of the α-γ interface sites, even if etomidate binds to the unsaturated β subunits, the corresponding receptors may not form effective activation due to the binding of remimazolam, thus showing a simple additive effect. However, this speculation needs to be confirmed by more subsequent studies.
This study has the following limitations: (1) it is a single-center study; (2) only the effects near ED50 were studied; (3) BIS and sedation-alertness scores are only observational indicators of clinical anesthesia, and the interaction between other clinical endpoints needs further research. Studying multi-drug combination strategies has more advantages in clinical work. The combined application of BIS and sedation-alertness scores make the outcomes more accurate, and observing the incidence of adverse reactions greatly increases clinical applicability.
Conclusion
During general anesthesia induction, when the dose ratios of remimazolam to etomidate are approximately 1:1.29 and 1:0.39, the two drugs exert a synergistic sedative effect, with the strongest synergism observed at the dose ratio of 1:1.29.
Abbreviations
ASA, American Society of Anesthesiologists; BMI, Body Mass Index; ED50 the median effective dose; 95% CI 95% confidence interval; BIS bispectral index; MOAA/S Modified Observer’s Assessment of Alertness/Sedation.
Data Sharing Statement
De-identified individual participant data, study protocols, and statistical analysis files are available from the corresponding author upon reasonable request. Relevant materials will be retained and accessible for 5 years after official publication.
Author Contributions
All authors made a significant contribution to the work reported, whether that is in the conception, study design, execution, acquisition of data, analysis and interpretation, or in all these areas; took part in drafting, revising or critically reviewing the article; gave final approval of the version to be published; have agreed on the journal to which the article has been submitted; and agree to be accountable for all aspects of the work.
Funding
There is no funding to report.
Disclosure
The authors have no competing interests to declare.
References
1. Lichtenbelt BJ, Olofsen E, Dahan A, et al. Propofol reduces the distribution and clearance of midazolam. Anesth Analg. 2010;110:1597–9. doi:10.1213/ANE.0b013e3181da91bb
2. Vuyk J, Lichtenbelt BJ, Olofsen E, et al. Mixed-efects modeling of the influence of midazolam on propofol pharmacokinetics. Anesth Analg. 2009;108:1522–1530. doi:10.1213/ane.0b013e31819e4058
3. Mihalj M, Karlović Z, Vladić-Spaić D, et al. Effects of midazolam co-induction to general anesthesia: a randomized clinical trial. Medicine. 2022;101(45):e31400. doi:10.1097/MD.0000000000031400
4. Hu Q, Liu X, Wen C, Li D, Lei X. Remimazolam: an updated review of a newsedative and anaesthetic. Drug Des Devel Ther. 2022;16:3957–3974. doi:10.2147/DDDT.S384155
5. Aszkiełowicz A, Kapłan C, Kapica P, Marszałek R. Remimazolam: a comprehensive review. Anaesthesiol Intensive Ther. 2025;57(1):257–266. doi:10.5114/ait/210611
6. Dai G, Pei L, Duan F, et al. Safety and efficacy of remimazolam compared with propofol in induction of general anesthesia. Minerva Anestesiol. 2021;87(10):1073–1079. doi:10.23736/S0375-9393.21.15517-8
7. Ebert TJ, Muzi M, Berens R, et al. Sympathetic responses to induction of anesthesiain humans with propofol or etomidate. Anesthesiology. 1992;76(5):725–733. doi:10.1097/00000542-199205000-00010
8. Hendrickx JF, Eger EI 2nd, Sonner JM, Shafer SL. Is synergy the rule? A review of anesthetic interactions producing hypnosis and immobility. Anesth Analg. 2008;107(2):494–506. doi:10.1213/ane.0b013e31817b859e
9. Dixon WJ. Staircase bioassay: the up-and-down method. Neurosci Biobehav Rev. 1991;15(1):47–50. doi:10.1016/s0149-7634(05)80090-9
10. Pace NL, Stylianou MP, Warltier DC. Advances in and limitations of up-and-down methodology: a précis of clinical use, study design, and dose estimation in anesthesia research. Anesthesiology. 2007;107(1):144–152. doi:10.1097/01.anes.0000267514.42592.2a
11. Antonik LJ, Goldwater DR, Kilpatrick GJ, Tilbrook GS, Borkett KM. A placebo- and midazolam-controlled Phase I single ascending-dose study evaluating the safety, pharmacokinetics, and pharmacodynamics of remimazolam (CNS 7056): part I. Safety, efficacy, and basic pharmacokinetics. Anesth Analg. 2012;115(2):274–283. doi:10.1213/ANE.0b013e31823f0c28
12. Chen H, Pan NL, Cui XL. The hypnotic ED50 of etomidate determined with spot-slope method and sequential method during induction of general anesthesia. J Clin Anesthesiol. 2006;22(11):813–815.
13. Görges M, Zhou G, Brant R, Ansermino JM. Sequential allocation trial design in anesthesia: an introduction to methods, modeling, and clinical applications. Paediatr Anaesth. 2017;27(3):240–247. doi:10.1111/pan.13088
14. Zorrilla-Vaca A, Healy RJ, Wu CL, Grant MC. Relation between bispectral index measurements ofanesthetic depth and postoperative mortality: a meta-analysis of observational studies. Can J Anaesth. 2017;64(6):597–607. doi:10.1007/s12630-017-0872-6
15. Benzoni T, Agarwal A, Cascella M. Procedural Sedation. In: StatPearls. Treasure Island (FL): StatPearls Publishing; 2025.
16. Huang RY, Pei L, Liu Q, et al. Isobologram analysis: a comprehensive review of methodology and current research. Front Pharmacol. 2019;10:1222. doi:10.3389/fphar.2019.01222
17. Tallarida RJ. The interaction index: a measure of drug synergism. Pain. 2002;98(1–2):163–168. doi:10.1016/s0304-3959(02)00041-6
18. Jang Y, Du JL, Zong XM. Application of bispectral index in monitoring the depth of anesthesia with remimazolam. Pract Pharm Clin Remedies. 2025;28(09):710–714. doi:10.14053/j.cnki.ppcr.202509014
19. Liu J, Singh H, White PF. Electroencephalographic bispectral index correlates with intraoperative recall and depth of propofol-induced sedation. Anesth Analg. 1997;84(1):185–189. doi:10.1097/00000539-199701000-00033
20. Kasuya Y, Govinda R, Rauch S, Mascha EJ, Sessler DI, Turan A. The correlation between bispectral index and observational sedation scale in volunteers sedated with dexmedetomidine and propofol. Anesth Analg. 2009;109(6):1811–1815. doi:10.1213/ANE.0b013e3181c04e58
21. Choi BM, Lee JS, Kim KM, et al. Frequency and characteristics of patients with bispectral index values of 60 or higher during the induction and maintenance of general anesthesia with remimazolam. Sci Rep. 2023;13(1):9992. doi:10.1038/s41598-023-37150-9
22. Doi M, Hirata N, Suzuki T, et al. Safety and efficacy of remimazolam in induction and maintenance of general anesthesia in high-risk surgical patients (ASA Class III): results of a multicenter, randomized, double-blind, parallel-group comparative trial. J Anesth. 2020;34(4):491–501. doi:10.1007/s00540-020-02776-w
23. Shah P, Manley G, Craig D. Bispectral index (BIS) monitoring of intravenous sedation for dental treatment. SAAD Dig. 2014;30:7–11.
24. Doenicke AW, Roizen MF, Kugler J, et al. Reducing myoclo-nus after etomidate. Anesthesiology. 1999;90(1):113–119. doi:10.1097/00000542-199901000-00017
25. Han BJ, Shen BW, Wang HX, Li YH, Gao CJ, Zhao XH. Median effective dose of remimazolam to prevent etomidate-induced myoclonus in elderly patients. Chin J Mult Organ Dis Elderly. 2023;22(03):191–195.
26. Li J, Liu Y, Chen S, Dai X, Wang J. Pharmacological agents for procedural sedation and analgesia in patients undergoing gastrointestinal endoscopy: a systematic review and network meta-analysis. EClinicalMedicine. 2025;85:103307. doi:10.1016/j.eclinm.2025.103307
27. Li HH, Chen H, Pan HL. Study of the interactions between etomidate and midazolam by isobolographic analysis. Med Pharm J Chin P L A. 2005(05):11–13.
28. Carter CR, Kozuska JL, Dunn SM. Insights into the structure and pharmacology of GABA(A) receptors. Future Med Chem. 2010;2(5):859–875. doi:10.4155/fmc.10.178
29. Philip AB, Brohan J, Goudra B. The role of GABA receptors in anesthesia and sedation: an updated review. CNS Drugs. 2025;39(1):39–54. doi:10.1007/s40263-024-01128-6
30. Brohan J, Goudra BG. The role of GABA receptor agonists in anesthesia and sedation. CNS Drugs. 2017;31(10):845–856. doi:10.1007/s40263-017-0463-7
31. Zhou J, Leonowens C, Ivaturi VD, et al. Population pharmacokinetic/pharmacodynamic modeling for remimazolam in the induction and maintenance of general anesthesia in healthy subjects and in surgical subjects. J Clin Anesth. 2020;66:109899. doi:10.1016/j.jclinane.2020.109899
32. Kaneda K, Yamashita S, Woo S, Han TH. Population pharmacokinetics and pharmacodynamics of brief etomidate infusion in healthy volunteers. J Clin Pharmacol. 2011;51(4):482–491. doi:10.1177/0091270010369242
 © 2026 The Author(s). This work is published and licensed by Dove Medical Press Limited. The
full terms of this license are available at https://www.dovepress.com/terms
and incorporate the Creative Commons Attribution
- Non Commercial (unported, 4.0) License.
By accessing the work you hereby accept the Terms. Non-commercial uses of the work are permitted
without any further permission from Dove Medical Press Limited, provided the work is properly
attributed. For permission for commercial use of this work, please see paragraphs 4.2 and 5 of our Terms.
© 2026 The Author(s). This work is published and licensed by Dove Medical Press Limited. The
full terms of this license are available at https://www.dovepress.com/terms
and incorporate the Creative Commons Attribution
- Non Commercial (unported, 4.0) License.
By accessing the work you hereby accept the Terms. Non-commercial uses of the work are permitted
without any further permission from Dove Medical Press Limited, provided the work is properly
attributed. For permission for commercial use of this work, please see paragraphs 4.2 and 5 of our Terms.