")
Back to Journals » Therapeutics and Clinical Risk Management » Volume 14
Is ischemia-modified albumin a reliable tool for the assessment of acute pancreatitis?
Authors Sahin A , Turkoglu S, Tunc N , Duzenci D, Arslan Solmaz O, Bahcecioglu IH, Yalniz M
Received 16 January 2018
Accepted for publication 22 February 2018
Published 29 March 2018 Volume 2018:14 Pages 627—635
DOI https://doi.org/10.2147/TCRM.S162690
Checked for plagiarism Yes
Review by Single anonymous peer review
Peer reviewer comments 2
Editor who approved publication: Professor Garry Walsh
Abdurrahman Sahin,1 Semra Turkoglu,2 Nurettin Tunc,1 Deccane Duzenci,3 Ozgen Arslan Solmaz,4 Ibrahim Halil Bahcecioglu,1 Mehmet Yalniz1
1Medicine Faculty, Department of Gastroenterology, Firat University, Elazig, Turkey; 2Department of Nutrition and Dietetics, Health Sciences Faculty, Firat University, Elazig, Turkey; 3Department of Internal Medicine, Elazig Education and Training Hospital, Elazig, Turkey; 4Department of Pathology, Elazig Education and Training Hospital, Elazig, Turkey
Purpose: Oxidative stress has been implicated in several disorders, including acute pancreatitis (AP). Ischemia-modified albumin (IMA), which reflects the ability to bind cobalt, has been found to be elevated in conditions of oxidative stress and tissue hypoxia. This study examined IMA and adjusted IMA levels in patients with AP, and examined the associations of IMA and adjusted IMA levels to the severity of AP.
Patients and methods: A total of 42 consecutive patients with AP and 43 age- and sex-matched control subjects were enrolled. Serum samples were obtained from patients with AP on admission as well as 48–72 hours after hospitalization, and from the controls, at the time of enrollment. Adjusted IMA was calculated by multiplying the IMA value of each patient with the ratio of the patient’s albumin value and the median albumin value of the study population. The severity of AP was assessed according to the modified Atlanta classification, and the patients were divided into 2 groups: mild AP and severe AP.
Results: The serum IMA and adjusted IMA values of patients with AP on admission and those of the controls did not differ (p=0.86 and p=0.99, respectively). The second measurements of IMA and adjusted IMA in the AP group were higher than the first measurements of both the AP group and controls (for all, p<0.01). Among the IMA measurements, only adjusted IMA on admission had the ability to predict the severity of AP. Severe AP was correlated with albumin, and the area under the curve of adjusted IMA values on admission was 0.746 for differentiating patients with severe AP from mild AP with statistical significance (p=0.005).
Conclusion: It was shown that IMA and adjusted IMA levels rise with the progression of AP. Lower levels of adjusted IMA predict the severity of AP. Further studies with serial measurements of IMA are warranted to explore the indicative role of IMA in the course of AP.
Keywords: ischemia modified albumin, adjusted ischemia modified albumin, acute pancreatitis, severity
Introduction
Acute pancreatitis (AP) is the sterile, localized inflammation of the pancreas and has a highly variable clinical course. Releasing active pancreatic enzymes into the bloodstream and stimulating the production of inflammatory cytokines are key events in the development of inflammatory cascade, which leads to systemic inflammatory response syndrome.1 In about 75% of patients, AP appears as a benign, self-limiting inflammatory reaction accompanied by pancreatic edema. The remaining 25% suffer from severe necrosis, and this group of patients shows a longer hospital stay, higher morbidity, and even mortality, which can reach up to 30%.2 The prognosis of AP depends on the degree of pancreatic necrosis and the intensity of multisystem organ failure generated by the systemic inflammatory response.
The early risk assessment of patients with AP using reliable methods is necessary to predict the clinical outcome and to reduce patient mortality and morbidity.3 For this purpose, several laboratory parameters and multi-factorial scoring systems have been used to predict the severity of AP and patient prognosis.4,5 The most widely used scoring systems are the Atlanta classification and the Ranson criteria.1,6 Aside from these scoring systems, many other scoring systems have also been used in clinical practice.7 Although these scoring systems can help to predict the severity of AP, they are sophisticated tools that require many clinical and laboratory parameters.
Releasing active pancreatic enzymes into the bloodstream initiates an inflammatory cascade, which is involved in stimulating the production of many inflammatory cytokines, including interleukins and tumor necrosis factor-α.8 This cytokine storm can be determined by several serum markers.5 C-reactive protein (CRP) is the most widely studied and used serum marker to assess the severity of AP.9 Aside from CRP, many other acute-phase reactants and inflammatory markers, including cytokines, have been studied to assess the severity of AP. However, none of them are the gold standard for monitoring disease course and for predicting organ failure and mortality.5
Despite being the products of normal cell metabolism, the overproduction of reactive oxygen species (ROS) causes oxidative stress.10 The increase in ROS in the early stages of AP with the reduction of antioxidants is thought to play a prominent role in the in the pathogenesis of AP.11 Ischemia and the generation of ROS can alter the ability of the N-terminal region of the albumin molecule to bind transitional metallic ions, such as cobalt, copper, and nickel, and this modification results in the formation of ischemia-modified albumin (IMA).12 Elevation of IMA was initially described in ischemic disorders, such as acute coronary syndrome, pulmonary embolism, stroke, and mesenteric ischemia.13,14 Recently, several studies investigated the IMA levels in disorders in which oxidative stress plays an important role in the pathogenesis, including diabetes, cirrhosis, end-stage renal disease, sepsis, and inflammatory bowel disease.15–19 This study aims to compare the serum IMA levels of patients with AP and healthy controls, and to investigate IMA as a marker of disease severity.
Patients and methods
Study population
A total of 42 consecutive patients who were diagnosed with AP and 43 sex- and age-matched healthy control subjects were enrolled to the study between July 2017 and December 2017. After obtaining written informed consent from the participants and the approval of the institutional review board of Firat University Faculty of Medicine (09/02, June 8, 2017), the study was conducted in accordance with the Declaration of Helsinki. Patients were diagnosed with AP based on the combination of clinical (acute, severe upper abdominal pain, often radiating to the back), laboratory (serum amylase or lipase levels >3 times the upper limit of normal), and radiological (abdominal imaging consistent with AP) findings. After the hospitalization of patients with AP, the course of the disease was noted, including the presence of local complications, the emergence of organ failure, duration of hospitalization, duration of nil per mouth or cessation of eating or drinking, and death. The severity of AP was assessed according to the Ranson criteria and revised using the Atlanta classification of 2012. According to the Atlanta classification, AP is divided into mild AP, which is defined as the absence of organ failure and local or systemic complications; moderately severe AP, which is defined as the absence of or transient organ failure for <48 hours, with or without local complications; and severe AP, which is defined as persistent organ failure for >48 hours that may involve one or multiple organs.1 In this study, patients with AP were divided into 2 groups according to AP severity: mild AP (MAP) (acronym use is according to the modified Atlanta classification) and severe AP (SAP) (moderately severe AP and severe AP, according to the modified Atlanta classification).
Laboratory analysis
Blood samples were taken from control subjects between 8:30 and 10:30 am after fasting for 8–12 hours and from patients with AP upon admission (first measurements) and 48–72 hours following admission (second measurement). Complete blood counts and CRP levels, routine examination results for aspartate aminotransferase (AST), alanine aminotransferase (ALT), bilirubin, amylase, blood urea nitrogen (BUN), creatinine, albumin, calcium, and glucose were obtained. Common blood counts, biochemical parameters, and CRP were studied on the same day using standard laboratory methods in central laboratories and using standard automated methods. Common blood counts, including white blood cell (WBC) count, polymorphonuclear leucocyte (PMNL) count, lymphocyte count, hemoglobin count, hematocrit count, and platelet count were measured automatically using standard methods with a Siemens Advia 2120i Hematology system (Siemens Healthcare Diagnostic Inc., Tarrytown, NY, USA). Biochemical studies were performed using photometric methods with an Olympus AU 2700 autoanalyzer (Olympus Corporation, Tokyo, Japan). CRP levels were measured nephelometrically using a DIAsource ImmunoAssays SA, Louvain-la-Neuve, Belgium.
IMA measurements
Serum samples were collected from patients with AP and control subjects at the time of venipuncture for taking routine blood samples. The serum samples that were taken for the measurement of IMA were centrifuged for 6 minutes at 5,000 rpm, and the obtained 1–2 mL serum samples were stored at −80°C until the study day. IMA level was measured using a colorimetric assay developed by Bar-Or et al, which is based on the measurement of unbound cobalt after incubation with the patient’s serum.20 According to this method, 50 μL of cobalt dichloride reagent was added to 200 μL of serum and incubated for 10 minutes. During the incubation period, cobalt bound to the N-terminal of unmodified albumin. Fifty microliters of dithiothreitol (DTT), at a concentration of 1.5 mg/mL, was added as a colorizing agent, and the reaction was stopped 2 minutes later by adding 1.0 mL of 0.9% NaCl. The colored product was measured at 470 nm and compared to a serum-cobalt blank without DTT and reported in absorbance units. An adjusted IMA was used to eliminate the effect of albumin on IMA. An adjusted IMA was calculated by multiplying each individual’s IMA value with the value of each individual’s serum albumin concentration/the median serum albumin concentration of the population.21 The median serum albumin values of each group at admission and 48–72 hours following admission were used separately.
Statistical analysis
All statistical analyses were carried out using SPSS version 22 (SPSS Inc., Amrok, NY, USA). The normality of variables was investigated by properly using the Kolmogorov–Smirnov and Shapiro–Wilk tests. Variables with a normal distribution were represented as mean ± SD; those with a non-normal distribution and ordinal variables were described as median ± SE or interquartile range (25%–75%), unless otherwise stated. The Student’s t-test was used for normally distributed parameters, whereas for non-normally distributed factors, the Mann–Whitney U-test was used to compare the 2 groups. The paired sample t-test and the Wilcoxon test were used to compare 2 dependent variables. The correlation of severity of AP with laboratory markers, including IMA and adjusted IMA, was assessed using Spearman’s correlation coefficient. The area under the receiver operating characteristic curve (AUROC) was used to assess the predictive accuracy of the laboratory markers to demonstrate SAP. AUROC was calculated using the 95% CI. Sensitivity, specificity, positive predictive value, and negative predictive value were also calculated. A p-value of <0.05 was considered statistically significant.
Results
The demographic and clinical features of patients with AP and control subjects were presented in Table 1. When the patient and control groups were compared, there was no difference in terms of age, sex, or body mass index. The most common etiology of AP was biliary (81%). The severity of AP was classified as mild in 23 patients (54.8%), moderately severe in 13 patients (30.9%) and severe in 6 patients (14.3%). One patient (24.4%) died from AP due to multi-organ failure.
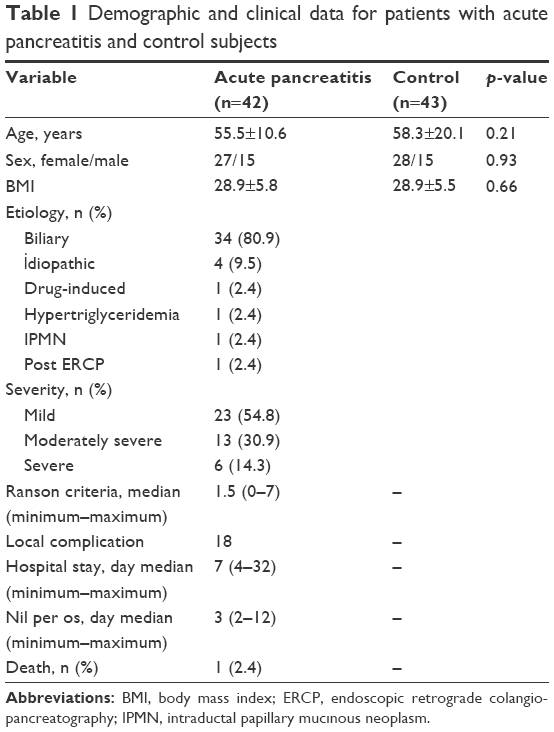 | Table 1 Demographic and clinical data for patients with acute pancreatitis and control subjects |
Laboratory data are given in Table 2. On comparison of the laboratory values of patients with AP on admission and control group, leucocyte and its subgroups’ – CRP, ALT, AST, glucose, albumin, and calcium – values had statistically significant differences (for all, p<0.01). When first measurements and second measurements of patients with AP were compared, all CBC parameters, CRP values, and biochemical values were significantly different. While WBC, PMNL and platelet counts, hemoglobin, hematocrit glucose, ALT, AST, albumin, BUN, creatinine, and calcium values were decreasing, lymphocyte count and CRP values increased (for all, p<0.05).
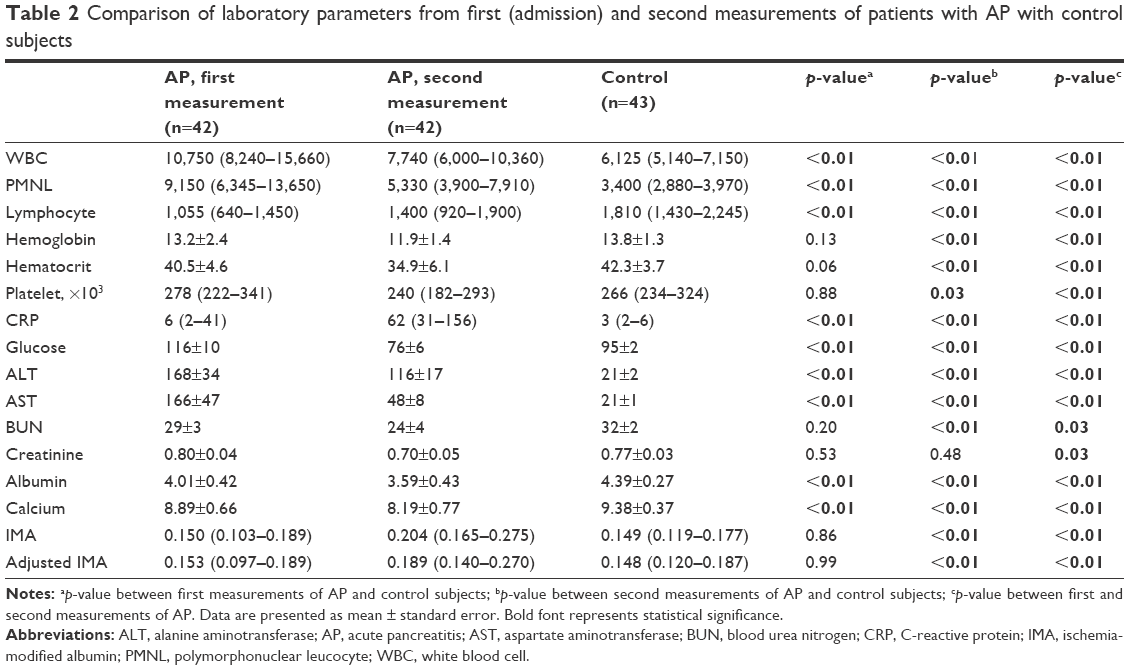 | Table 2 Comparison of laboratory parameters from first (admission) and second measurements of patients with AP with control subjects |
Among patients with AP, first and second measurements of IMA and adjusted IMA according to the severity of AP are presented in Figure 1. The median (interquartile range) IMA levels were higher in the second measurements compared with first measurements (0.204 [0.165–0.275] vs 0.150 [0.103–0.189], respectively; p<0.01). Similarly, the adjusted IMA levels in the second measurements of AP were also higher than those of the first measurements (0.189 [0.140–0.270] vs 0.153 [0.097–0.189], respectively; p<0.01). Although there was no difference between the median IMA level of AP group and control group (0.150 [0.103–0.189] vs 0.149 [0.119–0.177], respectively; p=0.86) at first measurement, the median IMA level of AP group was higher than of control subjects (0.204 [0.165–0.275] vs 0.149 [0.119–0.177], respectively; p<0.01) at second measurement. On comparison of adjusted IMA levels between the groups, the median adjusted IMA levels did not differ between first measurement of patients with AP and control group (0.153 [0.097–0.189] vs 0.148 [0.120–0.187], respectively; p=0.99). On the other hand, at the second measurement, median adjusted IMA levels of the AP group was higher than that of the control group (0.189 [0.140–0.270] vs 0.148 [0.120–0.187], respectively; p<0.01). The IMA and adjusted IMA levels of groups are presented in Figure 2.
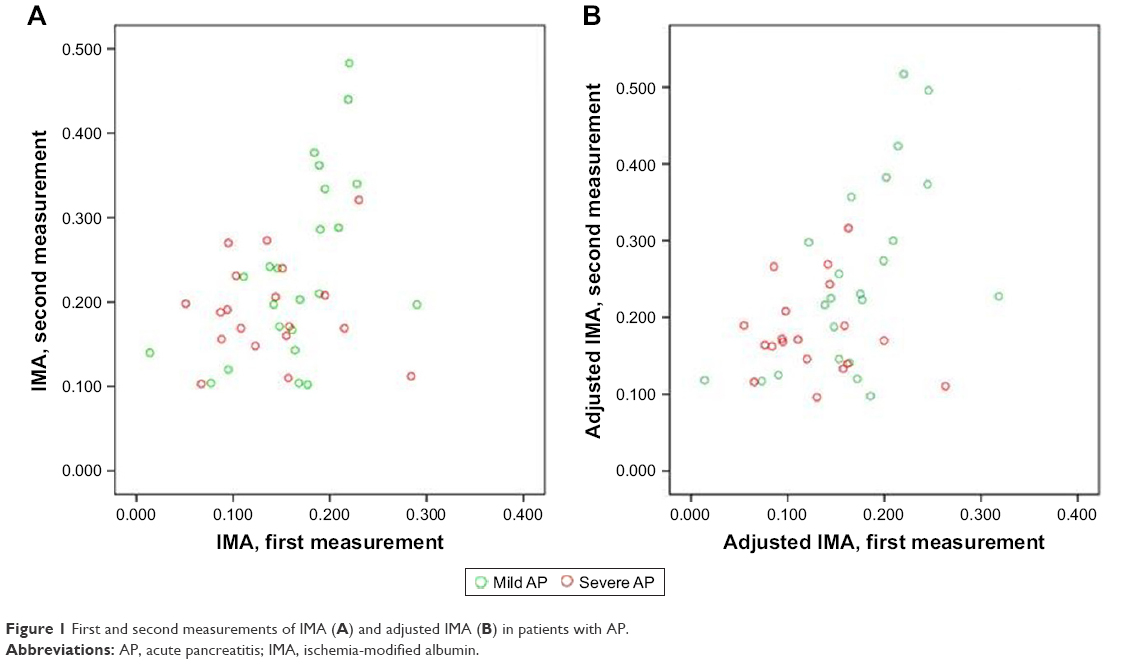 | Figure 1 First and second measurements of IMA (A) and adjusted IMA (B) in patients with AP. |
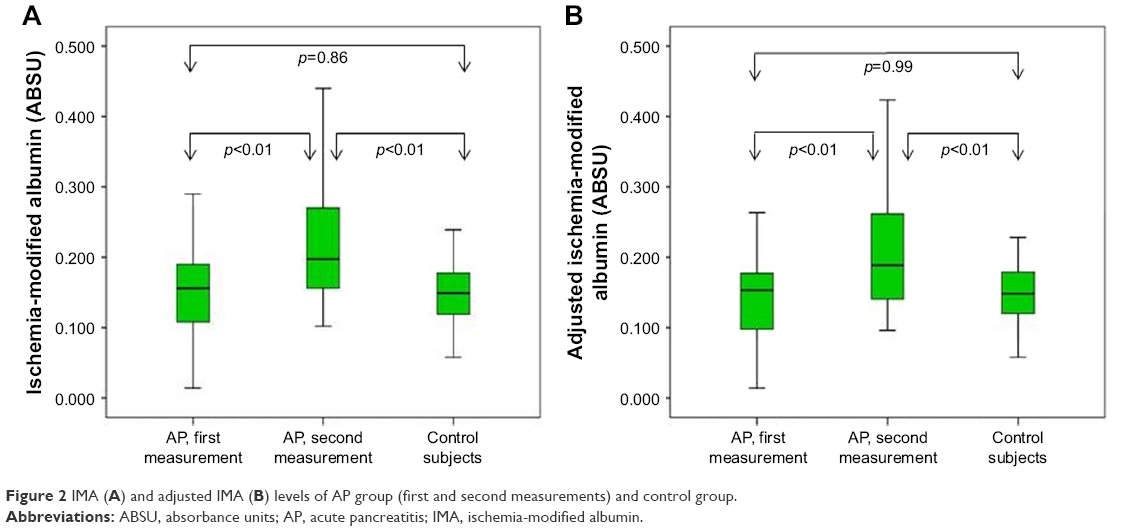 | Figure 2 IMA (A) and adjusted IMA (B) levels of AP group (first and second measurements) and control group. |
According to the modified Atlanta classification, the MAP group consisted of 23 patients and the SAP group patients had 19 patients. On comparison of the MAP and the SAP groups, the WBC and PMNL counts, and CRP values did not differ between the groups at both the first and secondary measurements (for all, p>0.05; Table 3). On the other hand, the albumin and calcium values of the patients in the MAP group were higher, and the BUN values were lower than those of patients in the SAP group at both the first and second measurements (for all, p<0.05). The only significant difference found was in the adjusted IMA values on admission in the IMA measurements. The adjusted IMA values on admission were higher in the MAP group compared with the SAP group (0.174 [0.148–0.209] vs 0.120 [0.090–0.158]; p<0.01). Although these results do not have statistical significance, other IMA-related measurements were also higher in the MAP group.
 | Table 3 Demographic and laboratory data of patients with mild and severe AP |
The AUROC analysis (applied to predict cases of SAP) showed that the predictive value of adjusted IMA on admission (AUROC; 0.746) was comparable with albumin, calcium, and BUN values on admission (AUROC, 0.746, 0.699, 0.760, respectively) and second measurements (AUROC, 0.762, 0.748, 0.684, respectively). AUROC analyses of significant parameters to predict SAP are given in Table 4.
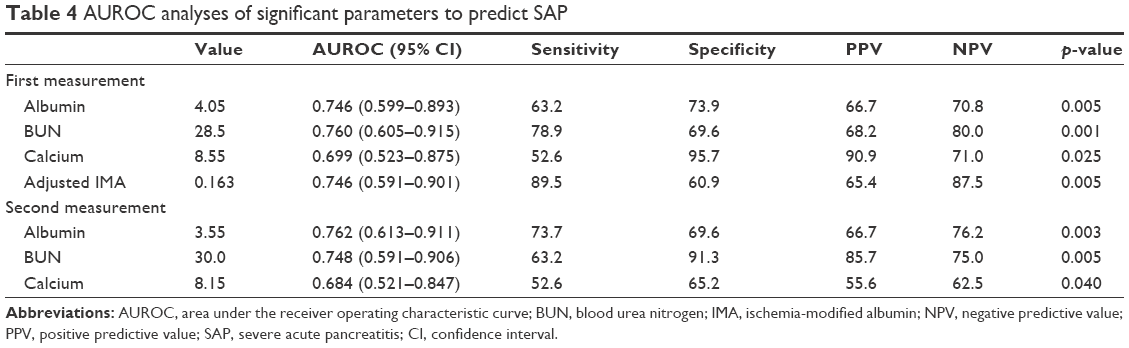 | Table 4 AUROC analyses of significant parameters to predict SAP |
Discussion
The results of this study show that the IMA and adjusted IMA measurements 48–72 hours after admission were significantly higher than that of the IMA values of admission in both patients with AP and controls. The lower adjusted IMA measurements on admission were associated with severe AP.
IMA is a form of serum albumin in which the N-terminal amino acids are unable to bind to transition metals. In ischemia, the generation of free radicals and acidosis results in changes in the ability of the N-terminus of albumin to bind to transition metal ions and to initiate IMA generation.12 Ischemia and oxidative stress are the major determinants of forming IMA, and an increase in serum IMA levels was demonstrated in ischemic disorders and in disorders that oxidative stress contributes to its pathogenesis.13,14 Oxidative stress and the production of free radicals are responsible for the progression of pancreatic inflammation, and triggering the generation of inflammatory cytokines is the key event in the pathogenesis of acute pancreatitis.10,22
A few studies in the literature evaluate IMA in AP. An increase in serum IMA levels in AP was demonstrated in both animal and human studies.23,24 We demonstrated in this study that IMA levels at 48–72 hours after admission, but not on admission, were higher in patients with AP. Data demonstrating the kinetics of serum IMA levels come from acute ischemia-related disorders. Das et al demonstrated a decrease in IMA levels with treatment among those followed for carbon monoxide poisoning.25 In this study, IMA levels were the highest on admission and decreased significantly at the first, third and sixth hour from previous levels and were similar to that of the control subjects at the sixth hour of admission with the treatment. Gunduz et al also demonstrated gradually increasing IMA levels at 6th, 12th, and 24th hours among patients with acute stroke.26 The results of the mentioned studies indicate that IMA levels change over time with the grade of oxidative stress and tissue hypoxia. Our results suggest that oxidative stress at the beginning of AP may not be enough to cause an increase in the serum levels of IMA. Accelerating the production of free radicals, oxidative stress, and tissue hypoxia may result in higher IMA concentrations in the sera from patients with AP.
One of the results of this study was that the adjusted IMA levels of patients with SAP on admission were significantly lower than that of patients with MAP. Moreover, although they do not show any statistical significance, IMA levels were lower in patients with SAP than in patients with MAP at both the first and second measurements. In a recent study, serum IMA levels were found not to be correlated with the severity of AP.27 Although the correlation of IMA levels with the degree of tissue hypoxia and organ failure in patients with severe sepsis exists, a conflicting result by Li et al demonstrated among patients with carbon monoxide poisoning that more severe poisoning and more severe heart and other organ damages were associated with lower IMA levels in the serial measurements of IMA.18,28 It seems that the duration and severity of tissue hypoperfusion and the cause of oxidative stress and concomitant disorders influence serum IMA level and its kinetics. We conclude that the type of underlying mechanism that causes a rise in serum IMA levels, such as tissue hypoxia, hypoperfusion, inflammation, and oxidative injury, determines serum IMA kinetics. The mechanism of production of IMA in AP is complex and not clear as of yet. However, it may be influenced by a combination of oxidative stress, mitochondrial dysfunction, systemic inflammatory stress syndrome, secondary infections, anti-inflammatory responses, and hypoalbuminemia.
In normal circumstances, serum IMA levels are negatively correlated with serum albumin levels.29 Serum IMA levels should be interpreted cautiously in the states of hypoalbuminemia and hyperalbuminemia that result from hemodilution, hemoconcentration, and various diseases or physiological conditions.29,30 The inflammatory processes in AP results in a lowering effect on serum albumin concentrations. However, the underlying mechanisms are not yet fully understood.31 Some of the hypotheses include the following. First, the liver synthesizes CRP and several other cytokines, and that albumin synthesis is decreased at acute inflammation. Second, inflammatory processes and mediators increase vascular permeability and then allow the extravasation of large molecular weight proteins, such as albumin, into the tissues. Finally, stopping enteral nutrition, together with accompanying hypercatabolism may contribute hypoalbuminemia. As the effect of albumin is eliminated with the calculation of the adjusted IMA, it is more reliable than IMA in the evaluation of oxidative stress in disorders that affect serum albumin concentrations.
Although CRP is demonstrated to be a marker of SAP at levels over 150 mg/L, we could not find any difference between the patients in the MAP group and the SAP group in terms of CRP levels and WBC counts for both measurements.5 On the other hand, patients with AP in SAP group had higher BUN values, and lower albumin and calcium values at both measurements, as well as lower adjusted IMA values on admission. Some of the components of the Ranson criteria, including BUN, calcium, and serum albumin, were reported in previous studies as independent predictors of persistent organ failure and SAP.31–35 As a marker of oxidative stress and ischemia, IMA levels in conjunction with serum albumin, which is named adjusted IMA, may be a useful predictor of the severity of AP.
Limitations
There are some limitations to our study, including the small case numbers of the study population. Since both the moderately severe and severe AP group had a small number of patients, these 2 groups were assessed as 1 group in the current study. On the other hand, it is demonstrated that moderately severe AP, which is defined as the absence or transient organ failures with or without local complications, has a self-limited clinical course similar to mild AP rather than severe AP.36 Further studies are required with larger numbers of patients to determine the role of serum IMA levels in differentiating mild AP, moderately severe AP, and severe AP from each other. Second, the differences in the albumin values of patients with AP and control subjects may influence the serum IMA levels. Subjects in the control group with similar albumin values were enrolled in this study to eliminate the effect of serum albumin values on IMA levels. Unfortunately, age- and sex-matched subjects, irrespective of albumin values, were enrolled in this study as a control group. Further studies are needed on groups with similar serum albumin values. Third, the development of organ failure, which increases serum IMA levels among patients in the AP group, including ischemic events – such as myocardial ischemia, venous thromboembolism, or acute ischemic cerebrovascular disease – could not be assessed independently. Exploring the effects of ischemic organ involvements and inflammatory response syndrome on serum IMA levels in patients with AP needs to be done separately. Until then, our conclusions may not be validated for patients with AP. Another limitation is that albumin cobalt binding assay, which has been used for many years for IMA measurement, has several deficiencies.37,38 Hence, this method may not reflect the accurate N-terminus binding affinity of cobalt for albumin. Finally, we demonstrated in this study that the IMA measurements on admission and from 48 to 72 hours were different. Studies investigating the effect of serial measurements of the IMA levels to demonstrate the course of AP are warranted.
Conclusion
The findings from this study reveal that, while there is no increase in the baseline IMA measurements, serum IMA measurements between 48 and 72 hours increased in AP. Lower adjusted IMA values indicate the progression of disease and the development of SAP. These results need to be validated in further studies. Use of adjusted IMA, a form of IMA that is corrected according to serum albumin level, is a more reliable approach in disorders related to hypoalbuminemia, such as AP.
Disclosure
The authors report no conflicts of interest in this work.
References
Banks PA, Bollen TL, Dervenis C, et al; Acute Pancreatitis Classification Working Group. Classification of acute pancreatitis-2012: revision of the Atlanta classification and definitions by international consensus. Gut. 2013;62(1):102–111. | ||
Chen Y, Zak Y, Hernandez-Boussard T, Park W, Visser BC. The epidemiology of idiopathic acute pancreatitis, analysis of the nationwide inpatient sample from 1998 to 2007. Pancreas. 2013;42(1):1–5. | ||
Schutte K, Malfertheiner P. Markers for predicting severity and progression of acute pancreatitis. Best Pract Res Clin Gastroenterol. 2008;22(1):75–90. | ||
Cho JH, Kim TN, Chung HH, et al. Comparison of scoring systems in predicting the severity of acute pancreatitis. World J Gastroenterol. 2015;21(8):2387–2394. | ||
Staubli SM, Oertli D, Nebiker CA. Laboratory markers predicting severity of acute pancreatitis. Crit Rev Clin Lab Sci. 2015;52(6):273–283. | ||
Ranson JH, Pasternack BS. Statistical methods for quantifying the severity of clinical acute pancreatitis. J Surg Res. 1977;22(2):79–91. | ||
Kuo DC, Rider AC, Estrada P, Kim D, Pillow MT. Acute pancreatitis: what’s the score? J Emerg Med. 2015;48(6):762–770. | ||
Tonsi AF, Bacchion M, Crippa S, Malleo G, Bassi C. Acute pancreatitis at the beginning of the 21st century: the state of the art. World J Gastroenterol. 2009;15(24):2945–2959. | ||
Cardoso FS, Ricardo LB, Oliveira AM, et al. C-reactive protein prognostic accuracy in acute pancreatitis: timing of measurement and cutoff points. Eur J Gastroenterol Hepatol. 2013;25(7):784–789. | ||
Closa D. Free radicals and acute pancreatitis: much ado about … something. Free Radic Res. 2013;47(11):934–940. | ||
Criddle DN. Reactive oxygen species, Ca(2+) stores and acute pancreatitis; a step closer to therapy? Cell Calcium. 2016;60(3):180–189. | ||
Roy D, Quiles J, Gaze DC, Collinson P, Kaski JC, Baxter GF. Role of reactive oxygen species on the formation of the novel diagnostic marker ischaemia modified albumin. Heart. 2006;92(1):113–114. | ||
Gaze DC. Ischemia modified albumin: a novel biomarker for the detection of cardiac ischemia. Drug Metab Pharmacokinet. 2009;24(4):333–341. | ||
Gunduz A, Turedi S, Mentese A, et al. Ischemia-modified albumin in the diagnosis of acute mesenteric ischemia: a preliminary study. Am J Emerg Med. 2008;26(2):202–205. | ||
Kaefer M, Piva SJ, De Carvalho JA, et al. Association between ischemia modified albumin, inflammation and hyperglycemia in type 2 diabetes mellitus. Clin Biochem. 2010;43(4–5):450–454. | ||
Giannone FA, Domenicali M, Baldassarre M, et al. Ischaemia-modified albumin: a marker of bacterial infection in hospitalized patients with cirrhosis. Liver Int. 2015;35(11):2425–2432. | ||
Sharma R, Gaze DC, Pellerin D, et al. Ischemia-modified albumin predicts mortality in ESRD. Am J Kidney Dis. 2006;47(3):493–502. | ||
Yin M, Liu X, Chen X, et al. Ischemia-modified albumin is a predictor of short-term mortality in patients with severe sepsis. J Crit Care. 2017;37:7–12. | ||
Guntas G, Sahin A, Duran S, et al. Evaluation of ischemia-modified albumin in patients with inflammatory bowel disease. Clin Lab. 2017;63(2):341–347. | ||
Bar-Or D, Lau E, Winkler JV. A novel assay for cobalt-albumin binding and its potential as a marker for myocardial ischemia-a preliminary report. J Emerg Med. 2000;19(4):311–315. | ||
Lippi G, Montagnana M, Salvagno GL, Guidi GC. Standardization of ischemia-modified albumin testing: adjustment for serum albumin. Clin Chem Lab Med. 2007;45(2):261–262. | ||
Perez S, Pereda J, Sabater L, Sastre J. Redox signaling in acute pancreatitis. Redox Biol. 2015;5:1–14. | ||
Baser H, Can U, Karasoy D, et al. Evaluation of oxidant/anti-oxidants status in patients with mild acute-pancreatitis. Acta Gastroenterol Belg. 2016;79(1):23–28. | ||
Topaloglu N, Kucuk A, Tekin M, et al. Serum ischemia-modified albumin levels in experimental model of acute pancreatitis. J Coll Physicians Surg Pak. 2015;25(6):395–398. | ||
Das M, Cevik Y, Erel O, Çorbacioğlu ŞK. Ischemia-modified albumin levels in the prediction of acute critical neurological findings in carbon monoxide poisoning. Kaohsiung J Med Sci. 2016;32(4):201–206. | ||
Gunduz A, Turedi S, Mentese A, et al. Ischemia-modified albumin levels in cerebrovascular accidents. Am J Emerg Med. 2008;26(8):874–878. | ||
Guldogan CE, Kilic MO, Balamir I, Tez M, Turhan T. Correlation between ischemia-modified albumin and Ranson score in acute pancreatitis. Ulus Travma Acil Cerrahi Derg. 2017;23(6):472–476. | ||
Li J, Wang JS, Xie ZX, et al. Correlations among copeptin, ischemia-modified albumin, and the extent of myocardial injury in patients with acute carbon monoxide poisoning. Genet Mol Res. 2015;14(3):10384–10389. | ||
Gaze DC, Crompton L, Collinson P. Ischemia-modified albumin concentrations should be interpreted with caution in patients with low serum albumin concentrations. Med Princ Pract. 2006;15(4):322–324. | ||
Hakligor A, Kosem A, Senes M, Yücel D. Effect of albumin concentration and serum matrix on ischemia-modified albumin. Clin Biochem. 2010;43(3):345–348. | ||
Li S, Zhang Y, Li M, Xie C, Heshui W. Serum albumin, a good indicator of persistent organ failure in acute pancreatitis. BMC Gastroenterol. 2017;17(1):59. | ||
Hong W, Lin S, Zippi M, et al. Serum albumin Is independently associated with persistent organ failure in acute pancreatitis. Can J Gastroenterol Hepatol. 2017;2017:10. | ||
Talukdar R, Nechutova H, Clemens M, Vege SS. Could rising BUN predict the future development of infected pancreatic necrosis? Pancreatology. 2013;13(4):355–359. | ||
Koutroumpakis E, Wu BU, Bakker OJ, et al. Admission hematocrit and rise in blood urea nitrogen at 24 h outperform other laboratory markers in predicting persistent organ failure and pancreatic necrosis in acute pancreatitis: a post hoc analysis of three large prospective databases. Am J Gastroenterol. 2015;110(12):1707–1716. | ||
Peng T, Peng X, Huang M, et al. Serum calcium as an indicator of persistent organ failure in acute pancreatitis. Am J Emerg Med. 2017;35(7):978–982. | ||
Ignatavicius P, Gulla A, Cernauskis K, Barauskas G, Dambrauskas Z. How severe is moderately severe acute pancreatitis? Clinical validation of revised 2012 Atlanta classification. World J Gastroenterol. 2017;23(43):7785–7790. | ||
Lee E, Eom JE, Jeon KH, et al. Evaluation of albumin structural modifications through cobalt-albumin binding (CAB) assay. J Pharm Biomed Anal. 2014;91:17–23. | ||
Oran I, Oran B. Ischemia-modified albumin as a marker of acute coronary syndrome: the case for revising the concept of “N-terminal modification” to “fatty acid occupation” of albumin. Dis Markers. 2017;2017:5692583. |
 © 2018 The Author(s). This work is published and licensed by Dove Medical Press Limited. The full terms of this license are available at https://www.dovepress.com/terms.php and incorporate the Creative Commons Attribution - Non Commercial (unported, v3.0) License.
By accessing the work you hereby accept the Terms. Non-commercial uses of the work are permitted without any further permission from Dove Medical Press Limited, provided the work is properly attributed. For permission for commercial use of this work, please see paragraphs 4.2 and 5 of our Terms.
© 2018 The Author(s). This work is published and licensed by Dove Medical Press Limited. The full terms of this license are available at https://www.dovepress.com/terms.php and incorporate the Creative Commons Attribution - Non Commercial (unported, v3.0) License.
By accessing the work you hereby accept the Terms. Non-commercial uses of the work are permitted without any further permission from Dove Medical Press Limited, provided the work is properly attributed. For permission for commercial use of this work, please see paragraphs 4.2 and 5 of our Terms.