
Back to Journals » Journal of Asthma and Allergy » Volume 18

Iron Deficiency Drives Th2-Mediated Immunity in Pediatric Atopic Dermatitis Through DNA Hypermethylation and TIGIT Suppression in IL-10-Producing Breg Cells
Authors Gao X, Hou Z, Li X, Ouyang T, Yu S, Wang Y, Zhang G, Luo Y, He X  , Liao W, Wei Z
Received 1 June 2025
Accepted for publication 9 September 2025
Published 9 October 2025 Volume 2025:18 Pages 1385—1398
DOI https://doi.org/10.2147/JAA.S544136
Checked for plagiarism Yes
Review by Single anonymous peer review
Peer reviewer comments 4
Editor who approved publication: Dr Luis Garcia-Marcos
Xiaofei Gao,1 Zhaojuan Hou,2,3 Xidie Li,4 Tingting Ouyang,5 Shuying Yu,6 Yuwei Wang,1 Ge Zhang,1 Yangyang Luo,1 Xieling He,7 Wei Liao,1 Zhu Wei1
1Department of Dermatology, The Affiliated Children’s Hospital of Xiangya School of Medicine, Hunan Children’s Hospital, Central South University, Changsha, People’s Republic of China; 2Center for Reproductive Medicine, Xiangya Hospital of Central South University, Changsha, People’s Republic of China; 3Clinical Research Center for Women’s Reproductive Health in Hunan Province, Changsha, People’s Republic of China; 4Department of Obstetrics and Gynecology, Zhuzhou Central Hospital, Zhuzhou, People’s Republic of China; 5Dundee International Institute, Central South University, Changsha, People’s Republic of China; 6School of Life Science and Technology, Huazhong University of Science and Technology, Wuhan, People’s Republic of China; 7Department of Laboratory Medicine, Hunan Provincial Maternal and Child Health Care Hospital, Changsha, People’s Republic of China
Correspondence: Zhu Wei, Department of Dermatology, The Affiliated Children’s Hospital of Xiangya School of Medicine, Hunan Children’s Hospital, Central South University, No. 86 Ziyuan Road, Changsha, Hunan, 410007, People’s Republic of China, Email [email protected] Wei Liao, Department of Dermatology, The Affiliated Children’s Hospital of Xiangya School of Medicine, Hunan Children’s Hospital, Central South University, No. 86 Ziyuan Road, Changsha, Hunan, 410007, People’s Republic of China, Email [email protected]
Background: Pediatric atopic dermatitis (AD), a common chronic relapsing inflammatory skin disorder, often co-occurs with iron deficiency. However, the causal relationship and mechanisms linking iron homeostasis to AD pathogenesis remain unclear. This study investigates etiopathogenetic role of iron deficiency in childhood AD by analyzing molecular pathways and clinical impacts on disease progression.
Methods: We have enrolled 298 pediatric AD patients based on the Hanifin and Rajka criteria to evaluate the relationship between peripheral iron and the severity of AD, as well as the levels of serum iron, ferritin, and transferrin in children with AD. The percentages of Th2 cells and IL-10-producing CD24+CD38+CD19+ regulatory B (Breg) cells were quantified by flow cytometry. RNA-sequencing and bioinformatic analysis were performed to explore the iron deficiency-sensitive genes in CD19+ B cells treated with Ciclopiroxolamine (CPX). The differentially expressed genes, including T cell immunoreceptor with immunoglobulin and tyrosine-based inhibitory motif (ITIM) domain (TIGIT) and IL10, were further confirmed by RT-qPCR. 5-mC level was determined to evaluate the effect of iron deficiency on DNA methylation. TIGIT was inhibited in CD19+ B cells using a blocking antibody to assess its regulatory role in Breg cells.
Results: Children with severe AD have lower levels of iron ions in peripheral blood compared with the mild patients (P< 0.0001). Children with AD exhibited decreased serum levels of iron (P< 0.01), ferritin (P< 0.01), and transferrin (P< 0.05), along with an elevated percentage of Th2 cells (P< 0.01) and reduced CD24+CD38+CD19+ Breg cells (P< 0.01). CPX-mediated iron chelation suppressed IL-10-producing Breg cells (P< 0.01) by inducing DNA methylation (P< 0.05) and downregulating TIGIT (P< 0.001), while promoting the expansion of IL-4-producing Th2 cells (P< 0.05).
Conclusion: Iron deficiency contributes to Th2 cell expansion in pediatric AD via DNA methylation and TIGIT suppression in IL-10-producing Breg cells.
Plain Language Summary: Many children with atopic dermatitis (AD) have low iron levels, but we did not know if this causes AD. Our research discovered that helpful immune cells (Bregs), which generally help reduce inflammation, do not work when the body lacks iron. Th2 cells, which drive allergic reactions, become overactive. These changes happen through altered DNA tags (methylation) and reduced TIGIT expression. Together, these effects promote AD development in children.
Keywords: pediatric atopic dermatitis, iron deficiency, Breg cells, type 2 inflammation
Introduction
Pediatric atopic dermatitis (AD) is a chronic inflammatory dermatosis characterized by epidermal barrier dysfunction, pruritus-associated scratching cycles, and lichenified eczematous plaques, arising from intricate immune network dysregulation. Emerging evidence highlights dysregulated type 2 immunity, particularly IL-4/IL-13-mediated Th2-polarized responses, coupled with disrupted regulatory cell homeostasis as central mechanistic drivers orchestrating both initiation and perpetuation of AD pathology.1,2
Trace element iron is an indispensable enzymatic cofactor regulating core cellular homeostasis, such as DNA synthesis, mitochondrial respiration, oxygen transport, lipid, carbon, and glucose metabolism. Iron homeostasis is maintained by ferritin, transferrin (TRF), ferroportin, and other iron-related proteins. Long-lasting iron depletion affects erythropoiesis and causes iron deficiency anemia (IDA), a common condition in pediatric AD.3–5 Indeed, an insufficient iron intake is reported in infants with AD, since their micronutrient needs can no longer be met by breastfeeding alone during this period.6–8 Though iron deficiency is assumed to be associated with the development of pediatric AD, experimental evidence remains absent.
Regulatory B cells (Breg cells, also known as B10 cells) restore immune balance by producing IL-10. In human peripheral blood, CD19+CD24+CD27+ and CD19+CD24+CD38+ B cells are the two major functional types of Breg cells.9 Breg cells from healthy individuals exert dual immunomodulatory functions by suppressing the production of inflammatory cytokines IFN-γ, TNF-α, and IL-17A while inducing FOXP3+ expression in CD4+ T cells through an IL-10-dependent mechanism.10 Recent studies have demonstrated impaired Breg cell activity in type 2 inflammatory diseases such as allergic asthma and atopic dermatitis.11,12 IL-10-producing Breg cells alleviate MC903-induced AD-like dermatitis in mice by suppressing eosinophil activation and tissue infiltration.13 However, the precise role of Breg cells in the pathogenesis of pediatric AD remains unclear.
In this study, we performed a retrospective analysis of children with AD referred to Hunan Children’s Hospital from April 2014 to May 2023 and identified an association between peripheral iron levels and AD severity. Our data exhibited reduced IL-10-producing CD24+CD38+CD19+ Breg cells in AD patients, along with decreased serum iron and ferritin levels that positively correlated with IL-10 production. Given the IL-10-dependent immunoregulatory function of Breg cells, we postulated that iron deficiency might compromise Breg cell activity in AD pathogenesis. Our data further demonstrated that CPX-mediated iron chelation significantly reduced both the proportion of CD24+CD38+CD19+ Breg cells and their IL-10 production capacity through T cell immunoreceptor with immunoglobulin and tyrosine-based inhibitory motif (ITIM) domain (TIGIT) downregulation and DNA methylation promotion. In addition, CPX treatment significantly increased the frequency of Th2 cells and IL-4 production in CD4+ T cells. Thus, this study identified that iron deficiency impaired Breg cell activity and exacerbated AD pathogenesis by promoting Th2 cell-mediated type 2 inflammation.
Materials and Methods
Clinical and Laboratory Data Collection
This single-center retrospective study analyzed 217 children with AD referred to Hunan Children’s Hospital between April 2014 and May 2023. AD diagnosis was based on the Hanifin and Rajka criteria.14 Diagnosis of iron-deficiency anaemia (IDA) in children followed the 2021 WHO criteria: haemoglobin <110 g/L (6–59 months), <115 g/L (5–11 years), or <120 g/L (12–14 years) at sea level, combined with serum ferritin <12 µg/L (<5 years) or <15 µg/L (≥5 years); in the presence of inflammation (CRP ≥5 mg/L), adjusted cut-offs of <30 µg/L (<5 years) and <70 µg/L (<5 years) were applied.15,16 Patients with other non-iron deficiency anemias, other cutaneous inflammation, or autoimmune disorders were excluded. Severity categories were evaluated based on the SCORing Atopic Dermatitis (SCORAD): mild (0 ≤ score ≤ 24), moderate (24<score ≤ 50), and severe (50<score ≤ 103). The information obtained included the levels of hemoglobin and iron ions in peripheral blood.
Human Subjects
Eighty-one children with AD were prospectively enrolled between August 2022 and September 2024 from the dermatology department of Hunan Children’s Hospital, including outpatient and inpatient cohorts, for peripheral blood sampling and subsequent analyses. The diagnosis of AD was established using the Hanifin and Rajka criteria. Eighty-seven age-, sex-, and ethnicity-matched healthy controls were collected from the Hunan Children’s Hospital during the same period. All the patients received topical treatment (corticosteroids/calcineurin inhibitors/PDE-4 inhibitors); none were on systemic therapies (corticosteroids/immunosuppressants/biologic agents) at the time of sample collection. All experiments were conducted in accordance with the Declaration of Helsinki and approved by the Ethical Committee of Hunan Children’s Hospital (approval code: HCHLL-2024-264). Written informed consent was obtained from the patient’s parent/legal guardian before enrollment.
ELISA and Serum Iron Detection
Serum was collected from peripheral blood samples of AD patients and healthy controls. For serum iron detection, a serum iron assay kit (A039-1-1, Nanjing Jiancheng Bioengineering Institute, China) was used according to the manufacturer’s protocols. Assays for IL-10 (H009-1-1, Nanjing Jiancheng Bioengineering Institute, China), transferrin (H130-1-1, Nanjing Jiancheng Bioengineering Institute, China), and ferritin (H129-1-1, Nanjing Jiancheng Bioengineering Institute, China) were performed using respective commercial kits as per the manufacturer’s guidelines.
Flow Cytometry
Human peripheral blood mononuclear cells (PBMCs) or CD19+ B cells were stained with Zombie NIRTM (423105, BioLegend, USA) to assess cell death levels. The negative staining of Zombie NIRTM dye was regarded as viable cells. For staining of surface markers in human, cells were incubated with fluorochrome-labeled antibodies against surface markers at 4°C for 30 min, protected from light. For staining of intracellular cytokines in human, cells were stimulated with Phorbol 12-Myristate 13-Acetate (PMA) and ionomycin plus GolgiPlug (550583, BD Biosciences, USA) at 37°C for 6 hr. The cells were then fixed and permeabilized with Cytofix/CytopermTM Fixation/Permeabilization Solution Kit (554714, BD Biosciences, USA), followed by staining with fluorescent antibodies for an additional 30 min at 4°C in the dark. For indirect flow cytometry, cells were stained with the primary antibody and incubated for 30 min at 4°C in the dark. Afterwards, they were washed three times with ice-cold PBS, and stained with diluted fluorochrome-labeled secondary antibody for 30 min at 4°C. To detect Fe2+, FerroOrange (1 μmol/L) (F374, DOJINDO Laboratories, Japan) was loaded into cells and stained at 37°C for 30 min. The expression of cytokines and surface markers was detected by flow cytometry using BD FACS LSR Fortessa (BD Biosciences), then the data were collected by BD FACSDiva (BD Biosciences) and analyzed by the Flowjo software (Tree Star). The following antibodies were used for flow cytometric analysis: CD19 (APC, 302212, Biolegend; FITC, 302205, Biolegend), CD24 (BV711, 311135, Biolegend), CD27 (PECY7, 124215, Biolegend; BV605, 302829, Biolegend), CD38 (BV510, 356611, Biolegend), TIGIT primary antibody (16–9500-82, Invitrogen, USA), 5-mC primary antibody (ab214727, Abcam, UK), Goat anti-Mouse IgG (H+L) secondary antibody (AF488, A32723TR, Invitrogen), Goat Anti-Rabbit IgG (H+L) secondary antibody (AF488, ab150077, Abcam), IL-10 (PE, 501403, Biolegend), CD4 (FITC, 555346, BD Biosciences), CCR6 (APC, 353415, Biolegend), CXCR3 (BV650, 353729, Biolegend), CCR4 (PECY7, 359409, Biolegend), IL-4 (APC, 500811, Biolegend).
In vitro Human PBMCs and CD19+ B Cell Activation
Human PBMCs were separated from the peripheral blood of healthy donors by density gradient centrifugation (17544203–1, Cytiva, USA), then they were stimulated with 2 μg/mL anti-CD3 (217,570–100UGCN, Sigma, USA) and 1 μg/mL anti-CD28 (217,669–100UGCN, Sigma) for 48 hrs. After cell culture, PBMCs were collected to determine the percentage of Breg cells and Th2 cells, along with the production of IL-10 in Breg cells. For CD19+ B cell activation, CD19+ B cells were isolated from PBMCs by positive selection using human CD19 microbeads (130–050-301, Miltenyi Biotec, Germany), and then cultured under the stimulation of 10 μg/mL anti-IgM (109–006-129, Jackson ImmunoResearch, USA) and 1 μg/mL CD40L (310–02-50UG, PeproTech, USA) for 72 hrs. After stimulation, cells were collected to assess the percentages of CD19+CD24+CD27+ Breg cells and CD19+CD24+CD38+ Breg cells, as well as IL-10 expression by flow cytometry.
In vitro Iron Depletion
PBMCs or CD19+ B cells were isolated from the peripheral blood of healthy donors and subjected to iron depletion using ciclopiroxolamine (CPX) (20 μM) (C2162700, Sigma, USA). Following iron depletion, PBMCs were cultured under the stimulation of 2 μg/mL anti-CD3 (Sigma) and 1 μg/mL anti-CD28 (Sigma) for 48 hrs. In parallel, CD19+ B cells were stimulated with 1 μg/mL CD40L (PeproTech) and 10 μg/mL anti-IgM (Jackson ImmunoResearch) for 72 hrs according to previous studies.17
RNA Isolation and qPCR
Total RNA was extracted from cells using TRIzol reagent (TR118, MRC, USA). RNA integrity was subsequently assessed using a NanoDrop spectrophotometer (ND-2000, Thermo Fisher Scientific). Following RNA extraction, cDNA synthesis was performed using the Evo M-MLV RT Mix Kit with gDNA Clean for qPCR (AG11728, Accurate Biology, China) according to the manufacturer’s instructions. The transcripts were analyzed for the expression of various genes using the LightCycler 480 II (Roche). The relative mRNA expression levels of each gene were calculated using the ΔΔCt method, with threshold cycle (Ct) values normalized to reference genes (ACTB or GAPDH) and calibrated against the control group. Relevant primers are listed in Supplemental Table 1.
RNA-Sequencing and Bioinformatic Analysis
For cell preparation, human CD19+ B cells were isolated from the peripheral blood of healthy donors, and then cultured under the condition of 1 μg /mL CD40L (PeproTech) and 10 μg /mL anti-IgM (Jackson ImmunoResearch) for 3 days. Total RNA was extracted from stimulated CD19+ B cells using TRIzol reagent (MRC) according to the manufacturer’s protocol, followed by submission to Novogene Co., Ltd. for RNA-sequencing. The RNA-sequencing workflow comprised total RNA quality assessment, mRNA purification, double-stranded cDNA synthesis, end repair/dA-tailing, size-based fragment selection, PCR amplification, library quality control, and final sequencing on Illumina platforms. Differentially expressed genes (DEGs) were identified using the “DESeq2” R package,18 with criteria of adjusted P-value < 0.05 and fold-change > 1.5. Heatmap, principal component analysis (PCA), and visualization of DEGs were conducted using the “heatmap”, “prcomp”, and “ggplot2” packages in R software (version 4.3.3). Enrichment analyses, including Gene Set Enrichment Analysis (GSEA), Gene Ontology (GO), and Kyoto Encyclopedia of Genes and Genomes (KEGG) were performed using the “clusterProfiler” and “msigdbr” packages.19 All analytical results were visualized for biological interpretation. Sequencing data are available from the corresponding author by reasonable request.
TIGIT Blocking Assays
To evaluate the effect of TIGIT blockade on Breg cell expansion, CD19+ B cells were cultured under the condition of 1 μg /mL CD40L (PeproTech), 10 μg /mL anti-IgM (Jackson ImmunoResearch), and 10 μg /mL TIGIT blocking antibody (Invitrogen). After 3 days, CD19+ B cells were collected to determine the percentage of CD24+CD38+ CD19+ Breg cells by flow cytometry.
Statistical Analysis
Comparative analyses between AD patients and healthy controls were assessed using unpaired Student’s t-tests. For multigroup comparisons, datasets were analyzed by ordinary one-way ANOVA with Tukey’s post hoc testing. When it comes to examining the differences in iron metabolism interventions (depletion groups and control groups), paired Student’s t-test was applied. Pearson’s correlation was applied for the correlation analysis. All data were presented as mean ± SEM unless otherwise noted, with statistical significance thresholds specified in corresponding figure legends. P value <0.05 was considered statistically significant.
Results
Peripheral Iron Concentration Is Decreased in Children with AD
To determine the association between peripheral iron and pediatric AD, we retrospectively reviewed the laboratory data of 217 cases of children with AD who were referred to Hunan Children’s Hospital from April 2014 to May 2023. We found that children with severe AD (Mean ± SEM: 366.9±9.885 ug/mL) had much lower blood iron levels than other groups (Mean ± SEM: mild: 411.7±4.730 ug/mL, moderate: 395.1 ±8.797 ug/mL) (Figure 1A). The level of hemoglobin (HGB) had no significant difference between these three groups (Mean ± SEM: mild: 120.0±0.990 g/L, moderate: 121.6 ± 1.650 g/L, severe: 118.8 ± 1.743 g/L) (Supplemental Figure 1). Serum levels of iron, ferritin, and transferrin were measured via ELISA in patients with AD and matched healthy controls. Comparative analysis revealed AD patients had significantly lower serum iron (Mean ± SEM: NC: 1.943 ±0.077 mg/L, AD: 1.593 ±0.090 mg/L), ferritin (Mean ± SEM: NC: 28.57 ± 0.804 ng/mL, AD: 25.73 ± 0.621 ng/mL), and transferrin (Mean ± SEM: NC: 1.797 ± 0.026 g/L, AD: 1.712 ± 0.022 g/L) levels than healthy children (Figure 1B–D). These data supported the hypothesis of altered iron status in children with AD.
 |
Figure 1 Decreased systemic iron levels in AD patients. (A) The levels of peripheral iron ion in children with mild (n=100), moderate (n=48), and severe AD (n=69). (B-D) Serum iron (B), ferritin (C), and TRF (D) levels between healthy donors (n=21) and AD patients (n=28). *P<0.05, **P<0.01, ****P<0.0001, ns: not significant (Ordinary one-way ANOVA and Tukey’s multiple comparisons test for A, unpaired 2-tailed Student’s t test for B–D). |
Iron Chelation Inhibits the Expansion of IL-10+ Breg Cells in Peripheral Blood
Next, we detected the proportions of two key Breg cell subsets (CD24+CD38+CD19+ and CD24+CD27+CD19+) in peripheral blood, which are known to regulate immune responses.9,20 There was no statistically significant difference in the percentage of CD19+ B cells between the AD patients and healthy controls (Mean ± SEM: NC: 5.818 ± 0.971%, AD: 4.593 ±0.808%)(Supplemental Figure 2A). The percentage of CD24+CD38+CD19+ Breg cells was significantly decreased in patients with AD (Mean ± SEM: NC: 12.44 ± 1.467%, AD: 7.358 ± 0.967%) (Figure 2A), but no significant difference was observed on CD24+CD27+CD19+ Breg cells between the two groups (Mean ± SEM: NC: 4.377 ± 0.337%, AD: 4.192 ± 0.434%) (Supplemental Figure 2B). In addition, the production of IL-10 in CD19+ B cells was also significantly decreased in the AD group (Mean ± SEM: NC: 16.44 ± 2.246%, AD: 9.398 ± 1.900%) (Figure 2B). We measured serum IL-10 using ELISA and found reduced levels in AD patients compared to healthy children (Mean ± SEM: NC: 76.70 ± 2.204 ng/L, AD: 71.00 ± 1.641 ng/L) (Figure 2C). The result also showed that IL-10 levels positively correlated with serum iron and ferritin (Figure 2D and E). To investigate whether iron status affects the biological activities of Breg cells, we treated CD19+ B cells with the iron chelator CPX. In CD40L and anti-IgM activated CD19+ B cells, CPX significantly inhibited the expansion and IL-10 production of CD24+CD27+CD19+ Breg cells (Figure 2F and G). Similarly, CD24+CD38+CD19+ Breg cells and their IL-10 production capacity were significantly reduced in the CPX-treated group compared to the DMSO-treated controls (Figure 2H and I).
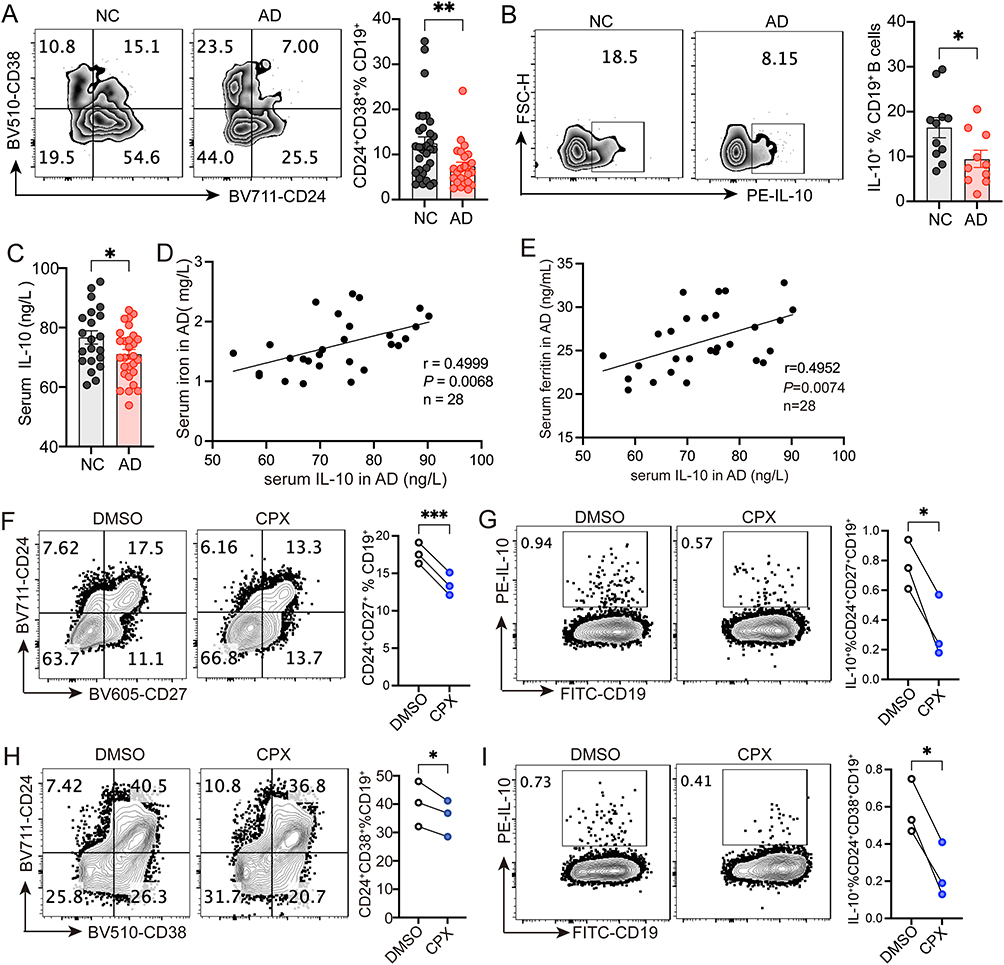 |
Figure 2 CPX inhibits the expansion of IL-10-producing CD24+CD38+CD19+ Breg cells. (A) Representative flow cytometry and quantification of CD24+CD38+CD19+ B cells from healthy donors (n=31) and children with AD (n=24). (B) Representative flow cytometry and quantification of IL-10 producing CD19+ B cells from healthy donors (n=11) and children with AD (n=10). (C) Quantification of serum IL-10 in healthy donors (n=21) and children with AD (n=28). (D and E) Correlation between serum levels of IL-10 and iron (D) and ferritin (E) in children with AD (n=28). (F and G) Representative flow cytometry and quantification of CD24+CD27+CD19+ Breg cells (F) and IL-10 production (G) after CPX or DMSO treatment (n=3). (H and I) Representative flow cytometry and quantification of CD24+CD38+CD19+ Breg cells (H) and IL-10 production (I) after CPX or DMSO treatment (n=3). ***P <0.001, **P <0.01, *P <0.05 (unpaired 2-tailed Student’s t test for A-C, Pearson’s r correlation for D and E, paired 2-tailed Student’s t test for F–I). |
Iron Deficiency Affects Multiple Biological Functions of CD19+ B Cells
To investigate the molecular mechanisms by which iron deficiency regulates Breg cells, we performed RNA-sequencing on CPX-treated CD19+ B cells. The PCA was used to analyze the expression of all genes. PC1 and PC2 collectively explained 80% of the total variance (Figure 3A). Subsequent analysis focused on the DEGs in CPX-treated CD19+ B cells. Compared to the DMSO group, the CPX group exhibited 696 DEGs, including 208 downregulated (Supplemental Table 2) and 488 upregulated (Supplemental Table 3) (Figure 3B). The GO enrichment analysis of the 696 DEGs showed that CPX against DMSO was closely related to cell division, regulation of protein folding, negative regulation of protein ubiquitination, and autophagosome assembly (Figure 3C). In CPX-treated cells, significantly enriched terms included negative regulation of inclusion body assembly, protein refolding regulation, and response to hypoxia (Supplemental Figure 3A). While in DMSO-treated cells, the top biological processes were regulation of chromosome organization, regulation of cell cycle phase transition, negative regulation of organelle organization, negative regulation of cell cycle, and positive regulation of cell activation (Supplemental Figure 3B). The KEGG pathways analysis showed that CPX against DMSO was involved in protein processing in the endoplasmic reticulum, lipid and atherosclerosis, cellular senescence, virus infection, and autophagy (Figure 3D). The significantly enriched KEGG pathways in CPX were related to Fructose and mannose metabolism, HIF-1 signaling pathway, mineral absorption, and protein processing in the endoplasmic reticulum (Supplemental Figure 3C). Meanwhile, the top KEGG pathways enriched in DMSO were related to the intestinal immune network for IgA production, cell cycle, Th1 and Th2 cell differentiation, as well as the T cell receptor signaling pathway (Supplemental Figure 3D). GSEA analysis using molecular signatures databases further compared expression profiles between the CPX and DMSO groups. The results showed that the significantly enriched gene products in the CPX group were mainly located in glycolysis, heme metabolism, inflammatory response, and TNFA signaling via NFKB (Figure 3E). Several Breg cell-related genes, such as TIGIT, CD80, CD84, CD274, TNFRSF8, IL2, IL10, and IL15 were significantly downregulated in CPX group (Figure 3F). These findings suggest that iron deficiency plays a pivotal role in suppressing the Breg cell function.
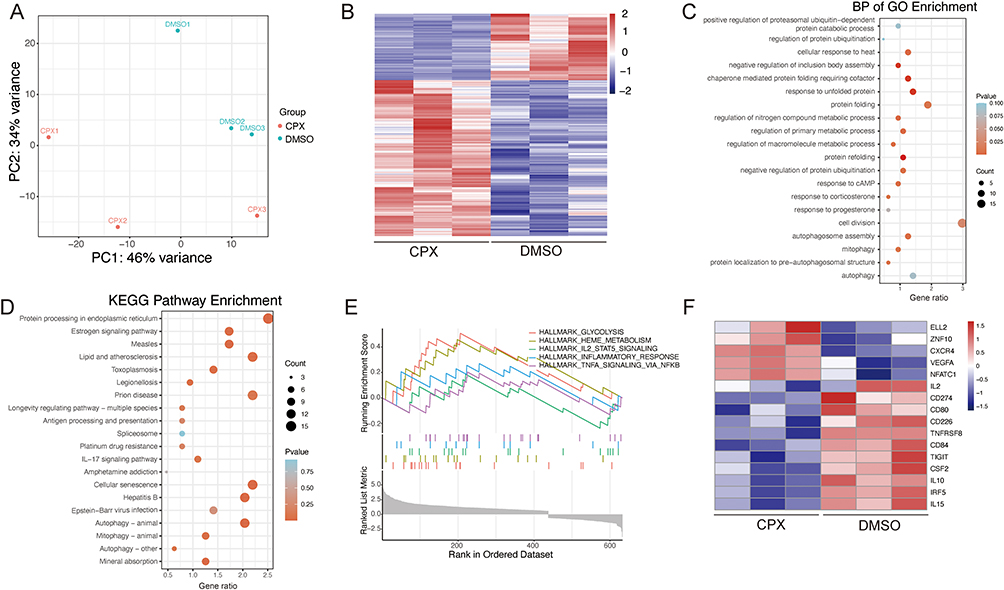 |
Figure 3 Bioinformatic analysis of the DEGs in CD19+ B cells treated with CPX. (A) PCA diagram. (B) Heatmap of 696 DEGs.(C) GO analysis of biological process. (D) KEGG pathway analysis. (E) GSEA results of AD-related genes. (F) Heat map of DEGs for Breg cell-related genes. |
Iron Deficiency Inhibits Breg Cell Expansion by Promoting DNA Methylation and Suppressing TIGIT Expression
We next determined the expression levels of Breg cell-related genes in CPX-treated CD19+ B cells after CD40L and anti-IgM stimulation. Key regulatory genes (TIGIT, IL-10, IL-2, CD274, IRF5, IL-15, CSF2, CD80, CD84) showed significant downregulation (Figure 4A), consistent with their established roles in Breg-mediated regulatory functions.21–24 Notably, VEGFA—a central inflammatory mediator in AD pathogenesis —was paradoxically upregulated.25 In contrast, CXCR4 and ZNF10, implicated in Th2-mediated inflammation and T-cell activation, exhibited a nonsignificant upward trend in CPX-treated B cells.22 TIGIT has been reported to regulate Breg cell differentiation and function critically, and its expression is modulated by DNA methylation.22,26,27 Our previous studies demonstrated that iron homeostasis affects gene expression by modulating DNA methylation.28,29 To investigate whether iron deficiency affected TIGIT expression and DNA methylation, we examined the expression levels of TIGIT and 5-mC in CPX-treated CD19+ B cells by flow cytometry. The results showed that CPX treatment inhibited the expression of TIGIT (Figure 4B) and increased the 5-mC level (Figure 4C) in CD24+CD27+CD19+ Breg cells. Then we treated CD19+ B cells with TIGIT blocking antibody to explore the role of TIGIT in regulating Breg cell differentiation. The result showed that TIGIT inhibition significantly reduced the expansion of CD24+CD38+CD19+ Breg cells (Figure 4D). Collectively, these results indicated that iron deficiency inhibited Breg cell expansion by promoting DNA methylation and suppressing TIGIT expression.
 |
Figure 4 CPX inhibits Breg cell expansion by regulating DNA methylation and TIGIT. (A) RT-qPCR results of Breg cell-related genes in CD19+ B cells treated with DMSO or CPX. (B and C) Representative flow cytometry and quantification of TIGIT (B) and 5-mC (C) MFI in CD24+CD27+CD19+ Breg cells treated with DMSO or CPX. (D) Representative flow cytometry and quantification of CD38+CD24+CD19+ Breg cells. ****P<0.0001, ***P<0.001, **P<0.01, *P<0.05, ns: not significant (unpaired two-tailed Student’s t test for A, paired 2-tailed Student’s t test for B–D). |
Iron Deficiency Promotes IL-4-Producing Th2 Cells in the Peripheral Blood
As Th cell balance plays a critical role in AD development, we next determined the percentages of Th cell subsets in AD patients. Analysis revealed comparable CD4+ T cell populations between AD patients and healthy controls (Mean ± SEM: NC: 35.63 ± 1.666%, AD: 41.08 ± 2.911%) (Supplemental Figure 4A and 4B). The frequency of CD4+CCR4+CXCR3−CCR6− Th2 cells was highly increased in AD patients (Mean ± SEM: NC: 17.90 ± 1.750%, AD: 29.18 ± 3.012%) (Figure 5A). However, the frequencies of CD4+CXCR3+CCR6− Th1 cells (Mean ± SEM: NC: 2.186 ± 0.453%, AD: 2.601 ± 0.611%) and CD4+CCR6+CXCR3− Th17 cells (Mean ± SEM: NC: 21.47 ± 2.610%, AD: 22.77 ± 2.062%) were comparable between the AD and control group (Supplemental Figure 4C-4E). To investigate whether iron deficiency affected Th2 cell activities, CPX-treated PBMCs were analyzed for Th2 frequency using flow cytometry. The results showed that CPX treatment significantly increased the percentage of CD4+CCR4+CXCR3− Th2 cells compared with the DMSO-treated group (Figure 5B and C). Although the percentage of CD4+CXCR3+CCR4− Th1 cells did not differ significantly between groups (Figure 5D), CPX treatment significantly reduced the Th1/Th2 ratio compared to DMSO controls (Figure 5E). In addition, CPX treatment significantly increased the frequency of CD4+IL-4+ Th2 cells compared with the controls (Figure 5F).
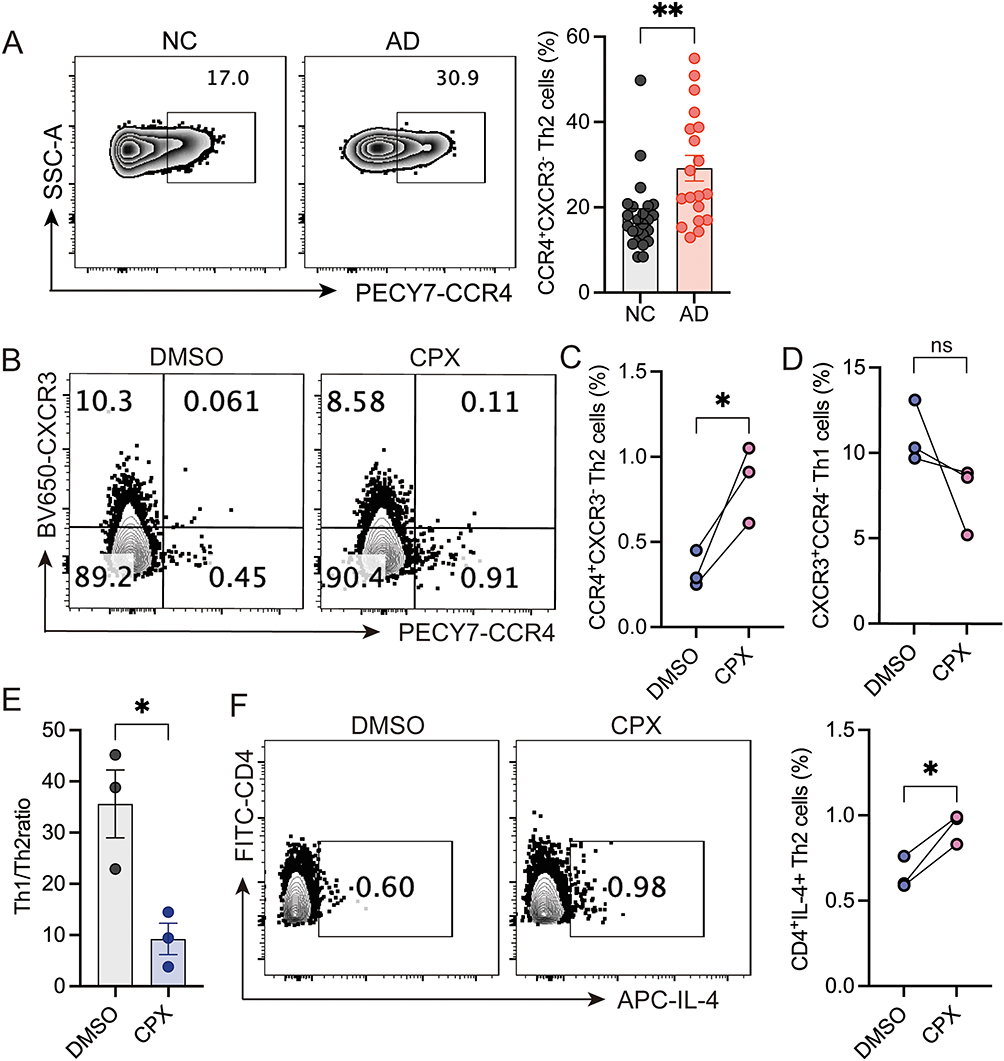 |
Figure 5 Iron chelation promotes Th2 cell inflammation. (A) Representative flow cytometry and quantification of CD4+CCR4+CXCR3− Th2 cells in PBMCs of healthy donors (n=24) and AD patients (n=19). PBMCs isolated from healthy donors were treated with either DMSO or CPX, followed by stimulation with anti-CD3 and anti-CD28 for 3 days. Flow cytometry was used to determine the percentages of CD4+CCR4+CXCR3− Th2 cells (B and C) and CD4+CXCR3+CCR4− Th1 cells (B and D). (E) The ratio of Th1/Th2 cells. (F) Representative flow cytometry and quantification of CD4+IL-4+ Th2 cells after CPX and DMSO treatment. **P <0.01, *P<0.05, ns: not significant (unpaired 2-tailed Student’s t test for A and E, paired 2-tailed Student’s t test for C, D, and F). |
Discussion
Our study demonstrated significant reductions in systemic iron levels among pediatric AD patients, including peripheral blood iron, serum iron, ferritin, and transferrin. Increased iron storage was reported to show an inverse association with allergic disease.30 Our data revealed significantly decreased iron levels in peripheral blood and serum among AD patients, indicating the correlation between iron deficiency and AD development. Multiple epidemiological studies have reported that IDA was highly prevalent in children with AD. Several cross-sectional studies have shown that pediatric patients with AD are at a higher risk (adjusted odds ratio ranging from 1.42 to 1.83) of IDA.3,31 Japan’s largest birth cohort study found 2-year-olds with AD had 2.18-fold higher anemia odds (95% CI 1.66–2.85) within one year.4 A retrospective study in Turkey revealed a higher frequency of IDA in children with AD (15%) than in healthy controls (5%). Early-onset AD, severe SCORAD scores, skin infections, and multiple atopic conditions were associated with a higher incidence of IDA in these patients.32 The varying prevalence of IDA in pediatric AD may be due to dietary habits and demographic factors. However, we did not observe significant differences in the HGB levels between mild, moderate, and severe AD groups (Supplemental Figure 1).
Our findings revealed that iron deficiency induced alterations in immune cell profiles, specifically impairing CD24+CD38+CD19+ Breg cell activity while promoting Th2 cell expansion. IL-10-producing Breg cells exert a protective effect against allergic diseases.33,34 In asthmatic mice, the number of IL-10-producing Breg cells was significantly reduced in the lungs, indicating a disruption in Breg cell homeostasis during allergic asthma.35 Consistent with previous pediatric AD studies, our data revealed concurrent decreases in serum IL-10 levels, CD19+CD24+CD38+ Breg cell percentages, and IL-10 production capacity.12,36 Additionally, we identified a positive correlation between serum iron and IL-10 levels in pediatric AD. Notably, CPX-mediated iron chelation suppressed IL-10 expression in CD19+CD24+CD38+ Breg cells, suggesting that iron deficiency compromises Breg cell functionality in AD pathogenesis. Previous studies have demonstrated that immune activation under iron-deficient conditions preferentially expands Th2 cells while sparing Th1 counterparts.37 Conversely, iron overload promotes T-cell activation and drives differentiation of Th1, Th17, and follicular helper T (Tfh) cells.29 Moreover, iron overload can exacerbate oxidative damage and tissue injury via the Fenton reaction, also known as ferroptosis, which is the trigger of inflammatory disorders.38 Ferroptosis has been linked to airway inflammation in an experimental mouse model,39 and elevated iron levels along with lipid peroxidation products have been detected in the lungs of asthma patients.40 Given this evidence, excessive iron supplementation may not be beneficial, as it could induce ferroptosis and worsen allergic diseases. Although there are no clinical studies testing iron repletion in human AD, it has been reported that decreased iron status was associated with a higher symptom burden in canine AD.41 In our studies, enhanced IL-4 production and increased Th2 cell expansion were observed in PBMCs treated with CPX (a classical iron chelator used in experimental settings). The survival advantage of Th2 cells under iron-deficient conditions may arise from their larger chelatable iron pools compared to Th1 clones, which are less susceptible to iron chelator-mediated depletion.42–44 A previous study has also reported that iron deficiency was sufficient to create a Th2-polarized environment, which was consistent with our finding.45
Using RNA-seq, we identified that iron deficiency inhibited the expression of several Breg cell related genes, such as TIGIT, CD80, CD84, CD274, IL2, IL10, and IL15 (Figure 3F), which were validated by RT-qPCR (Figure 4A). Furthermore, we found that iron deficiency significantly reduced the expression of TIGIT in CD19+ B cells (Figure 4B). Previous studies have shown that TIGIT participates in the regulation of Breg cell function.22 Consistent with these studies, our data showed that blocking TIGIT in vitro significantly inhibited the percentage of CD24+CD38+CD19+ Breg cells. Building on our earlier discovery that iron-dependent epigenetic modifications influence gene expression,29 current data indicate that iron deficiency markedly elevated 5-mC levels in CD19+ B cells (Figure 4C). However, further research is required to confirm whether TIGIT expression is regulated by DNA methylation. Collectively, these results established TIGIT as the potential target of iron deficiency in regulating Breg cell activity.
Although some epidemiological studies have investigated the correlation between iron deficiency and pediatric AD, our study is the first to explore the role and pathogenic mechanisms of iron deficiency in pediatric AD. However, there were several limitations in our study. First, our study is an exploratory study based on a small sample size, future large-scale studies are needed to confirm these findings. Second, the role of iron overload on Breg cells and Th2 cells was not investigated in this work. Given that iron overload may drive disease progression by inducing CD4+ T cell overactivation and enhancing inflammatory cytokine production, the dose of iron supplementation for the prevention or treatment of AD needs to be determined in further study. Third, while our mechanistic data are derived from in vitro cell models, future in vivo studies using animal models will be critical to confirm these pathways. Fourth, nutritional status and iron levels in pediatric AD patients were retrospectively analyzed in our study, prospective studies controlling for dietary and environmental factors are needed. Finally, although DNA hypermethylation was implicated in TIGIT suppression, further methylation analysis of TIGIT was not performed. This mechanistic detail should be explored in future work.
Conclusions
Our study demonstrates that pediatric AD is associated with systemic iron deficiency, which promotes Th2-skewed immunity through DNA methylation promotion and TIGIT inhibition in Breg cells.
Abbreviations
AD, Atopic dermatitis; PBMCs, Human peripheral blood mononuclear cells; PMA, Phorbol 12-Myristate 13-Acetate; Breg, Regulatory B cells; TIGIT, T cell immunoreceptor with immunoglobulin and tyrosine-based inhibitory motif (ITIM) domain; CPX, Ciclopiroxolamine; IDA, Iron deficiency anemia; SCORAD, SCORing Atopic Dermatitis; DEGs, Differentially expressed genes; PCA, Heatmap, principal component analysis; GSEA, Enrichment analyses, including Gene Set Enrichment Analysis; GO, Gene Ontology; KEGG, Kyoto Encyclopedia of Genes and Genomes.
Data Sharing Statement
Sequence data used during the study have been deposited at the National Genomics Data Center of China (https://bigd.big.ac.cn/), and the Bioproject Access ID is PRJCA047201. The Genome Sequence Archive (GSA) number associated with this Bioproject is HRA013575. These data are under controlled access. Researchers wishing to use these data must apply through the National Genomics Data Center of China GSA system. The application requires submission of a detailed research proposal specifying the purpose and intended use of the data. The Data Access Committee (DAC; identifier: HDAC006929) will review each application to ensure the proposed research complies with the ethical and scientific standards established for the use of the data. Data access will be updated on a yearly basis with renewed options at the end of each year.
Ethics Approval and Informed Consent
All experiments were performed following the Declaration of Helsinki, with the approval of the Ethical Committee of Hunan Children’s Hospital (approval code HCHLL-2024-264). Written informed consent was obtained from the parent/legal guardian of the patient before enrollment.
Consent for Publication
All authors confirm that any details of this work can be published.
Author Contributions
All authors made a significant contribution to the work reported, whether that is in the conception, study design, execution, acquisition of data, analysis and interpretation, or in all these areas; took part in drafting, revising or critically reviewing the article; gave final approval of the version to be published; have agreed on the journal to which the article has been submitted; and agree to be accountable for all aspects of the work.
Funding
The research was supported by National Natural Science Foundation of China (projects 82304031, 82103738), and Natural Science Foundation of Hunan Province (projects 2023JJ40344, 2022JJ40199, 2023JJ60278, 2022JJ70089).
Disclosure
The authors report no conflicts of interest in this work.
References
1. Kim JH, Ahn S, Ghosh P, Rhee DK. Immunization with a pneumococcal pep27 mutant strain alleviates atopic dermatitis through the upregulation of regulatory T-cell activity and epithelial barrier function and suppressing TSLP expression. J Invest Dermatol. 2023;143(1):115–123.e6. doi:10.1016/j.jid.2022.07.021
2. Eom JE, Shin DU, Kim GD, Yoon JH, Shin HS, Lee SY. Pediococcus pentosaceus KF159 alleviates house dust mite-induced atopic dermatitis by promoting IL10 production and regulatory T cell induction. Food Funct. 2024;15(13):6975–6987. doi:10.1039/d4fo00933a
3. Rhew K, Oh JM. Association between atopic disease and anemia in pediatrics: a cross-sectional study. BMC Pediatr. 2019;19(1):455. doi:10.1186/s12887-019-1836-5
4. Yang L, Sato M, Saito-Abe M, et al. Allergic disorders and risk of anemia in japanese children: findings from the Japan environment and children’s study. Nutrients. 2022;14(20). doi:10.3390/nu14204335
5. Oh SY, Chung J, Kim MK, Kwon SO, Cho BH. Antioxidant nutrient intakes and corresponding biomarkers associated with the risk of atopic dermatitis in young children. Eur J Clin Nutr. 2010;64(3):245–252. doi:10.1038/ejcn.2009.148
6. Han Y, Lee Y, Park H, Park S, Song K. Nutrient intakes of infants with atopic dermatitis and relationship with feeding type. Nutr Res Pract. 2015;9(1):57–62. doi:10.4162/nrp.2015.9.1.57
7. Low DW, Jamil A, Md Nor N, Kader Ibrahim SB, Poh BK. Food restriction, nutrition status, and growth in toddlers with atopic dermatitis. Pediatr Dermatol. 2020;37(1):69–77. doi:10.1111/pde.14004
8. Cui HS, Ahn IS, Byun YS, et al. Dietary pattern and nutrient intake of Korean children with atopic dermatitis. Ann Dermatol. 2014;26(5):570–575. doi:10.5021/ad.2014.26.5.570
9. Hasan MM, Thompson-Snipes L, Klintmalm G, et al. CD24(hi)CD38(hi) and CD24(hi)CD27(+) human regulatory B cells display common and distinct functional characteristics. J Immunol. 2019;203(8):2110–2120. doi:10.4049/jimmunol.1900488
10. Qin Y, Wang Y, Wang X, et al. Decrease in the proportion of CD24(hi) CD38(hi) B cells and impairment of their regulatory capacity in type 1 diabetes patients. Clin Exp Immunol. 2020;200(1):22–32. doi:10.1111/cei.13408
11. Miyajima S, Shigehara K, Kamekura R, et al. Activated circulating T follicular helper cells and skewing of T follicular helper 2 cells are down-regulated by treatment including an inhaled corticosteroid in patients with allergic asthma. Allergol Int. 2020;69(1):66–77. doi:10.1016/j.alit.2019.08.008
12. Jiang J, Yan S, Zhou X, et al. Crosstalk between circulating follicular t helper cells and regulatory B Cells in children with extrinsic atopic dermatitis. Front Immunol. 2021;12:785549. doi:10.3389/fimmu.2021.785549
13. Lee D, Jo MG, Min KY, et al. IL-10(+) regulatory B cells mitigate atopic dermatitis by suppressing eosinophil activation. Sci Rep. 2024;14(1):18164. doi:10.1038/s41598-024-68660-9
14. Williams HC, Burney PG, Hay RJ, et al. The U.K. Working Party’s Diagnostic Criteria for Atopic Dermatitis. I. Derivation of a minimum set of discriminators for atopic dermatitis. Br J Dermatol. 1994;131(3):383–396. doi:10.1111/j.1365-2133.1994.tb08530.x
15. WHO Guidelines Approved by the Guidelines Review Committee. WHO Guideline on Use of Ferritin Concentrations to Assess Iron Status in Individuals and Populations. World Health Organization; 2020.
16. WHO Guidelines Approved by the Guidelines Review Committee. Guideline on Haemoglobin Cutoffs to Define Anaemia in Individuals and Populations. World Health Organization; 2024.
17. Marasco E, Farroni C, Cascioli S, et al. B-cell activation with CD40L or CpG measures the function of B-cell subsets and identifies specific defects in immunodeficient patients. Eur J Immunol. 2017;47(1):131–143. doi:10.1002/eji.201646574
18. Love MI, Huber W, Anders S. Moderated estimation of fold change and dispersion for RNA-seq data with DESeq2. Genome Biol. 2014;15(12):550. doi:10.1186/s13059-014-0550-8
19. Yu G, Wang LG, Han Y, He QY. clusterProfiler: an R package for comparing biological themes among gene clusters. Omics. 2012;16(5):284–287. doi:10.1089/omi.2011.0118
20. Wu Y, Zhang G, Wang Y, et al. A review on maternal and infant microbiota and their implications for the prevention and treatment of allergic diseases. Nutrients. 2023;15(11). doi:10.3390/nu15112483
21. Radomir L, Kramer MP, Perpinial M, et al. The survival and function of IL-10-producing regulatory B cells are negatively controlled by SLAMF5. Nat Commun. 2021;12(1):1893. doi:10.1038/s41467-021-22230-z
22. Varghese JF, Kaskow BJ, von Glehn F, et al. Human regulatory memory B cells defined by expression of TIM-1 and TIGIT are dysfunctional in multiple sclerosis. Front Immunol. 2024;15:1360219. doi:10.3389/fimmu.2024.1360219
23. Li X, Du H, Zhan S, et al. The interaction between the soluble programmed death ligand-1 (sPD-L1) and PD-1(+) regulator B cells mediates immunosuppression in triple-negative breast cancer. Front Immunol. 2022;13:830606. doi:10.3389/fimmu.2022.830606
24. Komlósi ZI, Kovács N, van de Veen W, et al. Human CD40 ligand-expressing type 3 innate lymphoid cells induce IL-10-producing immature transitional regulatory B cells. J Allergy Clin Immunol. 2018;142(1):178–194.e11. doi:10.1016/j.jaci.2017.07.046
25. Shi C, Pei S, Ding Y, et al. Exosomes with overexpressed miR 147a suppress angiogenesis and infammatory injury in an experimental model of atopic dermatitis. Sci Rep. 2023;13(1):8904. doi:10.1038/s41598-023-34418-y
26. Hasan MM, Nair SS, O’Leary JG, et al. Implication of TIGIT(+) human memory B cells in immune regulation. Nat Commun. 2021;12(1):1534. doi:10.1038/s41467-021-21413-y
27. Niebel D, Fröhlich A, Zarbl R, et al. DNA methylation regulates TIGIT expression within the melanoma microenvironment, is prognostic for overall survival, and predicts progression-free survival in patients treated with anti-PD-1 immunotherapy. Clin Clin Epigenet. 2022;14(1):50. doi:10.1186/s13148-022-01270-2
28. Zhao M, Li MY, Gao XF, et al. Downregulation of BDH2 modulates iron homeostasis and promotes DNA demethylation in CD4(+) T cells of systemic lupus erythematosus. Clin Immunol. 2018;187:113–121. doi:10.1016/j.clim.2017.11.002
29. Gao X, Song Y, Wu J, et al. Iron-dependent epigenetic modulation promotes pathogenic T cell differentiation in lupus. J Clin Invest. 2022;132(9). doi:10.1172/jci152345
30. Brigham EP, McCormack MC, Takemoto CM, Matsui EC. Iron status is associated with asthma and lung function in US women. PLoS One. 2015;10(2):e0117545. doi:10.1371/journal.pone.0117545
31. Drury KE, Schaeffer M, Silverberg JI. Association between atopic disease and anemia in US children. JAMA Pediatr. 2016;170(1):29–34. doi:10.1001/jamapediatrics.2015.3065
32. Serbes M, Eg K. Prevalence and risk factors of iron deficiency anemia in children with atopic dermatitis. J Dr Behcet Uz Child Hosp. 2024;14(1):48–55. doi:10.4274/jbuch.galenos.2024.68693
33. Kliem CV, Schaub B. The role of regulatory B cells in immune regulation and childhood allergic asthma. Mol Cell Pediatr. 2024;11(1):1. doi:10.1186/s40348-023-00174-2
34. Amu S, Saunders SP, Kronenberg M, Mangan NE, Atzberger A, Fallon PG. Regulatory B cells prevent and reverse allergic airway inflammation via FoxP3-positive T regulatory cells in a murine model. J Allergy Clin Immunol. 2010;125(5):1114–1124.e8. doi:10.1016/j.jaci.2010.01.018
35. Braza F, Chesne J, Durand M, et al. A regulatory CD9(+) B-cell subset inhibits HDM-induced allergic airway inflammation. Allergy. 2015;70(11):1421–1431. doi:10.1111/all.12697
36. Sheehan WJ, Maghzian N, Rastogi D, Bollard CM, Lin AA. Decreased regulatory B cells in pediatric patients with asthma. Ann Allergy Asthma Immunol. 2023;131(1):120–121. doi:10.1016/j.anai.2023.04.021
37. Roth-Walter F, Pacios LF, Bianchini R, Jensen-Jarolim E. Linking iron-deficiency with allergy: role of molecular allergens and the microbiome. Metallomics. 2017;9(12):1676–1692. doi:10.1039/c7mt00241f
38. Li J, Cao F, H-l Y, et al. Ferroptosis: past, present and future. Cell Death Dis. 2020;11(2):88. doi:10.1038/s41419-020-2298-2
39. Zeng Z, Huang H, Zhang J, et al. HDM induce airway epithelial cell ferroptosis and promote inflammation by activating ferritinophagy in asthma. FASEB j. 2022;36(6):e22359. doi:10.1096/fj.202101977RR
40. Li M, Li M, Hou Y, et al. Ferroptosis triggers airway inflammation in asthma. Ther Adv Respir Dis. 2023;17:17534666231208628. doi:10.1177/17534666231208628
41. Ramos CF, Doulidis PG, Polakova N, et al. Iron deficiency in dogs suffering from atopic dermatitis. BMC Vet Res. 2024;20(1):506. doi:10.1186/s12917-024-04350-y
42. Thorson JA, Smith KM, Gomez F, Naumann PW, Kemp JD. Role of iron in T cell activation: TH1 clones differ from TH2 clones in their sensitivity to inhibition of DNA synthesis caused by IgG Mabs against the transferrin receptor and the iron chelator deferoxamine. Cell Immunol. 1991;134(1):126–137. doi:10.1016/0008-8749(91)90336-a
43. Leung S, Holbrook A, King B, et al. Differential inhibition of inducible T cell cytokine secretion by potent iron chelators. J Biomol Screen. 2005;10(2):157–167. doi:10.1177/1087057104272394
44. Naderi N, Etaati Z, Rezvani Joibari M, Sobhani SA, Hosseni Tashnizi S. Immune deviation in recurrent vulvovaginal candidiasis: correlation with iron deficiency anemia. Iran J Immunol. 2013;10(2):118–126.
45. Roth-Walter F. Iron-deficiency in atopic diseases: innate immune priming by allergens and siderophores. Front Allergy. 2022;3:859922. doi:10.3389/falgy.2022.859922
 © 2025 The Author(s). This work is published and licensed by Dove Medical Press Limited. The
full terms of this license are available at https://www.dovepress.com/terms
and incorporate the Creative Commons Attribution
- Non Commercial (unported, 4.0) License.
By accessing the work you hereby accept the Terms. Non-commercial uses of the work are permitted
without any further permission from Dove Medical Press Limited, provided the work is properly
attributed. For permission for commercial use of this work, please see paragraphs 4.2 and 5 of our Terms.
© 2025 The Author(s). This work is published and licensed by Dove Medical Press Limited. The
full terms of this license are available at https://www.dovepress.com/terms
and incorporate the Creative Commons Attribution
- Non Commercial (unported, 4.0) License.
By accessing the work you hereby accept the Terms. Non-commercial uses of the work are permitted
without any further permission from Dove Medical Press Limited, provided the work is properly
attributed. For permission for commercial use of this work, please see paragraphs 4.2 and 5 of our Terms.