Back to Journals » Clinical, Cosmetic and Investigational Dentistry » Volume 11
Ion release of chitosan and nanodiamond modified glass ionomer restorative cements
Authors Mulder R ![]() , Anderson-Small C
, Anderson-Small C
Received 19 June 2019
Accepted for publication 31 July 2019
Published 6 September 2019 Volume 2019:11 Pages 313—320
DOI https://doi.org/10.2147/CCIDE.S220089
Checked for plagiarism Yes
Review by Single anonymous peer review
Peer reviewer comments 3
Editor who approved publication: Professor Christopher E. Okunseri
Riaan Mulder1, Charney Anderson-Small2
1Paediatric Dentistry, The University of the Western Cape, Cape Town, South Africa; 2Central Analytical Facilities, Stellenbosch University, Cape Town, South Africa
Correspondence: Riaan Mulder
Paediatric Dentistry, The University of the Western Cape, Office 2129 C-floor, UWC Dental Faculty, Fransie van Zijl Drive, Cape Town 7505, South Africa
Tel +27 21 937 3107
Email [email protected]
Purpose: Ion release from glass ionomer restorative cements (GICs) plays an important role in GICs. The ion release from chitosan and nanodiamond-modified glass ionomers was assessed.
Materials and methods: Three GICs (Fuji IX, Ketac Universal and Riva Self Cure) were modified in the powder phase per weight by adding 5% or 10% of a commercially available chitosan powder (CH) or nanodiamond (ND) powder to the GICs. The specimens with dimensions 4 mm diameter and 6 mm height manufactured from the 15 GIC formulations were allowed to set for 1 hr and subsequently placed in neutral de-ionised water. The released ions were assessed using inductively coupled plasma-mass spectrometer (ICP-MS) to determine the elemental release. Additionally, three different disc-shaped specimens (3 mm in diameter and 1 mm thick) were constructed from each material for scanning electron microscopy (SEM) and energy dispersive X-ray spectrometry (SEM-EDS) microanalysis to establish an ion weight percentage.
Results: There were no significant differences in the ion release between the control materials for aluminium, silicon and strontium. The ion release from CH and most ND-modified GICs were significantly (p<0.00001) increased compared to the control materials. CH modifications significantly increased the ion release of aluminium, sodium, silicon and strontium for all three control materials (with the exception of the strontium release from Ketac Universal that was modified with 5% chitosan).
Conclusion: Ion release can be advantageous to tooth structure due to the interaction of chitosan with the GIC chemistry and moisture during maturation. Ion release up to five times greater than the control was noted for some ions.
Keywords: glass ionomer cement, chitosan, nanodiamond, ICP-MS, aluminium, strontium
Introduction
Fuji IX (GC), Ketac Universal (3M ESPE) and Rive Self Cure (SDI Ltd) are glass ionomer restorative cements (GICs) that are indicated as restorative materials for use in the Atraumatic Restorative Treatment (ART) technique. Fuji IX has been well established as a restorative material for ART, since it has been shown to be durable with satisfying results over several years.1
Their success for the ART technique is partly attributed to the fact that GICs bind well to tooth structure, potentially reducing the risk of micro-leakage between the restoration and the tooth interface.2 The manufacturer of Ketac Universal has indicated that this GIC can be utilised for restorations on primary teeth of any size, as well as limited use in secondary class II cavities.3 Further investigation and modelling of GICs in various cavity designs could be valuable to clinicians based on results reported by Ausiello et al, (2017). The study highlighted the value of cavity-margin-angle designs for their use in Class II resin composite restorations with finite element analysis.4 This method could be utilised in order to assess the influence of GICs and their respective modifications for clinical implementation and cavity-margin-angle designs for their use in Class II restorations.
Ion release from GICs is a key activity towards the mineralization of carious dentine.5 Upon mixing the two components of a GIC (powder and liquid), the acid base reaction continues, until neutralization of the acidic liquid by the basic ions released from the powder, are completed.6 Ion release from GICs have been noted by Ngo et al, (2006) to play a role in the re-mineralization of tooth structure.5
The modification of GICs with chitosan (CH) and nanodiamonds (ND) was explored in this in vitro study, since there may be a resultant surface chemistry that could be advantageous to the ion release properties of GICs. CH is the result of chitin, derived from shell fish being partly deacetylated. The amino-polysaccharide that develops due to this process is known as chitosan.7 Chitosan contains a large number of repeating units of ß-(1-4)-linked glucosamines. This unit has various NH3 and OH− functional groups.8 The cationic amino groups of CH are of particular interest in GIC modification, since it can interact electrostatically with the carboxylic acid group9 of the GIC liquid to form various polyelectrolyte complexes.
Nanodiamond (ND) particles on the other hand have a negative zeta potential due to the presence of multiple carboxylic groups on the surface of the ND particles.10 The cation ions derived from the glass filler parcel of the GICs (aluminium, silicon, strontium and sodium) have the potential to attach to the ND particle.
Billington et al, (2006) stated that traditionally the ion release from GICs was thought to have originated from the exposure of the glass filler particles to the polymeric and tartaric acid11 present in the GIC liquid. It has been shown that ions can release soluble ions into neutral water. From the literature reviewed, it is clear that the ion release from GICs is of importance. Inductively Coupled Plasma Mass Spectrometer (ICP-MS) analysis has previously successfully been used in an acidic medium to assess the ion release from GICs. The only limitation was that fluoride analysis is not possible with this method.12 When a restoration is placed in a tooth or ion release is assessed in vitro the ions present in GICs move from the matrix into the liquid-moist environment and vice versa.13 This is why de-ionised water is a successful medium to assess the ion release behaviour of modified glass ionomer cements for a 24 hr period where the burst effect of ions occur.
The aim of the present study was to assess the ion release of three GICs (Fuji IX, Ketac Universal and Riva Self Cure) after commercially available CH or ND-modification. The hypothesis was that the ion release of the modified GICs will be improved in relation to the respective commercial materials.
Materials and methods
The in vitro study was approved by the ethics committee of The University of the Western Cape (Ethical clearance number: BM/15/7/37).
Study design
Three different commercially available hand-mix GICs were used in this study: Fuji IX (FN: GC Corp, Tokyo, Japan, Batch: 1503231), Ketac Universal (KU: 3M ESPE, Seefeld, Germany, Batch: 583514) and Riva Self Cure (RSC: SDI Limited, Australia, Batch: 62657V). The three GICs were modified in the powder phase per weight percentage (w/w%) by adding 5% or 10% of a commercially available chitosan powder (Sigma-Aldrich, 75% deacethylation, item 448877, CAS: 9012-76-4) or nanodiamond powder (PlasmaChem, item no: PL-D-G01, average particle size: 4–6 nm, Carbon purity >98%) to the GICs. The modified experimental materials were produced by placing the GIC powder in an airtight HDPE 50 mL container. The container was subsequently clamped in a beaker shaker for 2 hrs to ensure complete mixing of the two powders prior to being dispensed using a level manufacturer’s powder spoon per drop of liquid. Upon dispensing with the manufacturer’s spoon, the CH or ND particle incorporation of 5-weight% modification to the GIC powder consisted of 95% commercial GIC and 5%CH or 5%ND per weight. The powder/liquid ratio prescribed by the manufacturer was followed and confirmed on a desktop chemical scale (Metler AE240 analytical balance, Columbus, Ohio, USA) by first dispensing the powder followed by the liquid. This ensured that the manufacturer’s recommended powder/liquid ratio was maintained for all the GICs used in this study.14
Fifteen GICs formulations were prepared in accordance with the manufacturers’ powder/liquid ratio: (1) FN GIC powder [FN]; (2) FN GIC powder modified with 5-wt% chitosan powder [FN5%CH]; (3) FN10%CH; (4) FN5%ND; (5) FN10%ND; (6) KU; (7) KU5%CH; (8) KU10%CH; (9) KU5%ND; (10) KU10%ND; (11) RSC; (12) RSC5%CH; (13) RSC10%CH; (14) RSC5%ND; (15) RSC10%ND.
Sample size and experimental sequence
Five samples of each GIC material were made using a Teflon mould with a cylindrical space of 4 mm in diameter and 6 mm in height. The materials were kept at room temperature (23±1 °C) with a relative humidity of 50±5% and the moulds were stored in a temperature-controlled incubator (37 °C ±1) prior to testing.15–17 After 1 hr of bench curing, the 75 samples were prepared with 4000 grit sand paper on the top and bottom sides of the cylindrical sample and placed in 5 mL of de-ionised water. After being stored in a temperature-controlled incubator (37 °C ±1) for 24 hrs, the GIC material was removed and the de-ionised water used for ICP-MS analysis.
ICP-MS analysis
Trace and major analysis of ions was completed using an Inductively Coupled Plasma Mass Spectroscopy (ICP-MS) unit (Agilent 7900, Santa Clara, CA, USA). This is a suitable method for trace ion analysis of liquids as samples ranging from sub parts per billion to mid parts per million levels can be assessed. The lowest detection limits for the instrument were aluminium 2.51 µg/L; sodium 0.15 mg/L; silicon 0.01 mg/L and strontium 0.08 µg/L. The control sample of de-ionised water and the de-ionised water sample with the unknown ions that leached from the GICs were analysed against National Institute of Standards and Technology (NIST) traceable standards and independent quality control solutions. Sample preparation of the liquids was completed after the calibration acceptance criterion of R2>0.9995 was achieved. Water samples were acidified with Ultra pure HNO3 to a 2% final acid concentration. Particulates were left to settle out prior to analysis. The results obtained were therefore a dissolved fraction of the sample. The instrument conditions were a RF Power of 1600 W, 0.83 L/min Argon carrier gas, and 10 mm sample depth. The make-up gas flowed at 0.15 L/min; He at 5 mL/min, H2 at 6 mL/min and the nebuliser was set at 0.4 mL/min micro mist.
Once the ions have been successfully extracted from the interface region, they were directed into the main vacuum chamber by a series of electrostatic lenses (ion optics). A turbo-molecular pump maintained the operating vacuum in this region at about 10−2 torr. The ion optic region serves to electrostatically focus the ion beam towards the mass separation device and stop photons, particulates, and neutral ion species from reaching the detector.
The ion beam that contained all the analyte and matrix ions exited the ion optics and passed into the mass spectrometer (mass separation device), where a second turbo-molecular pump maintained an operating vacuum of approximately 10−6 torr. The mass separation device, allowed the analyte ions of a particular mass-to-charge ratio (m/z) through to the detector and filtered out all the non-analyte, interfering ions and matrix ions. In the final process, the ion detector converted the ions into an electrical signal. This signal was expressed as counts using Masshunter software for calculating the weight of the present per µg/L. For analysis purposes, all values were converted to mg/L.
SEM-EDS elemental analysis
Scanning Electron Microscopy (SEM) and Energy Dispersive X-Ray Spectrometry (EDS) Microanalysis (SEM-EDS) analysis was completed on the three commercial GICs, to establish a baseline percentage of the elements. Five spectrums were taken on filler particles and five in the matrix. This is essential to allow for sufficient quantification, since it has been shown that the glass filler particle and matrix have different ion concentrations.18 The specimens were first gold sputter-coated (Edwards S150A Sputter Coater) at 40 mA. SEM-EDS of the outer surfaces was then performed (Zeiss MERLIN Field Emission SEM; Carl Zeiss Microscopy, Jena, Germany) at 200x magnification. Five points were chosen in the central field of view on the filler particles and five points in the matrix of the GIC for EDS analysis (generating ten spectrums per specimen). This was essential since it has been shown that ions in GICs vary. The EDS spectra were collected from the central field of view for each specimen under the following conditions: The accelerating voltage of 20 kV and a working distance of 9.5 mm, an 11 nA beam current at 10−6 Torr pressure (high-vacuum) with a 10 s acquisition time and 30–45% detector dead time were used for this application. The elemental analyses (in weight percentage) of the specimens were performed in non-standard analysis mode, applying the PROZA (Phi-Rho-Z) correction method. A Zeiss 5-diode Back Scattered Electron (BSE) Detector (Zeiss NTS BSD) and Zeiss Smart SEM software generated the BSE images. The Semi-quantitative Energy Dispersive X-Ray Spectrometry (EDS) using an Oxford Instruments® (Abingdon, UK) X-Max 20 mm2 detector and Oxford Aztec software were used to chemically quantify the specimens.
Statistical analyses
The results were analyzed with statistical software: R Core Team (2013). R: A language and environment for statistical computing. R Foundation for Statistical Computing (Vienna, Austria). An analysis of variance (one way ANOVA) was performed for homogeneity was used and confirmed with the Fisher's Least Significant Difference t-test between the various means. Statistical differences were set at the significant level of p<0.05.
Results
The ICP-MS results were assessed with the one way ANOVA test for homogeneity of the mean values of ion release into de-ionised water over a 24 hr period for the materials FN, KU, RSC and their CH or ND modifications indicated the presence of significant differences. The data analysis was conducted across the variances. First, each control material was compared with its four modifications. Significant differences between the ion release for the control materials and the means of their CH or ND modifications aluminium, sodium, silicon and strontium (p<0.00001) were identified. The standard deviation (SD):standard error (SE) for each element was aluminium (±SD1.42:SE0.063); sodium (±2.33:1.04); silicon (±3.48:1.55) and strontium (±0.2:0.09). This standard deviation was kept in mind when comparing means from Table 1 for the control materials and their respective CH or ND modifications.
 |
Table 1 Mean ion release (mg/L) of the commercial materials and their respective modifications |
When the comparison of all fifteen materials were completed, significant differences between the material means sodium (p<0.0001); aluminium (p<0.0001); silicon (p=0.0008) and strontium (p<0.0001) were noted once again. The pooled within material standard error difference between any two means was aluminium ±1.47; sodium ±1.47; silicon ±2.2; and strontium ±0.13. This standard deviation was kept in mind when comparing means from Table 1 and Figure 1.
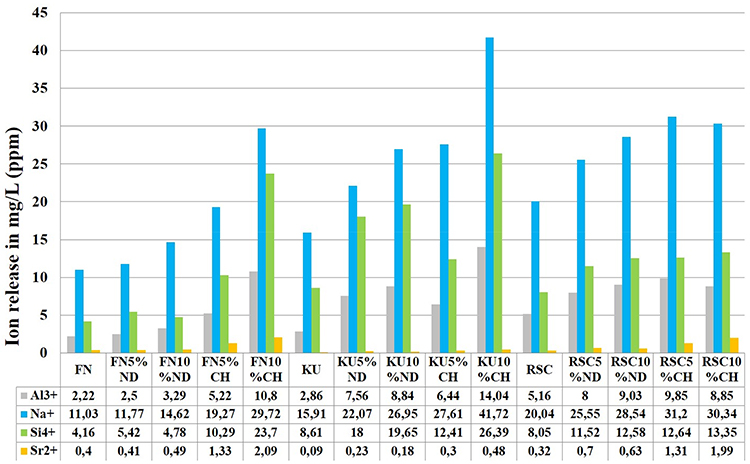 |
Figure 1 Mean ion release (mg/L) of the commercial materials and their respective modifications. |
The comparison of all fifteen materials to one another provided insight as to how the aluminium, silicon, strontium and sodium elements were released from the three control materials compared to the release from their CH or ND modifications.
Aluminium release (Al3+)
There was no difference (p>0.05) between the aluminium releases of the three control materials. There was however a general increasing trend of aluminium ion release from the control materials (FN to KU to RSC) and their 5–10% modification with CH and ND, with exception of RSC10%CH. KU10%CH was the CH modified material with a significantly (p<0.00015) higher aluminium ion release than any one of the remaining fourteen materials. For ND the materials KU5%ND and RSC5%ND released (p<0.00024) more aluminium than FN5%ND.
Sodium release (Na+)
There was a significant difference (p<0.0001) between the control materials with sodium release increasing from FN to KU to RSC.
There was a general increasing trend for sodium ion release from the control materials (FN to KU to RSC) and their 5–10% modification with CH and ND, with the exception of RSC10%CH. KU10%CH was the CH modified material which had a significantly (p<0.00021) higher sodium ion release than any one of the remaining fourteen materials. For ND, the materials KU5%ND, RSC5%ND and RSC10%ND released more sodium (p<0.00024) than FN5%ND, FN5%ND and FN10%ND.
Silicon release (Si4+)
There was no difference (p>0.05) in silicon release between the control materials. There was a general increasing trend of silicon ion release from the control materials (FN to RSC to KU) and their 5–10% modifications with CH and ND. FN 10%CH and KU10%CH displayed a significantly greater silicon ion release (p<0.008) than any one of the remaining thirteen materials. For ND, the materials KU5%ND and KU10%ND released more silicon (p<0.008) than the FN and RSC modifications with CH and ND.
Strontium release (Sr2+)
FN released significantly more strontium (p<0.0002) than KU. There was no difference (p>0.05) in strontium release between FN and RSC as well as between KU and RSC. There was however a general increasing trend of strontium ion release from the control materials (KU to RSC to FN) and their 5–10% modifications with CH and ND. FN10%ND was the only exception. The FN10%CH and KU10%CH modifications had significantly (p<0.0059) greater (p<0.0059) strontium ion release when compared to the remaining thirteen materials. For ND, the materials RSC5%ND and RSC10%ND released more strontium (p<0.004) than KU.
In order to evaluate the ICP-MS results, the ion weight percentage of the commercial materials must be known to be place the ion release versus the gradient weight potential percentage in the GICs into context. The results of the elemental analysis for the three commercial materials (FN, KU and RSC) are presented in Table 2. This weight percentage of the ions present in the GICs provide a potential gradient weight potential percentage available for release into the de-ionised water. There is no clear trend between the three commercial GICs, since their chemical formulations consists of varying weight potentials of ions.
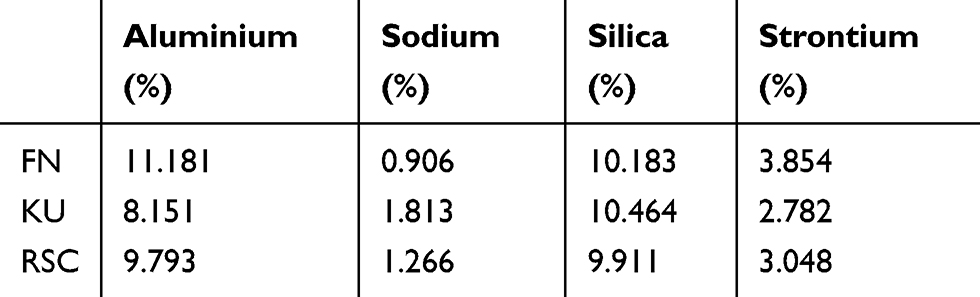 |
Table 2 SEM-EDS elemental analysis of the commercial GICs expressed in percentages |
Discussion
The release of ions from GICs was assessed for CH and ND modifications of three commercially available GICs. The hypothesis was accepted, as all the CH and ND modified GICs were shown to release more ions than their respective control materials.
It became clear from Table 1 that the ion release from the commercial GICs were less than that of the modified GICs. When the gradient weight percentage potential of the GICs were considered in Table 2 the ion release from the CH and ND modifications significantly increased the activity of the GICs and would therefore translate into a greater movement of ions into the tooth structure as well. Aluminium is an essential contributor to GIC strength. After the powder and liquid components of a material have been mixed, the aluminium present in the GICs (without CH or ND particles), usually interact with a variety of ion species and functional groups within the GIC matrix. The carboxylate groups of the GIC liquid, are the primary functional groups that interact with aluminium.19 Between the three commercially available materials (without any CH or ND modifications), the release of aluminium and silicon was not significantly different, illustrating that the aluminium and silicon took part in the acid base reaction and the subsequent integration with the carboxylic matrix. Silicon forms a layer around the glass filler particles during the setting process of the acid-base reaction and continues this formation at the initial stage of GIC maturation. This silicon layer around the glass filler particles is composed of siloxane groups (-Si-O-Si-). Upon exposure to water and after the setting of the GICs is complete, the siloxane group dissociates into a silanol group (-Si-OH).20 The silanol group renders the GICs more hydrophilic and a subsequent increase in the percentage of water absorbed is noted. The water results in the silicon developing the ability to be released from the GICs more readily compared to when the silicon remains in the siloxane group. When the three GICs were modified with CH or ND particles, many more OH− functional groups were introduced to these modified GICs. For example, the OH− surface functional groups present on the NDs used in this study consist of 35% OH− functional groups.21 The result of so many OH− functional groups added to the GIC chemistry is an increased substitution of silicon with water, as many silanol groups were formed with the NDs and even more with the CH particles once the material matured in a moist environment.
The addition of the ND particles to the GICs also allows the silicon from the GICs to bind to the carbon of the NDs and form C–Si bonds. These new bonds are located on the ND surface namely ND–SiC.22 Based on the SEM-EDS elemental analysis (Table 2), the three commercial GICs (FN, KU and RSC) assessed in this study are considered to be high in aluminium, silicon and strontium. Therefore, during mixing, the Si-O-Si network forms readily within the three GICs. The aluminium released from the glass filler particles partly replaces the silicon (from the Si-O-Si) to form the Si-O-Al bonds during the acid-base reaction. These silicon substitutions with aluminium result in the GIC becoming more basic (closer to a pH of 7) and creates negative sites. The results from the negative sites render the glass particles more susceptible to acid attack of the liquid during mixing. In the non-modified GICs, the network dweller ion, namely sodium, is also attracted to these negative sites23 that form when aluminium replaces the silicon. Sodium can also form Si-O-Na bonds, breaking down the silica network and rendering the glass more basic.24 The sodium release increased significantly from FN to KU to RSC. With the sodium ionically bound to the CH and ND functional groups, it is readily released upon water sorption.
Ibrahim et al, (2017) incorporated a small percentage of CH into the liquid of a GIC and found significant improvement of various GIC properties.25 CH particles had a peculiar reaction when incorporated into the GIC powder, as in the present study. As CH is a weak base, it does not dissolve readily in water8 and the commercial CH used in this study also required an acidic medium to “dissolve”. The result was that much of the GIC liquid during mixing became occupied for this purpose. The weight percentage of CH was taken at 10% of the manufacturer’s powder weight and the 10%CH was mixed with the liquid of the respective GICs, as per the manufacturers’ recommendations.14
In a low pH environment the chitosan has a positive charge.9 Initially, during the mixing of the GIC liquid, this positive charge of the CH subsequently reacts by way of self-assembly with the negative carboxylic part of the GIC liquid during the acid-base reaction with the powder. The interactions between the polymeric chains of the chitosan with the GIC liquid (and freeze-dried polyacrylic acid in the powder) lead to the formation of a polyelectrolyte complex network. Hamman et al, (2010) cited that polyelectrolyte complex networks were not permanent structures, since there were no covalent cross-linkers.9 Therefore, aluminium, sodium and silicon which are responsible for stabilisation of the pH, are ionically bound to the CH and very little aluminium, sodium and silicon interacts with the matrix of the GIC to form a viable restoration. Additional ion exchange with positive ions can occur after the pH has stabilised.9 Besides the aluminium, sodium and silicon being bound to the CH, the increased activity of the GIC liquid with the CH functional groups during the mixing of the CH modified GICs therefore speed up the setting process of the CH modified GICs, leaving more aluminium, sodium, silicon and strontium loosely bound with ionic bonds that became vulnerable to being displaced upon water sorption, resulting in a significant ion increase in the control materials (Table 1, Figure 1).
ND particles contain impurities originating from the manufacture and purification processes. These impurities can be chemically bonded to the NDs at any of the various functional groups such as COO−, COOH−, OH− and NH+ or the impurities could be absorbed into the graphite part of the NDs. The impurities used for the GIC modification in this study had various impurities: 10,500 ppm for aluminium, 25 ppm for sodium, 1260 ppm for silicon and 3 ppm for strontium.26 Although the ND particles had these impurities bound to it, the ion release in general was CH > ND > control materials.
For KU and RSC, the ND modifications increased the amount of aluminium and sodium release when compared to the two commercial materials. The ND modification for FN released the same amount of aluminium as the commercial material. For FN, the aluminium and silicon release was similar to the FN-ND modifications, suggesting that aluminium and silicon are integrated into the matrix of the GIC without changing the material’s response to the de-ionised water sorption and subsequent ion release from the material. The same could not be said for FN modified with CH.
Aluminium and silicon continued to take part in the acid-base reaction for the GIC component. Some of the aluminium, sodium, silicon and strontium were bound ionically to the functional groups of the ND particle during mixing of the GIC due to their high activity and many binding sites. The additional carboxylate groups on the ND resulted in the ND modified GICs having a greater capacity for water sorption, than the non-modified GIC materials. When the water entered the ND modified GICs (after the GIC completed the acid-base reaction), the water interacted with the COO−, COOH− and OH− groups of the ND to release the aluminium, sodium and strontium from their binding sites on the ND particle.
Sodium is a relatively small and mobile ion that initially neutralises the COOH− groups of the GICs as the gel phase completes, causing ionic cross-linking in the CH and ND modified GICs. Subsequent to the acid-base reaction being completed and exposure to the de-ionised water, the aluminium replaces the sodium, providing the sodium to be available for release into the de-ionised water.11 This explains the high sodium release.
Aluminium, sodium and strontium can be reduced as aging occurs and forms a thin layer around the ND particle.22 The carboxylic groups on the ND can also form salts27 by way of ion exchange with the aluminium, calcium, silicon and strontium ions. This is therefore the reason why ND-modified GICs release a larger amount of ions than the control materials. The ND modifications of FN and KU released the same strontium as their respective control materials. For RSC, both the CH and ND modifications resulted in significantly greater strontium release.
Limitations
This study only assessed the ion release from GICs into de-ionised water. Future research should include the ion movement into tooth structure in relation to the gradient weight percentage of the ions present in the GICs.
Conclusion
The CH and ND-modified GICs, the aluminium can co-ordinate and interact with carboxylate groups of the polymer liquid, as well as with the functional groups of CH and ND. The CH-modified GICs react with the liquid of the GICs to a much larger extent than the ND-modified GICs due to the polyelectrolyte complex network that forms. The ion release from CH and most ND-modified GICs are therefore significantly increased compared to the control materials. CH modifications significantly increase the ion release of aluminium, sodium, silicon and strontium (with the exception of KU5%CH for strontium) for all three control materials. The ND modifications increased ion release, although not significantly for some ions.
Acknowledgment
This work was supported by The Dental Development Foundation Trust, South Africa, under grant number 04052017MUL.
Disclosure
Riaan Mulder report grants from The Dentistry Development Foundation Trust (DDFT), during the conduct of the study. The authors report no other conflicts of interest relevant to this article.
References
1. Frencken J, Leal S, Navarro M. Twenty-five-year atraumatic restorative treatment (ART) approach: a comprehensive overview. Clin Oral Investig. 2012;16(5):1337–1346;PMCID: PMC3443346. doi:10.1007/s00784-012-0783-4.
2. Fúcio S, Carvalho F, Sobrinho L, Sinhoreti M, Puppin-Rontani R. The influence of 30-day-old Streptococcus mutans biofilm on the surface of esthetic restorative materials—an in vitro study. J Dent. 2008;36(10):833–839;PMID: 18621456. doi:10.1016/j.jdent.2008.06.002.
3. 3M ESPE Deutschland GmbH [Internet]. Ketac universal technical product profile; 2016. Available from: http://multimedia.3m.com/mws/media/1090406O/3m-ketac-universal-handmix-technical-product-profile-ltr-global.pdf.
4. Ausiello P, Ciaramella S, Carcia-Gordoy F, et al. The effects of cavity-margin-angles and bolus stiffness on the mechanical behavior of indirect resin composite class II restorations. Dent Mater. 2017;33(1):e39–e47. doi:10.1016/j.dental.2016.11.002
5. Ngo H, Mount G, Mc Intyre J, Tuisuva J, Von Doussa R. Chemical exchange between glass-ionomer restorations and residual carious dentine in permanent molars: an in vivo study. J Dent. 2006;34(8):608–613;PMID: 16540227. doi:10.1016/j.jdent.2005.12.012.
6. Sidhu S, Nicholson J. A review of glass-ionomer cements for clinical dentistry. J Funct Biomat. 2016;7(3):16;PMCID: PMC5040989. doi:10.3390/jfb7030016.
7. Muzzarelli R. Natural Chelating Polymers; Alginic Acid, Chitin, and Chitosan. Oxford: Pergamon Press; 1973. ISBN: 0080172350 9780080172354.
8. De Stefano C, Gianguzza A, Piazzese D, Sammartano S. Speciation of chitosan–phosphate and chitosan–nucleotide systems in NaCI aqueous solution. Chem Spec Bioavailab. 2010;22(2):99–107. doi:10.3184/095422910X12692701255297
9. Hamman J. Chitosan based polyelectrolyte complexes as potential carrier materials in drug delivery systems. Mar Drugs. 2010;8(4):1305–1322;PMID: 20479980. doi:10.3390/md8041305.
10. Osswald S, Yushin G, Mochalin V, Kucheyev S, Gogotsi Y. Control of sp2/sp3Carbon ratio and surface chemistry of nanodiamond powders by selective oxidation in air. J Am Chem Soc. 2006;128(35):11635–11642. doi:10.1021/ja063303n
11. Billington R, Williams J, Pearson G. Ion processes in glass ionomer cements. J Dent. 2006;34(8):544–545;PMID: 16574301. doi:10.1016/j.jdent.2005.09.008.
12. Wasson E, Nicholson J. A study of the relationship between setting chemistry and properties of modified glass-poly(alkenoate) cements. Br Polym J. 1990;23(1–2):179–183. doi:10.1002/pi.4980230129
13. Williams J, Billington R, Pearson G. The glass ionomer cement: the sources of soluble fluoride. Biomater. 2002;23(10):2191–2200;PMID: 11962660. doi:10.1016/S0142-9612(01)00352-0
14. Mulder R. Variation in the dispersions of powder liquid ratios in hand-mix glass ionomers. Open Dent J. 2018;12(1):647–654;PMID: 30369974. doi:10.2174/1745017901814010647.
15. ISO/TC106/SC1 Filling and restorative materials Technical Committee. ISO 9917-1:2007 Dentistry-Water based cements Part 1: powder/liquid acid-base cements [Internet]. ISO; 2007. Available from: https://www.iso.org/standard/45818.html.
16. Menne-Happ U, Ilie N. Effect of heat application on the mechanical behaviour of glass ionomer cements. Clin Oral Investig. 2013;18(2):643–650;PMID: 23740319. doi:10.1007/s00784-013-1005-4.
17. Twomey E, Towler M, Crowley C, Doyle J, Hampshire S. Investigation into the ultrasonic setting of glass ionomer cements Part II setting times and compressive strengths. J Mater Sci. 2004;39(14):4631–4632. doi:10.1023/B:JMSC.0000034158.69184.84
18. Hatton P, Brook I. Characterisation of the ultrastructure of glass-ionomer (poly-alkenoate) cement. Br Dent J. 1992;173(8):275–277;PMID: 1449858. doi:10.1038/sj.bdj.4808026
19. Nicholson J. Maturation processes in glass-ionomer dental cements. Acta Biomater Odontol Scand. 2018;4(1):63–71;PMID: 30083577. doi:10.1080/23337931.2018.1497492.
20. Czarnecka B, Klos J, Nicholson J. The effect of ionic solutions on the uptake and water-binding behaviour of glass-ionomer dental cements. Ceram-Silik. 2015;59:102–108. Available from http://www.ceramics-silikaty.cz/2015/pdf/2015_04_292.pdf.
21. PlasmaChem GmbH. Purified grade G01 NanoDiamonds. - [Internet]. Plasmachem.com; 2019. Available from: http://www.plasmachem.com/shop/en/nanodiamonds-purified-grade-g01/49-pl-d-g01-nanodiamonds-g01.html.
22. Mochalin V, Shenderova O, Ho D, Gogotsi Y. The properties and applications of nanodiamonds. Nat Nanotechnol. 2011;7(1):11–23;PMID: 22179567. doi:10.1038/nnano.2011.209.
23. Hill R, Goat C, Wood D. Thermal analysis of a SiO2Al2O3CaOCaF2 glass. J Am Ceram Soc. 1992;75(4):778–785. doi:10.1111/j.1151-2916.1992.tb04141.x
24. De Maeyer E, Verbeeck R, Vercruysse C. Reactivity of fluoride-containing calcium aluminosilicate glasses used in dental glass-ionomer cements. J Dent Res. 1998;77(12):2005–2011;PMID: 9839789. doi:10.1177/00220345980770120901.
25. Ibrahim M, Meera Priyadarshini B, Neo J, Fawzy A. Characterization of Chitosan/TiO2 nano-powder modified glass-ionomer cement for restorative dental applications. J Esthet Restor Dent. 2017;29(2):146–156;PMID: 28190299. doi:10.1111/jerd.12282.
26. Volkov D, Proskurnin M, Korobov M. Elemental analysis of nanodiamonds by inductively-coupled plasma atomic emission spectroscopy. Carbon. 2014;74:1–13. doi:10.1016/j.carbon.2014.02.072
27. Panich A, Altman A, Shames A, Osipov V, Aleksenskiy A, Vul’ A. Proton magnetic resonance study of diamond nanoparticles decorated by transition metal ions. J Phys D Appl Phys. 2011;44(12):125303. doi:10.1088/0953-8984/25/24/245303
 © 2019 The Author(s). This work is published and licensed by Dove Medical Press Limited. The
full terms of this license are available at https://www.dovepress.com/terms
and incorporate the Creative Commons Attribution
- Non Commercial (unported, 3.0) License.
By accessing the work you hereby accept the Terms. Non-commercial uses of the work are permitted
without any further permission from Dove Medical Press Limited, provided the work is properly
attributed. For permission for commercial use of this work, please see paragraphs 4.2 and 5 of our Terms.
© 2019 The Author(s). This work is published and licensed by Dove Medical Press Limited. The
full terms of this license are available at https://www.dovepress.com/terms
and incorporate the Creative Commons Attribution
- Non Commercial (unported, 3.0) License.
By accessing the work you hereby accept the Terms. Non-commercial uses of the work are permitted
without any further permission from Dove Medical Press Limited, provided the work is properly
attributed. For permission for commercial use of this work, please see paragraphs 4.2 and 5 of our Terms.