Back to Journals » Pediatric Health, Medicine and Therapeutics » Volume 11
Iodine Status and Discretionary Choices Consumption Among Primary School Children, Kinondoni Tanzania
Authors Venance MS ![]() , Martin HD, Kimiywe J
, Martin HD, Kimiywe J ![]()
Received 10 June 2020
Accepted for publication 4 September 2020
Published 21 September 2020 Volume 2020:11 Pages 359—368
DOI https://doi.org/10.2147/PHMT.S265117
Checked for plagiarism Yes
Review by Single anonymous peer review
Peer reviewer comments 2
Editor who approved publication: Professor Roosy Aulakh
Mario S Venance,1,2 Haikael D Martin,1 Judith Kimiywe3
1Department of Food Biotechnology and Nutrition Sciences, Nelson Mandela African Institution of Science and Technology, Arusha, Tanzania; 2Department of Health, Social Welfare, and Nutrition, Sikonge District Council, Sikonge, Tanzania; 3Department of Foods, Nutrition, and Dietetics, Kenyatta University, Nairobi, Kenya
Correspondence: Mario S Venance Tel +255 686 565 054
Email [email protected]
Background: Tanzania is one of the countries where excessive iodine intake has been reported, to intervene, the identification of possible causes is required. This study aimed to assess iodine status and determine the critical contributors to excessive iodine intakes in schoolchildren aged 8– 14 years.
Materials and Methods: A total of 288 school children were randomly selected in this school-based cross-sectional study in Kinondoni municipality, Tanzania. Household salt samples were analyzed using iodine rapid field test kit while that was collected from retailers/wholesalers by iodometric titration. Spot urine samples were collected and analyzed for iodine levels using a modified microplate method following the Sandell‐Kolthoff reaction. A lifestyle questionnaire was administered to schoolchildren to assess their eating frequency of discretionary foods and salts.
Results: The mean salt iodine content was 53.94 ± 13.02, and over 90% of household salt was iodized. Median urinary iodine concentration (UIC) was 401 μg/L indicating excessive iodine intake, and one-third of the children had UIC > 500 μg/L. Nearly all school children consume discretionary choices as snacks or part of a meal. Potato chips and fried cassava were the top two discretionary choices consumed with discretionary salt use (67.3%). Potato chips (adjusted odds ratio [AOR=9.04, 95% CI: 3.61– 22.63]), fried cassava (AOR=11.08, 95% CI: 3.45– 35.54) and groundnuts consumption for 4– 7 days/week (AOR = 0.30 95% CI: 0.09– 1.0) were significantly associated with iodine intake.
Conclusion and Recommendation: The evidence of excessive iodine intakes observed in previous studies and in this study should alert the policymakers to consider adjustment of the amount of iodine added to salt along with the obligation of reducing discretionary foods and salt intake.
Keywords: excessive iodine intake, discretionary choices, urinary iodine concentration, school children, salt iodization
Introduction
Iodine malnutrition is the leading cause of preventable brain damage. Its deficiency or excess intake affects the normal function of the thyroid gland.1–3 The thyroid gland is necessary for the production of thyroid hormone needed for healthy brain development. Impaired function of these hormones in fetal life causes maternal hypothyroidism, which has cognitive and neurological consequences for the fetus, importantly severe and permanent brain damage.4 Nearly 37% of the world’s School-Aged Children and almost 2 billion people are affected.5 In Tanzania, 25% of school-aged children are at risk of deficiency.6
Universal Salt Iodization (USI) is accepted globally as a means of eliminating Iodine deficiencies among the vulnerable population (Children and pregnant women).7 The implementation of policies on iodine fortification is effective when monitoring systems are robust. The spatial coverage of iodized salt and the level of urinary iodine concentration among vulnerable groups are indicators for USI program evaluation. In Tanzania, median urine iodine concentration (median UIC) among vulnerable groups differs between regions and among studies: ranging from below 100 μg/L to over 400 μg/L for pregnant women.8 For school-aged children, 25% has a median UIC below 100 μg/L and 35% above 300 μg/L,6 indicating low and excess iodine intake.7 That trend highlights the country’s lack of a regulatory framework and monitoring system.
Literature shows that both insufficient and excessive iodine intakes have adverse health effects.9 Because very few foods inherently contain iodine, its intake from natural food is minimal. Attention is paid to increase its intake through USI.7 However, unmonitored supplementation of iodine can cause high intakes of iodine through discretionary salt. It is imperative to assess habitual iodine dietary intakes, particularly in children. Children spend a lot of time in schools and tuition centers.10 They usually eat the food of their own choice away from homes. Discretionary choices (foods higher in saturated fat, added salt, and/or sugar) are usually consumed due to their addictive, highly advertised, readily available, good taste, affordable, and peer-pressured.10 Among these food groups, potato chips are mostly consumed,11 where they add salt on consumption.12 Iodine intake through these foods may be high or low, depending on whether iodized salt is used or not.
Following the nutrition transition in Tanzania,13–15 iodine overnutrition is accelerating8,16 and is well documented in Dar es Salaam, especially among children.6,17,18 Nonetheless, its contribution factor is undocumented. Overconsumption of discretionary choices as a result of the dietary shift has been linked with increased diet-related non-communicable diseases.19 However, there is a lack of data on the consumption of discretionary foods and daily iodine intake, specifically in countries where all salt for human and non-human consumption is mandatorily iodized. Consequently, this study aimed to assess Iodine status and discretionary choices consumption among primary school children in Kinondoni Municipality, Tanzania.
Materials and Methods
Study Design and Sampling Procedures
The study was a school-based cross-sectional study involving schoolchildren aged 8–14 years selected from high and low socio-economic groups (HSGs and LSGs) in the Kinondoni Municipality, Dar es Salaam. The municipal council planning officer provided the worth index of each ward while the list of schools was obtained from the primary school education department. A socio-economic difference between the two groups provides an opportunity to investigate their influence on the iodine status. A total of eight schools, four schools from low SES and high SES were randomly selected. Schools were chosen from each group using probability proportionate to size sampling technique.7 A sample size of 288 was determined based on a previous prevalence of insufficient iodine intake of 25% found in school-aged children.6 The estimate generated was based on a marginal error of 5% and a confidence interval of 95%.
Data Collection
Enrolment and data collection were done between May and August 2019. The trained research team visited the ward education officer of the five selected wards before the school visit to provide preliminary information about the study. The ward education officers introduced the researchers to the school headteachers and other teachers. The aim and the schedule of the activities were discussed with all teachers to ensure collaboration in recruiting children. Questionnaires with both open-ended and closed questions were used to collect demographic information and discretionary food intake. Pre-testing of the questionnaire was conducted in one school other than the participating schools. The questionnaires were modified accordingly.
Dietary Assessment
In the more extensive study, we evaluated the dietary practices along with Knowledge, Attitude, and Practices using modified dietary assessment methods and specific iodine deficiency-related questionnaires, respectively, recommended by FAO.20,21 A single 24 hours dietary recall (24HR) and the qualitative Food Frequency Questionnaire were used. In the present study, the eating habits questionnaire was primarily developed and applied in a pilot test to check for inconsistencies and evaluate protocols for applicability and data entry. Validation was not performed because questions were dealt with separately and aimed at categorizing groups. Children were provided with a list of commonly discretionary choices to indicate the frequency of consumption over the last seven days. The eating frequencies were finally grouped into: never, 1–3, and 4–7 days/week. Real food and pictures were used to decrease the variations between the interviewer and interviewee.22
Anthropometric Measurements
Anthropometric measurements were conducted following standard procedures.23 Bodyweight was taken using a SECATM electronic scale with a precision of 0.1 kg while the height was measured using SHORRTM two pieces height board at the nearest 0.1 cm. The weight of participants was measured with light clothing and without shoes. BMI for age was calculated using WHO Athro plus, whereby children with BMI ≥ 95th percentile for age and sex were classified as obese, between 85th and 95th percentile as overweight and those between 5th and 85th percentile as healthy weight.24
Salt Collection and Salt Iodine Analysis
Salt samples were collected from pupil’s homes and in retail stores for iodine analysis. Every participating child brought two teaspoons of salt from home in a clean airtight plastic bag provided by the research team. Each salt sample from children was measured qualitatively for iodine levels using a rapid field-tests kit (MBI KITS).7 The kits contain a stabilized starch-based solution. A drop of the solution dripped on a white tile of salt, and the color chart was used to classify the salt iodine levels and expressed in ppm (sufficient ≥15 ppm, medium <15 ppm, and no iodine 0 ppm).7 Qualitative iodine analysis using iodometric titration was employed to salt samples collected from food vendors and retail/wholesale stores according to standard procedures.7
Urine Collection and Urinary Iodine Analysis
The urine sample was collected and handled, as proposed by Delange et al,25 Each child provided 15–20 mL of spot urine in a sterile, iodine-free 40 mL plastic universal urine container. An aliquot of urine (10 mL) was transferred to a plastic falcon tube with the child’s serial number, date, and school name. The sample was then stored in a cool box at 4 °C and finally transported to Tanzania Food and Nutrition Centre (TFNC) and stored at −20 °C before analysis. UIC was analyzed by a modified microplate method following Sandell‐Kolthoff (S‐K) reaction.26 Both internal and external quality control materials were used covering high, medium, and low iodine concentration run between and within assays.
Data Processing and Analysis
Analysis of data was done using SPSS version 23.27 Descriptive statistics were tabulated as numbers and proportions for categorical variables, continuous variables as mean and standard deviation, or as the median and percentile. Both parametric and non-parametric tests were used in testing hypotheses. For continuous variables, Independent Samples t-Test were used, while for the non-parametric test Mann–Whitney U-test and Kruskal–Wallis test were used. The Kolmogorov–Smirnov test tested normality assumptions of how the variables are distributed. A Chi-square test was used in testing hypotheses for categorical variables. Iodine status within a group was compared using median UIC as per WHO recommendation. The logistic regression model was used to evaluate factors associated with excess iodine intake (UIC >300 µg/L). Excess iodine intake was used in all models as the dependent variable, while independent variables were as tabulated. The Hosmer-Lemeshow statistic was used to test the goodness of fit of the model. Results are classified as odds ratios (OR) at 95% confidence intervals. Statistically significant differences were set at p<0.05.
Results
Sample Characteristics of Respondents
The study enrolled a total of 288 schoolchildren in the age group of 8–14 years old. Two hundred sixty-six participants provided their urine and household salt sample, making a participation rate of 92.4%. The characteristics of the sample by socio-economic groups are in Table 1. The entire population included 47.7% (n =127) girls and 52.3% (n = 139) boys. Gender, Age group, and BMI had no significant differences with socio-economic groups. However, the iodine level of household salt and age had a significant difference between the two groups, p=0.001 and 0.015, respectively. The mean salt iodine content was 53.94 ± 13.02 ranging from 29.6 ppm to 71.9 ppm.
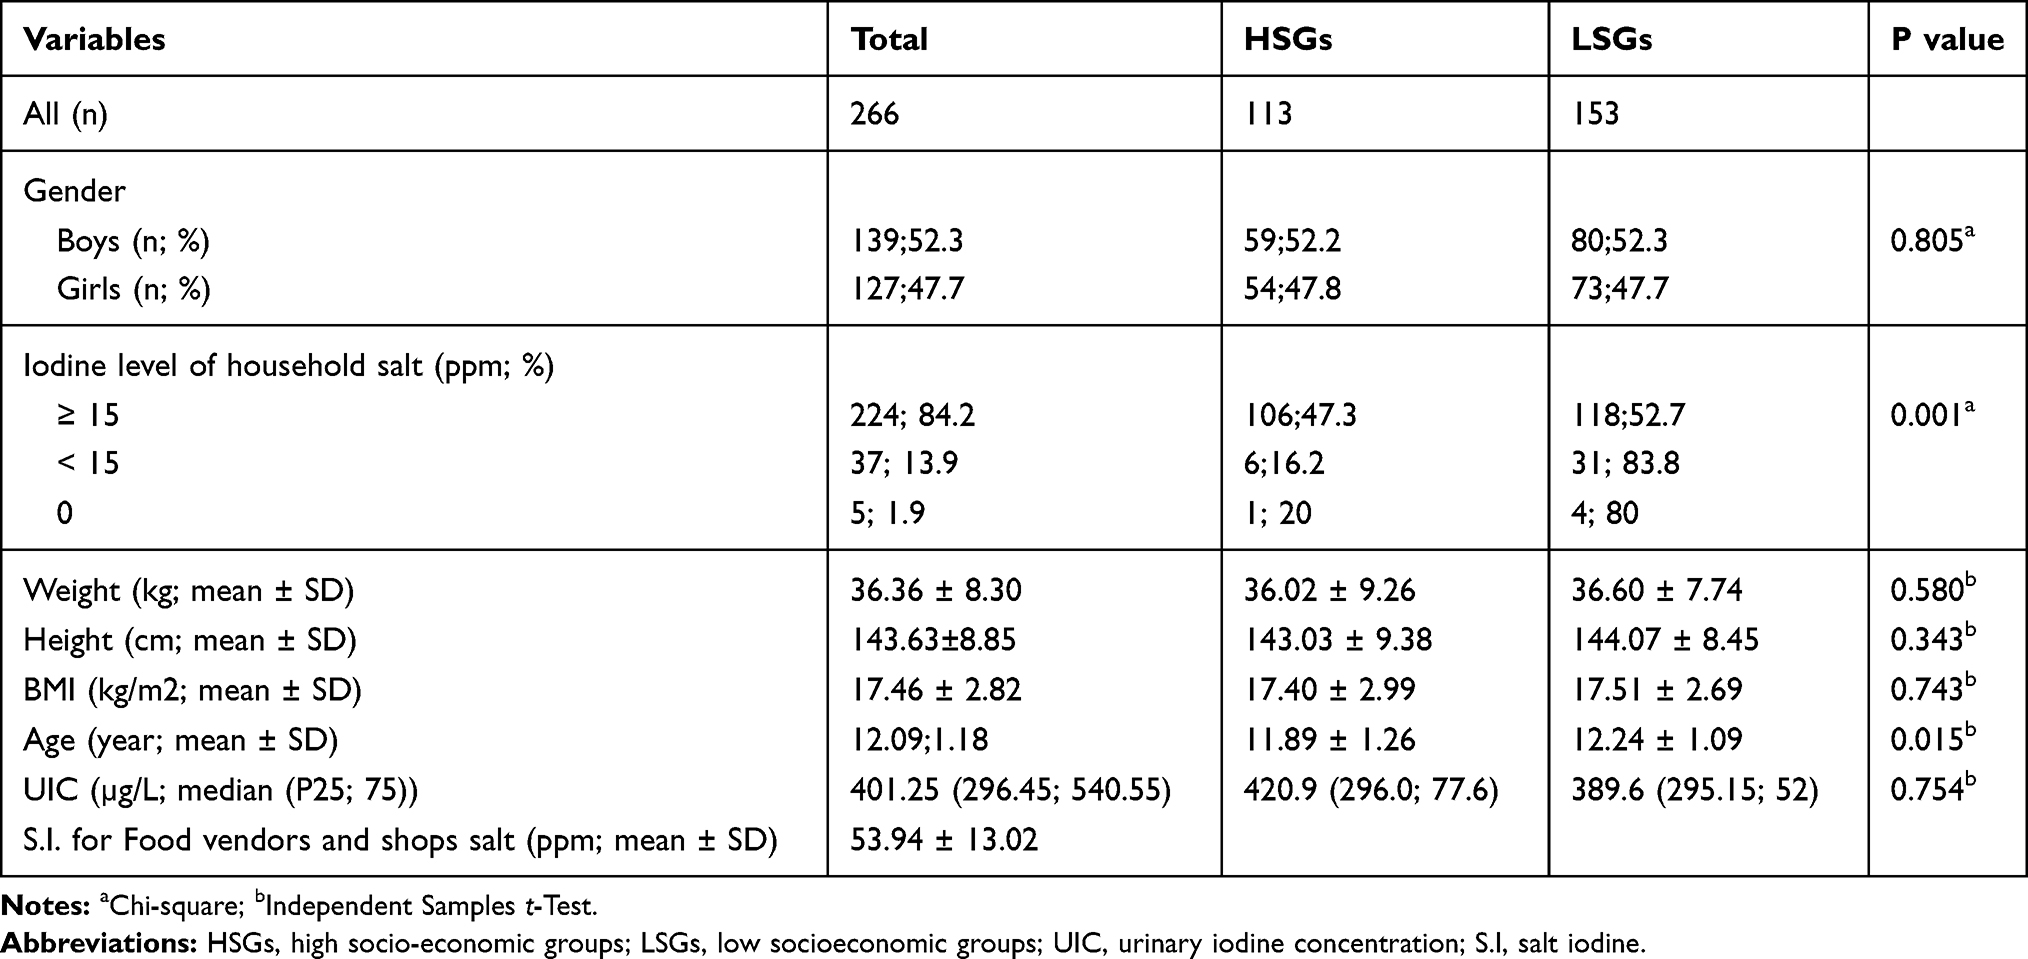 |
Table 1 Sample Characteristics of Respondents |
Urinary Iodine Concentrations
Iodine Status by School Socio-Economic Groups
The World Health Organization classify a median UIC of < 100 µg/L, as insufficient intake,100–199 µg/L, as adequate intake, 200–299 µg/L, as more than adequate and ≥ 300 µg/L as excess intake. The results show that the median UIC was 401 µg/L, indicating excessive iodine intake. The median UIC between the two groups had no significant differences, ranging from 420.6 µg/L in HSGs to 389.6 µg/L in LSGs. Based on the UIC category, the proportion of children with UIC above 300 µg/L was 73.7%. Furthermore, only 1% of the population had insufficient iodine intake (Figure 1).
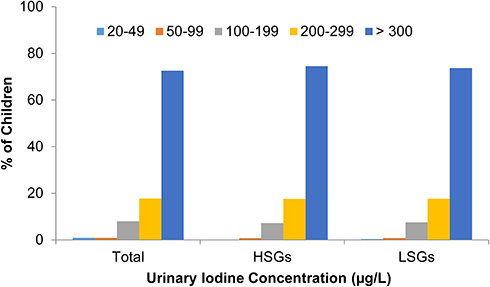 |
Figure 1 Urinary iodine concentration among Schoolchildren based on WHO Classification for Iodine Adequacy. |
Iodine Status by Demographic and Anthropometric Data
Table 2 illustrates the association between iodine status with demographic and anthropometric variables. The median UIC in girls was significantly lower than in boys (386.0 vs 414.48 µg/L, respectively); (P =0.04). Consequently, the percentage of the participants with UIC ≥300 µg/L was lower in girls than in boys (45.4% vs 54.6%), respectively. Based on WHO cut off points for excessive iodine intake, results indicate that 73.8% of the children ≤12 years old had an intake above 300 µg/L. Overweight and obese children had a higher level of UIC than their counterparts (Table 2).
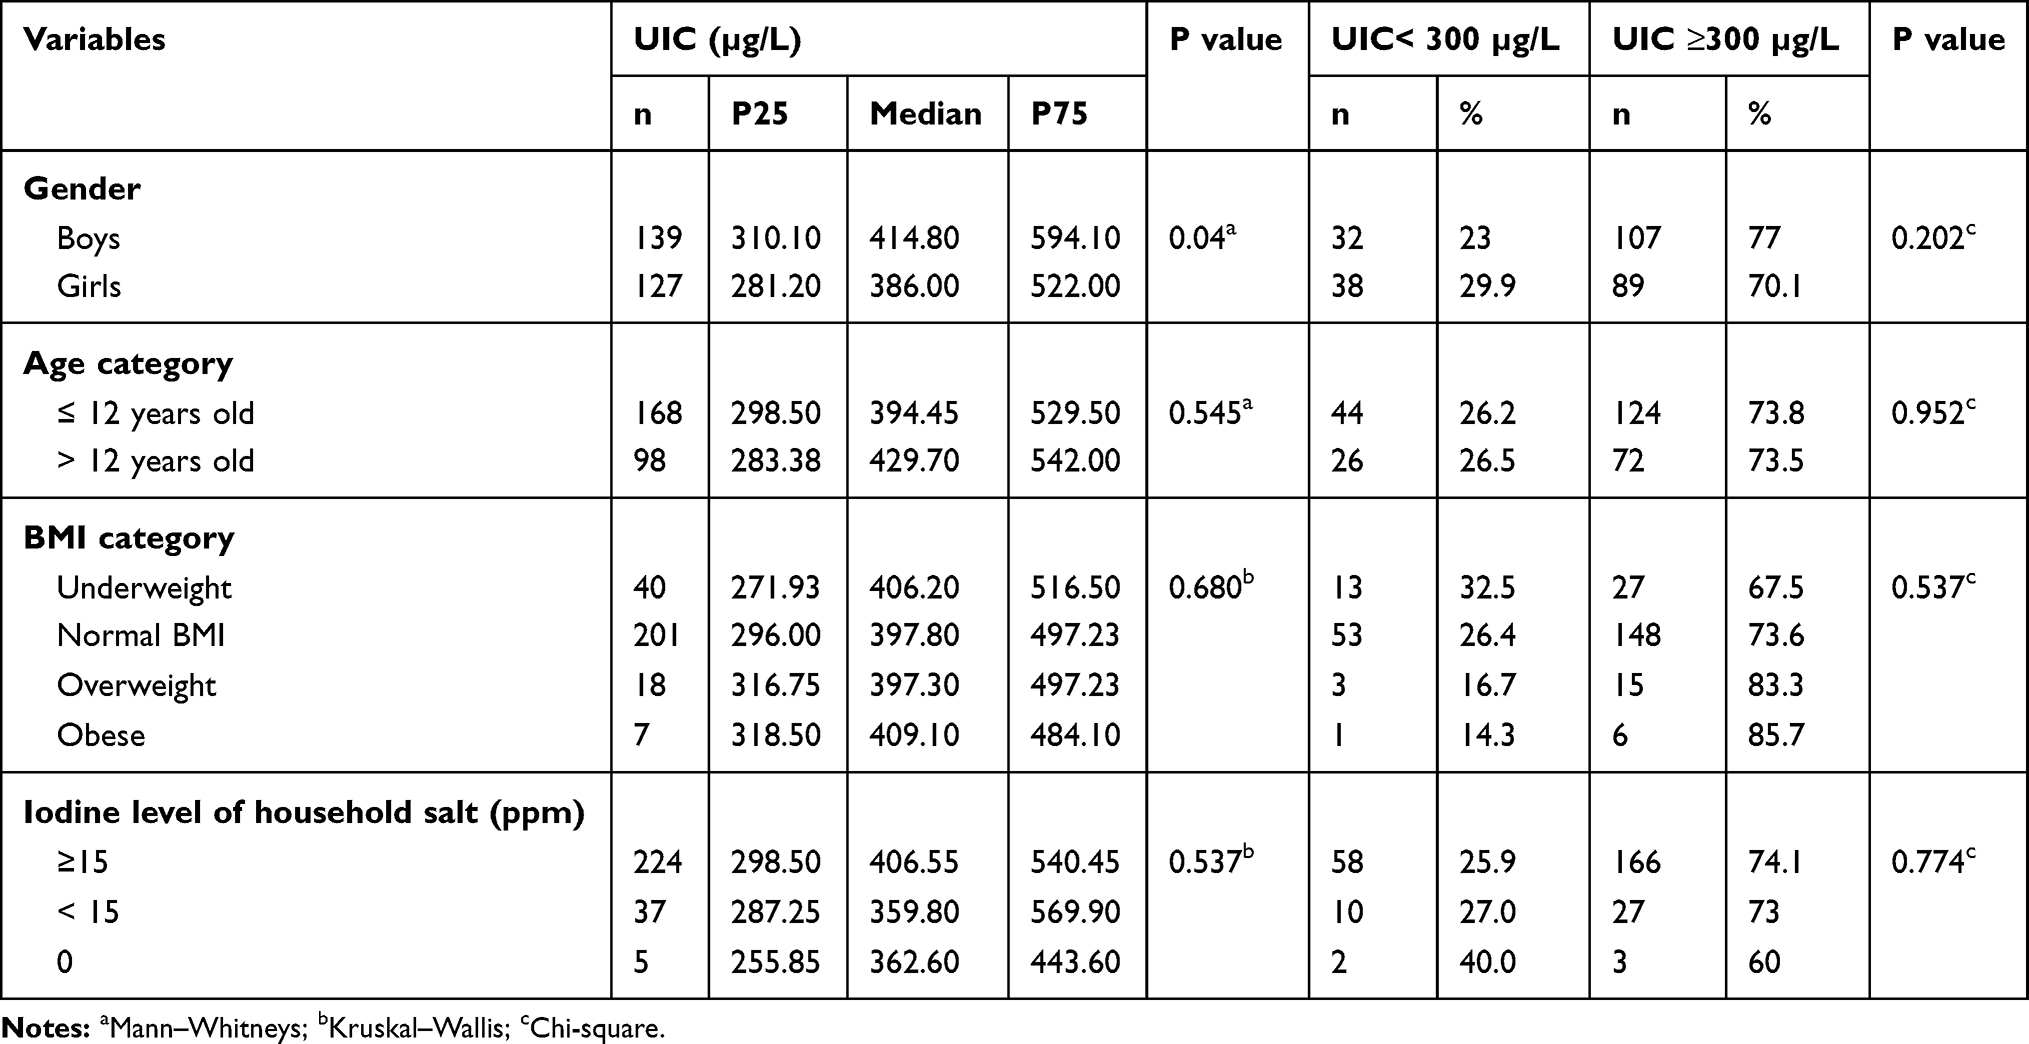 |
Table 2 Socio-Demographic, Anthropometric and Urinary Iodine Status of Children |
Urinary Iodine Concentration and Dietary Iodine Intake
Potato chips, fried cassava, kachori, and groundnuts had a significant association with iodine status. Evaluation of the effect of chips consumption on UIC indicates that 46.5% of the children who never consumed chips in the previous week had UIC <300 µg/L. This cluster corresponds to 32.3% of the population. In comparison, 46.5% of children in this group who never eat potato chips and only 20.2% of children who eat at least once a week had UIC < 300 μg/L (p < 0.001) [Table 3].
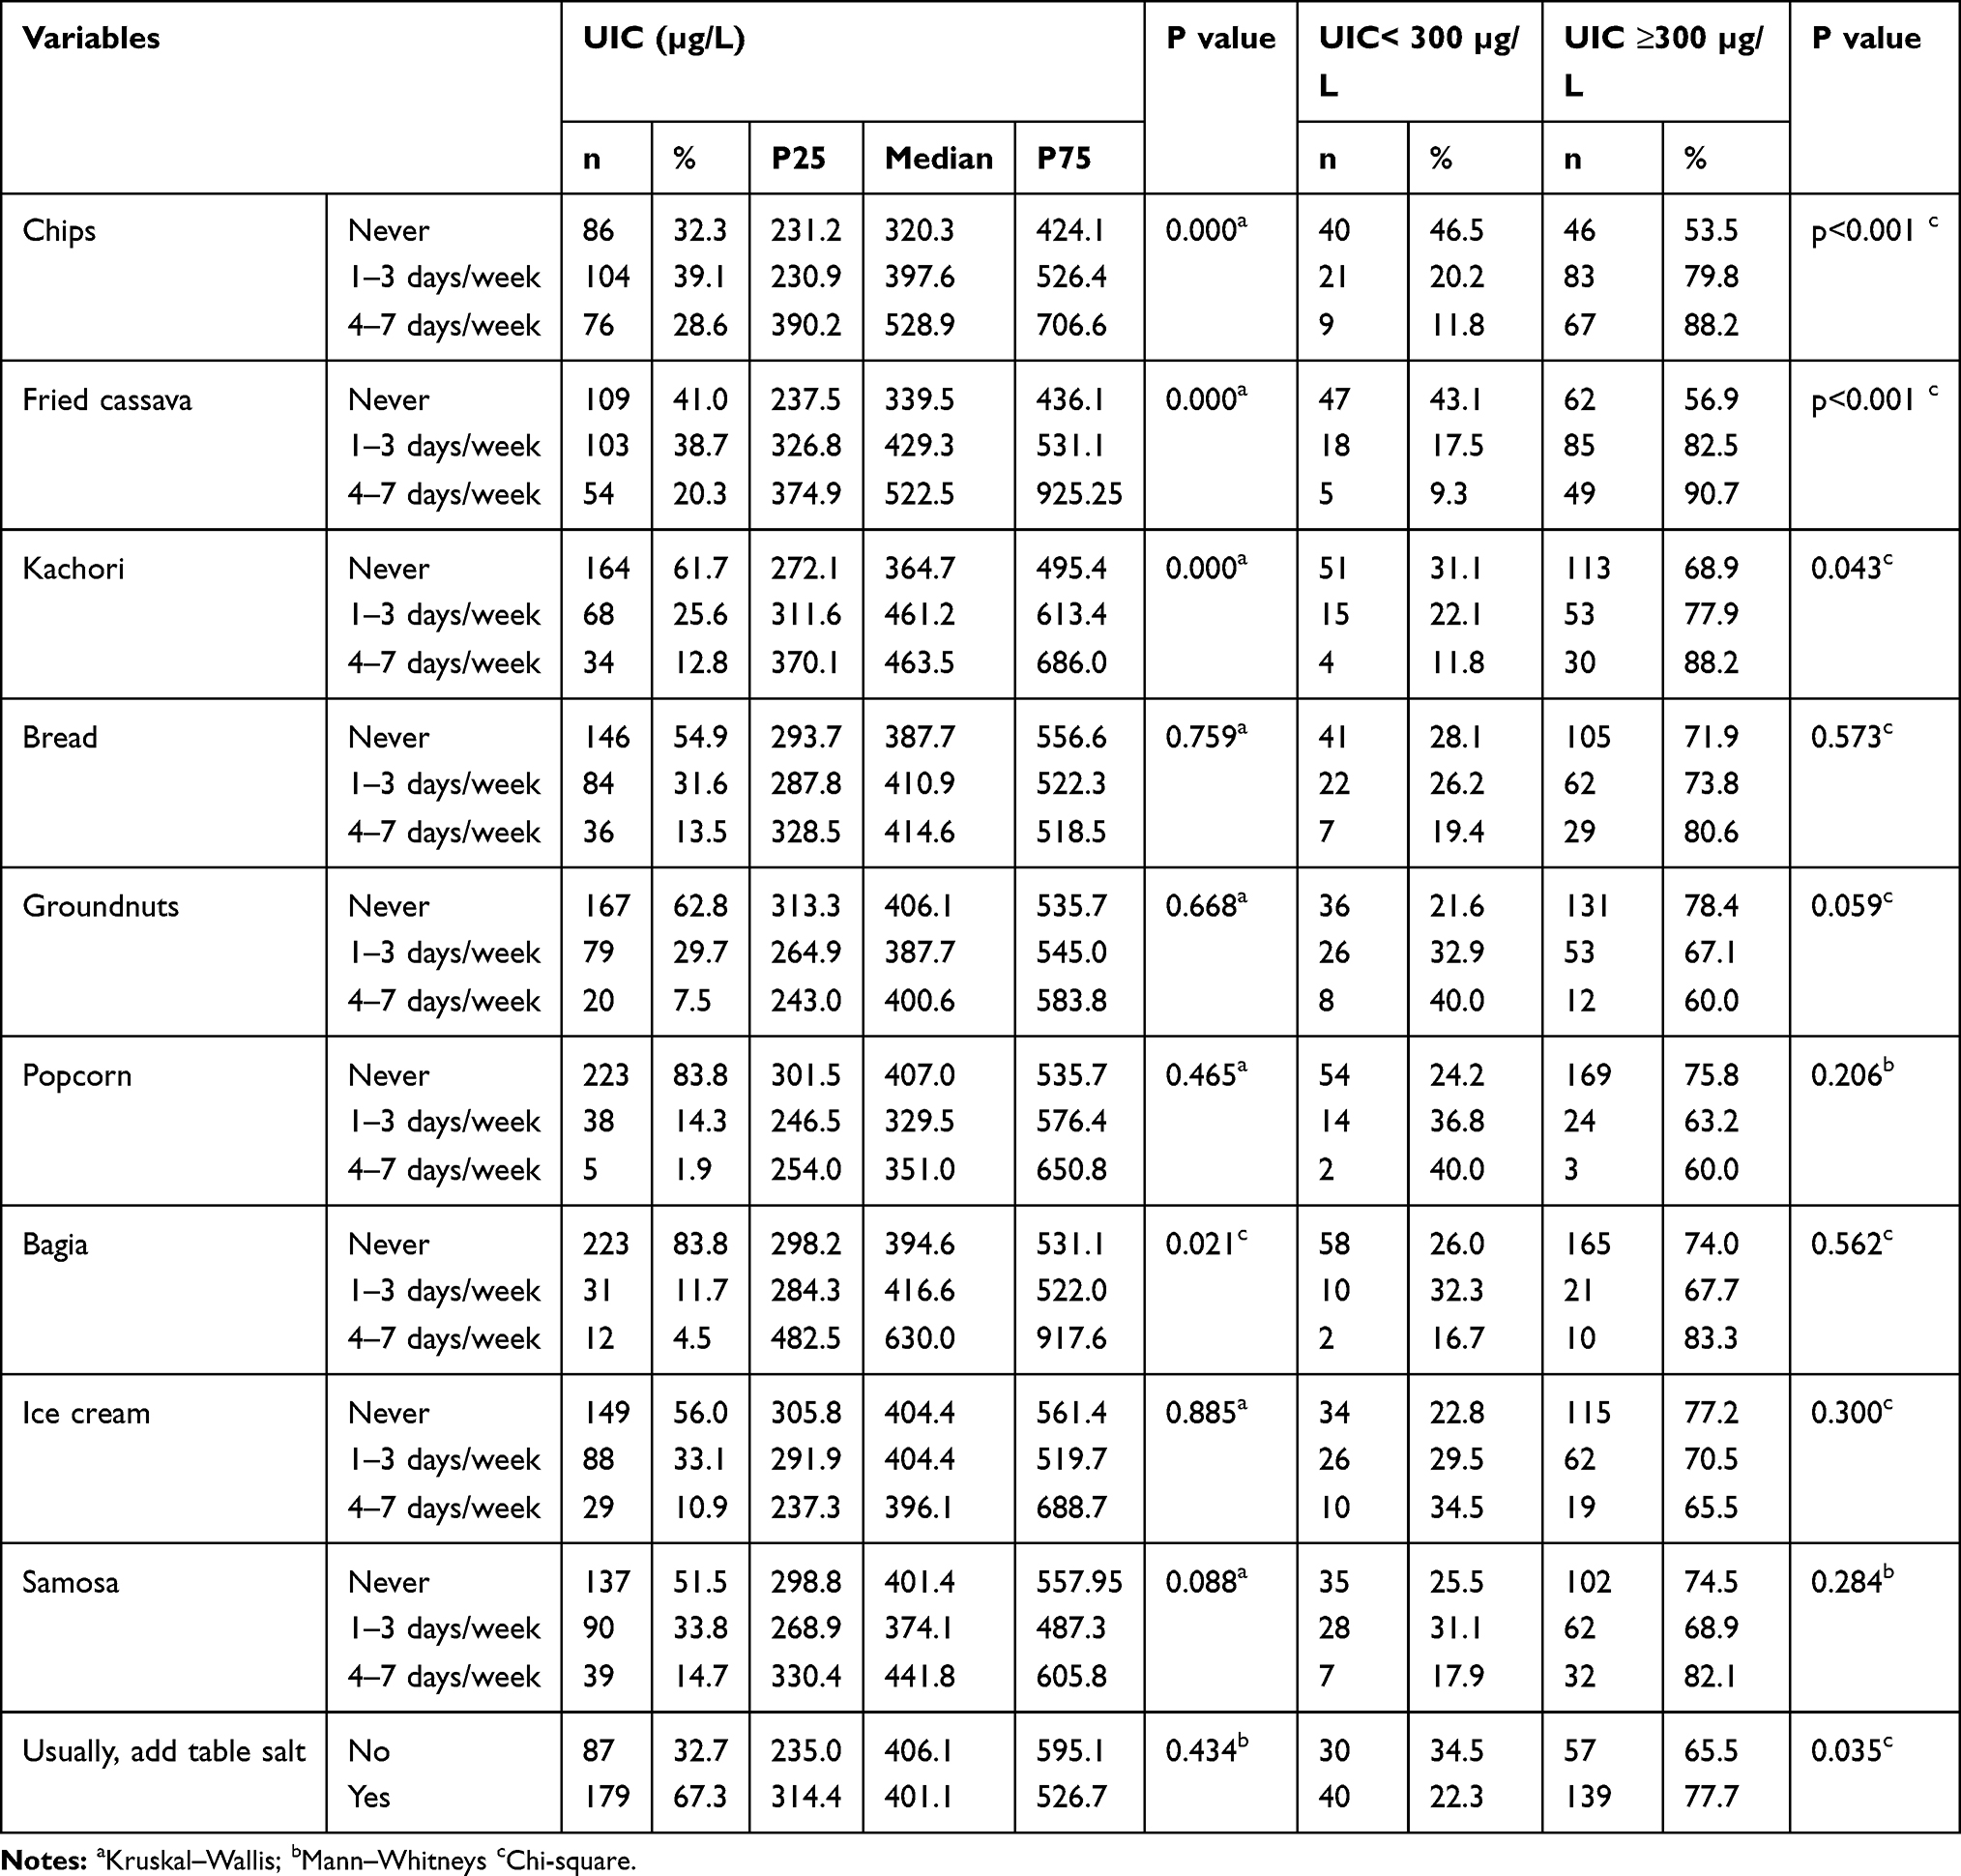 |
Table 3 Dietary Habits and Urinary Iodine Status |
As anticipated, the risk of having UIC >300 µg/L were significantly associated with chips and fried cassava consumption. The odds of having UIC >300 µg/L increases with the number of frequencies of consumption. Compared to those who never consume potato chips, those who consumed for 1–3 days/week have 5.07 times higher odds (OR=5.07; 95% CI (2.32 to 11.1); p < 0.001) while those consumed for 4–7days/week have 8.51 times higher odds (OR=8.51; 95% CI (3.3 to 21.99; p < 0.001) to be having UIC > 300. For fried cassava, those who consume for 4–7 days/week has 8.82 times higher odds than non-consumers (OR = 8.82; 95% CI (2.658–29.286); p < 0.001). Also, children who add table salt on consumption have 1.8 times higher odds to be having UIC > 300 than those not usually add table salt OR = 1.83; 95% CI (1.04–3.22); p = 0.036) [Table 4].
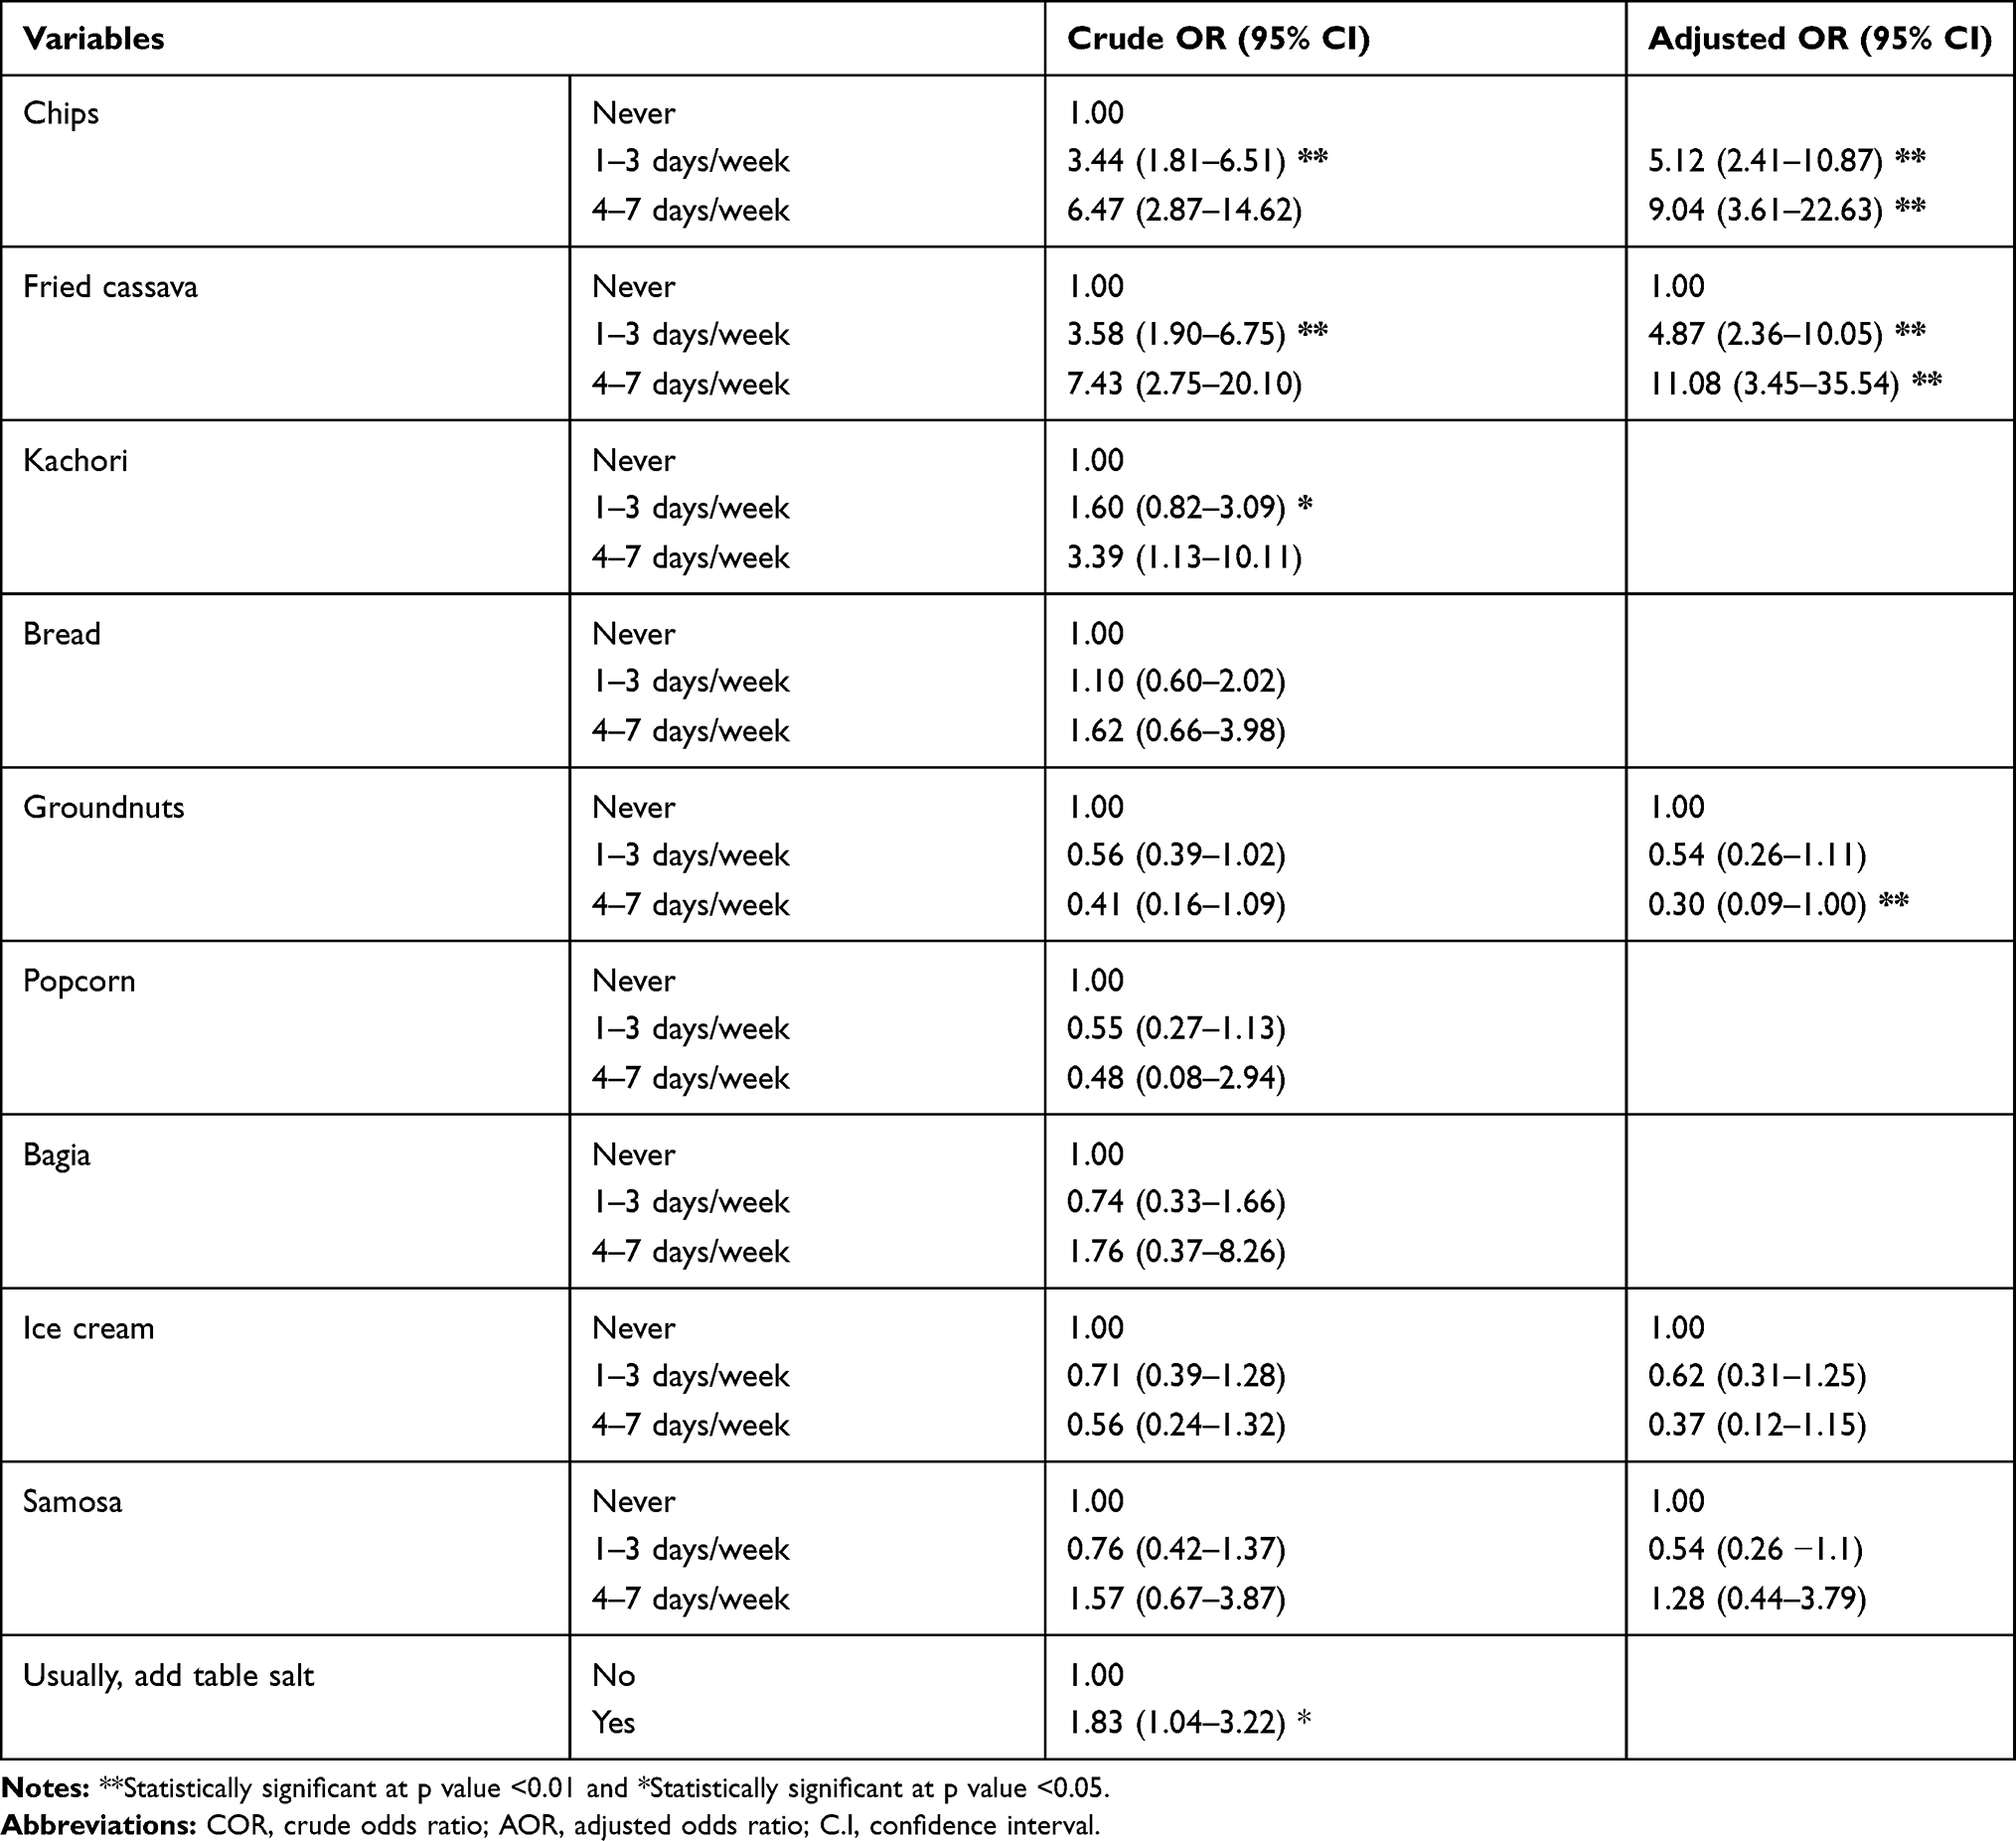 |
Table 4 Logistic Regression Models for the Relation Between UIC > 300 µg/L and Frequency of Consumption of Various Food Products |
Discussion
The study evaluated schoolchildren’s iodine status with their dietary intake in Dar es Salaam, Tanzania, between May 2019 and August 2019. The median UIC was 401 μg/L, suggesting excess iodine consumption in this population group based on WHO criteria. While in 2013, Kinondoni had a median UIC of 388 µg/L,17 the present study indicates an increase to 401.0 µg/L, and only 1.1% has insufficient iodine intake (UIC <100 µg/L). Besides, the last published Tanzania national iodine survey by Assey et al,6 the median UIC was 203.6 µg/L indicating more than adequate. Albeit, in recent years, the prevalence of excess intake of iodine in this population might have been increased. The study by Assey et al,6 also reports that 35% of school-aged children had UIC > 300 μg/L, which differs significantly, with 73.7% in this study.
Previously, Total Goiter Prevalence was higher in the lower socio-economic status.28,29 In our study, the location of the school in different socio-economic status areas had no impact on iodine status. However, as expected, the median UIC is higher in high socio-economic status than their counterpart. The reason could be that people with poor socio-economic status may use non-iodized salt as they find it cheaper and more efficient than iodized salt. Results in this study are consistent with other studies when comparing iodine status by sex; girls had lower iodine status compared to boys.30 As noted by Johner et al, this might be attributed to a lower intake of energy by girls.31
Over the past few decades, iodine deficiency control has made remarkable progress across Africa. Sustaining this success, however, continue to be a significant challenge as it needs close cooperation among partners at various levels and active monitoring with small-scale salt producers.32–34 In some countries where the fortification of iodine is mandatory, the incidence of excessive iodine consumption among school-aged children has increased.6,17,35,36 This increase is significant and needs strengthening of monitoring systems in Iodine Deficiency control programs, such as adjusting iodine concentration in fortified salt.
School feeding program not only improves learning abilities and children attendance but also help to control the quality and type of food given to children. The majority (71.4%) of the primary schools studied had no school-feeding program. Thus pupils depend on food prepared by food vendors.37 The findings regarding the type of food sold show that the majority sell fried food such as potato chips and fried cassava (data not shown). The exposure to this type of food could lead to child obesity, which in this study found that 6.8% and 2.6% of the children were overweight and obese, respectively. More importantly, these foods relay on table salt addition.12 This practice of adding raw salt to food may expose children to excessive iodine intake, especially if the salt is over iodized.
Excess iodine consumption is associated with an increased risk of hyperthyroidism and autoimmune thyroid disorders, although, in most cases, the body can tolerate.9 In people with present or past thyroid disorders, only small changes in iodine intake may trigger thyroid disorders.38 Generally, in countries previously identified as iodine insufficient like Tanzania, iodine consumption is recommended not to exceed 500 μg/day.7 Nonetheless, it is understood that the benefits of avoiding the consequences of iodine deficiency overshadow the side effects of slightly excessive iodine intake.39 While this may be of concern in Tanzania because about one-third of the population studied had UIC > 500 µg/L, it is crucial to monitor this population in the upcoming iodine deficiency monitoring and control program.
The percentage of households using any iodized salt in our study was 98.1%, but among these, 85.3% were using adequate iodized salt (15+ ppm), corresponding to 84.2% of the whole population. Furthermore, findings suggest that the use of iodized salt in this population is close to 90% household coverage, as recommended by WHO.
Attaining adequate iodine nutrition in a community that consumes 10 g of salt per day, 20–40 ppm of iodine is recommended at the production level.7 However, the existing regulation on salt iodization in Tanzania is 40–80 ppm and 25–70 ppm at production and point of sales, respectively.40 With the current nutrition transition, coupled with the high consumption of discretionary foods, improved market chains, and salt handling practices, users are likely to be exposed to excess iodine intake. Our study further noticed that the mean iodine content of the selected commonly used salt brands by food vendors and households at the point of sales was above 25–40 ppm as required by WHO, indicating over iodization.
This shows that, if discretionary salt intake is high, then people are likely to have excess iodine intake. Interventions are required to reduce excessive iodine through the reduction of iodine concentration added to salt during the iodization process, like in Kenya and Brazil.41,42
In our study, the importance of potato chips and fried cassava consumption to the excessive iodine intake in schoolchildren was evident. The odds of most frequently consuming potato chips were 8.5 times higher compared to those who never consumed. Inherently, potatoes and cassava do not contain much iodine enough to causes excess intake.43 Thus, the excess consumption may be caused by discretionary salt added to this food when consumed.12 Although the study did not quantify the amount of sodium/iodine in these foods, a previous study by Lobanco et al, indicated that the sodium content of potato chips is 62.3 mg/100g,44 and contribute to more than 2% of salt intake in children.12 Exposure to this food on a daily bases could lead to excess iodine intake. Because reducing the population intake of discretionary choices will be very challenging, interventions aiming at reducing salt intake through discretionary foods should also go along with adjustment of the iodine content of salt during the iodization process.
Limitations of the Study
The study applied a laboratory-based approach to testing the urinary iodine and salt samples collected from food vendors and retail/wholesalers. Nevertheless, the study did not quantify the amount of iodine consumed through discretionary foods and salts. Also, the dietary assessment method used was qualitative and relied on self-reports hence may not reflect precisely the habitual dietary intake. Future studies in Tanzania should thus focus on both qualitative and quantitative dietary assessment along with household per capita salt intake, the use of iodized salt in processed foods, and the iodine content of the commonly consumed discretionary choices.
Conclusion
Iodine levels added to salt in Tanzania remained constant since 2010 despite the nutrition transitions that exist. The evidence of excessive iodine intakes in a population observed in previous studies, and this study should alert the policymakers to consider adjustment of the amount of iodine added to salt. High intakes of iodine in this population are likely due to a combination of both salt iodine concentrations above acceptable levels and excessive consumption of salt through discretionary choices. Since there is no single policy solution, a range of interventions will be needed to ensure optimum iodine intake. Adjusting the current iodine level added to salt, regularly monitoring of iodine nutrition in vulnerable groups, along with an effort to reduce discretionary foods and salt intake, is necessary to ensure optimal iodine intake.
Data Sharing Statement
The dataset which supports the conclusions of this article are available upon request.
Ethical Considerations
This study was conducted in accordance with the Declaration of Helsinki. The proposal was reviewed and approved by The Northern Tanzania Health Research Ethics (Certificate number KNCHEC0012), and the research permit was sought from the Municipal primary education officer and school headteachers. Parents/legal guardians were given all detailed information about the study by their children one day before data collection, together with consent forms to complete if they agreed to their child’s participation. The signed informed, voluntary, and written consent forms were collected from each of the participating children before commencing the data collection. Children whose parents/legal guardians decline to consent to their child’s participation in the study were excluded. Each participating child assented verbally. All participants were notified of possible risks, benefits, anonymity, and the right to withdraw from the study.
Acknowledgments
We would like to thank the Kinondoni Municipal and Tanzania Food and Nutrition Centre staff, children, parents, and teachers who agreed to take part in this study. Our heartfelt thanks go to the Africa Centre for Research, Agricultural Advancement; Teaching Excellence and Sustainability at Nelson Mandela-African Institution of Science and Technology for sponsoring this study.
Author Contributions
All authors made a significant contribution to the work reported, whether that is in the conception, study design, execution, acquisition of data, analysis and interpretation; took part in drafting, revising or critically reviewing the article; gave final approval of the version to be published; have agreed on the journal to which the article has been submitted; and agree to be accountable for all aspects of the work.
Disclosure
The authors report no conflicts of interest in this work.
References
1. Katagiri R, Yuan X, Kobayashi S, Sasaki S. Effect of excess iodine intake on thyroid diseases in different populations: a systematic review and meta-analyses including observational studies. PLoS One. 2017;12(3):e0173722.
2. Shen H, Liu S, Sun D, et al. Geographical distribution of drinking-water with high iodine level and association between high iodine level in drinking-water and goitre: a Chinese national investigation. Br J Nutr. 2011;106(2):243–247.
3. Zimmermann MB, Boelaert K. Iodine deficiency and thyroid disorders. Lancet Diabetes Endocrinol. 2015;3(4):286–295.
4. Hetzel B. Iodine deficiency disorders (IDD) and their eradication. Lancet. 1983;322(8359):1126–1129.
5. Zimmermann MB. Iodine deficiency in industrialized countries. Clin Endocrinol (Oxf). 2011;75(3):287–288.
6. Assey VD, Peterson S, Kimboka S, et al. Tanzania national survey on iodine deficiency: impact after twelve years of salt iodation. BMC Public Health. 2009;9(1):319.
7. WHO, UNICEF, ICCIDD. Assessment of Iodine Deficiency Disorders and Monitoring Their Elimination. Geneva: WHO; 2007.
8. Ministry of Health Community Development, Gender, Elderly, Children MoH, National Bureau of Statistics, Office of the Chief Government Statistician, ICF. Tanzania Demographic and Health Survey and Malaria Indicator Survey (TDHS-MIS) 2015–16. MoHCDGEC. Dar es Salaam, Tanzania, and Rockville: MoH, NBS, OCGS, and ICF; 2016.
9. Leung AM, Braverman LE. Consequences of excess iodine. Nat Rev Endocrinol. 2014;10(3):136.
10. Kaushik JS, Narang M, Parakh A. Fast food consumption in children. Indian Pediatr. 2011;48(2):97–101.
11. Gupta A, Kapil U, Singh G. Consumption of junk foods by school-aged children in rural Himachal Pradesh, India. Indian J Public Health. 2018;62(1):65.
12. Thomson BM. Nutritional modelling: distributions of salt intake from processed foods in New Zealand. Br J Nutr. 2009;102(5):757–765.
13. Maletnlema TA. Tanzanian perspective on the nutrition transition and its implications for health. Public Health Nutr. 2002;5(1a):163–168.
14. Tschirley D, Reardon T, Dolislager M, Snyder J. The rise of a middle class in East and Southern Africa: implications for food system transformation. J Int Dev. 2015;27(5):628–646.
15. Keding G. Nutrition transition in rural Tanzania and Kenya. In: Biesalski HK, Black RE, eds. Hidden Hunger. Vol. 115. Karger Publishers; 2016:68–81.
16. Mtumwa AH, Ntwenya JE, Paul E, Huang M, Vuai S. Socio-economic and spatial correlates of subclinical iodine deficiency among pregnant women age 15–49 years in Tanzania. BMC Nutr. 2017;3(1):47.
17. Zimmermann MB, Aeberli I, Andersson M, et al. Thyroglobulin is a sensitive measure of both deficient and excess iodine intakes in children and indicates no adverse effects on thyroid function in the UIC range of 100–299 μg/L: a UNICEF/ICCIDD study group report. J Clin Endocrinol Metab. 2013;98(3):1271–1280.
18. Farebrother J, Zimmermann MB, Abdallah F, et al. Effect of excess iodine intake from iodized salt and/or groundwater iodine on thyroid function in nonpregnant and pregnant women, infants, and children: a multicenter study in East Africa. Thyroid. 2018;28(9):1198–1210.
19. Tzioumis E, Adair LS. Childhood dual burden of under-and overnutrition in low-and middle-income countries: a critical review. Food Nutr Bull. 2014;35(2):230–243.
20. Food and Agriculture Organization of the United Nations. Dietary Assessment: A Resource Guide to Method Selection and Application in Low Resource Settings. Rome, Italy: FAO; 2018.
21. Marías Y, Glasauer P. Guidelines for Assessing Nutrition-Related Knowledge, Attitudes and Practices. Food and Agriculture Organization of the United Nations (FAO); 2014.
22. Steyn NP, Senekal M, Norris SA, Whati L, MacKeown JM, Nel JH. How well do adolescents determine portion sizes of foods and beverages? Asia Pac J Clin Nutr. 2006;15(1):35.
23. Cogill B. Anthropometric Indicators Measurement Guide. Washington (DC): Food and Nutrition Technical Assistance Project, Academy for Educational Development; 2003.
24. WHO. Physical Status: The Use of and Interpretation of Anthropometry, Report of a WHO Expert Committee. Geneva, Switzerland; 1995.
25. Delange F, Benoist B, Bürgi H. Determining median urinary iodine concentration that indicates adequate iodine intake at population level. Bull World Health Organ. 2002;80:633–636.
26. Pino S, Fang S-L, Braverman L. Ammonium persulfate: a new and safe method for measuring urinary iodine by ammonium persulfate oxidation. Exp Clin Endocrinol Diabetes. 1998;106(S 03):S22–S27.
27. Spss I. IBM SPSS Statistics for Windows, Version 20.0. Vol. 440. New York: IBM Corp; 2011.
28. Marwaha R, Tandon N, Gupta N, Karak A, Verma K, Kochupillai N. Residual goitre in the postiodization phase: iodine status, thiocyanate exposure and autoimmunity. Clin Endocrinol (Oxf). 2003;59(6):672–681.
29. Bhattacharya U, Chandra AK. Socio-economic status of the population–a prime determinant in evaluating iodine nutritional status even in a post salt iodization scenario. J Pediatr Endocrinol Metab. 2019;32(2):143–149.
30. Costa Leite J, Keating E, Pestana D, et al. Iodine status and iodised salt consumption in Portuguese school-aged children: the iogeneration study. Nutrients. 2017;9(5):458.
31. Johner SA, Thamm M, Nöthlings U, Remer T. Iodine status in preschool children and evaluation of major dietary iodine sources: a German experience. Eur J Nutr. 2013;52(7):1711–1719.
32. Jooste P, Andersson M, Assey V. Iodine nutrition in Africa: an update for 2014. Sight Life. 2013;27(3):50–55.
33. Assey VD, Tylleskär T, Momburi PB, et al. Improved salt iodation methods for small-scale salt producers in low-resource settings in Tanzania. BMC Public Health. 2009;9(1):187.
34. Assey V, Peterson S, Greiner T. Sustainable universal salt iodization in low-income countries–time to re-think strategies? Eur J Clin Nutr. 2008;62(2):292.
35. Seal AJ, Creeke PI, Gnat D, Abdalla F, Mirghani Z. Excess dietary iodine intake in long-term African refugees. Public Health Nutr. 2006;9(1):35–39.
36. Duarte GC, Tomimori EK, de Camargo RY, et al. Excessive iodine intake and ultrasonographic thyroid abnormalities in schoolchildren. J Pediatr Endocrinol Metab. 2009;22(4):327–334.
37. URT. Tanzania Nutrition Profile – Nutrition and Consumer Protection Division. FAO; 2008.
38. Emder PJ, Jack MM. Iodine‐induced neonatal hypothyroidism secondary to maternal seaweed consumption: A common practice in some Asian cultures to promote breast milk supply. J Paediatr Child Health. 2011;47(10):750–752.
39. Andersson M, De Benoist B, Darnton-Hill I, Delange F. Iodine Deficiency in Europe: A Continuing Public Health Problem. Geneva: World Health Organization; 2007.
40. TFDA. Tanzania Food, Drugs and Cosmetics Act 2003 (Iodated Salt)regulations 2010. Tanzania; 2010.
41. Oliveira BP Brazil iodine sufficient after lowering salt iodine levels 2017; 2017.
42. MoH K. KNBS. (2013). The Kenya National Micronutrient Survey 2011; 2018.
43. Haldimann M, Alt A, Blanc A, Blondeau K. Iodine content of food groups. J Food Compost Anal. 2005;18(6):461–471.
44. Lobanco CM, Vedovato GM, Cano CB, Bastos DHM. Reliability of food labels from products marketed in the city of Sao Paulo, Southeastern Brazil. Rev Saude Publica. 2009;43(3):499–505.
 © 2020 The Author(s). This work is published and licensed by Dove Medical Press Limited. The
full terms of this license are available at https://www.dovepress.com/terms
and incorporate the Creative Commons Attribution
- Non Commercial (unported, 3.0) License.
By accessing the work you hereby accept the Terms. Non-commercial uses of the work are permitted
without any further permission from Dove Medical Press Limited, provided the work is properly
attributed. For permission for commercial use of this work, please see paragraphs 4.2 and 5 of our Terms.
© 2020 The Author(s). This work is published and licensed by Dove Medical Press Limited. The
full terms of this license are available at https://www.dovepress.com/terms
and incorporate the Creative Commons Attribution
- Non Commercial (unported, 3.0) License.
By accessing the work you hereby accept the Terms. Non-commercial uses of the work are permitted
without any further permission from Dove Medical Press Limited, provided the work is properly
attributed. For permission for commercial use of this work, please see paragraphs 4.2 and 5 of our Terms.