Back to Journals » Pediatric Health, Medicine and Therapeutics » Volume 9
Iodine deficiency and its associated factors among primary school children in Anchar district, Eastern Ethiopia
Authors Muktar M, Roba KT ![]() , Mengistie B, Gebremichael B
, Mengistie B, Gebremichael B
Received 20 February 2018
Accepted for publication 30 May 2018
Published 4 September 2018 Volume 2018:9 Pages 89—95
DOI https://doi.org/10.2147/PHMT.S165933
Checked for plagiarism Yes
Review by Single anonymous peer review
Peer reviewer comments 2
Editor who approved publication: Professor Roosy Aulakh
Muzemil Muktar,1 Kedir Teji Roba,2 Bezatu Mengistie,3 Berhe Gebremichael4
1West Hararghe Zone Health Department, Chiro, Ethiopia; 2School of Nursing and Midwifery, Haramaya University, Harar, Ethiopia; 3Department of Environmental Health Science, Haramaya University, Harar, Ethiopia; 4School of Public Health, Haramaya University, Harar, Ethiopia
Background: Iodine deficiency is a major public health problem in Ethiopia. Most of the studies in Ethiopia were done on clinical goiter without assessing the subclinical iodine deficiency. Therefore, there was a need to study the magnitude and associated factors of iodine deficiency among school-age children in Eastern Ethiopia.
Subjects and methods: A school-based cross-sectional study design was used to assess the iodine level of 200 primary school children aged 6–12 years who were selected by using the multistage sampling technique. The study used an interview-administered questionnaire and checklists to collect data from the respondents. Data were entered to EpiData version 3.1 and exported to SPSS version 22.0 for analysis. Bivariable and multivariable analyses were conducted, and statistical significance was declared at p value ≤0.05.
Results: The median urinary iodine concentration of the children was 146 µg/L, and 31% had median urinary iodine concentration below the acceptable level (<100 µg/L). Female sex (adjusted odds ratio [AOR]=3.12, 95% CI: 1.52, 6.39), family size ≥5 (AOR=2.24, 95% CI: 1.06, 4.75), having no awareness of a balanced diet (AOR=3.25, 95% CI: 1.37, 7.71), and cabbage consumption ≥2 times per week (AOR=3.01, 95% CI: 1.31, 6.93) were the significant associated factors.
Conclusion and recommendation: Ethiopia is implementing the universal iodization of salt. However, urinary iodine deficiency and utilization of inadequately iodized salt were high in the study area. Therefore, the health sectors of the study site should disseminate messages to increase the awareness on iodized salt, iodine-rich foods, and goiterogens.
Keywords: iodine deficiency, primary school, children, Anchar district
Introduction
Iodine is a trace element essential for the synthesis of thyroid hormones which are involved in growth, development, and control of metabolic processes in the human body. Inadequate iodine intake results in iodine deficiency disorders, with goiter as a well-known clinical sign. Besides, iodine deficiency during pregnancy and early childhood results in impaired brain development, and consequently, reduced mental functioning.1–4 In addition to the harmful effects of very low iodine intakes, excessive intakes can also cause biochemical changes, such as elevated thyroxin and decreased thyroid-stimulating hormone concentrations. However, it is uncertain whether clinical health effects would appear because of chronic exposure to these biochemical changes.5
Severe iodine deficiency among school children can lead to loss of intelligence quotient up to 13.5 points.6 Iodine deficiency occurs when iodine intake falls below the recommended levels. The recommended daily iodine intake for school children, adolescents, and pregnant/lactating women is 120, 150, and 200 μg, respectively.2,7 Consumption of goiterogenic foods and inadequately iodized household salt can also increase the risk of iodine deficiency.8,9
Indicators which are used to assess the iodine status of a population are total goiter prevalence and urinary iodine level.10 Total goiter prevalence is recommended as the main indicator to assess the prevalence of iodine deficiency disorders. However, it is of limited utility in assessing the impact of salt iodization. To assess the impact of salt iodization, urinary iodine level is recommended because it shows recent dietary intake of iodine.7,11 Based on median urinary iodine concentration, the iodine status is classified as follows: severe (<20 μg/L), moderate (20–49 μg/L), and mild (50–99 μg/L) iodine deficiencies, optimal iodine concentration (100–199 μg/L), risk of iodine-induced hyperthyroidism (200–299 μg/L), and risk of adverse health consequences (>300 μg/L).2
Iodine deficiency is among the major public health threats and important micronutrient deficiencies in developing countries, like Ethiopia. School-age children are a convenient target group for the assessment of iodine deficiency disorders because of their combined high vulnerability, easy access, and applicability to a variety of assessment activities.7,12,13
Globally, 2 billion individuals have an insufficient iodine intake,14 and one-third of them live in areas where natural sources of iodine are less.1 Similarly, 29.8% (241 million) and 39% (58 million) of school-age children are estimated to have insufficient iodine intakes worldwide and in the African continent, respectively.15 Furthermore, the highest prevalence of iodine deficiency is documented in Africa (42%).15,16 Of the African countries, the largest burden is found in Ethiopia,17 where 39.9% of children are iodine deficient.18
In Ethiopia, the mandatory universal iodization of salt is being implemented, and according to the Ethiopian Demographic and Health Survey of 2016, about 89% of the households were utilizing iodized salt.19 Another national survey conducted by the Ethiopian Public Health Institute in 2015 showed that about 89.2% of the households were consuming iodized salt. However, only 26% of them were getting >15 ppm iodine in the salt and 47.5% of school-age children had urinary iodine deficiency (<100 µg/L).20 Similarly, about 57% of school-age children had urinary iodine deficiency according to a study conducted in Robe district of southeast Ethiopia in 2015.21
It has been shown that most of the studies concerning iodine deficiency disorders in Ethiopia among school-age children were done without urinary iodine analysis. This may decrease the strength of the evidence available for determining whether the disorders are due to iodine deficiency or not. Moreover, the magnitude of iodine deficiency significantly varies from area to area within Ethiopia. Therefore, there was a need for a study to investigate the magnitude and associated factors of iodine deficiency among primary school children aged 6–12 years in the Anchar district of Eastern Ethiopia, supplemented with subclinical investigation and testing of salt iodine level.
Subjects and methods
Study setting and sampling
A school-based cross-sectional study design was applied to conduct this study in the primary schools of Anchar district in Eastern Ethiopia from February 13 to 30, 2017. Anchar district is located 390 km to the east of the capital of Ethiopia, Addis Ababa, and 105 km away from the zonal town, Chiro. The district has 25 rural and 3 urban kebeles (the smallest administrative unit in Ethiopia). It has a total population of 104,615 (53,354 females and 51,261 males), and 21,795 households. The district has 1 preparatory school, 3 high schools, and 44 primary schools. The altitude of the district ranges from 1200 to 4500 m above the sea level, and the most common staple foods in the study area are cereals and vegetables (Anchar District Education Office Report, 2016).
The sample size was estimated using the formula for single population proportion by assuming the magnitude of iodine deficiency in children aged 6–12 years as 17.9% from a study conducted in Spain in 2011,22 with confidence level of 95% and marginal error of 5%, which resulted in a sample size of 227. Adding 5% for nonrespondents, the final sample size was 238. However, due to resource shortage for urinary iodine analysis, the study was conducted on 200 school-age children. Multistage sampling technique was used to select the children from the schools. First, 8 primary schools, out of 44, were selected randomly. The number and list of students aged 6–12 years were obtained from the selected schools, and then probability proportion to size was allocated to each selected school. Finally, simple random sampling method was used to select the children to be included in the study.
Data collection
The study used structured and pretested interviewer-administered questionnaire, which was translated into the local language, Afan Oromo. Ten experienced health officers and nurses, who had a B.Sc. degree, undertook the interview after they had been intensively trained for 3 days. Data were collected on sociodemographic characteristics, household assets, and feeding habits from the children and their families. Moreover, checklists were used to collect data from anthropometric measurements and urinary and salt iodine tests.
Weight and height of the children were measured by an electronic digital balance and a portable anthropometer, respectively, and indices were computed to assess the nutritional status of the children. All the children were requested to bring salt and come with their family 1 day before the interview. The salt iodine content was measured using the rapid spot testing kit, and iodine content of the salt was expressed in parts per million (sufficient >15 ppm, medium <15 ppm, and no iodine 0 ppm).6
For the urinary iodine test, 5 mL samples of morning urine were collected from the students in properly labeled and sterile screw-capped plastic vials and were immediately transferred to the thermo cool box containing ice bags. The collected urine samples were transported to the Ethiopian Public Health Institute for analysis by laboratory technicians. The samples were kept at 4°C in a refrigerator until analysis. Urinary iodine analysis was performed in duplicate at the iodine laboratory of the Ethiopian Public Health Institute by using the spectrophotometric procedure.6
Data processing and analysis
First, the completeness of the questionnaires and checklists was checked. Then, data were coded, entered, and cleaned using EpiData version 3.1 and exported to SPSS version 22 for analysis. The characteristics of the study participants were described and presented using frequencies, percentages, summary measures, and tables. Wealth index of households was analyzed by principal component analysis and tertiles were produced. Bivariable analysis was done using binary logistic regression to evaluate the association between each independent and outcome variable. Then, variables with a p value ≤0.25 were included in the multivariable logistic regression model. Goodness-of-fit of the model was checked by the Hosmer–Lemeshow test, and it was found to be 0.35, indicating that the model fitness was good. In addition, multicollinearity among the independent variables was also tested by variance inflation factor and standard error. Then, multivariable analysis was done using binary logistic regression to control the confounding factors, and the associated factors were identified by estimating adjusted odds ratio (AOR) with 95% CI. Finally, statistical significance was declared at p value <0.05.
Ethics approval and informed consent
Before starting the data collection, ethical clearance was secured from the Haramaya University Institutional Health Research Ethics Review Committee. In addition, official permissions were obtained from west Hararghe zone and Anchar district health and education offices and school principals. Informed voluntary written and signed consent was also obtained from each student’s parent/guardian after the purpose of the study and confidentiality issues were clearly explained. In addition, verbal assent was obtained from the students.
Results
This study included 200 school-age children. The distribution of participant characteristics showed that majority of the children were females and in the age group of 9–12 years with a mean (±SD) age of 9.45 (±1.43) years. In addition, most of them belonged to the Oromo ethnic group and Muslim families with low formal education and socioeconomic status. Moreover, the majority of the children lived in Weina Dega climatic condition in rural areas, and had large family sizes. Most of the children’s mothers were married and housewives (Table 1).
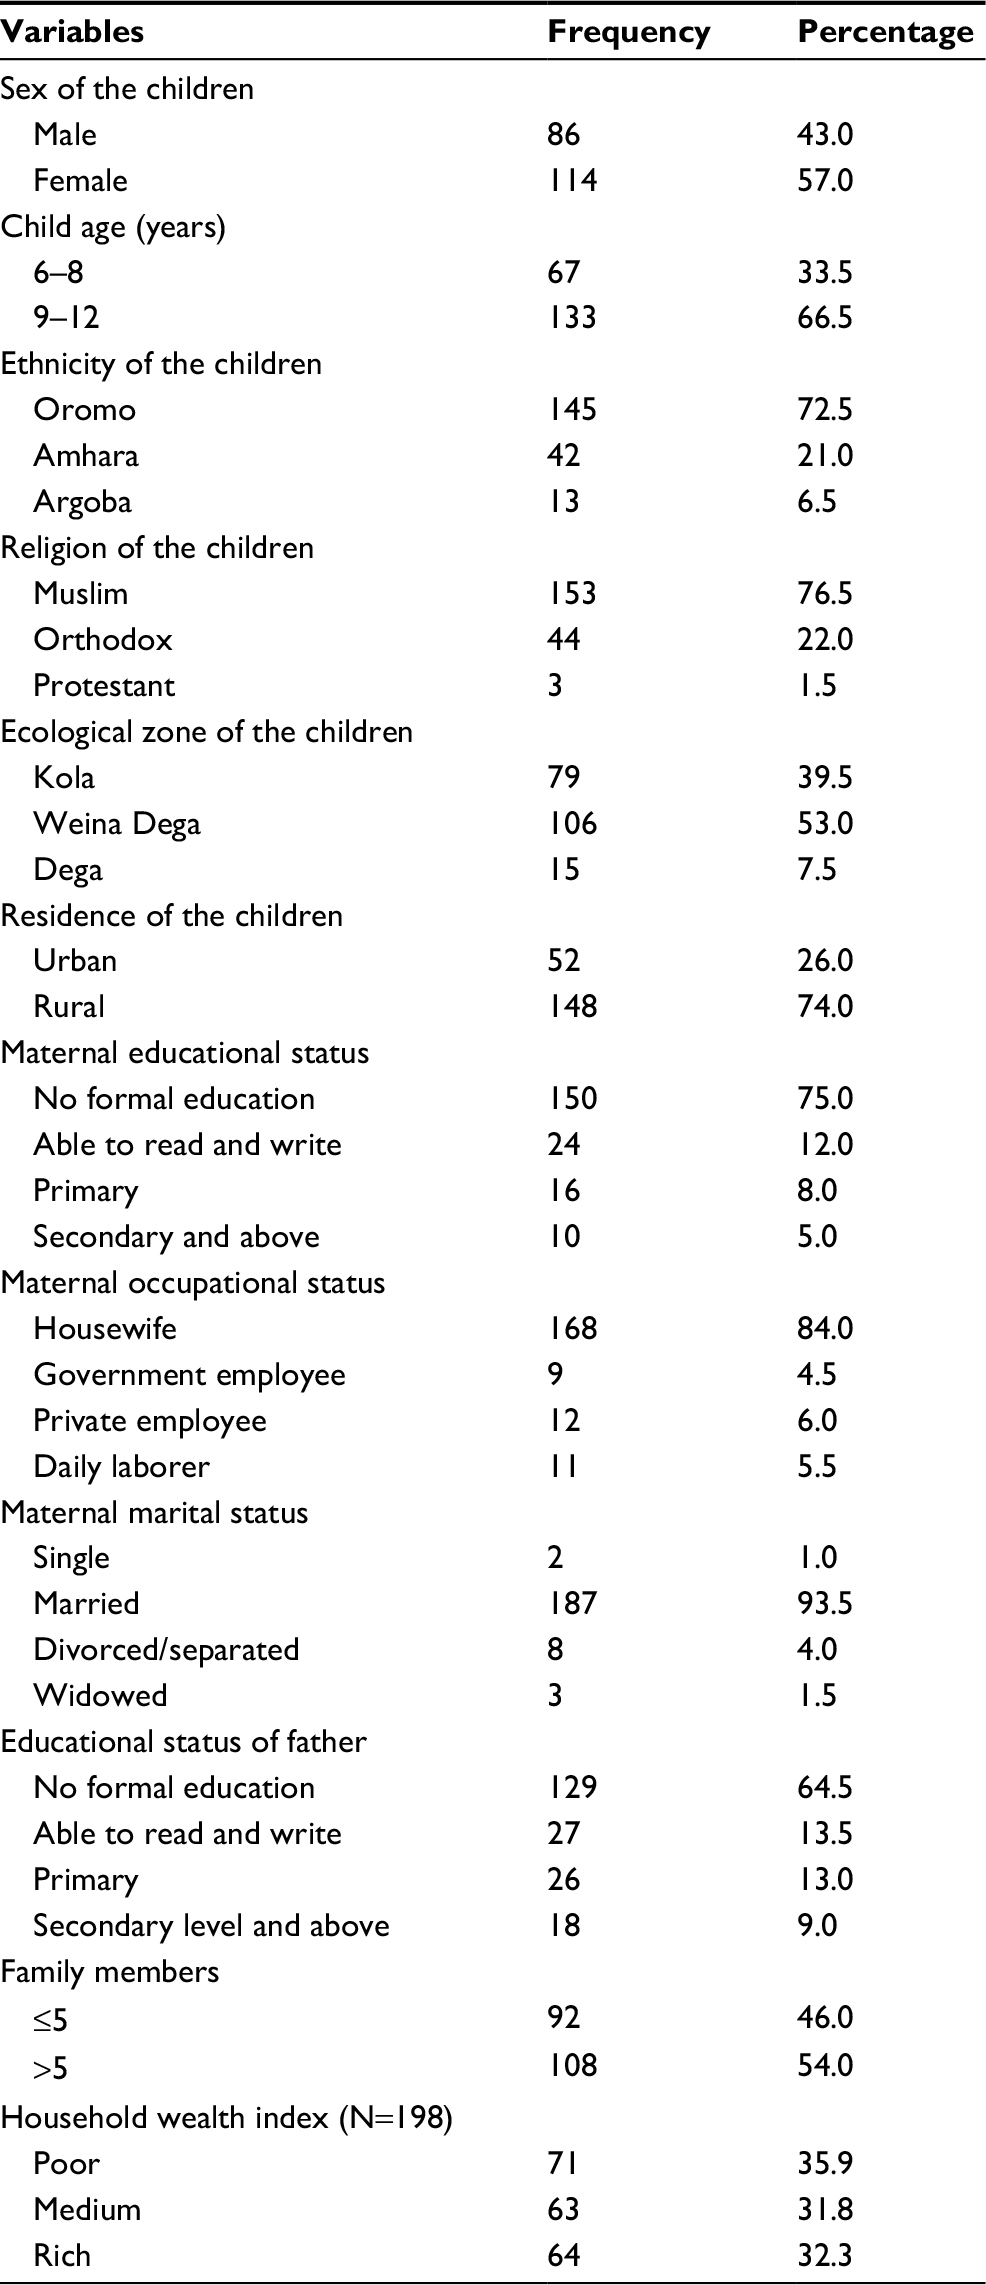 | Table 1 Sociodemographic characteristics of school-age children and their parents/guardians in primary schools of Anchar district, Eastern Ethiopia, February 2017 (N=200) |
The study revealed that the majority of the mothers/caretakers had no awareness of health and nutrition, balanced diet, iodine-rich foods, or iodized salt, and they believed that every salt contains iodine. Regarding the feeding pattern of the children, cabbage, potato, legumes, and oils/fats were the most frequently eaten foods in the study area, whereas milk, egg, and sugar/honey were eaten less frequently. Besides, almost all the children consumed <4 food items during the 24 hours prior to the study, where vegetables, cereals/tubers, pulses, and eggs were the commonest food items included in the diet (Table 2).
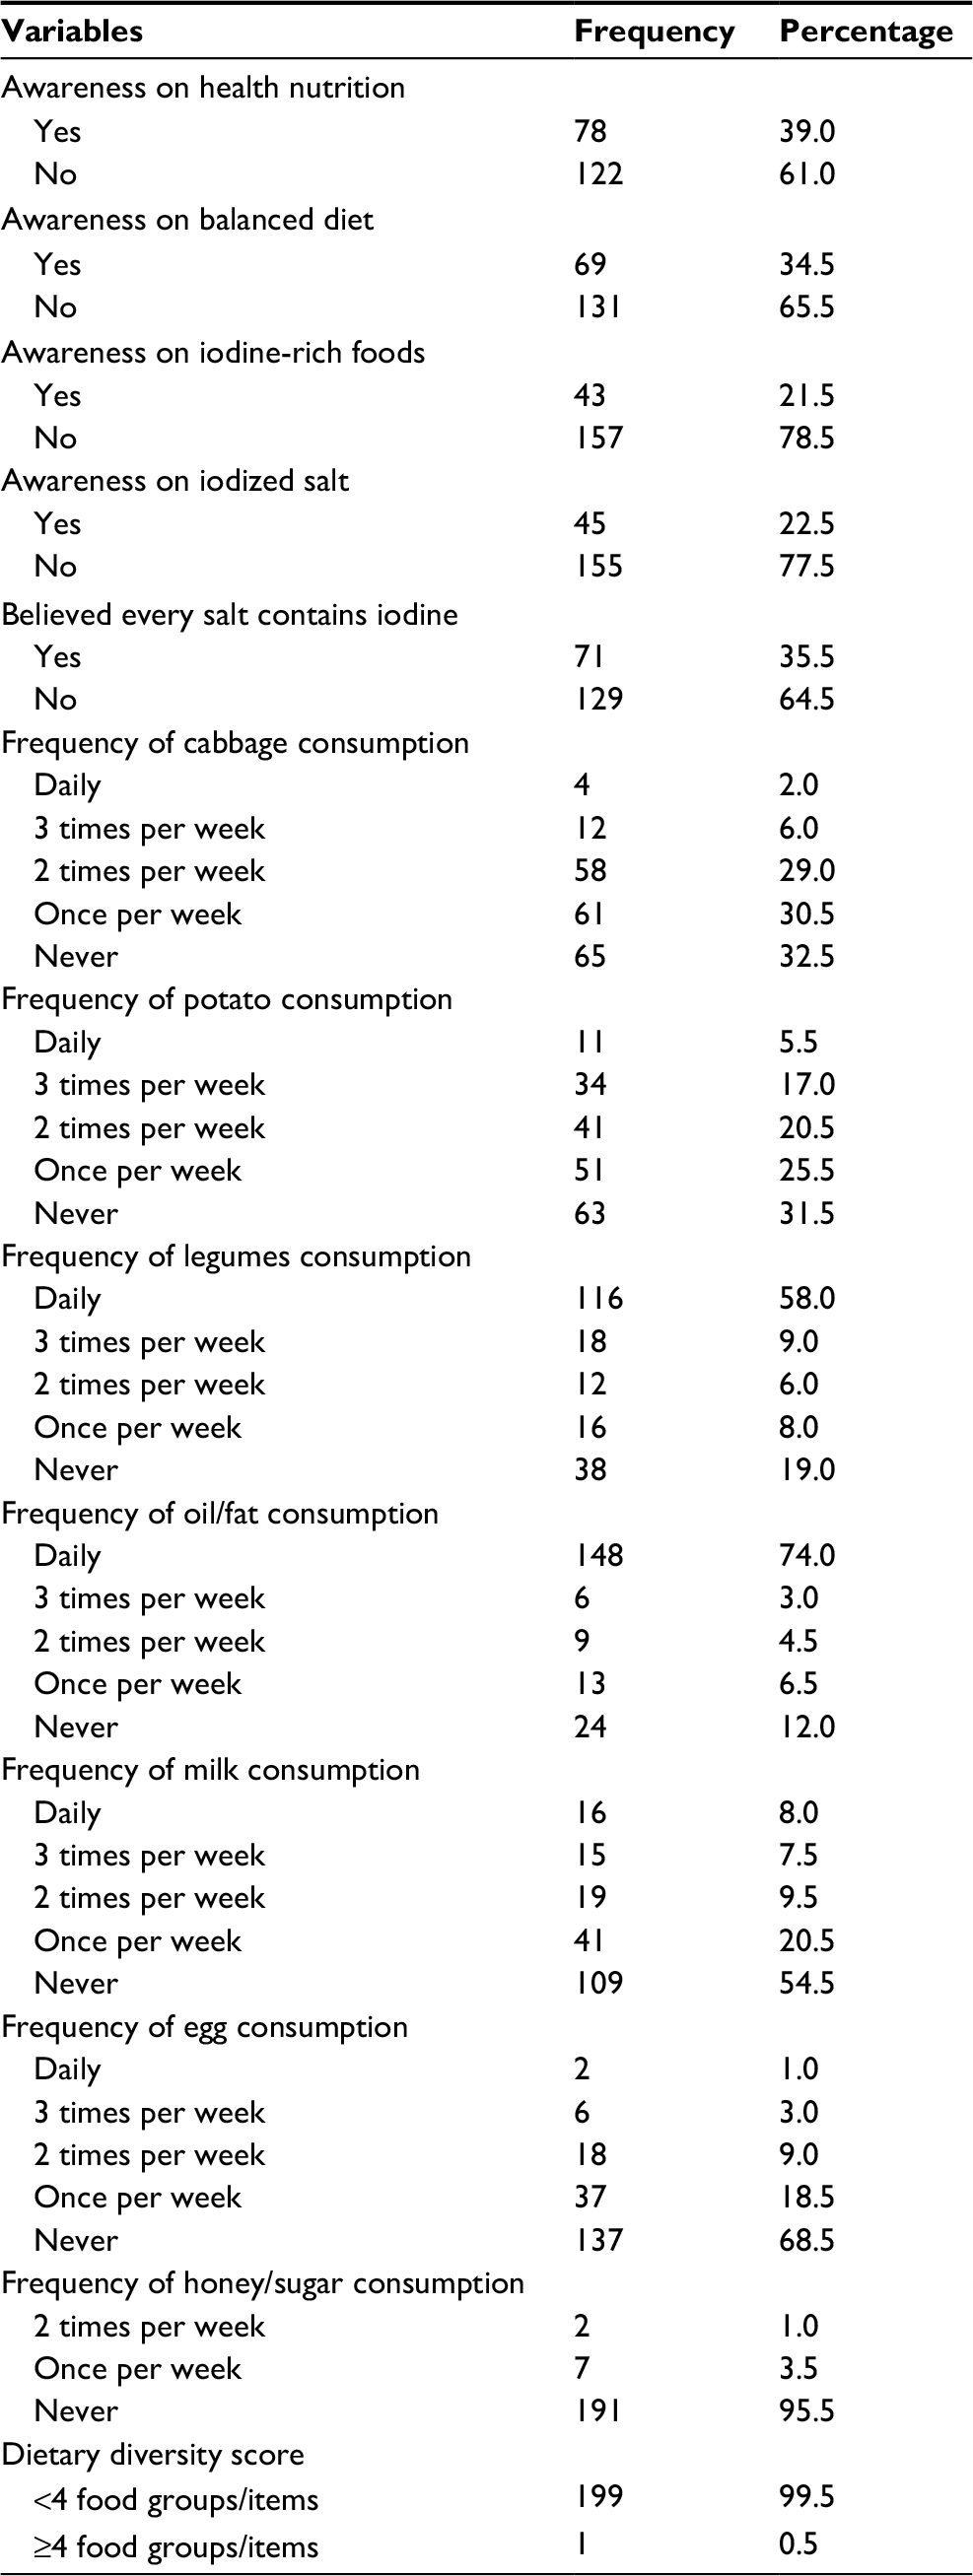 | Table 2 Mother’s/caretaker’s awareness of health, nutrition, iodine-rich foods, and iodized salt, and feeding patterns of children aged 6–12 years in primary schools of Anchar district, Eastern Ethiopia, February 2017 (N=200) |
The anthropometric measurements showed that one-third of the children were stunted and one-sixth of them were underweight. Regarding the iodine level of household salt, the majority of the households were utilizing salt with inadequate iodine level (<15 ppm) (Table 3). On the other hand, the overall median urinary iodine concentration of the children was 146 µg/L, with an interquartile range of 112.9 µg/L. Defining median urinary iodine concentration <100 µg/L as iodine deficiency, this pertained to 31% (95% CI: 24.5, 37.5).
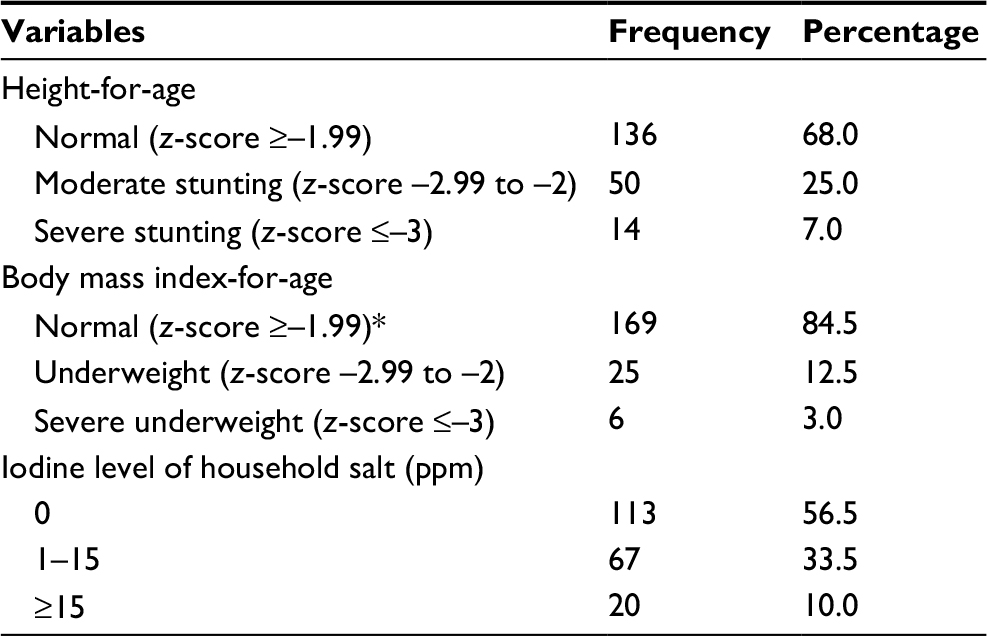 | Table 3 Nutritional status of primary school children aged 6–12 years and the iodine level of their households’ salt in Anchar district, Eastern Ethiopia, February 2017 (N=200) Note: *No overweight was detected. |
Female children were 3.12 times more likely to have iodine deficiency than male children (AOR=3.12, 95% CI: 1.52, 6.39). Children hailing from families with ≥5 members were 2.24 times more likely to have iodine deficiency than children from families with <5 members (AOR=2.24, 95% CI: 1.06, 4.75). In addition, children who had no awareness of balanced diet were 3.25 times more likely to have iodine deficiency than their counterparts (AOR=3.25, 95% CI: 1.37, 7.71). Moreover, children who consumed cabbage ≥2 times per week were 3 times more likely to develop iodine deficiency than children who did not consume at all (AOR=3.01, 95% CI: 1.31, 6.93) (Table 4).
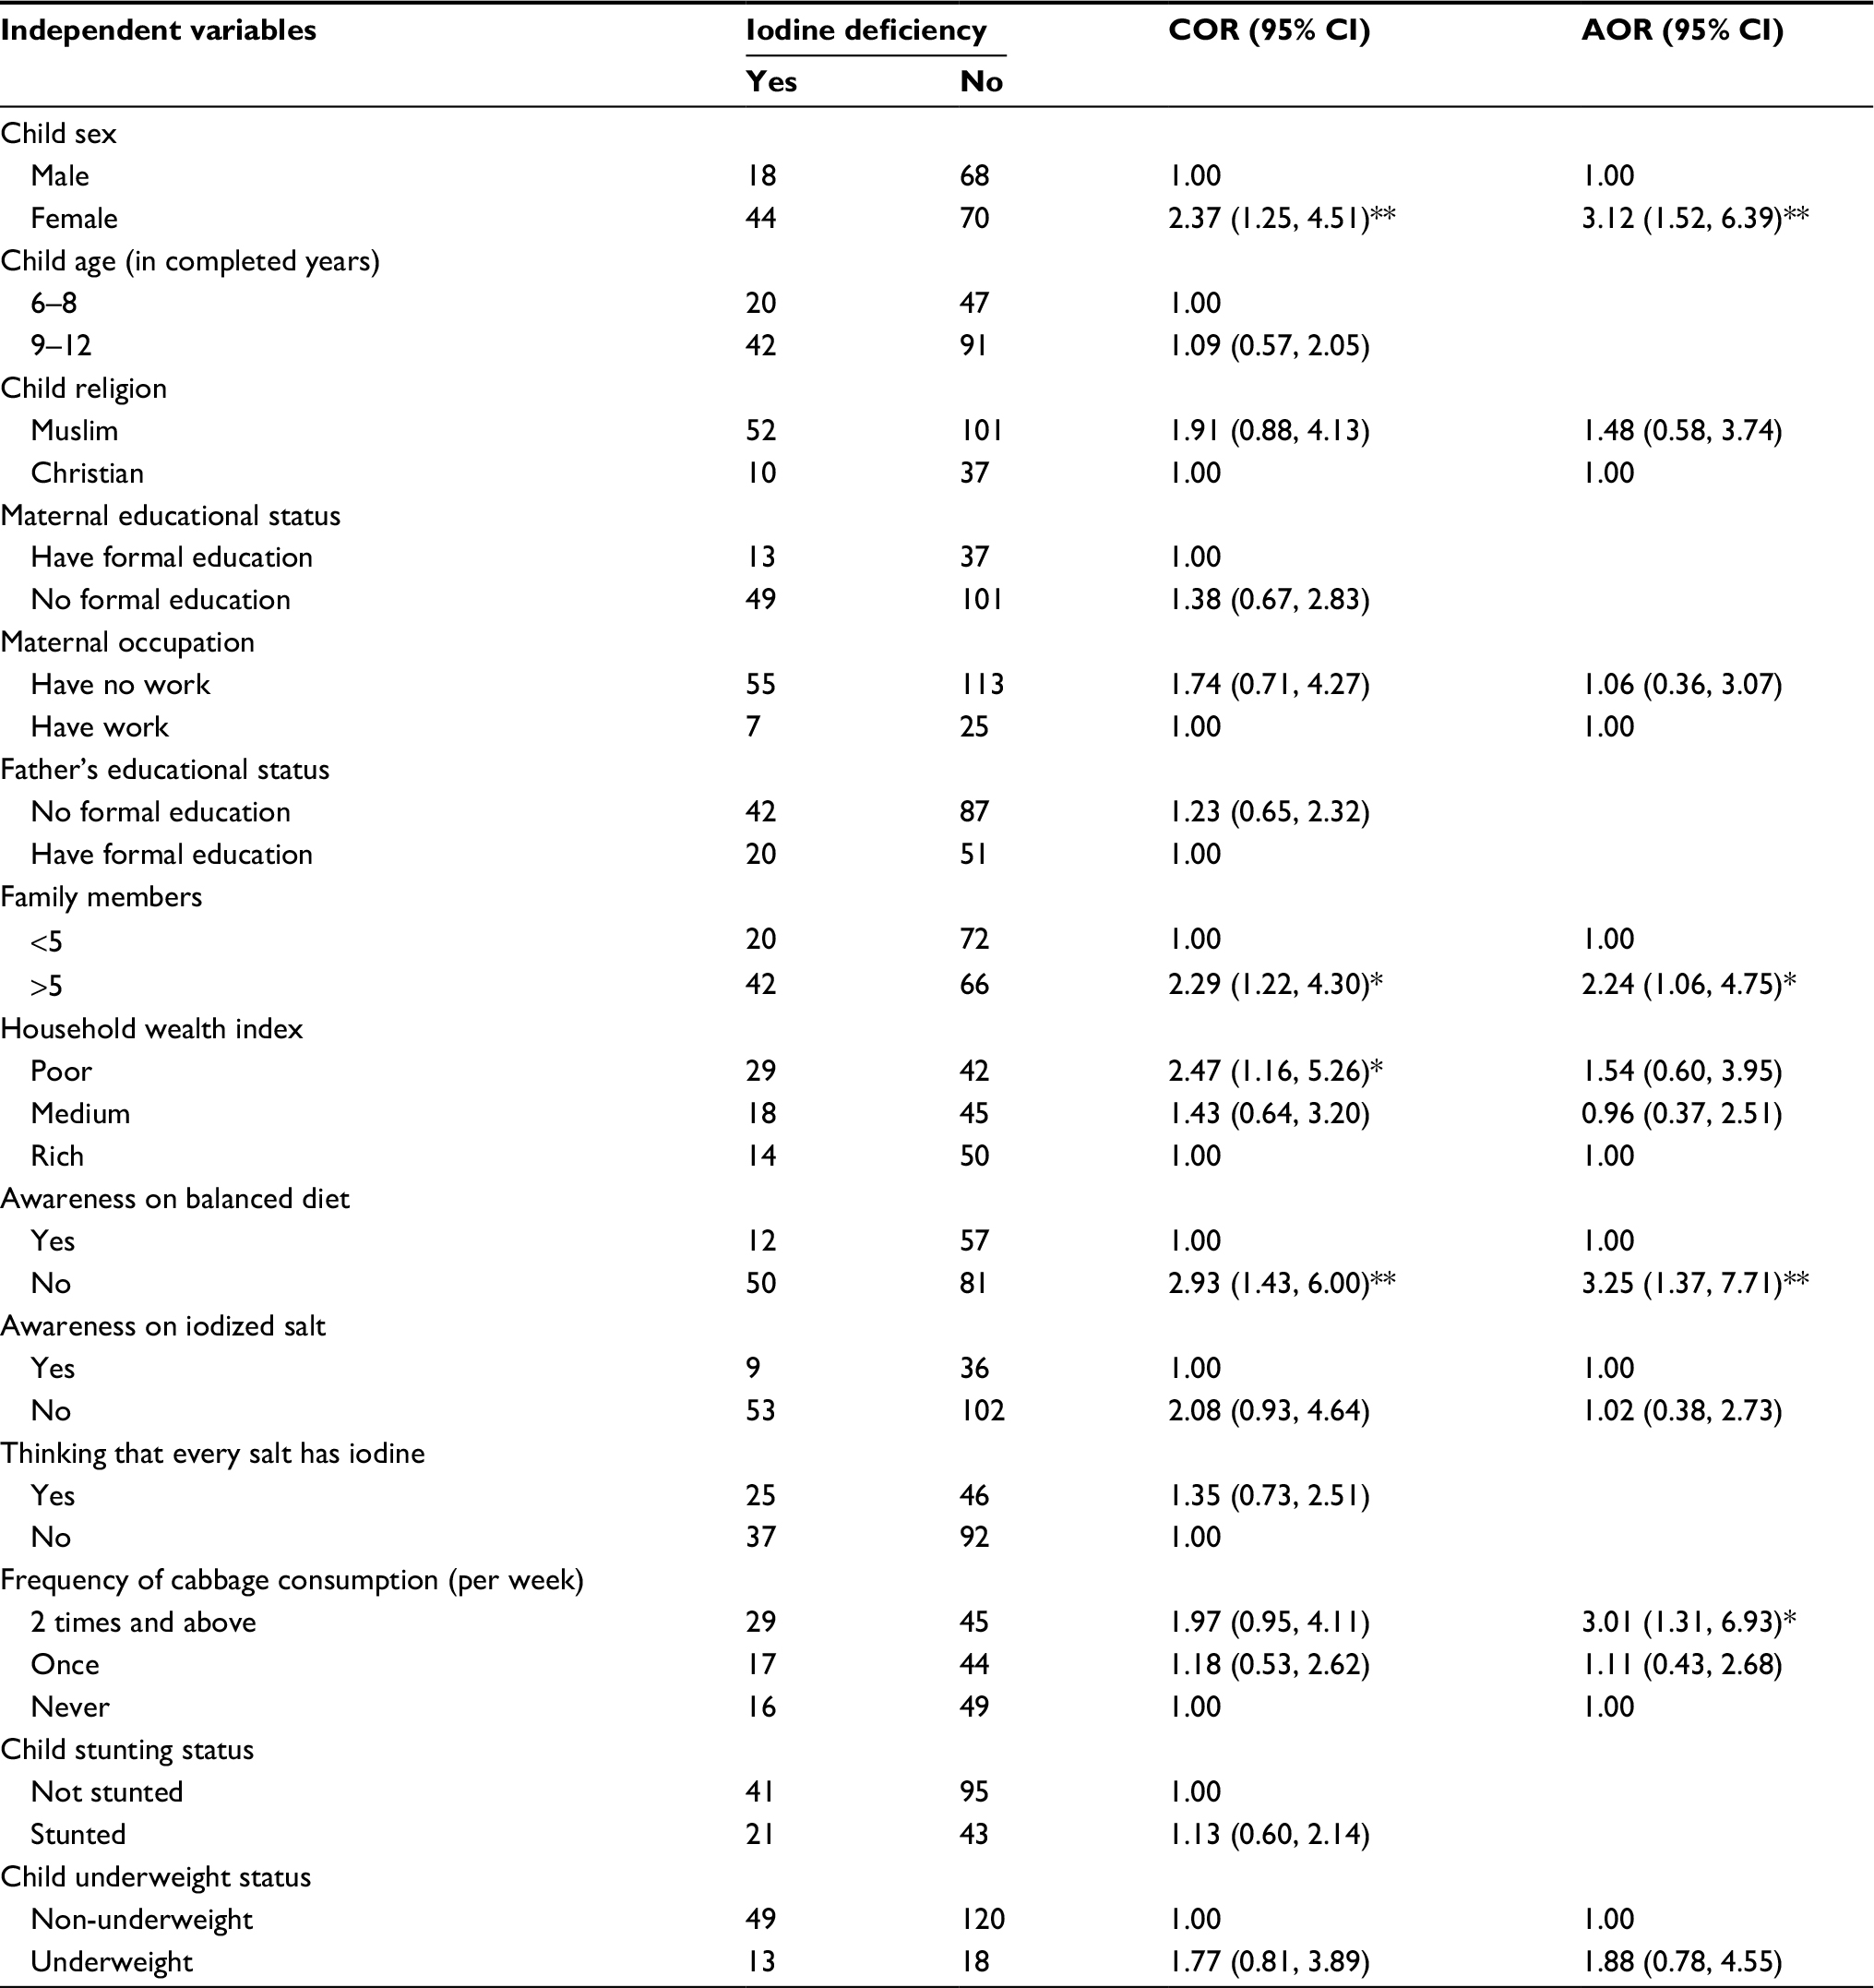 | Table 4 Factors associated with iodine deficiency among school children aged 6–12 years in Anchar district, Eastern Ethiopia, February 2017 (N=200) Notes: *Statistically significant at p value <0.05. **Statistically significant at p value <0.01. Abbreviations: CI, confidence interval; COR, crude odds ratio; AOR, adjusted odds ratio. |
Discussion
The findings of this study assessed the magnitude and associated factors of iodine deficiency among school-age children in primary schools of Anchar district, Eastern Ethiopia. The median urinary iodine concentration was 146 µg/L with an interquartile range of 112.9 µg/L, reflecting iodine sufficiency in the study population. Defining median urinary iodine concentration <100 µg/L as iodine deficiency, this pertained to 31% (95% CI: 24.5, 37.5). Child sex, consumption of cabbage, awareness on balanced diet, and family size were the factors significantly associated with iodine deficiency.
The present study showed that the median urinary iodine concentration among school children was higher than the WHO/UNICEF/ICCIDD jointly recommended cutoff point (≥100 µg/L).23 In Ethiopia, the national mandatory universal salt iodization is being implemented. Although about 89% of the households in the country were utilizing iodized salt, 74% of them were utilizing inadequately iodized salt, as shown by 2 different national survey reports in 2015 and 2016.19,20 This study also showed that about 90% of the children were from households utilizing salt with inadequate iodine level. Therefore, the low adequacy level of iodine in the household salt might be the reason why about one-third of the children were suffering from iodine deficiency in the study area.
The magnitude of iodine deficiency in this study was lower than that in the national survey conducted in 2015 which was 47.5%. This might be due to differences in sample size and the national survey might have also included more iodine deficiency endemic areas. However, only 26% of school-age children were getting >15 ppm iodine in salt and 47.5% had urinary iodine deficiency (<100 µg/L).20 Similarly, about 57% of school-age children had urinary iodine deficiency according to a study conducted in Robe district of southeast Ethiopia in 2015.21 These differences might be due to variations in altitude and feeding habits.
The prevalence of iodine deficiency in the present study was higher than in those studies done in India (2010) and Spain (2011) which was 26.6% and 17.9%, respectively. These variations may be due to differences in socioeconomic status, food access, and feeding habits.22,24
This study revealed that female children were about 3 times more likely to have iodine deficiency than males. This report was in line with 2 previous studies.6,21 This can be due to the higher iodine requirement in females to support their growth and development. Furthermore, a female hormone (estrogen) has an inhibitory effect on iodine uptake by the thyroid follicular cells, especially in the late school-age period.
Children from families with ≥5 members were 2.24 times more likely to have iodine deficiency than children from families with <5 members. This can be explained by the fact that as the family size gets larger, the availability and accessibility of iodine-rich foods and iodized salt decrease. In addition, children who had no awareness of balanced diet were about 3.3 times more likely to have iodine deficiency than their counterparts. This means that those who have better awareness of balanced diet are more likely to consume the iodine-rich foods and iodized salt. Moreover, children who consumed cabbage ≥2 times per week were 3 times more likely to develop iodine deficiency as compared to children who did not consume at all. This is because cabbage is a goiterogenic food that increases the risk of iodine deficiency.
Strength and limitations of the study
The strength of the study is that it applied a laboratory-based design for the urinary iodine and household salt iodine tests. However, since it is cross-sectional, it might not show the temporal relation between the independent and dependent variables.
Conclusion and recommendation
This study found that the median urinary iodine concentration was 146 µg/L, indicating sufficient iodine intake in the study population. Children with urinary iodine concentration <100 µg/L were defined as iodine deficient, and the study revealed that child sex, consumption of cabbage, lack of awareness of balanced diet, and large family size were the factors significantly associated with iodine deficiency. Moreover, >90% of the children’s households were utilizing inadequate iodized salt. Therefore, the health sectors of the study area should give more attention to school children and disseminate messages to increase the awareness of the children on how to prevent iodine deficiency through consumption of adequately iodized salt, iodine-rich foods, and avoiding goiterogenic foods, such as cabbage. The agricultural sectors of the study area should also encourage households to produce iodine-rich foods.
Acknowledgments
The authors would like to express their gratitude to the staff of the west Hararghe Zone and Anchar district health and education offices, school principals, data collectors, supervisors, study participants, and local language translators for translating the questionnaire. Muzemil Muktar (the first author) sponsored the study. In addition, the Ethiopian Public Health Institution helped in urinary data analysis.
Author contributions
All authors contributed toward data analysis, drafting and revising the paper and agree to be accountable for all aspects of the work.
Disclosure
The authors report no conflict of interest in this work.
References
WHO. Guideline on fortification of food-grade salt with iodine for the prevention and control of iodine deficiency disorders. Geneva: WHO; 2014. | ||
WHO, UNICEF, ICCIDD. Assessment of iodine deficiency disorders and monitoring their elimination. Geneva: WHO; 2001. | ||
Geissler C, Power H. Human Nutrition. 12th ed. London: Churchill Livingstone; 2011. | ||
Andersson M, De-Benoist B, Darnton-Hill I, Delange F. Iodine deficiency in Europe: a continuing public health problem. Geneva: WHO; 2007. | ||
Scientific Committee on Food and Scientific Panel on Dietetic Products Nutrition and Allergies. Tolerable upper intake levels for vitamins and minerals. Parma: European Food Safety Authority; 2006. | ||
WHO, UNICEF, ICCIDD. Assessment of iodine deficiency disorders and monitoring their elimination. Geneva: WHO; 2007. | ||
Aminorroaya A, Amini M, Hovsepian S. Prevalence of goitre in Isfahan, Iran, fifteen years after initiation of universal salt iodization. J Health Popul Nutr. 2010;28(4):351–358. | ||
Demelash H, Gashaw K, Melese A. Prevalence of goiter and associated factors among primary school children aged 6–12 years old in Goba town, south east, Ethiopia. Int J Nutr Food Sci. 2015;4(3):381–387. | ||
Mezgebu Y, Mossie A, Rajesh P, Beyene G. Prevalence and severity of iodine deficiency disorders among children 6–12 years of age in Shebe Senbo district, Jimma Zone, southwest Ethiopia. Ethiop J Health Sci. 2012;22(3):196–204. | ||
WHO. Iodine status worldwide: WHO Global Database on Iodine deficiency. Geneva: WHO; 2004. | ||
Kumar A, Jain K, Chandrakar A, Dixit S. Impact of iodine deficiency disorders control programme implementation in four districts of Chhattisgarh, India: baseline survey. Int J Community Med Public Health. 2016;3(7):1940–1944. | ||
Qamar M. Abbas S. Prevalence and case reports of goiter at Bachawalpur district, Pakistan. Sci Int. 2012;24(1):33–37. | ||
Eastman C, Zimmermann M. The iodine defiiency disorders. Ottawa: ICCIDD; 2009. | ||
Rahil B, Waset K, Black R. The epidemiology of global micronutrient deficiencies. Ann Nutr Metab. 2015;66:22–33. | ||
Andersson M, Karumbunathan V, Zimmermann M. Global iodine status in 2011 and trends over the past decade. J Nutr. 2012;142(4):744–750. | ||
Buxton C, Baguune B. Knowledge and practices of people in Bia district, Ghana, with regard to iodine deficiency disorders and intake of iodized salt. Arch Public Health. 2012;70(5):5. | ||
Andersson M, Zimmermann M. Global iodine nutrition: a remarkable leap forward in the past decade. IDD Newslett. 2012;40(1):1–5. | ||
Abuye C, Berhane Y, Akalu G, Getahun Z, Ersumo T. Prevalence of goiter in children 6 to 12 years of age in Ethiopia. Food Nutr Bull. 2007;28(4):391–398. | ||
CSA, ICF. Ethiopia demographic and health survey 2016. Addis Ababa/Rockville, MD: CSA/ICF; 2017. | ||
EPHI. Ethiopian National Micronutrient Survey report. 2016. Available from: https://www.ephi.gov.et/images/pictures/download2009/National_MNS_report.pdf. Accessed December, 2017. | ||
Hailu S, Wubshet M, Woldie H, Tariku A. Iodine deficiency and associated factors among school children: a cross-sectional study in Ethiopia. Arch Public Health. 2016;74(46):1–7. | ||
Vila L, Donnay S, Arena J, et al. Iodine status and thyroid function among Spanish schoolchildren aged 6–7 years: the Tirokid study. Br J Nutr. 2016;115(9):1623–1631. | ||
WHO. Urinary iodine concentrations for determining iodine status deficiency in populations. Vitamin and Mineral Nutrition Information System. Geneva: WHO; 2013. | ||
Manjunath B, Suman G, Hemanth T, Shivaraj NS, Murthy NS. Prevalence and factors associated with goitre among 6–12-year-old children in a rural area of Karnataka in South India. Biol Trace Elem Res. 2016;169(1):22–26. |
 © 2018 The Author(s). This work is published and licensed by Dove Medical Press Limited. The
full terms of this license are available at https://www.dovepress.com/terms
and incorporate the Creative Commons Attribution
- Non Commercial (unported, 3.0) License.
By accessing the work you hereby accept the Terms. Non-commercial uses of the work are permitted
without any further permission from Dove Medical Press Limited, provided the work is properly
attributed. For permission for commercial use of this work, please see paragraphs 4.2 and 5 of our Terms.
© 2018 The Author(s). This work is published and licensed by Dove Medical Press Limited. The
full terms of this license are available at https://www.dovepress.com/terms
and incorporate the Creative Commons Attribution
- Non Commercial (unported, 3.0) License.
By accessing the work you hereby accept the Terms. Non-commercial uses of the work are permitted
without any further permission from Dove Medical Press Limited, provided the work is properly
attributed. For permission for commercial use of this work, please see paragraphs 4.2 and 5 of our Terms.