Back to Journals » Biologics: Targets and Therapy » Volume 19
Investigating the Oncogenic and Immunological Implications of YTHDF1 in Ovarian Cancer
Received 23 May 2025
Accepted for publication 30 July 2025
Published 12 August 2025 Volume 2025:19 Pages 443—462
DOI https://doi.org/10.2147/BTT.S542488
Checked for plagiarism Yes
Review by Single anonymous peer review
Peer reviewer comments 3
Editor who approved publication: Dr Shein-Chung Chow
Bo Yin,* Huijuan Zhou*
Department of Gynecology; Shanghai Key Laboratory of Maternal Fetal Medicine, Shanghai Institute of Maternal-Fetal Medicine and Gynecologic Oncology, Shanghai First Maternity and Infant Hospital, School of Medicine, Tongji University, Shanghai, People’s Republic of China
*These authors contributed equally to this work
Correspondence: Huijuan Zhou, Email [email protected]
Introduction: Ovarian cancer (OC) ranks among the most lethal and aggressive gynecological malignancies. Identifying novel molecular targets is crucial for improving early diagnosis and developing effective therapies. Despite advancements in immunotherapy, its efficacy in OC remains limited due to the absence of well-defined immune-related molecular targets.
Methods: This study offers a comprehensive analysis of YTHDF1, combining multi-omics-based bioinformatics approaches with in vitro and in vivo experimental validation to elucidate its functional role and significance in the progression and treatment of OC.
Results: Our findings reveal that YTHDF1 is significantly upregulated in OC and correlates with poor clinical outcomes. Functional assays confirmed its oncogenic properties, while pathway analyses highlight its involvement in critical tumor-promoting signaling pathways. Importantly, we identified a potential link between YTHDF1 expression and the tumor immune landscape, suggesting its role in modulating immune cell infiltration and driving immunosuppression. Additionally, both computational and in vivo evidence underline the relevance of YTHDF1 in influencing immunotherapeutic responsiveness and chemosensitivity in OC. Mechanistically, we discovered for the first time that YTHDF1 can be encapsulated within tumor-derived exosomes, contributing to the polarization of macrophages toward the immunosuppressive M2a phenotype.
Discussion: These findings position YTHDF1 as a promising prognostic biomarker and therapeutic target for OC. Its role in shaping an immunosuppressive microenvironment and mediating chemoresistance underscores its potential in enhancing immunotherapy and improving chemotherapy outcomes.
Keywords: ovarian cancer, YTHDF1, biomarker, therapeutic target, macrophage
Graphical Abstract:

Introduction
Ovarian cancer (OC) remains among the most lethal gynecologic malignancies worldwide, marked by late-stage diagnosis, rapid progression, and high mortality rates.1 Despite advancements in surgery and chemotherapy, the long-term survival of patients with advanced OC has shown only limited improvement over the past decades.2–4 Consequently, the identification of novel molecular drivers and therapeutic targets is urgently required to enhance early detection and develop more effective, personalized treatment strategies.
In recent years, significant efforts have been dedicated to identifying the molecular determinants of cancer. Among the notable advancements, immunotherapy has emerged as a promising approach in oncology. Nevertheless, its clinical efficacy in OC remains limited, primarily due to the immunosuppressive tumor microenvironment (TME) and the lack of robust immune-related biomarkers.5 Emerging evidence, however, indicates that post-transcriptional regulatory mechanisms, such as epitranscriptomic modifications, may play a critical role in shaping the TME and influencing cancer progression. Notably, N6-methyladenosine (m6A) modification has garnered considerable attention as the most abundant internal modification of eukaryotic mRNA. This modification is dynamically regulated by “writers” (eg, METTL3, METTL14), “erasers” (eg, FTO, ALKBH5), and “readers” (eg, YTH domain-containing proteins).6–8
As a critical m6A reader, YTH N6-methyladenosine RNA-binding protein 1 (YTHDF1) facilitates the translation of m6A-modified transcripts, thereby regulating essential cellular processes such as proliferation, differentiation, and immune responses. Recent studies have identified YTHDF1 as a pro-tumorigenic factor in various cancers, including colorectal, lung, gastric, hepatocellular, and breast cancers, through mechanisms involving immunoregulation, activation of oncogenic signaling, and remodeling of the TME.8–11 Notably, YTHDF1 has been shown to promote immune escape by suppressing antigen presentation in dendritic cells, thus impairing antitumor immunity.m6A modification, the most abundant epitranscriptomic modification in eukaryotic mRNA, plays a pivotal role in post-transcriptional gene regulation, influencing RNA stability, splicing, translation, and degradation.11 While the role of m6A regulators is beginning to be explored in OC, the specific function and regulatory mechanisms of YTHDF1 in OC remain poorly characterized. The molecular mechanisms underlying YTHDF1’s role in shaping the immunosuppressive TME and mediating therapeutic resistance in OC are yet to be fully elucidated.
This study comprehensively investigates the role of YTHDF1 in OC through integrative bioinformatic analyses and experimental validation. Our findings indicate that YTHDF1 is markedly upregulated in OC and closely linked to poor clinical outcomes. Functional and mechanistic assays highlight its role in promoting tumor cell proliferation, migration, and chemoresistance. Additionally, we unveil its immunoregulatory impact via exosome-mediated delivery, driving macrophage polarization toward the M2a phenotype and fostering an immunosuppressive microenvironment. Notably, YTHDF1 expression is associated with immune infiltration and responsiveness to immunotherapy, emphasizing its multifaceted influence on tumor progression and therapeutic outcomes. These findings position YTHDF1 as a promising biomarker and potential therapeutic target in OC. Overall, our study offers novel insights into the oncogenic role of YTHDF1 in OC and underscores its potential for prognosis and therapeutic intervention. Figure 1 provides a schematic representation of YTHDF1’s role in OC progression.
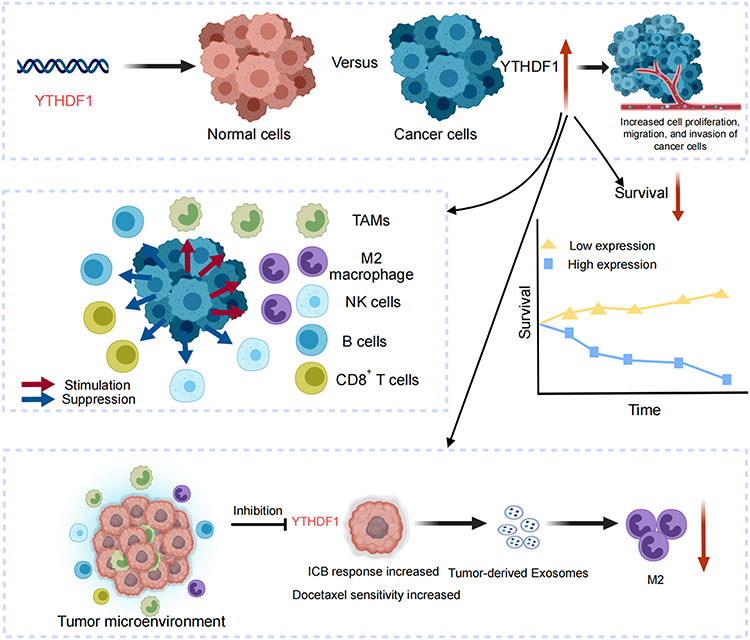 |
Figure 1 Graphical abstract illustrating the role of YTHDF1 in OC. Elevated YTHDF1 is linked to poor prognosis, altered immune infiltration, and immunosuppressive pathways. It drives tumor progression, influences chemotherapy sensitivity, and is secreted via exosomes to induce M2a macrophage polarization, underscoring its potential as both a prognostic marker and therapeutic target in OC. A red upward arrow denotes upregulation, while a red downward arrow denotes reduction. Abbreviations: TAMs, Tumor-associated macrophages; NK cells, Natural Killer cells; ICB, Immune checkpoint blockade. |
Materials and Methods
Bioinformatics Analysis
Based on the cBioPortal (https://www.cbioportal.org/), a systematic search was conducted to analyze the genetic alteration profiles of YTHDF1-YTHDF3 in OC and to explore their prognostic significance. RNA-sequencing (RNA-seq) raw data of OC cohorts were downloaded from The Cancer Genome Atlas (TCGA) (https://portal.gdc.cancer.gov/) public database, and microarray datasets from the Gene Expression Omnibus (GEO) (https://www.ncbi.nlm.nih.gov/geo/) database were integrated.12,13 The limma package was employed to analyze the differential expression of the YTHDF1 between cancerous and normal tissues. The UALCAN platform (https://ualcan.path.uab.edu) was utilized to assess protein expression levels in Clinical Proteomic Tumor Analysis Consortium (CPTAC) OC samples.14 Kaplan-Meier survival analysis (http://kmplot.com/analysis/) was performed to evaluate the impact of YTHDF1 expression levels on patient prognosis.15
Patients and Specimens
A total of 50 primary OC tissue samples and 10 normal tissue samples were collected from Shanghai First Maternity and Infant Hospital. Informed consent was obtained from all participants prior to sample collection. Detailed clinical information for these OC patients was retrieved from the hospital’s electronic medical record system. This study received approval from the Ethics Committee of Shanghai First Maternity and Infant Hospital (Approval number KS25218).
Receiver Operating Characteristic (ROC) Curve Analysis
To evaluate the predictive performance of YTHDF1 expression in OC, ROC curve analysis was conducted using TCGA-OC transcriptomic data. The area under the curve (AUC) was calculated to assess the diagnostic value of YTHDF1 in distinguishing OC tissues from normal controls. ROC curves and AUC values were generated using the pROC package in R (version 4.2.2). A higher AUC indicates better discriminatory ability.
Quantitative Polymerase Chain Reaction (qPCR)
Total RNA was extracted from tissues and cell lines using TRIzol reagent (Takara, Japan), following the manufacturer’s protocol. Reverse transcription was conducted with the PrimeScript RT Master Mix kit (RK20429, ABclonal, China). Real-time qPCR (RK21203, ABclonal, China) was performed according to the supplier’s instructions, with GAPDH serving as the endogenous control. The relative RNA expression was calculated using the 2−ΔΔCT method. Relevant primer sequences are summarized in Supplementary Table S1.
Western Blot (WB)
Tissues and cells were lysed with RIPA buffer (WB3100, NCM Biotech, China) supplemented with 1% 1 mM PMSF, and protein concentration was measured using a BCA protein assay kit (WB6501, NCM Biotech, China). Equal amounts of protein were separated by 10% SDS-PAGE and transferred onto PVDF membranes. Membranes were blocked with 5% nonfat milk for 2 h at room temperature, followed by overnight incubation with primary antibodies at 4 °C. After three 10-min washes with TBST, membranes were incubated with secondary antibodies for 2 h at room temperature and then washed three times with TBST for 5 min each. Chemiluminescence signals were detected to visualize protein expression.
Antibodies and Reagents
The antibodies and reagents used in this study were shown in Supplementary Table S2.
Immunohistochemistry (IHC)
Sectioned tissues were embedded in paraffin, rehydrated, and blocked by incubation with goat serum. Sections were incubated with primary antibody at 4 °C overnight. Then, the sections were incubated with an HRP-conjugated goat anti-rabbit or mouse secondary antibody at room temperature for 1 h. The sections were treated with the Horseradish catalase DAB color kit (C520017, Sangon Biotech) and stained with hematoxylin (E607317, Sangon Biotech).
Cell Culture and Stable Cell Line Construction
A2780, SKOV3, THP-1, and 293T cells were purchased from the Cell Banks of Type Culture Collection of Chinese Academy of Sciences (Shanghai, China). ID8 cell line was purchased from FuHeng Biology (Shanghai, China). These cells were cultured in McCoy’s 5a (SKOV3), DMEM (293T, ID8), or RPMI 1640 (A2780, THP-1) containing 10% fetal bovine serum (C9050, NCM Biotech, China) and 1% penicillin/streptomycin (Gibco, USA). To construct stable cell lines, YTHDF1-shRNAs were cloned into the pLVX-puro vector. The efficiency of knockdown was evaluated using WB. The shRNAs and their negative controls (NC) were designed and synthesized by YouBio (Changsha, China). The above shRNAs used in this study are summarized in Supplementary Table S3.
Cell Counting Kit-8 (CCK-8) Assay
The proliferation ability of OC cells (SKOV3 and A2780) was assessed using the CCK-8 reagent (C6050, NCM Biotech, China). Cells were seeded into 96-well plates at a density of 1 × 10³ cells per well and cultured for 0, 24, 48, 72, and 96 hours. At each time point, 10 µL of CCK-8 solution was added to each well, followed by a 2-hour incubation. The absorbance at 450 nm was then measured using a spectrophotometer to evaluate cell viability.
5-Ethynyl-20-Deoxyuridine (EdU) Assay
EdU detection was performed according to the instructions of the DNA cell proliferation assay kit (CX003, Epizyme Biotech, China). Fluorescence images were captured using an inverted fluorescence microscope (Nikon, Japan), and the proportion of EdU-positive cells was analyzed using ImageJ software.
Cell Apoptosis Assay
Cells were harvested and washed twice with cold PBS. Apoptosis was assessed using an Annexin V-APC apoptosis detection kit (E-CK-A258, Elabscience, China) following the manufacturer’s instructions. Briefly, the cells were resuspended in binding buffer and incubated with Annexin V-APC for 15 minutes at room temperature in the dark. Subsequently, the stained samples were analyzed by flow cytometry.
Transwell Assay
Transwell chambers (Corning, USA), either coated or uncoated with Matrigel (D23016-0010, D1 Medical Technology, Hangzhou, China), were used for migration and invasion assays. According to the manufacturer’s protocol, 200 µL of cell suspension was added to the upper chamber in serum-free medium, while the lower chamber was filled with medium containing 10% FBS as a chemoattractant. After 24 hours of incubation, non-migrated cells on the upper surface of the membrane were removed using a cotton swab. Cells that had traversed the membrane were fixed, stained, and imaged under a microscope. The number of migrated or invaded cells was quantified using ImageJ software.
Animal Experiment
All in vivo experiments were conducted in accordance with the guidelines of the National Institutes of Health for the care and use of laboratory animals and were approved by the Animal Care Committee of Tongji University (Number TJBG30325102). We chose 6-week-old female C57BL/6 mice for tumor transplantation. In tumor growth assay in vivo, A total of 7.5 × 10⁶ ID8 cells (100 µL, NC vs sh-YTHDF1) were mixed with an equal volume of Matrigel and subcutaneously injected into the right axillary region of the mice. The tumor volume was calculated as length x width2 × 0.5. 35 days after the injection, the mice were euthanized, and the tumors were dissected for further analysis.
In the intraperitoneal model, 3.0 × 10⁶ ID8‐luciference‐expressing (ID8-luc) tumor cells (200 µL, NC vs sh-YTHDF1) were injected intraperitoneally. 35 days after the injection, Luminance signals of every group were detected by using the IVIS Lumina XRMS Series III instrument.
For chemotherapy in vivo, docetaxel (DTX) was injected intraperitoneally on day 10, day 20 and day 30 of tumor implantation, and the tumor was isolated on day 35 for follow-up analysis.
Flow Cytometry (FCM)
Briefly, the samples were processed into single-cell suspensions and stained with antibodies on room temperature for 30 minutes. After staining, the cells were washed with PBS and centrifuged at 1,000 rpm for 5 minutes. The resulting pellets were resuspended in 100 μL of PBS for analysis using a flow cytometer (FACS Calibur, BD Biosciences, Franklin Lakes, NJ, USA). Mouse macrophages (M0) were identified as CD45+CD11b+F4/80+, while mouse CD8+ T cells as CD45+CD3+CD8+, and NK cells as CD45+CD3−CD49+.
Co-Expression and Functional Enrichment Analyses
The LinkedOmics database (http://www.linkedomics.org) is an interactive web portal for analyzing multi-omics data derived from TCGA-OC project.16 Using the TCGA-OC cohort, Spearman correlation analysis was conducted to identify genes significantly co-expressed with YTHDF1. The results were visualized with a volcano plot, illustrating the distribution of positively and negatively correlated genes, and a heatmap showing the top 50 genes with the strongest correlations. Gene Ontology (GO) and Kyoto Encyclopedia of Genes and Genomes (KEGG) pathway enrichment analyses were subsequently performed using the LinkedOmics functional module to explore the biological functions and signaling pathways associated with YTHDF1 co-expression.
Isolation of Exosomes From OC Cell Lines
Exosomes were isolated from the conditioned medium of OC cell lines using a standard differential ultracentrifugation protocol. Briefly, cells were cultured in medium supplemented with exosome-depleted FBS for 48 hours. The collected culture supernatants were first centrifuged at 300 × g for 10 minutes to remove cells, followed by 2,000 × g for 20 minutes and 10,000 × g for 30 minutes at 4°C to eliminate cell debris and large vesicles. The supernatants were then filtered through a 0.22 μm membrane and subjected to ultracentrifugation at 100,000 × g for 70 minutes at 4°C using a Beckman Coulter Optima ultracentrifuge. The exosome-containing pellets were washed once with sterile PBS and centrifuged again at 100,000 × g for 70 minutes. Finally, the purified exosomes were resuspended in PBS and stored at –80°C until further use.
Immune Cell Infiltration Analysis
To investigate the relationship between YTHDF1 expression and immune cell infiltration in OC, we employed the CIBERSORT algorithm, a deconvolution method that estimates the relative abundance of 22 immune cell types from bulk tumor transcriptomic data1. The analysis was performed using the CIBERSORTx online platform (https://cibersortx.stanford.edu/) with LM22 signature matrix and 1,000 permutations. Normalized RNA-seq expression data of OC samples from the TCGA-OC cohort were input into the algorithm.17
IPS Scores Analyses
The Immunecell Proportion Score (IPS) of OC patients were obtained in The Cancer Immunome Atlas (TCIA, https://tcia.at/home) database.
Transcription Factors (TFs) Binding Site Prediction
To explore the upstream regulatory mechanisms responsible for YTHDF1 dysregulation, we performed a comprehensive TF prediction analysis by integrating data from 7 publicly available databases: PWMEnrich_JASPAR, hTFtarget, FIMO_JASPAR, ChEA, ChIP-Atlas, GTRD, and ENCODE. These resources incorporate transcription factor binding site prediction, ChIP-seq datasets, and TF-target interaction information derived from both experimental and computational analyses. TFs binding sites within the YTHDF1 promoter were predicted using the JASPAR database (https://jaspar.genereg.net/).18
Correlation Analysis Using the Cancer Cell Line Encyclopedia (CCLE) Database
To further validate the regulatory relationship between YTHDF1 and its predicted upstream TFs, we utilized the CCLE database (https://portals.broadinstitute.org/ccle).19 The CCLE provides comprehensive transcriptomic profiles across a wide range of human cancer cell lines, facilitating in vitro assessment of gene expression correlations. Pearson correlation coefficients were calculated using normalized mRNA expression data from OC cell lines to evaluate the strength and direction of the associations. The results were visualized using scatter plots.
Protein and Drug Response Profiling Using Comprehensive Pancancer Analysis of Drug Sensitivity (CPADS)
To investigate the association between YTHDF1 expression and drug sensitivity in OC, we utilized the CPADS, an open-access resource that integrates proteomic data with clinical drug response information across various cancer types. CPADS provides curated datasets linking protein expression levels with drug sensitivity profiles, enabling the identification of potential therapeutic vulnerabilities.
Generation of ID8-Luciferase (ID8-Luc) Cells
Murine OC ID8 cells were transduced with a lentiviral vector encoding the firefly luciferase gene (GeneChem Co., Ltd., Shanghai, China) to generate luciferase-expressing ID8 (ID8-luc) cells. After 48 hours of transduction, the medium was replaced and cells were subjected to selection with 500 μg/mL G-418 (MedChemExpress, China) for 10 days to ensure stable integration. Luciferase expression was subsequently verified by bioluminescence imaging following D-luciferin administration.
Bioluminescence-Based Monitoring of Tumor Progression
Tumor development and therapeutic efficacy were evaluated in vivo using a bioluminescence imaging system (Tanon ABL-X6, Shanghai, China). Mice were anesthetized with isoflurane and administered D-luciferin intraperitoneally (3 mg/mouse) 10 minutes before imaging. Image acquisition was performed with an exposure time ranging from 1 to 3 minutes, adjusted according to signal intensity. Quantitative analysis of the bioluminescent signal was conducted using Tanon Image Analysis Software, with results expressed as average flux (photons/sec/cm²/sr) within a defined region of interest (ROI) encompassing the tumor site. All procedures were standardized to maintain consistent imaging parameters and environmental conditions.
Statistical Analysis
Statistical analyses were conducted using R software (v4.2.2) or GraphPad Prism V.9. Cell numbers were analyzed using ImageJ software, and flow cytometry (FCM) data were quantified using FlowJo V10 software. Experiments were performed with at least three biological replicates (n ≥ 3). Details of the specific statistical tests applied are provided in the figure legends. For survival analyses, differences were assessed using the Log rank test. For analyses involving multiple comparisons (eg, correlation analyses and gene expression profiling), p-values were adjusted using the Benjamini-Hochberg procedure to control the false discovery rate. A p-value < 0.05 was considered statistically significant.
Results
Elevated YTHDF1 Expression in OC and Its Prognostic Implications
We initially examined the copy number variations (CNVs) of YTHDF1-3 in OC using data from TCGA through the cBioPortal database. As depicted in Figure 2A, YTHDF1 demonstrated the most pronounced CNV alterations in OC. Importantly, unlike YTHDF2 and YTHDF3, genetic alterations in YTHDF1 were significantly associated with shorter survival in OC patients (Figure 2B). Furthermore, amplification of YTHDF1 in OC tissues correlated with elevated mRNA expression levels (Figure 2C). Next, we examined YTHDF1 expression in the TCGA-OC cohort, noting substantial overexpression in cancer tissues compared to their normal counterparts (Figure 2D). Based on these findings, YTHDF1 was identified as a candidate gene for further study. This overexpression was confirmed through independent datasets, including CPTAC and GEO databases, which consistently validated its elevated expression in tumor tissues (Figure 2E–J). Then, we compared YTHDF1 levels across various clinicopathological parameters, observing significant differences with age and TP53 mutation status, while no associations were found with other clinical features via UALCAN database (Supplementary Figure 1A–E). We then evaluated YTHDF1 expression in OC and normal tissues from the Shanghai First Maternal and Infant Hospital. Within our cohort, YTHDF1 mRNA levels were significantly elevated in OC tissues and positively correlated with Ki67 proliferation index, lymphatic metastasis, and histological differentiation (Figure 2K, Table 1). Both WB and IHC analyses consistently highlighted a marked increase in YTHDF1 expression in OC tissues (Figure 2L and M). Additionally, Kaplan-Meier survival analysis across multiple cohorts revealed that patients with higher YTHDF1 expression exhibited notably reduced survival durations (Figure 2N–Q). Analysis using the Gene Expression Profiling Interactive Analysis (GEPIA) and KM plotter database further validated the overexpression of YTHDF1 in OC and its association with poorer prognosis20(Supplementary Figure 1F–H). ROC curve analysis identified elevated YTHDF1 levels as an independent prognostic factor for OC patients (Supplementary Figure 1I–J). Collectively, these findings highlight the elevated expression of YTHDF1 in OC and establish its potential as a predictive biomarker for unfavorable prognosis.
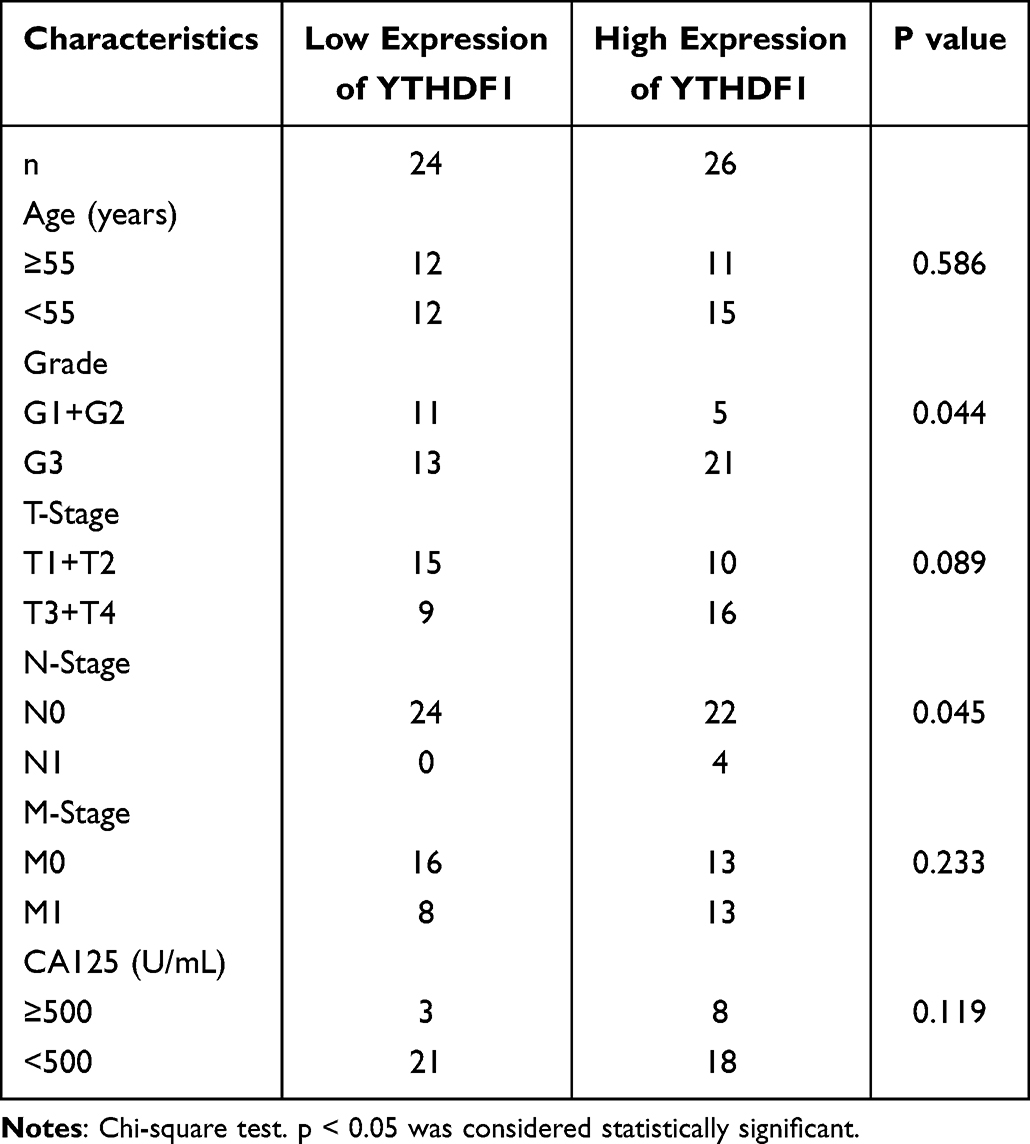 |
Table 1 Relationship Between YTHDF1 mRNA Expression and Clinicopathological Parameters in OC Patients |
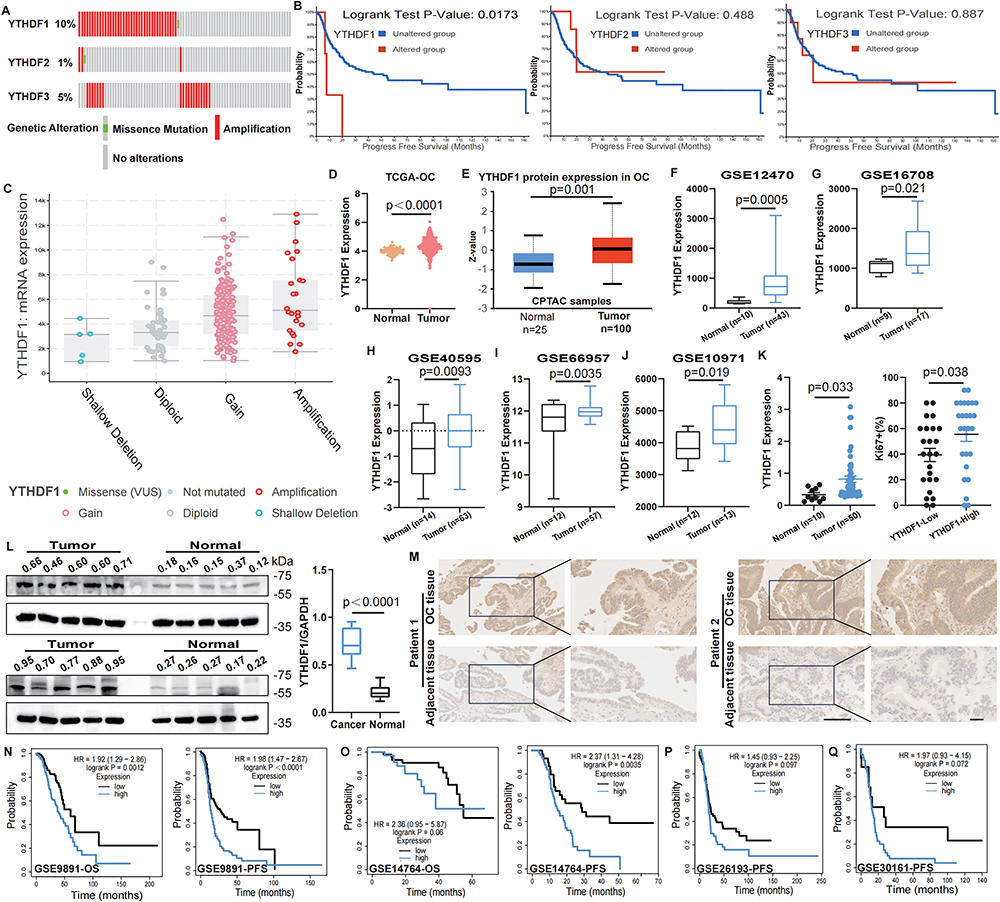 |
Figure 2 YTHDF1 upregulation in OC and its prognostic implications. (A) The proportion of genetic alterations in the YTHDF1-YTHDF3 genes was analyzed using the cBioPortal database. (B) The Impact of YTHDF1-YTHDF3 genetic alterations on progression-free survival (PFS). Analyzed by Log rank test. (C) The cBioPortal database was utilized to investigate the correlation between the genetic alteration categories of YTHDF1 and its mRNA levels. (D–E) Comparison of YTHDF1 expression at the mRNA level in TCGA-OC (D) and at the protein level in the CPTAC database (E). (F-J) The mRNA expression of YTHDF1 in OC and normal tissues was compared across 5 distinct GEO datasets (GSE12470, GSE16708, GSE40595, GSE66957, GSE10971). (K) To assess the levels of YTHDF1 in cancer tissues (n=50) and normal samples (n=10) from Shanghai First Maternal and Infant Hospital (left) and investigate the impact of YTHDF1 expression on the Ki67 proliferation index (right). (L) The protein expression levels of YTHDF1 in OC tissues and normal ovaries were assessed by WB (left) and quantitatively analyzed (right) by ImageJ software. (M) IHC was employed to evaluate the expression of YTHDF1 in tumor tissues and adjacent non-tumor tissues. Scale bar:50 µm (left) and 200 µm (right). (N and O) The GSE9891 and GSE14764 datasets were analyzed to examine the effects of YTHDF1 levels on overall survival (OS) and PFS of patients. (P and Q) The GSE26193 and GSE30161 datasets were utilized to investigate the influence of YTHDF1 levels on PFS. For D-L, data are presented as the means ± standard error of the mean (SEM), unpaired two-sided Student’s t-test. |
YTHDF1 Drives OC Progression in vitro and in vivo
To investigate the biological function of YTHDF1, we established a stable YTHDF1-knockdown OC cell line using a lentiviral vector. To validate the efficiency of YTHDF1 silencing, qPCR and WB analyses were performed, both confirming a significant reduction in YTHDF1 expression (Figure 3A and B). To assess the impact of YTHDF1 on OC cell proliferation, we conducted CCK-8 and EdU assays, which revealed that YTHDF1downregulation markedly impaired the proliferative capacity of OC cells (Figure 3C and D). Additionally, we examined whether YTHDF1 influences apoptosis using FCM, and the results indicated a significant increase in tumor cell apoptosis following YTHDF1 knockdown (Figure 3E). We further evaluated the role of YTHDF1 in cell migration and invasion through transwell assays. The findings demonstrated that YTHDF1 depletion significantly suppressed the migratory and invasive abilities of OC cells, supporting its involvement in tumor progression and metastasis (Figure 3F and G). To explore the effect of YTHDF1 on tumor growth in vivo, we generated a stable YTHDF1-knockdown ID8 cell line. Both YTHDF1-knockdown and control cells were subcutaneously implanted into C57BL/6 mice. After 35 days, the tumors were harvested, and their volume and weight were measured for analysis (Figure 3H). Tumors derived from YTHDF1-knockdown cells exhibited markedly reduced volume and weight (Figure 3I). Furthermore, the expression levels of YTHDF1 and Ki67 in tumor tissues implanted with ID8-sh-YTHDF1 cells were significantly lower (Figure 3J). Collectively, these findings highlight the critical role of YTHDF1 in OC progression and suggest that its inhibition may serve as a promising therapeutic strategy for OC treatment.
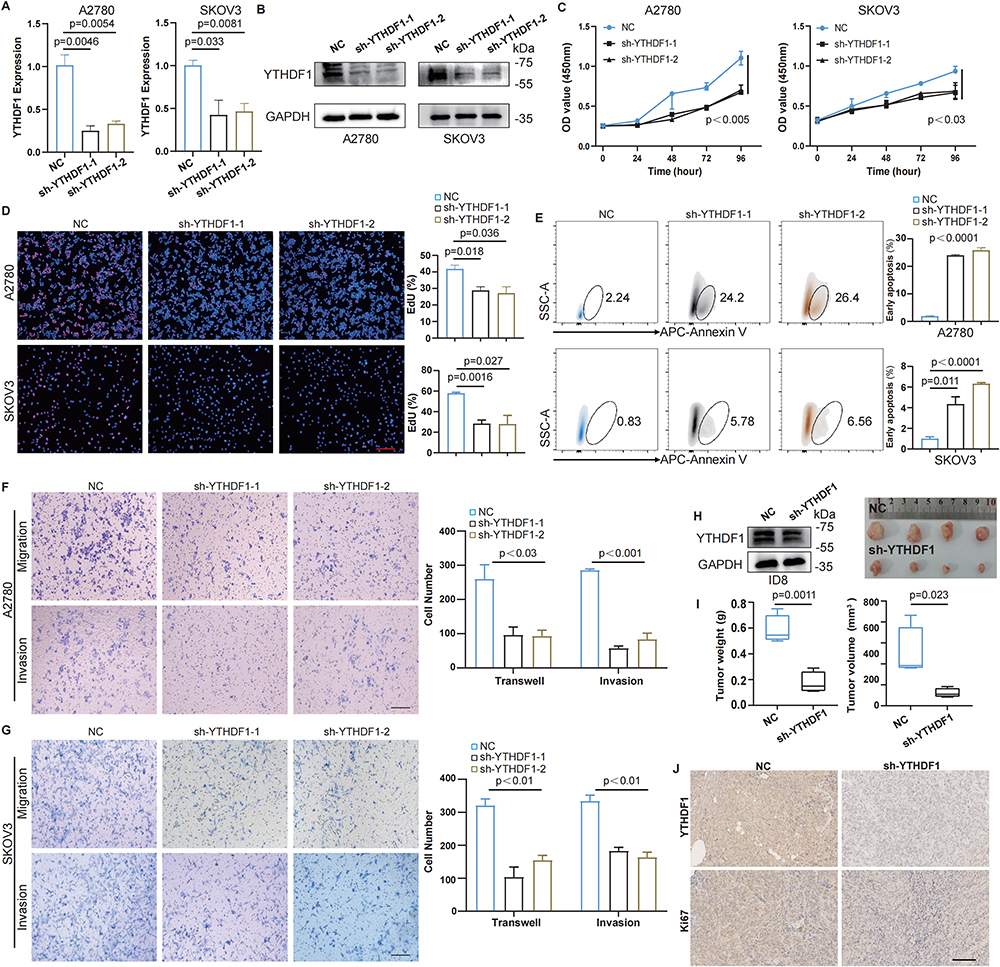 |
Figure 3 YTHDF1 promotes OC progression both in vitro and in vivo. (A) The expression of YTHDF1 in A2780 (left) and SKOV3 (right) cells stably transfected with YTHDF1 shRNAS was detected by qPCR. (B) The knockdown efficiency of YTHDF1 shRNAs in A2780 (left) and SKOV3 (right) cells was detected by WB. (C) CCK-8 assays were used to detect the proliferation ability of cells after YTHDF1 knockdown. (D) Representative images of A2780 (up) and SKOV3 (down) cells of EdU assays of every group; and the quantitative data were compared (right). Scale bar, 100μm. (E) Representative images of A2780 (up) and SKOV3 (down) cells of apoptosis experiments every group; and the quantitative data were compared (right). (F–G) Representative images of migrated (upper) and invasive (lower) A2780 (F) and SKOV3 (G) cells, along with quantitative analysis using ImageJ software (right). Scale bar, 100μm. (H) WB analysis was used to verify the knockdown efficiency of YTHDF1 in ID8 cells (left). The ID8 cells were then subcutaneously implanted into C57BL/6 mice. Thirty-five days after tumor implantation, the tumors were excised and photographed. (I) The weight (left) and volume (right) of ID8 tumors were compared between the two groups. (J) Expression levels of YTHDF1 and Ki67 in the tumor tissues of each group were detected by IHC staining. Scale bar:100 µm. For A, C-G, data are presented as the means ± SD, unpaired two-sided Student’s t-test. For I, data are presented as the means ± SEM, unpaired two-sided Student’s t-test. |
Enrichment Analysis of Expression Profile Characteristics of YTHDF1 in OC
To clarify the potential biological significance of YTHDF1 in OC, we utilized the LinkedOmics database to perform an in-depth co-expression analysis. Spearman correlation analysis identified genes significantly associated with YTHDF1 (Figure 4A). A heatmap was generated to visualize the 50 genes exhibiting either positive or negative correlations with YTHDF1 (Figure 4B). Subsequent enrichment analysis highlighted critical biological pathways, molecular functions, and cellular processes linked to elevated YTHDF1expression. Gene Ontology (GO) analysis demonstrated that YTHDF1 positively regulates vesicle-mediated transport at the synapse, plasma membrane, and trans-Golgi network, while negatively influencing lymphocyte-mediated immunity, adaptive immune responses, MHC protein complexes, and antigen binding (Figure 4C, Supplementary Figure 2A and B). Based on these findings, we hypothesized that YTHDF1 may also be implicated in exosome biogenesis or secretion. To investigate this, we isolated exosomes from OC cell culture supernatants and conducted WB analysis. The vesicles were confirmed as exosomes by the presence of CD9 and the absence of calnexin. YTHDF1 was detected in the exosomal fraction of both A2780 and SKOV3 cells, indicating its incorporation into secreted exosomes (Figure 4E and F). KEGG pathway analysis further identified a positive correlation between YTHDF1 and the VEGF and HIF-1 signaling pathways (Figure 4D). To validate these findings, we performed WB analysis, which revealed that downregulation of YTHDF1 in OC cells led to a concomitant decrease in HIF1α and VEGF expression levels (Figure 4G and H). Additionally, expression profiling data from the TCGA-OC cohort provided further evidence supporting a significant positive correlation between YTHDF1 and HIF1α and VEGF levels (Figure 4I). Collectively, our findings reveal that in OC, YTHDF1 plays a pivotal role in regulating the downstream HIF1α and VEGF signaling pathways.
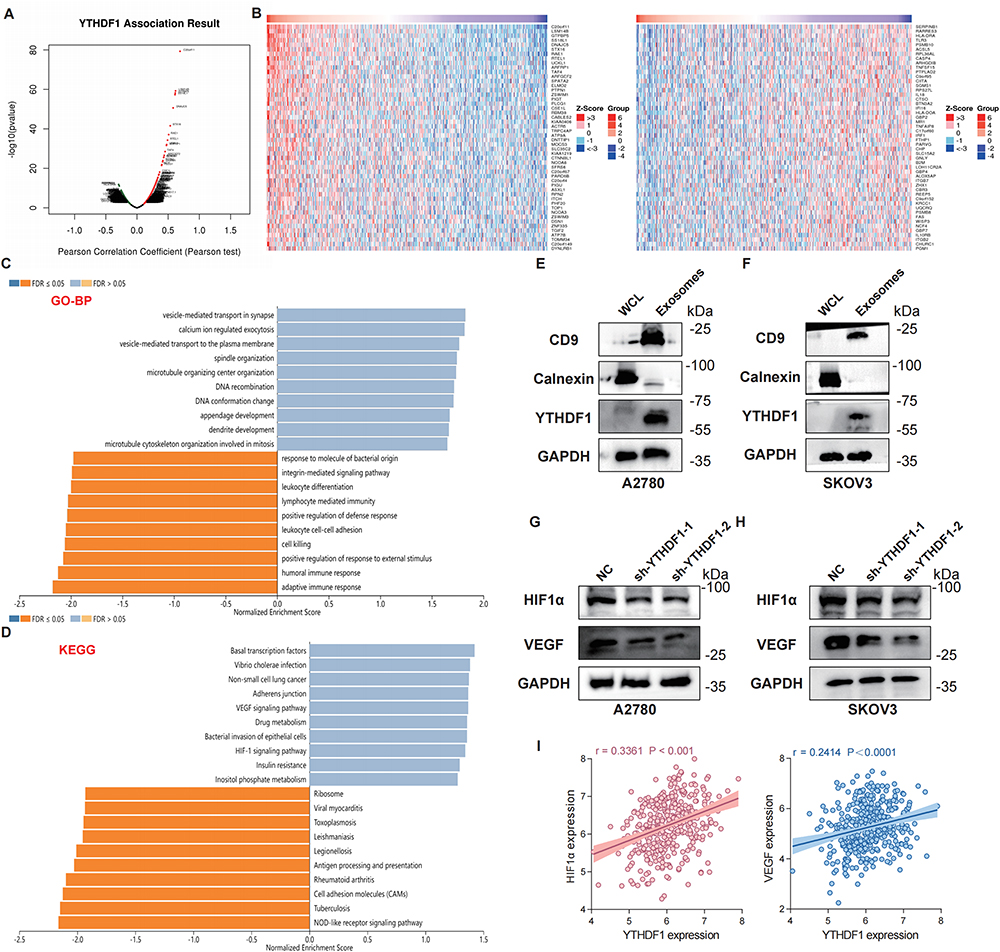 |
Figure 4 Expression pattern and enrichment analysis of YTHDF1 in OC. (A-D) Analyses were performed using The LinkedOmics (http://www.linkedomics.org/) database. (A) The volcano plot illustrates the correlation of co-expressed genes with YTHDF1 in OC. (B) The heatmap displays the top 50 genes in OC that exhibit the strongest positive (left) and negative (right) correlations with YTHDF1. (C) GO biological process (GO-BP) enrichment analyses of YTHDF1 co-expressed genes showed that vesicle-mediated transport at the synapse and plasma membrane. (D) KEGG enrichment analyses of co-expressed genes indicated that VEGF signaling pathway and HIF-1 signaling pathway were enriched. (E and F) Exosomes were characterized by WB and YTHDF1 levels in tumor whole cell lysate (WCL) and cell-secreted exosomes were analyzed. A2780 cells are shown on the left, and SKOV3 cells on the right. (G and H) WB was performed to assess the protein expression levels of HIF1α and VEGF following YTHDF1 knockdown in A2780 (G) and SKOV3 (H) cells. (I) The association between YTHDF1 expression and the levels of HIF1α (left) and VEGF (right) was investigated using sample data from the TCGA-OC cohort. Abbreviations: GO, Gene Ontology; KEGG, Kyoto Encyclopedia of Genes. |
Relationship Between YTHDF1 Expression and Immune Infiltration
The enrichment analysis indicates that YTHDF1 may function as a critical regulator of the TME. To investigate further, we first examined the correlation between YTHDF1 expression and key TME parameters. Notably, the high YTHDF1 expression group demonstrated a significantly decreased ImmuneScore, while no substantial differences were observed in the StromalScore or ESTIMATEScore (Figure 5A). Additionally, we explored the association between YTHDF1 transcriptional levels and the expression of major immune cell markers (CD68+ macrophage, CD33+ myeloid-derived suppressor cells, CD66b+ neutrophils, α-SMA+ cancer-associated fibroblasts, FOXP3+ Regulatory T Cells) within the TME of OC. Our findings demonstrated a prominent correlation between YTHDF1 expression and the infiltration abundance of macrophages (CD68+) (Figure 5B–F). Single-cell RNA sequencing datasets (GSE115007 and GSE158722) further validated the elevated expression of YTHDF1 in macrophages (Figure 5G and H). To solidify the link between YTHDF1 and macrophage infiltration, we stratified TCGA-OC data into macrophage-enriched and macrophage-decreased subgroups for survival analysis. In the macrophage-enriched group, high YTHDF1 expression was significantly associated with poorer patient prognosis, whereas in the macrophage-decreased group, YTHDF1 expression had minimal impact on patient survival (Figure 5I). The CIBERSORT algorithm also highlighted a significant association between YTHDF1 expression and macrophage infiltration in TCGAOC samples (Figure 5J). Overall, YTHDF1 levels in OC are closely linked to macrophage enrichment. Additionally, we discovered an inverse relationship between YTHDF1 levels and the presence of NK cells, memory B cells, and CD8+ T cells (Figure 5K). Finally, analysis of tumor-bearing tissues in mice using FCM (Figure 5L) also demonstrated that YTHDF1 downregulation in the TME led to a substantial reduction in macrophage infiltration (Figure 5M), accompanied by a marked increase in NK cell and CD8+ T cell populations (Figure 5N and O, Supplementary Figure 3).
 |
Figure 5 YTHDF1 positively correlates with immune infiltration. (A) The TCGA-OC cohort was divided into high and low YTHDF1 expression groups, and the enrichment of StromaScore, ImmuneScore and ESTIMATEScore in both groups was analyzed. (B-F) According to the expression profile of TCGA-OC samples, the correlation between the YTHDF1 expression and the expression levels of classical markers of macrophages (B), myeloid suppressor cells (C), neutrophils (D), cancer-associated fibroblasts (E) and regulatory T cells (F) was analyzed. (G and H) Utilizing the TISCH2 database (http://tisch.comp-genomics.org/), the expression patterns of YTHDF1 across various cell types in the single-cell sequencing datasets from the GEO cohort (GSE115007 and GSE158722) were searched, where deeper colors denote higher expression levels. (I) TCGA-OC data were classified into high macrophage and low macrophage infiltration groups. The YTHDF1 expression was used as a marker to predict the OS of the cohort. (J) The TCGA-OC cohort was stratified into high and low YTHDF1 expression groups, and the enrichment of M0 macrophages in each group was assessed. (K) The association between YTHDF1 expression and immune cell infiltration in the TCGA-OC cohort was evaluated using the CIBERSORT algorithm. Circle size indicates the correlation coefficient, with significance levels denoted as *p < 0.05, **p < 0.01, and ***p < 0.001. (L) FCM gating strategy of immune cells. (M-O) In a subcutaneous ovarian tumor model, the proportions of macrophages (M), CD8+T cells (N), and NK cells (O) in tumor tissue were analyzed and quantified. Data are presented as the means ± SEM. For A, J, K, the data were analyzed by Wilcoxon rank sum test. For M-O, data were analyzed by unpaired two-sided Student’s t-test. |
Exosome-Mediated YTHDF1 Induction Facilitates the Development of M2a Macrophages
Macrophages within the TME can exhibit either pro-inflammatory (M1) or immunosuppressive (M2) phenotypes. Given the observed link between YTHDF1 and macrophage abundance, we investigated whether YTHDF1 is specifically associated with M2-like polarization.21–23 Analysis of the TCGA-OC dataset showed a positive correlation between YTHDF1 expression and M2 macrophage infiltration (Figure 6A). Further analyses utilizing publicly available datasets confirmed that YTHDF1 expression negatively correlates with M1 macrophage infiltration while exhibiting a significant positive association with M2 macrophage abundance in OC (Figure 6B). To further examine the relationship between YTHDF1 and M2 macrophage polarization, we analyzed its association with representative markers of M2 subtypes. Notably, YTHDF1 expression demonstrated the strongest positive correlation with CD206 (M2a), alongside moderate associations with HLA-DRA (M2b), IL10 (M2c), and CD14 (M2d) (Figure 6C). These results suggest that YTHDF1 may preferentially promote M2a-like polarization within the TME. Recognizing the emerging role of exosomes as pivotal mediators of intercellular communication in the TME, we next assessed whether YTHDF1 mediates its regulatory effects on M2a macrophage polarization through an exosome-dependent mechanism.24,25 Then, exosomes were collected from YTHDF1-altered cells and used to educate macrophages. The absence of YTHDF1 in exosomes was confirmed by WB (Supplementary Figure 4). Macrophages treated with sh-YTHDF1 exosomes (Exos-sh-YTHDF1) and control group exhibited fewer CD206 expression than those treated with normal exosomes (Exos-NC) (Figure 6D and E). Additionally, qPCR analysis indicated a significant upregulation in the mRNA levels of M2-associated markers, including ARG1, CD163, IL-10, TGFβ1, and VEGF (Figure 6F). Together, these findings indicate that YTHDF1 drives M2a-like macrophage polarization in OC through an exosome-mediated mechanism.
 |
Figure 6 YTHDF1 promotes M2a-like macrophage polarization via an exosome-dependent mechanism. (A) Patients in the TCGA-OC cohort were stratified into high and low YTHDF1 expression groups to evaluate the differences in the proportions of M1 and M2 macrophages. (B) The relationship between YTHDF1 and M1 macrophages infiltration (left) and CD206 expression (right) was examined using TIMER database. (C) Correlation analysis YTHDF1 and CD206 (M2a), HLA-DRA (M2b), IL-10 (M2c), CD14 (M2d) by TCGA-OC cohort. (D) THP-1 derived macrophages treated with Exos-NC and Exos-sh-YTHDF1 for 48 h, followed by a WB and qPCR analysis to the abilities of exosomal YTHDF1 on M2a macrophage polarization. (E) WB analysis of CD206 in macrophages treated with exosomes with or without YTHDF1 for 48 h. Upper panel: exosomes from A2780 cells; lower panel: exosomes from SKOV3 cells. (F) qPCR analysis of M2-associated gene expression (ARG1, CD163, IL-10, TGFβ1, and VEGF) in macrophages treated with exosomes with or without YTHDF1 expression for 48 h. For A, Data are presented as the mean ± SEM. Statistical analysis was performed using the Wilcoxon rank-sum test. For F, data are presented as mean ± SD, statistical analysis was performed using unpaired two-sided Student’s t-test. |
YTHDF1 Expression Influences the Efficacy of Immunotherapy
Given the critical role of YTHDF1 in immune regulation, we further evaluated its influence on immunotherapy efficacy. IPS is a widely used algorithm for predicting immune responses. Immunotherapy response analysis demonstrated that patients with high YTHDF1 expression exhibited significantly lower ips_ctla4_neg_pd1_pos and ips_ctla4_pos_pd1_pos scores compared to those with low expression via TCIA database, indicating a potentially diminished responsiveness to programmed cell death protein 1 (PD-1) inhibitors in the high-expression group (Figure 7B). Conversely, no significant differences were observed in response to CTLA-4 inhibitors between the two groups (Figure 7A). Correlation analysis via GEPIA further substantiated a positive association between YTHDF1 and PD-L1 expression, while no relationship was detected with CD47 (Figure 7C). Intriguingly, elevated YTHDF1 expression was linked to poorer prognostic outcomes in patients receiving PD-1 inhibitor therapy (Nivolumab and Pembrolizumab), whereas no such association was observed for CTLA-4 inhibitor treatment (Figure 7D and F). Meanwhile, we found that YTHDF1 expression was significantly downregulated in patient samples that responded to immunotherapy compared to non-responders (Figure 7G). Collectively, these findings suggest that YTHDF1 expression tends to be lower in patients who respond to immunotherapy, and that elevated YTHDF1 expression may be associated with reduced benefit from anti-PD-1–based treatments. To confirm this hypothesis, we administered anti-PD-1 (αPD-1) monoclonal antibodies to mice bearing ID8 ovarian tumors. While ID8 mice showed no response to PD-1 blockade alone, YTHDF1 depletion substantially enhanced the efficacy of PD-1 blockade, resulting in significant tumor suppression (Figure 7H and I). Altogether, these results indicate that targeting OC-derived YTHDF1 can amplify immunotherapy outcomes, significantly improving the therapeutic effectiveness of existing OC treatments.
 |
Figure 7 YTHDF1 expression plays a crucial role in shaping the therapeutic response to immunotherapy. (A-B) Based on the expression of PD-1 and CTLA-4, all patients were categorized into four groups: CTLA4_negative_PD1_negative, CTLA4_negative_PD1_positive, CTLA4_positive_PD1_negative, and CTLA4_positive_PD1_positive. The results indicated that patients with lower YTHDF1 expression exhibited higher scores of CTLA4_negative_PD1_positive (A) and CTLA4_positive_PD1_positive (B). (C) The GEPIA database confirmed that the expression level of YTHDF1 in OC was positively correlated with PD-L1 (right) expression but showed no significant correlation with CTLA-4 (left) expression. (D) Using the Kaplan-Meier Plotter database, the differences in OS (left) and PFS (right) between patients with high and low YTHDF1 expression levels undergoing anti-Nivolumab therapy were analyzed. (E) Utilizing the Kaplan-Meier Plotter database, the disparities in OS (left) and PFS (right) between patients with high and low YTHDF1 expression levels treated with anti-Pembrolizumab therapy were examined. (F) Analyzed the differences in survival outcomes between patients with high and low YTHDF1 expression levels undergoing anti-CTLA-4 therapy. (G) Compared the expression of YTHDF1 between responders and non-responders to immunotherapy in the GSE78220 dataset. Welch’s t-test. (H) Images of the luminance signals from the OC animal models. ID8‐luc cells (sh-NC and sh-YTHDF1) were injected into the abdominal cavity of mice to establish the OC animal models. The luminance signals of every group were detected by using the IVIS Lumina XRMS Series III instrument on day 35 of tumor implantation (n=5). (I) Quantitative results of the mice fluorescence intensity (n=4). For A-B, G, I, data are presented as the means ± SEM, unpaired two-sided Student’s t-test. |
Potential Regulatory Mechanism of YTHDF1 in OC
To gain deeper insights into the regulatory mechanisms underlying YTHDF1 dysregulation, we conducted a predictive analysis to identify potential TFs involved in its regulation. By integrating data from 7 bioinformatics databases, we systematically screened for candidate TFs and identified five potential regulators: EGR1, MYC, TCF3, CREB1, and TFAP2C (Figure 8A). To further evaluate the role of these TFs in OC, we performed a differential expression analysis. The results revealed that among the 5 identified candidates, CREB1 and TFAP2C were significantly upregulated in OC tissues compared to normal controls, whereas the remaining three TFs (EGR1, MYC, and TCF3) were either significantly downregulated or exhibited no substantial differences in expression (Figure 8B). Given the potential clinical relevance of these findings, we next investigated the prognostic implications of CREB1 expression in OC patients. Survival analysis based on the GEO database demonstrated that elevated CREB1 expression was associated with a significantly shorter overall survival duration, suggesting its potential role as an adverse prognostic factor in OC (Figure 8C–E). This observation led us to prioritize CREB1 for further investigation. To explore the relationship between CREB1 and YTHDF1, we conducted a correlation analysis using data from the TCGA-OC cohort. The results demonstrated a significant positive correlation between CREB1 and YTHDF1 expression, a trend that was consistently observed in OC cell lines (Figure 8F). To further elucidate the molecular basis of this regulatory interaction, we analyzed the YTHDF1 promoter region using the JASPAR database. This analysis identified several potential CREB1-binding sites, with a relative profile score threshold exceeding 80%. Notably, a specific sequence (−1636 bp to −1629 bp, TGTTGTCA) within the YTHDF1 promoter was predicted as a strong candidate binding site (Figure 8G). Additionally, three other putative CREB1-binding sites were identified and summarized in Figure 8H. Taken together, these findings suggest that CREB1 may directly regulate YTHDF1 transcription by binding to its promoter, thereby contributing to YTHDF1 dysregulation in OC. This regulatory mechanism may play a crucial role in OC pathogenesis and warrants further experimental validation.
 |
Figure 8 CREB1 as a key transcriptional regulator of YTHDF1 in OC. (A) By integrating data from 7 TF prediction databases (PWMEnrich_JASPAR, hTFtarge, FIMO_JASPAR, CHEA, ChIP_Atlas, GTRD, ENCODE), 5 potential TFs regulating YTHDF1 were identified (EGR1, MYC, TCF3, CREB1, TFAP2C). (B) Using the TCGA-OC cohort, the differential expression of EGR1, MYC, TCF3, CREB1, and TFAP2C between tumor and normal samples were analyzed. (C-E) The GSE18520(C), GSE63885(D), and GSE3149(E) datasets were analyzed to investigate the impact of high and low expression levels of the TFs CREB1 and TFAP2C on patient prognosis. (F) The correlation between YTHDF1 expression levels and those of CREB1 and TFAP2C was analyzed using the TCGA-OC cohort (left) and the CCLE database (right). (G) Analysis of the YTHDF1 promoter region using the JASPAR database identified a specific sequence (−1636 bp to −1629 bp, TGTTGTCA) as a strong candidate binding site for CREB1. (H) 3 additional potential CREB1 binding sites are summarized in the table. For B, data are presented as the means ± SEM, unpaired two-sided Student’s t-test. |
Correlation Analysis of YTHDF1 and Drug Sensitivity
Beyond immunotherapy, chemotherapy remains integral to cancer treatment. To deepen our understanding of the potential link between YTHDF1 expression and chemotherapeutic efficacy, we leveraged the CPADS database to analyze the correlation between YTHDF1 levels and the IC50 values of commonly used clinical and preclinical antitumor drugs. Among the 20 drugs examined, only Docetaxel (DTX) exhibited a significant positive correlation with YTHDF1 expression (Figure 9A). To validate the antitumor efficacy of DTX, we established a tumor-bearing model in C57BL/6 mice using the ID8 cell line. Mice were treated with DTX (5 mg/kg) while a control group received an equivalent volume of saline. Following three treatment cycles, tumor growth was evaluated, revealing that DTX treatment significantly inhibited tumor progression (Figure 9B and C). Further investigation of the relationship between DTX treatment and YTHDF1 expression through WB analysis of tumor tissues showed a notable reduction in YTHDF1 levels post-treatment (Figure 9D). In summary, our findings indicate a strong association between YTHDF1 expression and the efficacy of Docetaxel in OC. Moreover, DTX not only suppresses tumor growth but also reduces YTHDF1 expression, underscoring the potential of targeting YTHDF1 to optimize chemotherapy outcomes.
 |
Figure 9 Analysis of the correlation between YTHDF1 expression and drug sensitivity. (A) The CPADS database (https://smuonco.shinyapps.io/CPADS/) was used to analyze the correlation between YTHDF1 expression levels and the IC50 values of 20 different drugs in OC samples. A significant positive correlation was observed between YTHDF1 expression and the IC50 value of DTX (R2=0.09, P=0.028). (B)Images of tumors in ID8 tumor-bearing mice treated with normal saline (blank) and DTX for 3 times. (C) Comparison of tumor mass (left) and volume (right) in 2 groups (n=4). (D) The protein expression level of YTHDF1 in 2 groups of tumors was analyzed by WB (left) and quantified by Image J software (n=4). For C-D, data were analyzed by unpaired two-sided Student’s t-test. |
Discussion
In this study, we extend the current understanding of YTHDF1 by elucidating its previously underexplored role in shaping the TME and driving therapeutic resistance in OC. Instead of focusing solely on its canonical function in m6A-mediated translation regulation, we demonstrate that YTHDF1 actively promotes an immunosuppressive phenotype and accelerates tumor progression.10,26,27
Our data reveal that YTHDF1 is significantly upregulated in OC tissues compared to normal controls, as confirmed through TCGA and GEO datasets and further validated via qPCR, Western blot, and immunohistochemistry. Notably, high YTHDF1 expression correlates with shorter overall survival, emphasizing its potential as a prognostic biomarker. This finding aligns with studies in other cancer types, where YTHDF1 drives oncogenesis by enhancing the translation of critical oncogenic transcripts.9,28 Furthermore, a series of in vitro assays were conducted to assess the biological effects of YTHDF1 on OC. GO and KEGG enrichment analyses indicated its involvement in several tumor-promoting pathways, including the VEGF and HIF-1α axes—pathways closely tied to angiogenesis, hypoxia adaptation, and chemoresistance in OC.29,30 Preliminary mechanistic validation reinforces these associations, positioning YTHDF1 as a pivotal node within OC-associated signaling networks.
Beyond its effect on tumor cell-intrinsic phenotypes, we discovered that YTHDF1 is intricately linked to the tumor immune microenvironment.31 High YTHDF1 expression was associated with altered immune infiltration, characterized by a reduction in CD8⁺ T cells and NK cells and an enrichment of M2a-polarized tumor-associated macrophages. Notably, we also observed that YTHDF1 can be packaged into exosomes, potentially promoting M2a macrophage polarization through a paracrine mechanism, thereby contributing to an immunosuppressive TME. Further analysis of TCGA datasets revealed that elevated YTHDF1 levels correlate with poor response to PD-1 blockade therapy, highlighting its potential as a predictive biomarker for immunotherapeutic outcomes. In vivo evidence further supports the immunomodulatory role of YTHDF1, as its suppression led to increased infiltration of cytotoxic immune cells. In addition to its immunological impact, YTHDF1 appears to play a role in chemotherapeutic resistance. We observed a positive correlation between YTHDF1 expression and IC50 values for DTX, indicating its involvement in reduced chemosensitivity. This aligns with prior evidence indicating that m6A-modified transcript regulation influences drug resistance by modulating mRNA stability and translational efficiency.32,33
Our findings collectively identify YTHDF1 as a multifaceted oncogenic driver in OC, functioning as a promoter of tumor progression and an immunosuppressive microenvironment, as well as a mediator of chemoresistance. These attributes position YTHDF1 as a highly compelling candidate for therapeutic targeting. Inhibiting YTHDF1 could provide dual advantages by curbing tumor growth and boosting the effectiveness of both chemotherapy and immunotherapy.
This study has several limitations. Although our findings suggest that YTHDF1 activates the HIF1α/VEGF pathway and promotes M2a macrophage polarization, the underlying signaling mechanisms remain incompletely understood. Further experiments—such as Methylated RNA Immunoprecipitation qPCR (MeRIP-qPCR), RIP, and RNA-seq—are warranted to clarify these pathways in future studies. In addition, while our results are supported by comprehensive analyses and preliminary validation, further efforts are needed to identify downstream effectors and conduct large-scale clinical studies to fully establish the role of YTHDF1 as a diagnostic and therapeutic biomarker in OC. In particular, validation in larger patient cohorts will help clarify its clinical relevance and potential complementary value within existing biomarker-based diagnostic systems.
Conclusion
In conclusion, this study underscores YTHDF1 as a pivotal oncogenic regulator in OC, critically influencing tumor progression, immune evasion, and therapeutic resistance. Elevated YTHDF1 expression is associated with poor prognosis and reduced responsiveness to both chemotherapy and immunotherapy, emphasizing its potential as a prognostic biomarker and therapeutic target. Targeting YTHDF1 could offer a comprehensive strategy to inhibit tumor growth, reprogram the immunosuppressive TME, and enhance treatment efficacy. Further research is needed to validate the clinical relevance of YTHDF1 in larger patient cohorts and to unravel the molecular mechanisms driving OC pathogenesis.
Data Sharing Statement
Data supporting the findings of this study are available from the corresponding author upon reasonable request.
Ethics Approval and Consent to Participate
This study was approved by the Ethics Committee of Shanghai First Maternity and Infant Hospital and informed consent was obtained from the patients. We declare that all methods are reported in accordance with the declaration of Helsinki. All in vivo experiments were conducted in accordance with the guidelines of the National Institutes of Health for the care and use of laboratory animals and were approved by the Animal Care Committee of Tongji University.
Acknowledgments
We sincerely thank the public databases, including TCGA, GEO, GEPIA, LinkedOmics, TCIA, Kaplan-Meier Plotter, TISCH2 and CPADS database for providing open access.
Author Contributions
All authors made a significant contribution to the work reported, whether that is in the conception, study design, execution, acquisition of data, analysis and interpretation, or in all these areas; took part in drafting, revising or critically reviewing the article; gave final approval of the version to be published; have agreed on the journal to which the article has been submitted; and agree to be accountable for all aspects of the work.
Funding
This research did not receive any specific grant from funding agencies in the Public, Commercial, or Not-for-Profit Sectors.
Disclosure
The authors declare no conflicts of interest in relation to the publication of this paper.
References
1. Sung H, Ferlay J, Siegel RL, et al. Global cancer statistics 2020: GLOBOCAN estimates of incidence and mortality worldwide for 36 cancers in 185 countries. CA Cancer J Clin. 2021;71(3):209–249. doi:10.3322/caac.21660
2. Konstantinopoulos PA, Matulonis UA. Clinical and translational advances in ovarian cancer therapy. Nat Cancer. 2023;4(9):1239–1257. doi:10.1038/s43018-023-00617-9
3. Yin B, Ding J, Liu J, et al. Exosomal CMTM4 induces immunosuppressive macrophages to promote ovarian cancer progression and attenuate anti-PD-1 immunotherapy. Adv Sci;2025. e04436. doi:10.1002/advs.202504436
4. Yin B, Ding J, Hu H, et al. Overexpressed CMTM6 improves prognosis and associated with immune infiltrates of ovarian cancer. Front Mol Biosci. 2022;9:769032. doi:10.3389/fmolb.2022.769032
5. Boussios S, Karihtala P, Moschetta M, et al. Combined strategies with poly (ADP-Ribose) polymerase (PARP) inhibitors for the treatment of ovarian cancer: a literature review. Diagnostics. 2019;9(3):87.
6. Ye M, Chen J, Lu F, et al. Down-regulated FTO and ALKBH5 co-operatively activates FOXO signaling through m6A methylation modification in HK2 mRNA mediated by IGF2BP2 to enhance glycolysis in colorectal cancer. Cell Biosci. 2023;13(1):148. doi:10.1186/s13578-023-01100-9
7. Liu J, Yue Y, Han D, et al. A METTL3-METTL14 complex mediates mammalian nuclear RNA N6-adenosine methylation. Nat Chem Biol. 2014;10(2):93–95. doi:10.1038/nchembio.1432
8. Bao Y, Zhai J, Chen H, et al. Targeting m6 A reader YTHDF1 augments antitumour immunity and boosts anti-PD-1 efficacy in colorectal cancer. Gut. 2023;72(8):1497–1509. doi:10.1136/gutjnl-2022-328845
9. Wang S, Xu L, Wang D, et al. YTHDF1 promotes the osteolytic bone metastasis of breast cancer via inducing EZH2 and CDH11 translation. Cancer Lett. 2024;597:217047. doi:10.1016/j.canlet.2024.217047
10. Lin W, Chen L, Zhang H, et al. Tumor-intrinsic YTHDF1 drives immune evasion and resistance to immune checkpoint inhibitors via promoting MHC-I degradation. Nat Commun. 2023;14(1):265. doi:10.1038/s41467-022-35710-7
11. Wang L, Zhu L, Liang C, et al. Targeting N6-methyladenosine reader YTHDF1 with siRNA boosts antitumor immunity in NASH-HCC by inhibiting EZH2-IL-6 axis. J Hepatol. 2023;79(5):1185–1200. doi:10.1016/j.jhep.2023.06.021
12. Barrett T, Wilhite SE, Ledoux P, et al. NCBI GEO: archive for functional genomics data sets--update. Nucleic Acids Res. 2013;41(Database issue):D991–5. doi:10.1093/nar/gks1193
13. Colaprico A, Silva TC, Olsen C, et al. TCGAbiolinks: an R/Bioconductor package for integrative analysis of TCGA data. Nucleic Acids Res. 2016;44(8):e71. doi:10.1093/nar/gkv1507
14. Chandrashekar DS, Karthikeyan SK, Korla PK, et al. UALCAN: an update to the integrated cancer data analysis platform. Neoplasia. 2022;25:18–27. doi:10.1016/j.neo.2022.01.001
15. Gyorffy B. Integrated analysis of public datasets for the discovery and validation of survival-associated genes in solid tumors. Innovation. 2024;5(3):100625. doi:10.1016/j.xinn.2024.100625
16. Vasaikar SV, Straub P, Wang J, et al. LinkedOmics: analyzing multi-omics data within and across 32 cancer types. Nucleic Acids Res. 2018;46(D1):D956–D963. doi:10.1093/nar/gkx1090
17. Wang YH, Hou H-A, Lin -C-C, et al. A CIBERSORTx-based immune cell scoring system could independently predict the prognosis of patients with myelodysplastic syndromes. Blood Adv. 2021;5(22):4535–4548. doi:10.1182/bloodadvances.2021005141
18. Rauluseviciute I, Riudavets-Puig R, Blanc-Mathieu R, et al. JASPAR 2024: 20th anniversary of the open-access database of transcription factor binding profiles. Nucleic Acids Res. 2024;52(D1):D174–D182. doi:10.1093/nar/gkad1059
19. Nusinow DP, Szpyt J, Ghandi M, et al. Quantitative proteomics of the cancer cell line encyclopedia. Cell. 2020;180(2):387–402e16. doi:10.1016/j.cell.2019.12.023
20. Tang Z, Li C, Kang B, et al. GEPIA: a web server for cancer and normal gene expression profiling and interactive analyses. Nucleic Acids Res. 2017;45(W1):W98–W102. doi:10.1093/nar/gkx247
21. Yang Y, Ye Y-C, Chen Y, et al. Crosstalk between hepatic tumor cells and macrophages via Wnt/beta-catenin signaling promotes M2-like macrophage polarization and reinforces tumor malignant behaviors. Cell Death Dis. 2018;9(8):793. doi:10.1038/s41419-018-0818-0
22. Li W, Wang F, Guo R, et al. Targeting macrophages in hematological malignancies: recent advances and future directions. J Hematol Oncol. 2022;15(1):110. doi:10.1186/s13045-022-01328-x
23. Sanchez-Paulete AR, Mateus-Tique J, Mollaoglu G, et al. Targeting macrophages with CAR T Cells delays solid tumor progression and enhances antitumor immunity. Cancer Immunol Res. 2022;10(11):1354–1369. doi:10.1158/2326-6066.CIR-21-1075
24. Lu T, Zhang Z, Zhang J, et al. CD73 in small extracellular vesicles derived from HNSCC defines tumour-associated immunosuppression mediated by macrophages in the microenvironment. J Extracell Vesicles. 2022;11(5):e12218. doi:10.1002/jev2.12218
25. Wang D, Wang S, Jin M, et al. Hypoxic exosomal circplekhm1-mediated crosstalk between tumor cells and macrophages drives lung cancer metastasis. Adv Sci. 2024;11(22):e2309857. doi:10.1002/advs.202309857
26. Li Q, Ni Y, Zhang L, et al. HIF-1alpha-induced expression of m6A reader YTHDF1 drives hypoxia-induced autophagy and malignancy of hepatocellular carcinoma by promoting ATG2A and ATG14 translation. Signal Transduct Target Ther. 2021;6(1):76. doi:10.1038/s41392-020-00453-8
27. Bai X, Wong CC, Pan Y, et al. Loss of YTHDF1 in gastric tumors restores sensitivity to antitumor immunity by recruiting mature dendritic cells. J Immunother Cancer. 2022;10(2):e003663. doi:10.1136/jitc-2021-003663
28. Zhang S, Guan X, Liu W, et al. YTHDF1 alleviates sepsis by upregulating WWP1 to induce NLRP3 ubiquitination and inhibit caspase-1-dependent pyroptosis. Cell Death Discov. 2022;8(1):244. doi:10.1038/s41420-022-00872-2
29. Yang Y, Zhang Y, Iwamoto H, et al. Discontinuation of anti-VEGF cancer therapy promotes metastasis through a liver revascularization mechanism. Nat Commun. 2016;7(1):12680. doi:10.1038/ncomms12680
30. Infantino V, Santarsiero A, Convertini P, et al. Cancer cell metabolism in hypoxia: role of HIF-1 as key regulator and therapeutic target. Int J Mol Sci. 2021;22(11):5703. doi:10.3390/ijms22115703
31. Vinay DS, Ryan EP, Pawelec G, et al. Immune evasion in cancer: mechanistic basis and therapeutic strategies. Semin Cancer Biol. 2015;35 Suppl(35 Suppl):S185–S198. doi:10.1016/j.semcancer.2015.03.004
32. Lan Q, Liu PY, Bell JL, et al. The emerging roles of RNA m(6)A methylation and demethylation as critical regulators of tumorigenesis, drug sensitivity, and resistance. Cancer Res. 2021;81(13):3431–3440. doi:10.1158/0008-5472.CAN-20-4107
33. Sun Y, Dong D, Xia Y, et al. YTHDF1 promotes breast cancer cell growth, DNA damage repair and chemoresistance. Cell Death Dis. 2022;13(3):230. doi:10.1038/s41419-022-04672-5
 © 2025 The Author(s). This work is published and licensed by Dove Medical Press Limited. The
full terms of this license are available at https://www.dovepress.com/terms
and incorporate the Creative Commons Attribution
- Non Commercial (unported, 4.0) License.
By accessing the work you hereby accept the Terms. Non-commercial uses of the work are permitted
without any further permission from Dove Medical Press Limited, provided the work is properly
attributed. For permission for commercial use of this work, please see paragraphs 4.2 and 5 of our Terms.
© 2025 The Author(s). This work is published and licensed by Dove Medical Press Limited. The
full terms of this license are available at https://www.dovepress.com/terms
and incorporate the Creative Commons Attribution
- Non Commercial (unported, 4.0) License.
By accessing the work you hereby accept the Terms. Non-commercial uses of the work are permitted
without any further permission from Dove Medical Press Limited, provided the work is properly
attributed. For permission for commercial use of this work, please see paragraphs 4.2 and 5 of our Terms.