Back to Journals » Journal of Inflammation Research » Volume 18
Investigating Potential Biomarkers of Ankylosing Spondylitis: A Study on Mitochondrial and Senescence Pathways Using Machine Learning
Authors Yang L ![]() , Chang C, Tam W, Liang Y, Chen M, Zhang J, Li K, Li Y
, Chang C, Tam W, Liang Y, Chen M, Zhang J, Li K, Li Y ![]() , Gong Q
, Gong Q ![]()
Received 26 June 2025
Accepted for publication 11 October 2025
Published 4 November 2025 Volume 2025:18 Pages 15479—15500
DOI https://doi.org/10.2147/JIR.S549917
Checked for plagiarism Yes
Review by Single anonymous peer review
Peer reviewer comments 3
Editor who approved publication: Dr Ujjwol Risal
Lu Yang,1,2,* Chitat Chang,1,* WengFai Tam,3 Yeqi Liang,2 Meiqi Chen,2 Jun Zhang,1 Ke Li,2 Yunhao Li,4 Qiming Gong5,6
1Faculty of Chinese Medicine, Macau University of Science and Technology, Macau, People’s Republic of China; 2Second Clinical Medical College, Guangzhou University of Chinese Medicine, Guangzhou, People’s Republic of China; 3The First Affiliated Clinical Medical College of Guangzhou University of Chinese Medicine, Guangzhou, People’s Republic of China; 4Second Department of Traditional Chinese Medicine, South China Hospital, Medical School, Shenzhen University, Shenzhen, People’s Republic of China; 5Department of Nephrology, Affiliated Hospital of Youjiang Medical University for Nationalities, Baise, People’s Republic of China; 6Key Laboratory of Medical Research Basic Guarantee for Immune-Related Diseases Research of Guangxi, Baise, People’s Republic of China
*These authors contributed equally to this work
Correspondence: Qiming Gong, Department of Nephrology, Affiliated Hospital of Youjiang Medical University for Nationalities, No. 18, Zhongshan 2nd Road, Youjiang District, Baise, Guangxi, 533000, People’s Republic of China, Email [email protected] Yunhao Li, Second Department of Traditional Chinese Medicine, South China Hospital, Medical School, Shenzhen University, No. 1 Fuxin Street, Pinghu Sub-district, Longgang District, Shenzhen, Guangdong, 518116, People’s Republic of China, Email [email protected]
Objective: Ankylosing spondylitis (AS) is a chronic immune-mediated inflammatory disorder characterized by inflammation and pathological bone formation. Growing evidence suggests that mitochondrial dysfunction and cellular senescence are key drivers of disease progression. This study aimed to identify novel biomarkers linking these processes to AS.
Methods: Transcriptomic datasets of AS patients and controls were analyzed to identify differentially expressed genes related to mitochondrial function and cellular senescence. Bioinformatics pipelines and multiple machine learning algorithms were used to screen candidate biomarkers, which were further validated in an independent dataset and in a collagen antibody-induced arthritis (CAIA) mouse model. Clinical diagnostic value was assessed using receiver operating characteristic analysis.
Results: We identified 25 mitochondrial- and 8 senescence-related genes differentially expressed in AS. Consensus machine learning analysis highlighted COX17 and MATK as robust candidates with significant diagnostic performance. Immune infiltration analysis suggested strong correlations between these genes and altered immune cell subsets. In vivo validation confirmed upregulation of COX17 and downregulation of MATK in the AS mouse model, accompanied by enhanced osteogenic activity.
Conclusion: COX17 and MATK are promising biomarkers linking mitochondrial dysfunction and cellular senescence to AS. Their diagnostic potential highlights new avenues for improving early disease detection and personalized therapeutic strategies.
Keywords: ankylosing spondylitis, mitochondrial dysfunction, cellular senescence, machine learning, transcriptomic analysis
Introduction
Ankylosing spondylitis (AS) predominantly affects the synovial and fibrous tissues within the sacroiliac and spinal joints.1 Its pathological features involve inflammatory responses, bone erosion, and pathological new bone formation, which ultimately lead to spinal ankylosis and severely impair physical function. Globally, the prevalence of AS ranges from 0.1% to 1.4%,2 imposing a significant burden on patients’ quality of life as well as considerable socioeconomic costs. In terms of clinical manifestations, AS has typical features such as inflammatory low back pain, morning stiffness, and limited mobility. As the disease progresses to an advanced stage, patients may also develop complications such as spinal deformities, osteoporosis, and extra-articular manifestations.3 Although the use of nonsteroidal anti-inflammatory drugs (NSAIDs) and biologics has significantly improved patient outcomes,4 a subset of patients still experience poor therapeutic response, drug resistance, and uncontrolled disease progression. These findings highlight the critical imperative to advance our understanding of AS pathogenesis.
Accumulating evidence has firmly established that AS pathogenesis involves complex genetic determinants, with the HLA-B27 allele representing the predominant genetic risk factor. A genome-wide association study has identified more than 60 risk loci related to AS.5 While the contributions of HLA-B27-mediated genetic predisposition and Th17-driven inflammation to AS pathogenesis are well-established, emerging research has increasingly implicated dysregulated autoimmune mechanisms as critical drivers of disease initiation and progression.6 Mitochondrial oxidative phosphorylation serves as a fundamental metabolic pathway that critically regulates immune cell functionality, activation, and cellular longevity,7 and different types of mitochondria cooperate with each other in organisms to play complementary functions to maintain the normal physiological function and homeostasis of cells. Mitochondrial dysfunction actively contributes to the pathogenesis and progression of multiple autoimmune disorders.8 Studies have indicated that tofacitinib can treat AS by improving mitochondrial function, thereby maintaining cellular homeostasis and normal function.9 Dysfunctional mitochondria release various damage-associated molecular patterns, with mtDNA and ROS being of particular significance.10 Notably, single nucleotide polymorphisms in the displacement loop region of mtDNA may serve as potential risk biomarkers for AS.11 MtDNA has been shown to activate diverse immune signaling pathways, notably including the NLRP3 inflammasome—a pathway similarly activated during cellular senescence processes. Additionally, ROS are considered potential mediators in the pathogenesis of AS.12 Excessive ROS is a common factor leading to cellular senescence. Mesenchymal stem cells (MSCs) isolated from AS patients demonstrate marked cellular senescence, characterized by cell cycle arrest, decrease of mitochondrial membranes potential, and diminished ATP synthesis capacity. Further investigations demonstrate that the serum milieu in AS promotes mitochondrial impairment in MSCs, resulting in ROS accumulation and premature senescence induction, thereby perpetuating a vicious cycle.13 The interplay between mitochondrial dysfunction and cellular senescence likely represents a key pathogenic mechanism underlying chronic inflammation and tissue fibrosis in AS, offering potential targets for clinical intervention.
Mitochondrial oxidative phosphorylation and immunometabolic regulation have recently been recognized as central processes in autoimmune and rheumatic diseases. Dysregulation of these pathways not only perturbs cellular energy homeostasis but also drives chronic inflammatory responses. In systemic lupus erythematosus (SLE), recent studies have demonstrated that metabolic reprogramming and oxidative stress signatures are tightly linked to disease activity.14 Similarly, in rheumatoid arthritis (RA), fibroblast-like synoviocytes undergo profound metabolic rewiring, including mTOR activation and defective mitochondrial respiration, which promotes synovial inflammation and joint destruction.15 These findings underscore the broad relevance of mitochondrial–metabolic interactions to autoimmune pathogenesis and provide a strong rationale to investigate their role inAS.
Nevertheless, despite therapeutic advances, diagnostic and prognostic tools for AS remain inadequate, and reliable biomarkers for early detection or disease monitoring are still lacking. Current approaches are largely limited to HLA-B27 testing and inflammatory markers, which do not fully capture disease heterogeneity or predict long-term outcomes. This gap highlights the clinical importance of identifying novel biomarkers that integrate mechanistic insight with translational utility, potentially enabling earlier diagnosis, personalized treatment, and improved prognosis.
In addition to HLA-B27, growing evidence suggests that additional genetic factors contribute to AS susceptibility and clinical heterogeneity. For example, recent work has highlighted the GPR35 rs4676410 polymorphism, which is associated with both increased disease risk and greater clinical severity.16 Such findings underscore that the genetic architecture of AS is more complex than previously recognized and that novel susceptibility loci may provide valuable insights into disease mechanisms. Identifying these genetic contributors is therefore essential, not only to refine risk stratification but also to inform biomarker discovery and potential therapeutic targeting.
Machine learning–based integrative models are transforming autoimmune research by enabling systematic analysis of high-dimensional multi-omics data. These methods outperform traditional statistics in uncovering hidden molecular signatures and improving predictive accuracy. For example, recent analyses identified oxidative phosphorylation-related features in SLE using integrated transcriptomics, metabolomics, and machine learning.17 Recent studies have leveraged Mendelian randomization to link plasma protein profiles with SLE susceptibility, highlighting novel candidate biomarkers.18 Beyond lupus, studies have applied machine learning to multi-omics and single-cell data in RA, revealing immune-senescence signatures19 and stratifying immune-metabolic pathways.20 Incorporating such computational strategies into AS research allows us to bridge in silico biomarker discovery with in vivo validation, thereby strengthening the translational relevance of our study.
This study employed bioinformatics data mining to investigate the mechanistic relationship between AS and mitochondrial senescence, and to construct a predictive model for disease progression. We obtained AS-related datasets GSE73754 and GSE25101 from the GEO database and screened for genes associated with mitochondria and senescence. A comprehensive bioinformatics approach was employed to identify AS-associated key genes, incorporating differential expression analysis, WGCNA, functional enrichment analyses, immune cell infiltration profiling, and machine learning algorithms. Based on the identified signature genes, we developed a diagnostic prediction model. The robustness of these molecular markers was subsequently verified through independent external dataset validation and in vivo experimental confirmation. This investigation elucidates the complex regulatory relationship between mitochondria and senescence in AS, while simultaneously identifying promising molecular targets with translational potential for early disease detection, targeted therapeutic intervention, and clinical outcome prediction (Figure 1).
 |
Figure 1 Differential gene expression between AS patients and healthy controls. (A) Volcano plot showing differentially expressed genes. Orange dots indicate significantly upregulated genes, blue dots indicate significantly downregulated genes, and grey dots represent non-significant genes. (B) Heatmap of representative differentially expressed genes. Red indicates higher expression and blue indicates lower expression relative to the mean expression level. |
Materials and Methods
Data Collection and Processing
Gene expression profiles associated with AS were obtained from the GEO database by searching for the keyword “Ankylosing Spondylitis”. The analysis included the GSE25101 dataset (GPL6947 platform), comprising whole blood transcriptomes from 16 AS patients and 16 matched healthy controls. The GSE73754 dataset, based on the GPL10558 platform, comprises whole blood samples from 52 AS patients and 20 healthy controls. These datasets were preprocessed using standard normalization techniques and batch effect correction to ensure data consistency and comparability across platforms. The GSE73754 dataset served as the training cohort, while the GSE25101 dataset was utilized for independent validation. Mitochondria-associated genes were curated from MitoCarta 3.0, and senescence-related genes were extracted from the CellAge database.
Differential Expression Analysis
The DEGs between AS patients and healthy controls were identified through comparative analysis of the GSE73754 transcriptomic dataset using the “limma” package. Statistical significance thresholds were set at an adjusted p-value < 0.05 with |log2 FC| > 1.2 to ensure robust differential
Construction and Visualization of WGCNA Modules
Data preprocessing was first performed, including hierarchical clustering of samples using the hclust function to identify and remove outliers. Gene filtering was performed using the “goodSamplesGenes” function to remove outliers and poorly expressed genes. The optimal soft-thresholding power (β) was determined through the “pickSoftThreshold” function to achieve scale-free topology of the network while maintaining adequate mean connectivity. The optimal soft threshold was selected to approximate a scale-free network distribution, ensuring biologically meaningful module detection. A weighted adjacency matrix was constructed to establish gene co-expression relationships, followed by hierarchical clustering using topological overlap matrix (TOM)-based dissimilarity measures. Dynamic tree cutting was then applied to delineate distinct co-expression modules. Module-trait associations were assessed by computing Pearson correlation coefficients between module eigengenes (MEs) and clinical phenotypes, with key functional modules identified based on both correlation magnitude and statistical significance. Modules that showed a statistically significant association with the disease status of AS were selected for further analysis as AS-related modules.
Identification of Intersection Genes via Venn Analysis
Using the “VennDiagram” package in R, Venn diagrams were generated to identify the overlapping genes among WGCNA modules, genome-wide DEGs, and mitochondrial-related gene sets. The intersected genes were defined as mitochondrial-associated DEGs. A similar approach was applied to identify senescence-related DEGs by intersecting WGCNA modules, DEGs, and senescence-related gene sets.
GO and KEGG Pathway Enrichment Analysis
Functional annotation of gene sets was conducted using the “ClusterProfiler” package in R, incorporating comprehensive Gene Ontology (GO) term analysis and Kyoto Encyclopedia of Genes and Genomes (KEGG) pathway enrichment. All enrichment analyses (GO, KEGG) and gene selection procedures applied FDR adjustment to control for multiple testing. Statistical significance thresholds were established at adjusted P-value < 0.05 with FDR correction < 0.05 to ensure robust biological interpretation.
Mitochondrial and Senescence Phenotype Scoring
Phenotypic activity quantification was performed through ssGSEA implemented in the “GSVA” R package, enabling systematic computation of mitochondrial and cellular senescence scores derived from DEGs. Phenotypic scores for mitochondrial function and cellular senescence were derived from the difference DEGs. Comparative analyses were performed between ankylosing spondylitis patients and healthy controls by calculating the sum of the weighted expression values of all the genes in each gene set in order to assess the phenotypic differences. Statistical significance was evaluated by using Wilcoxon’s rank test, and binary associations were examined by Pearson’s correlation analysis to elucidate the mitochondrial-senescence potential interrelationships between mitochondrial and senescence phenotypes.
Immune Infiltration and Model Validation
The GSEA algorithm from the “GSEA” package was utilized to assess immune infiltration. The analytical algorithm processes the gene expression matrix in conjunction with predefined immune-related gene sets by first ranking gene expression values for individual samples. Subsequently, it computes enrichment scores through assessment of the deviation in cumulative distribution for each gene set within the ranked expression profile. This allows for the evaluation of the activity of specific immune cell types or immune-related pathways in each sample. The differences and correlations of immune infiltration between the two gene sets of “Mito” and “Senescence” were analyzed, and the potential relationship between the two genes was obtained.
Optimization of Candidate Genes Based on Machine Learning Algorithms
To identify the most biologically relevant candidate genes, we employed a tripartite machine learning approach comprising LASSO regression, SVM-RFE, and RF algorithms. The LASSO method utilizes L1 regularization to penalize regression coefficients, thereby fitting a generalized linear model and enabling feature selection by shrinking some coefficients to zero. SVM-RFE is a supervised learning technique that finds the optimal feature subset by iteratively eliminating feature vectors, and adopts 10-fold cross-validation. RF evaluates variable importance by constructing multiple decision trees and aggregating their predictions. Genes identified by the intersection of the three machine learning algorithms were considered potential biomarkers for AS.
SHAP Value Interpretation of Gene Contributions
To systematically evaluate the pathogenic role of candidate genes in AS, we implemented a rigorous validation framework by partitioning the dataset into training (70%) and validation (30%) subsets. With a background dataset size of 72, after data splitting, we performed computations to generate both global and local explanation plots for visualization of gene contributions. For the key genes screened, the distribution trend of characteristic SHAP values can be observed through the bee colony diagram. Gene importance was quantified using bar plots based on the mean absolute SHAP values. Dependence plots revealed the nonlinear relationships between individual genes and model predictions. Waterfall plots decomposed the contributions for single samples, illustrating their cumulative impact pathways. Force plots dynamically displayed the direction and magnitude of each feature’s effect within individual samples.
Differential Expression and ROC Analysis in the Validation Set
To rigorously validate the expression profiles and diagnostic efficacy of the identified key genes, we performed differential expression analysis using the Wilcoxon rank-sum test on the training cohort (GSE73754 dataset). Subsequently, ROC curve analysis was conducted via the “pROC” package in R, with the AUC serving as a quantitative metric for diagnostic performance assessment. Notably, AUC values approaching 1 signify optimal discriminative capacity.
Experimental Animals
Twelve 8-week-old male SPF-grade BALB/c mice (20 ± 2 g) were acquired from Guangzhou Biolenergy Co., Ltd. (License No. 4482970012174). All animal experiments were reviewed and approved by the Experimental Animal Ethics Committee of Guangdong Provincial Hospital of Traditional Chinese Medicine (Approval No. 2022025) and supervised by the Institutional Animal Care and Use Committee of Guangdong Provincial Hospital of Traditional Chinese Medicine. All procedures were conducted in accordance with the National Institutes of Health Guide for the Care and Use of Laboratory Animals and the ARRIVE guidelines.
Experimental Reagents
Arthrogen-CIA® 5-Clone Cocktail Kit (Chondrex, Cat. No. 53100), Biotinylated Lipopolysaccharide from E. coli O111 (Chondrex, Cat. No. 9028), EDTA decalcifying solution (Macklin, Cat. No. 5868153), 10% paraformaldehyde (Biosharp, Cat. No. 143174), anhydrous ethanol (Guangzhou Chemical, Cat. No. HB15), xylene (Guangzhou Chemical, Cat. No. IC02), H&E staining solution (Biosharp, Cat. No. 521930), neutral balsam (Guangzhou Jingxin Biotechnology Co., Ltd., Cat. No. JX0287), Safranin O-Fast Green staining kit for bone tissue (ABCbio, Cat. No. ABC1071-100ML), RIPA lysis buffer (Boster, Cat. No. AR0102), 50× cocktail (Servicebio, Cat. No. G2006-250UL), PMSF (100 mM) (Beyotime, Cat. No. ST507-10ML), BCA protein assay kit (Beyotime, Cat. No. P0010), phosphatase inhibitor cocktail (Thermo, Cat. No. G2007-1ML), 5× reducing loading buffer (YEASEN, Cat. No. 20315ES05), SDS-PAGE gel preparation kit (Servicebio, Cat. No. G2003-50T), PVDF membrane 0.45 μm (Millipore, Cat. No. 10512), skim milk powder (CST, Cat. No. 9999S), TWEEN 20 (Haibo Bio, Cat. No. 140778), ECL chemiluminescent detection kit (Beyotime, Cat. No. P0018M), 10× transfer buffer (Bio-Rad, Cat. No. 10026938), 10× electrophoresis buffer (Bio-Rad, Cat. No. 1632111), TBS buffer (Biosharp, Cat. No. 243175), tissue RNA extraction kit (EZBioscience, Cat. No. EZB-RN001-plus), HiScript III RT SuperMix for qPCR (+gDNA wiper) (Vazyme, Cat. No. R323-01), ChamQ SYBR qPCR Master Mix (Vazyme, Cat. No. Q341-02), COX17 primary antibody, MATK primary antibody (Abmart), and Mouse Premixed Multi-Analyte Kit (Luminex, Cat. No. LXSAMSM-03).
Model Construction
The CAIA+LPS protocol was applied to establish arthritis, which reliably induces immune activation, joint inflammation, and pathological new bone formation, thereby mimicking key features of ankylosing spondylitis. This model has also been adopted in recent studies investigating mechanisms of pathological ossification.21,22
Following a week of acclimatization, the mice were randomly assigned to either the control group (n=6) or the model group (n=6). The AS model was received a tail vein injection of Arthrogen CIA® 5-Clone Cocktail Kit at a dose of 2 mg/kg (Chondrex, Cat. No. 53100), followed by an intraperitoneal injection of 50 μg/mouse of biotinylated lipopolysaccharide (Chondrex, Cat. No. 9028) on day 7 to induce the AS model. The control group was injected with an equal volume of normal saline. The experiment was continued for 56 days to induce pathological bone formation.
Mice in the control group were gavaged twice daily with 0.4 mL of normal saline. The model group received the same gavage regimen. On day 56, after the final treatment, mice were fasted and water-deprived for 12 hours prior to sacrifice. The left hind limb was harvested and fixed in 10% paraformaldehyde for micro-CT analysis, followed by decalcification in EDTA solution for 3 weeks, and subsequently embedded and sectioned for histopathological evaluation. The right hind limb was equally divided into two portions: one portion was placed into a cryovial containing 1 mL of RNA preservation solution, and the other into an empty cryovial.
Assessment of Joint Swelling and AI Scoring
A reference point was established 0.5 cm distal to the ankle joint before model induction. A vernier caliper was used to measure both the width and thickness at the marked site to establish a baseline. After model initiation, joint swelling was assessed weekly by measuring at the same anatomical location using the same method.
Micro-CT Analysis
On day 56 post-model induction, mice were fasted from food and water for 12 hours. The left hind limb was harvested, soft tissue was carefully removed, and the samples were fixed in 10% paraformaldehyde. A desktop micro-CT system was employed to scan the left hind limb. Cross-sectional analysis was performed using CT Vox software, three-dimensional reconstruction was conducted using NRecon software.
H&E Staining and Histopathological Staining
Following micro-CT analysis, the left hind limb was decalcified in 20 volumes of EDTA decalcification solution for three weeks. Following complete decalcification, tissue specimens were processed through paraffin embedding and sectioned. Sequential histological staining with H&E and Safranin O-Fast Green was then conducted to systematically evaluate osseous tissue pathology.
Western Blot and RT-qPCR
Using RIPA lysis buffer, proteins were extracted from homogenized mouse joint tissues, with total protein concentration quantified via the BCA assay. Equal amounts of protein samples were separated by SDS-PAGE and transferred to PVDF membranes under constant current. After blocking with 5% non-fat milk, the membranes were incubated overnight at 4 °C with primary antibodies (diluted 1:1000). Following three washes with TBST, the membranes were exposed to secondary antibodies at room temperature for a duration of 2 hours. Protein signals were developed using ECL substrate and quantified by densitometric analysis with ImageJ software. The complete uncut gel and blot images from three independent repetitions are provided in the Supplementary Materials.
Joint tissue specimens were used to isolate total RNA with an RNA extraction kit. After assessing RNA purity and concentration, reverse transcription was performed to synthesize complementary DNA. Quantitative real-time PCR analysis was subsequently carried out to determine the transcriptional levels of β-actin, COX17, and MATK. Relative mRNA expression was calculated using the 2-ΔΔCt method, with primer sequences detailed in Table 1.
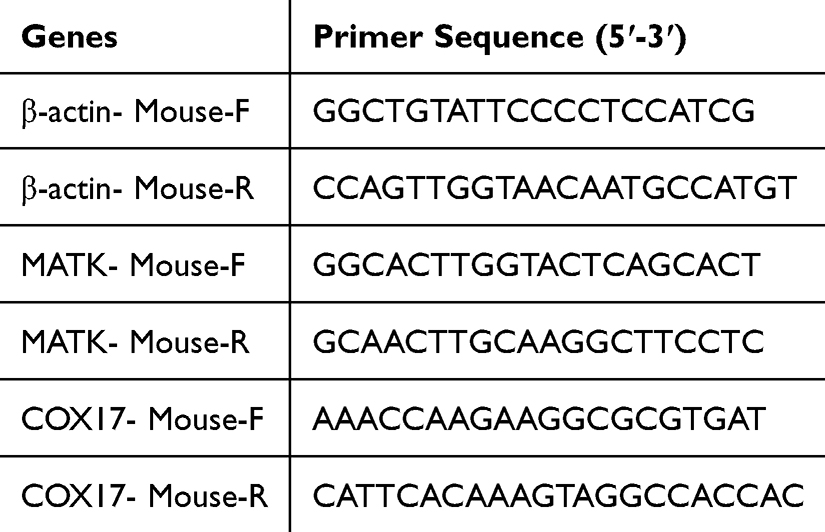 |
Table 1 Primer Sequences Used for Rat Target Genes |
Statistical Analysis
All statistical analyses were conducted using SPSS software (version 24.0), while data visualization and processing were performed with GraphPad Prism (version 9.5.1). For comparisons involving multiple experimental groups, one-way analysis of variance (ANOVA) was employed. A p-value < 0.05 was considered statistically significant.
Results
Identification of AS-Related DEGs
Comparative transcriptomic analysis revealed 2249 statistically significant DEGs between AS patients and healthy controls, comprising 943 upregulated and 1306 downregulated transcripts (Figure 1).
Construction of WGCNA
To further explore the co-expression network of DEGs, WGCNA was applied to cluster the 2249 DEGs. Based on scale-free topology criteria, a soft-threshold power of 8 was selected to construct a scale-free network and generate a gene co-expression adjacency matrix. Application of the dynamic tree cutting algorithm enabled the consolidation of co-expression modules with similar transcriptional profiles, yielding 10 discrete gene clusters that were assigned unique color designations. Notably, module-trait relationship analysis revealed significant associations with the AS phenotype: the MEpink (r = −0.37, P = 0.002) and MEturquoise (r = −0.37, P = 0.001) modules demonstrated inverse correlations, while the MEbrown module showed strong positive association (r = 0.55, P = 6e-07). Scatter plots demonstrated that genes within these three modules were significantly associated with AS. Consequently, the pink, turquoise, and brown modules were identified as key modules related to AS. Genes within these three modules were combined, yielding a total of 150 genes defined as key regulatory genes in AS (Figure 2).
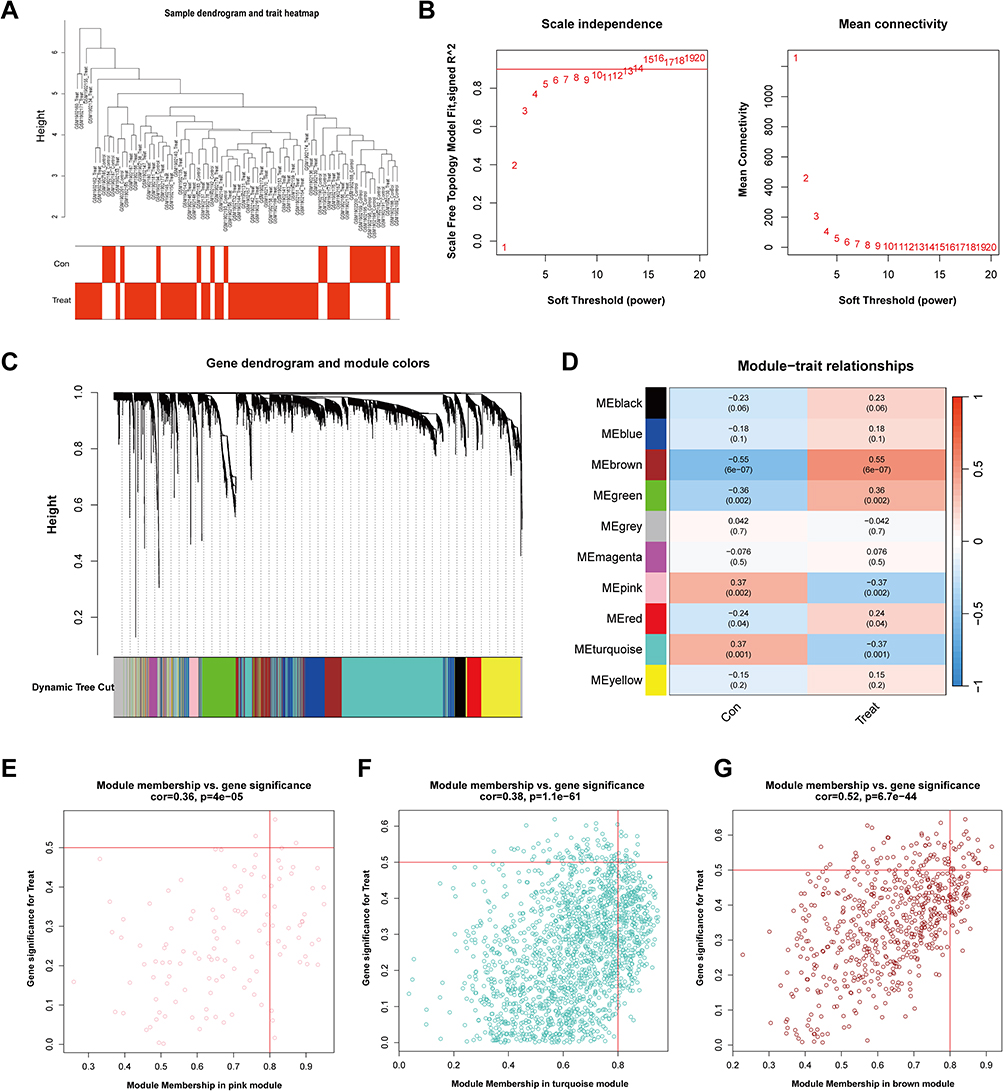 |
Figure 2 WGCNA of AS and control samples. (A) Sample clustering dendrogram and trait heatmap (red = AS, white = control). (B) Scale Independence (left) and mean connectivity (right) for different soft-thresholding powers. (C) Gene dendrogram with module colors; each color represents a distinct module. (D) Module–trait relationships, showing correlation coefficients and p-values; the color scale indicates negative to positive correlations. (E–G) Module membership vs gene significance scatterplots for the pink, turquoise, and brown modules. Dots represent genes; red lines mark significance thresholds. |
Screening of Mitochondrial Metabolism- and Senescence-Related DEGs in AS
Integrative analysis of DEGs, weighted gene co-expression network analysis (WGCNA) module genes, and mitochondrial-senescence-associated gene sets revealed 25 AS-Mito DEGs (Figure 3A) and 8 AS-Senescence DEGs (Figure 3B). These candidate genes exhibited marked differential expression between AS patients and healthy controls (P < 0.01), implicating coordinated mitochondrial impairment and cellular senescence dysregulation as potentially drivers of AS pathogenesis and disease progression.
 |
Figure 3 Identification of candidate genes. (A) Venn diagram showing the intersection of WGCNA module genes, DEGs, and mitochondria-related genes. (B) Venn diagram showing the intersection of WGCNA module genes, DEGs, and senescence-related genes. (C) Expression levels of AS–mitochondria DEGs in control (blue) and AS (red) groups. (D) Expression levels of AS–senescence DEGs in control (blue) and AS (red) groups. ***p < 0.001 compared with control group. |
Functional Enrichment Analysis of DEGs
Functional Enrichment Analysis of AS-Mito DEGs
The analysis revealed 87 significantly enriched GO terms, distributed as follows: 41 biological processes (BP), 16 molecular functions (MF), and 30 cellular components (CC) (Figure 4A). These terms were mainly enriched in processes such as cellular respiration, electron transport chain, mitochondrial inner membrane, precursor metabolite generation, and energy production, closely related to mitochondrial energy metabolism and protein synthesis functions. KEGG pathway analysis revealed significant enrichment in aerobic respiration, oxidative phosphorylation, ATP metabolic processes, and proton transmembrane transport, all involved in energy metabolism (Figure 4B).
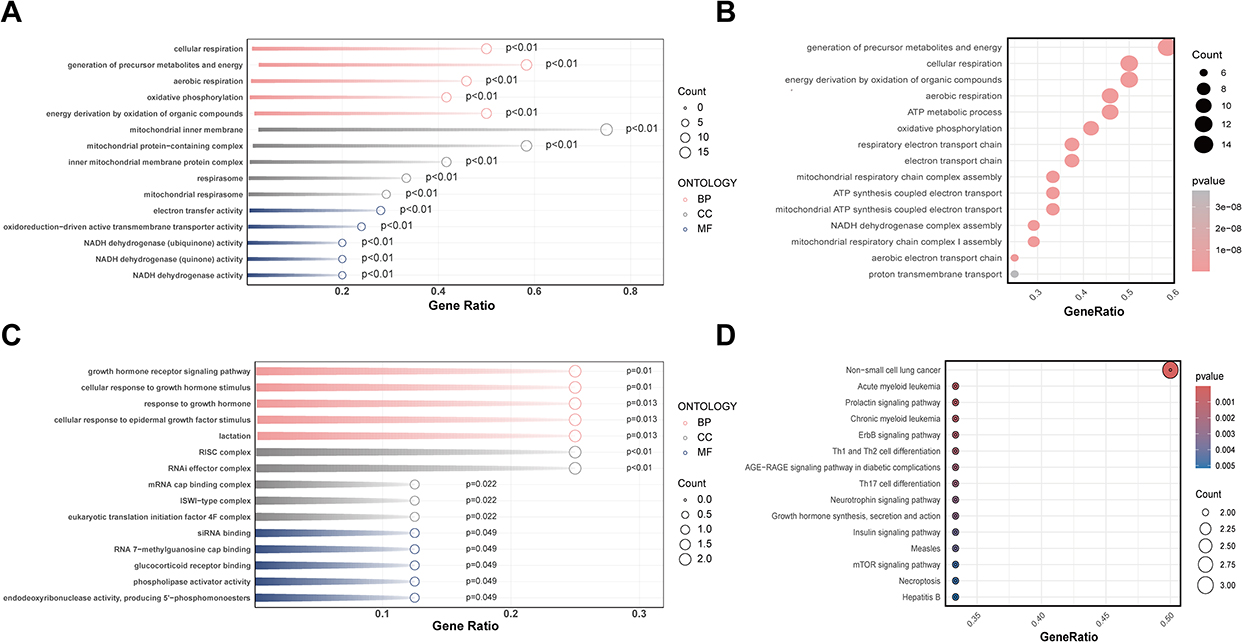 |
Figure 4 Functional enrichment analysis of AS-related mitochondrial and aging genes. (A) GO enrichment bubble plot of AS–mitochondria DEGs. (B) KEGG pathway enrichment bubble plot of AS–mitochondria DEGs. (C) GO enrichment bubble plot of AS–aging DEGs. (D) KEGG pathway enrichment bubble plot of AS–aging DEGs. Abbreviations: BP, biological process; CC, cellular component; MF, molecular function. |
Functional Enrichment Analysis of AS-Senescence DEGs
GO enrichment analysis of senescence-related DEGs yielded 43 significant terms, including 23 BP, 10 MF, and 10 CC categories (Figure 4C). The enriched terms mainly involved growth hormone receptor signaling pathway, glucocorticoid receptor binding, phospholipase activator activity, and deoxyribonuclease activity, closely associated with cell signaling, protein degradation regulation, growth, and apoptosis. KEGG pathway analysis showed significant enrichment in pathways such as ErbB signaling pathway, acute myeloid leukemia, Th1 and Th2 cell differentiation, and growth hormone synthesis, implicating DNA repair, and cellular stress responses (Figure 4D).
Phenotypic Scoring of Mitochondrial and Senescence Signatures
Comparative pathway analysis revealed distinct dysregulation patterns between AS patients and healthy controls (Figure 5). The mitochondrial-related gene set exhibited significantly reduced enrichment scores in the AS cohort, whereas the senescence-associated gene set showed pronounced elevation. Further correlation analysis demonstrated a significant negative correlation between the mitochondrial gene set and the senescence gene set (R = −0.72, p = 5.1e-09).
 |
Figure 5 Phenotypic scoring of mitochondria- and aging-related pathways. (A) Boxplots showing GSVA scores of mitochondrial- and aging-related gene sets between control and AS groups. (B) Correlation analysis between mitochondrial and aging gene set scores. ***p < 0.001 compared with control group. |
AS Immune Cell Infiltration Analysis
As shown in Figure 6A–C, ssGSEA of immune cell infiltration patterns demonstrated distinct leukocyte profiles between AS patients and controls. Quantitative comparison of 28 immune subsets revealed significant elevation in AS samples for central memory CD8+ T cells, activated dendritic cells, CD56bright NK cells, neutrophils, and pDCs. Conversely, decreased infiltration was observed for activated CD8+ T cells, effector memory CD8+ T cells, Th2 cells, and CD56dim NK cells.
 |
Figure 6 Immune infiltration analysis. (A) Differences in immune cell infiltration levels between AS patients and healthy controls. (B) Correlation coefficients between immune cell infiltration and mitochondrial-related genes. (C) Correlation coefficients between immune cell infiltration and aging-related genes. (D–L) Correlation analysis between representative mitochondrial genes and the infiltration levels of nine immune cell types. *p < 0.05 compared with control group; **p < 0.01 compared with control group; ***p < 0.001 compared with control group. |
We systematically investigated the regulatory interplay between immune cell infiltration patterns and the expression of mitochondrial- and senescence-associated genes. Mitochondrial gene expression correlated significantly with infiltration levels of nine immune cell types: five showed positive correlations, and four showed negative correlations (P < 0.05). Notably, activated CD4+ T cells and activated B cells demonstrated significant positive correlations with mitochondrial marker genes (Figure 6D–H), whereas neutrophils and activated dendritic cells exhibited negative correlations (Figure 6I–L).
Senescence-related genes demonstrated statistically significant associations (P < 0.05) with the infiltration levels of eleven distinct immune cell populations. Among these, eight leukocyte subsets exhibited positive correlations, including neutrophils, activated dendritic cells, and central memory CD8+ T cells, suggesting potential senescence-mediated recruitment or activation. Conversely, three lymphocyte populations showed negative correlations: activated B cells, immature B cells, and activated CD4+ T cells. Collectively, these results implicate immune cell infiltration as a pivotal driver of AS pathogenesis, likely facilitated through dysregulated mitochondrial metabolism and accelerated cellular senescence.
Selection of Core Genes in Ankylosing Spondylitis
To refine the selection of pivotal genes from 33 mitochondria- and immune-related candidates, we implemented a tripartite machine learning approach comprising LASSO regression, RF, and SVM-RFE. The LASSO algorithm was first applied to analyze the expression patterns of all 33 candidate genes (Figure 7A), showing significant coefficient changes across different Log Lambda values. The lambda minimizing cross-validation error was selected, ultimately identifying 9 characteristic genes. Random Forest screening yielded 12 genes with importance scores greater than 0.9 (Figure 7B and C). SVM-RFE evaluated model performance across different feature subsets, with the model incorporating the top 7 variables achieving near-minimal root mean square error and highest accuracy (Figure 7D and E). The intersection of genes selected by all three algorithms revealed three common core genes: COX17, MATK, and STAT5A (Figure 7F).
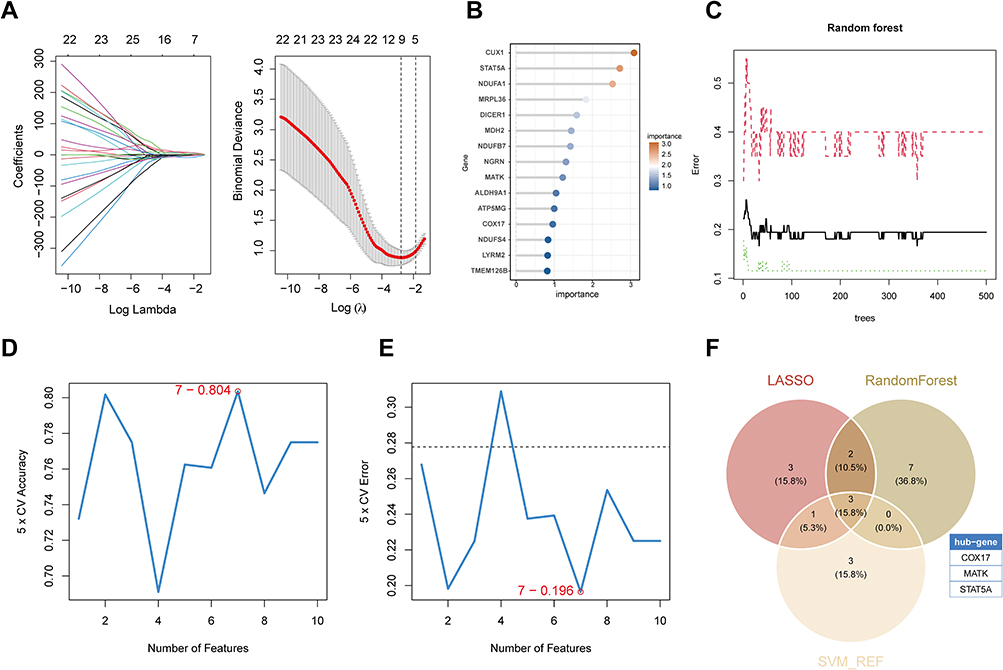 |
Figure 7 Feature gene selection using machine learning algorithms. (A) LASSO regression analysis showing coefficient profiles (left) and binomial deviance plot (right). (B) Variable importance ranking of candidate genes in the Random Forest model. (C) Error rate curves for the Random Forest model. (D) Five-fold cross-validation (CV) accuracy curve for the SVM-RFE algorithm. (E) Five-fold CV error curve for the SVM-RFE algorithm. (F) Venn diagram showing overlapping feature genes identified by LASSO, Random Forest, and SVM-RFE algorithms. |
SHAP Model Analysis of Key Gene Importance
In this study, we conducted SHAP analysis on the key genes COX17, MATK, and STAT5A. The GSE73754 dataset underwent random partitioning into a training set and a testing set, adhering to a 7:3 ratio. Subsequently, ten distinct machine learning algorithms were employed to assess the diagnostic performance of the models, as gauged by the ROC curve. The results showed that the Decision Tree Stump (DTS) model had the lowest AUC value of 0.750. Since the ROC AUC values of the other models were all greater than 0.8, we selected the DTS model to construct the SHAP model (Figure 8A). A bar plot was used to display the importance of COX17, MATK, and STAT5A (Figure 8B). The variable importance beeswarm plot further illustrated the impact of these genes on the prediction outcomes (Figure 8C). The dependence plots revealed that as the expression value of STAT5A increased, its SHAP importance value also increased, whereas COX17 and MATK showed the opposite trend (Figure 8D). The SHAP value waterfall plot provided further validation of these results, illustrating how individual features contribute to model predictions. In this visualization, E[f(x)] denotes the expected model output when no feature information is incorporated, while the final prediction f(x) for each sample is derived by cumulatively adding the SHAP values of all features to this baseline value (Figure 8E).
 |
Figure 8 Machine learning model performance and SHAP interpretability analysis. (A) ROC curves of seven machine learning models for diagnostic prediction including PLS, RF, DTS, SVM, Logistic Regression, KNN and XGBoost. (B) Mean SHAP values ranking the importance of COX17, STAT5A, and MATK. (C) SHAP summary plots showing the distribution of feature contributions. (D) SHAP dependence plots illustrating feature interactions among COX17, STAT5A, and MATK. (E) SHAP waterfall plot showing the contribution of each feature to the model output. |
Validation and Diagnostic Performance Evaluation of Core AS Feature Genes
In our study, we meticulously examined the expression levels between AS patients and healthy controls (Figure 9A–C). COX17 demonstrated significant upregulation in AS samples compared to controls, whereas MATK expression was markedly reduced. No statistically significant differential expression was observed for STAT5A. Further ROC analysis evaluated the diagnostic performance of COX17, MATK, and STAT5A. COX17 showed diagnostic performance with an AUC of 0.719 (95% CI: 0.520–0.888), while MATK achieved an AUC of 0.719 (95% CI: 0.500–0.908). In comparison, STAT5A exhibited a lower diagnostic value with an AUC of 0.668 (95% CI: 0.454–0.867). These results indicate that COX17 and MATK possess certain diagnostic potential to distinguish AS patients from healthy controls (Figure 9D–F).
 |
Figure 9 Validation of candidate biomarkers. (A–C) Expression levels of COX17, MATK, and STAT5A in AS patients versus healthy controls. (D–F) ROC curve analysis showing the diagnostic performance of COX17, MATK and STAT5A. *p < 0.05 compared with control group. Abbreviation: ns, not significant. |
General Observations in AS Model Mice
As illustrated in Figure 10, CAIA model mice displayed significant manifestations relative to controls within 72 hours post-induction, including reduced body mass, marked paw edema, behavioral hypoactivity, and decreased nutritional intake. Joint swelling increased, peaking on day 9, accompanied by decreased mobility. Over time, inflammation subsided, body weight gradually recovered (P < 0.05), and joint swelling significantly alleviated (P < 0.01). Assessment revealed significantly higher arthritis index (AI) scores in the disease model group relative to control animals (P < 0.01).
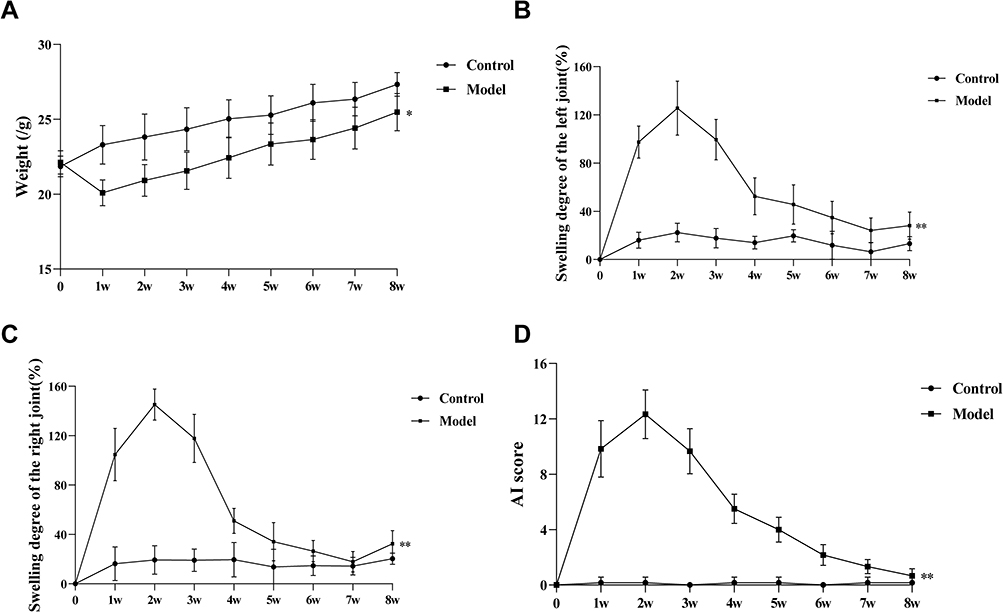 |
Figure 10 Evaluation of body weight, joint swelling, and arthritis index. (A) Body weight changes during the 8-week experiment. (B) Swelling degree of the left joint in each group. (C) Swelling degree of the right joint in each group. (D) Total AI score in each group. *p < 0.05 compared with control group; **p < 0.01 compared with control group. |
Pathological Evaluation of AS Model Mice
As shown in Figure 11, Micro-CT analysis demonstrated distinct ectopic new bone formation at the tendon-bone junctions of the tarsal and phalangeal bones in the model group compared to controls, along with bone erosion within the bone marrow cavity. H&E staining further demonstrated thickening of the tarsal and metatarsal bones and their articular surfaces. Safranin O-fast green staining indicated that the primitive ligament tissues attached to the bone and joint surfaces had differentiated into red-stained bone and cartilage tissues, indicative of pathological ossification.
 |
Figure 11 Micro-CT and histology of hind-limb joints. (A) Representative micro-CT 3D reconstructions and cross-sections. (B) HE and Masson staining. Abbreviations: NB, new bone; CB, cortical bone. |
Expression of Osteogenic Factors in AS Model Mice
As shown in Figure 12, Western blot analysis revealed significantly elevated protein expression of RUNX2, OPN, and SOX9 in the paw tissues of model mice compared to controls (P < 0.01), suggesting an active pathological ossification process.
 |
Figure 12 Expression of osteogenic markers in control and CAIA model mice. (A) Representative Western blot analysis of OPN, RUNX2, and SOX9 protein expression, with β-actin as a loading control. (B) Quantification of protein expression relative to β-actin. *p < 0.05 compared with control group; **p < 0.01 compared with control group. |
Functional Validation of AS Marker Genes
As shown in Figure 13, to further verify the reliability of the two potential biomarkers, To quantify the expression of COX17 and MATK proteins in the ankle joints of AS model mice, we performed Western blot analysis on synovial tissue lysates. Comparative analysis revealed a significant upregulation of COX17 expression coupled with marked downregulation of MATK in the AS model group relative to healthy controls (P < 0.01). Consistently, PCR analysis of gene expression levels demonstrated similar trends for COX17 and MATK (P < 0.05 and P < 0.01).
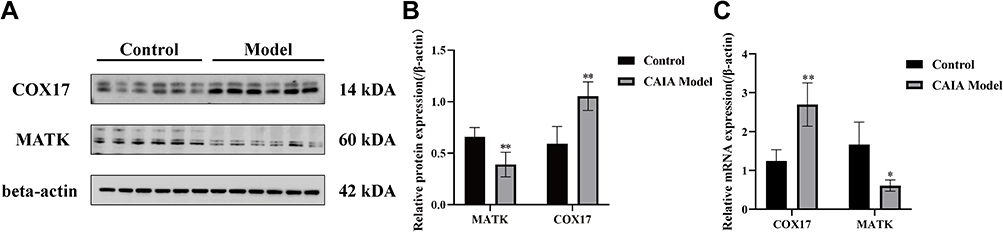 |
Figure 13 Validation of COX17 and MATK expression in control and CAIA model mice. (A) Representative Western blot analysis of COX17 and MATK protein expression, with β-actin as a loading control. (B) Quantification of relative protein expression. (C) Relative mRNA expression of COX17 and MATK. *p < 0.05 compared with control group; **p < 0.01 compared with control group. |
Discussion
AS is a widely recognized autoimmune disorder that is highly inheritable, primarily affecting the spine and pelvis.23 It also involves peripheral joints and certain extra-articular organs. The pathogenesis of AS involves a complex interplay of genetic susceptibility, immune system dysfunction, and environmental factors, the precise mechanisms of which have not been fully elucidated. Contemporary advances in bioinformatics methodologies have facilitated the application of integrated multi-omics analyses and machine learning algorithms as innovative strategies for the identification of potential disease biomarkers and molecular therapeutic targets.24 Mitochondrial dysfunction and cellular senescence have attracted increasing attention in the pathogenesis of AS, offering new perspectives to understand disease progression. Therefore, this study aimed to explore novel therapeutic targets for AS from the mitochondrial-senescence axis using machine learning techniques.
Comparative transcriptomic analysis of peripheral blood samples from the GSE73754 dataset revealed 943 significantly upregulated and 1306 downregulated genes in AS patients relative to matched healthy controls. WGCNA analysis of these 2249 DEGs revealed three significantly correlated modules: MEpink, MEturquoise, and MEbrown, which were merged to yield 150 key AS regulatory genes. Further intersection of these genes with mitochondrial- and senescence-related gene sets was conducted, followed by GO and KEGG enrichment analyses. GSVA enrichment scores demonstrated that, relative to controls, AS samples exhibited significantly decreased mitochondrial gene set scores and increased senescence scores, with a significant negative correlation between the two. These findings suggest that mitochondrial dysfunction and altered expression of senescence-associated genes jointly participate in AS pathogenesis.
Mitochondria serve as the cell’s energy factories, and their dysfunction impairs normal cellular physiology. Studies indicate that peripheral blood mononuclear cells from patients with AS exhibit substantially higher mtDNA mutation frequencies compared to healthy controls, suggesting impaired mitochondrial genomic maintenance in AS pathogenesis.25 Aberrant mitochondrial dynamics can induce Th17 polarization, exacerbating spinal inflammation.26 Current research indicates that mitochondrial dysfunction triggered by oxidative stress significantly contributes to the accelerated senescence of MSCs in patients with AS. Considering the critical biological functions of MSCs in maintaining tissue homeostasis through regenerative capacity and immunomodulatory effects, their premature senescence may significantly impair tissue repair mechanisms while simultaneously exacerbating pro-inflammatory responses, ultimately contributing to disease progression. Furthermore, mitochondrial dysfunction may establish a pathogenic feedback loop by activating multiple intracellular signaling cascades that perpetuate both cellular senescence and chronic inflammatory states.27 Cellular senescence, a process of progressive functional decline, is closely associated with various chronic diseases. Some studies have reported that altered expression of specific genes may affect mitochondrial function and cellular senescence, thereby influencing AS development. For instance, WNT16 is highly expressed in primary osteoprogenitor cells from AS patients, promoting senescence during osteoblast differentiation while inhibiting bone formation, potentially contributing to bone loss in AS.28 ALKBH5 mitigates MSC senescence and improves mitochondrial function through m6A demethylation, thereby delaying osteoarthritis progression.29 Consistent with our current results demonstrating an inverse association between mitochondrial function scores and AS status, coupled with a positive correlation with senescence indices, these findings underscore the need for deeper mechanistic exploration of mitochondrial-senescence crosstalk in AS pathogenesis.
Immune cell infiltration differences between AS and controls were assessed using ssGSEA across 28 immune cell populations. Compared with controls, AS patients showed significantly increased infiltration of central memory CD8+ T cells, activated dendritic cells, CD56+ NK cells, and others, while activated CD8+ T cells, effector memory CD8+ T cells, and CD56- NK cells were significantly decreased. GSEA of mitochondrial gene-associated samples demonstrated significant positive associations of mitochondrial-related genes with activated CD4+ T cells and B cells, whereas inverse correlations were observed with neutrophil infiltration and activated dendritic cell populations. GSEA of senescence-associated gene signatures revealed significant positive correlations with neutrophils, activated dendritic cells, and central memory CD8+ T cells, while showing inverse relationships with activated B cells, immature B cells, and activated CD4+ T cells. Notably, therapeutic CD8+ T cell receptor clonotypes have been identified in both peripheral blood and synovial fluid compartments of AS patients and those with related autoimmune disorders.30 Dendritic cells, key immune sentinels, are critical in initiating and regulating immune responses. Human CD1c+ DCs can induce Th1 and Th2 responses, their decreased numbers in AS peripheral blood may trigger Th17-mediated immunity, contributing to AS pathology.31 The close relationship between mitochondria, senescence, and immune cells further supports their involvement in AS.
To assess the diagnostic potential of mitochondria- and senescence-associated genes in AS, three key genes COX17, MATK, and STAT5A were selected using LASSO regression, SVM-RFE, and Random Forest algorithms. SHAP modeling and ROC curve analyses demonstrated that COX17 and MATK exhibited robust diagnostic performance in discriminating AS from controls. The diagnostic performance of COX17 and MATK should be regarded as preliminary evidence. While these values indicate modest accuracy, they provide an important foundation for future development of multi-marker diagnostic panels.
Functional validation using a CAIA mouse model confirmed model effectiveness by observing joint swelling, ectopic bone formation, and increased expression of bone mineralization factors RUNX2 and OPN. RT-qPCR and WB analyses showed significantly elevated COX17 and decreased MATK expression in the AS model, consistent with predictions and underscoring their accuracy.
The COX17 gene encodes a small copper chaperone protein expressed in mitochondria, possessing copper-binding and enzyme activator activities.32 COX17 is expressed observed in the brain, heart, kidneys, and skeletal muscle. As a key copper chaperone, it mediates the intracellular transport of copper ions to cytochrome c oxidase (COX), thereby facilitating the functional maturation of this essential mitochondrial enzyme complex.32 COX serves as a pivotal element within the mitochondrial respiratory chain, catalyzing the terminal step of cellular energy metabolism by transferring electrons to oxygen, producing water, and driving ATP synthesis.33 Cox17 also regulates cell proliferation and metabolism, with dysfunction implicated in multiple diseases. For example, in renal fibrosis, elevated COX17 expression correlates with disease progression, whereas its knockdown leads to pathological copper accumulation, impaired complex IV activity, exacerbated mitochondrial dysfunction, and subsequent apoptosis and fibrogenesis.34 Abnormal Cox17 expression has also been reported in non-small cell lung cancer35 and Alzheimer’s disease,36 consistent with the elevated COX17 risk factor observed in AS samples here. These collective observations position COX17 as both a promising diagnostic biomarker and a potential therapeutic target across multiple disease states.
The MATK gene product is a member of the Csk family. The MATK protein contains SH2 and SH3 domains,37 along with a catalytic kinase domain and a distinctive N-terminal region, while notably lacking several regulatory features including myristoylation signals, inhibitory phosphorylation sites, and autophosphorylation capacity.38 MATK exhibits broad cellular expression patterns, with particularly high abundance in megakaryocytes,39 where it modulates critical biological processes including signal transduction, cellular proliferation, and differentiation. Dysregulated kinase activity is often associated with disease.40 Studies show that the ratio of Matk and CHK as a key regulator of immune cell signaling.41 MATK can impair osteoclast and osteoblast function through mechanisms, thereby affecting bone metabolism.42 MATK, along with proteins such as CLIC4 and BIRC2, constitutes a protein model for AS diagnosis with good predictive power.43 Altered MATK expression and related pathways in AS suggest its important role in pathogenesis, warranting further exploration of its function and clinical utility.
This study has certain limitations. The analyses were conducted on relatively small cohorts and relied on publicly available data, so validation in larger, independent populations will be necessary. Moreover, although the CAIA+LPS model permits timely assessment of pathological new bone formation, it cannot fully reproduce the chronic course of AS. Despite these constraints, our findings provide valuable mechanistic insights and generate hypotheses that merit further investigation in expanded clinical and experimental settings.
Conclusion
In summary, this study integrates multi-omics analysis and animal experiments to identify COX17 and MATK as potential biomarkers within the mitochondrial–senescence axis of AS. While these results provide novel mechanistic insights, they remain preliminary, and future studies in larger clinical cohorts and additional models will be required to confirm their diagnostic and translational significance.
Data Sharing Statement
The data that support the findings of this study are available from the corresponding author upon reasonable request.
Ethics Approval
All animal experiments were reviewed and approved by the Experimental Animal Ethics Committee of Guangdong Provincial Hospital of Traditional Chinese Medicine (Approval No. 2022025) and supervised by the Institutional Animal Care and Use Committee of GZUCM. Analysis of human transcriptomic datasets (GSE73754 and GSE25101) was exempt from additional ethics review under Article 32 (items 1 and 2) of the Measures for Ethical Review of Life Science and Medical Research Involving Human Subjects (China, 2023).
Author Contributions
All authors made a significant contribution to the work reported, whether that is in the conception, study design, execution, acquisition of data, analysis and interpretation, or in all these areas; took part in drafting, revising or critically reviewing the article; gave final approval of the version to be published; have agreed on the journal to which the article has been submitted; and agree to be accountable for all aspects of the work.
Funding
This study was funded by National Natural Science Foundation of China (No. 82174285).
Disclosure
The authors have no conflicts of interest to declare that are relevant to the content of this article.
References
1. Braun J, Sieper J. Ankylosing spondylitis. Lancet. 2007;369(9570):1379–1390. doi:10.1016/S0140-6736(07)60635-7
2. Stolwijk C, Van Onna M, Boonen A, Van Tubergen A. Global prevalence of spondyloarthritis: a systematic review and meta-R egression analysis. Arthritis Care Res. 2016;68(9):1320–1331. doi:10.1002/acr.22831
3. Navarro Compán V, Sepriano A, Capelusnik D, Baraliakos X. Axial spondyloarthritis. Lancet. 2025;405(10473):159–172. doi:10.1016/S0140-6736(24)02263-3
4. Zhu W, He X, Cheng K, et al. Ankylosing spondylitis: etiology, pathogenesis, and treatments. Bone Res. 2019;7(1):22. doi:10.1038/s41413-019-0057-8
5. Ranganathan V, Gracey E, Brown MA, Inman RD, Haroon N. Pathogenesis of ankylosing spondylitis - recent advances and future directions. Nat Rev Rheumatol. 2017;13(6):359–367. doi:10.1038/nrrheum.2017.56
6. Wei Y, Zhang S, Shao F, Sun Y. Ankylosing spondylitis: from pathogenesis to therapy. Int Immunopharmacol. 2025;145:113709. doi:10.1016/j.intimp.2024.113709
7. Chen Y, Xu Y, Cao S, Lv Q, Ye Y, Gu J. Oxidative phosphorylation pathway in ankylosing spondylitis: multi-Omi cs analysis and machine learning. Int J Rheum Dis. 2025;28(5):e70175. doi:10.1111/1756-185X.70175
8. Monzel AS, Enríquez JA, Picard M. Multifaceted mitochondria: moving mitochondrial science beyond function and dysfunction. Nat Metab. 2023;5(4):546–562. doi:10.1038/s42255-023-00783-1
9. Van Der Heijde D, Deodhar A, Wei JC, et al. Tofacitinib in patients with ankylosing spondylitis: a Phase II, 16-we ek, randomised, placebo-controlled, dose-ranging study. Ann Rheum Dis. 2017;76(8):1340–1347. doi:10.1136/annrheumdis-2016-210322
10. Miwa S, Kashyap S, Chini E, Von Zglinicki T. Mitochondrial dysfunction in cell senescence and aging. J Clin Investig. 2022;132(13):e158447. doi:10.1172/JCI158447
11. Zhang J, Peng C, Xu S, et al. Mitochondrial displacement loop region single nucleotide polymorphisms and mitochondrial DNA copy number associated with risk of ankylosing spondylitis. Int J Rheum Dis. 2023;26(11):2157–2162. doi:10.1111/1756-185X.14876
12. Ho KJ, Chen PQ, Chang CY, Lu FJ. The oxidative metabolism of circulating phagocytes in ankylosing spondylitis: determination by whole blood chemiluminescence. Ann Rheum Dis. 2000;59(5):338–341. doi:10.1136/ard.59.5.338
13. Ye G, Xie Z, Zeng H, et al. Oxidative stress-mediated mitochondrial dysfunction facilitates mesenc hymal stem cell senescence in ankylosing spondylitis. Cell Death Dis. 2020;11(9):775. doi:10.1038/s41419-020-02993-x
14. Patiño Martinez E, Kaplan MJ. Immunometabolism in systemic lupus erythematosus. Nat Rev Rheumatol. 2025;21(7):377–395. doi:10.1038/s41584-025-01267-0
15. Henry ÓC, O’neill LAJ. Metabolic reprogramming in stromal and immune cells in rheumatoid arthritis and osteoarthritis: therapeutic possibilities. Eur J Immunol. 2025;55(4):e202451381. doi:10.1002/eji.202451381
16. Kirkik D, Hacimustafaoglu F, Gündogdu B, Dogantekin B, Kariksiz M, Kalkanli Tas S. Genetic susceptibility and disease activity in ankylosing spondylitis: the role of G protein-coupled receptor 35rs4676410 polymorphism in a Turkish population. Genet Test Mol Biomarkers. 2025;29(2):32–38. doi:10.1089/gtmb.2024.0482
17. Zhou H, Li X, Zhang Y, et al. Machine learning combined multi-omics analysis to explore key oxidative stress features in systemic lupus erythematosus. Front Immunol. 2025;16:1567466. doi:10.3389/fimmu.2025.1567466
18. Zhao X, Chai Y, Hong Q, Song Y, He Y. Exploring the causal relationship between plasma proteins and systemic lupus erythematosus: a Mendelian randomization study. Life Conflux. 2025;1(4):1–10. doi:10.71321/ma96k735
19. Ji X, Li L, Jiao Y, Cheng H. Aging associated immunosenescence in rheumatoid arthritis identified by machine learning and single cell profiling. Sci Rep. 2025;15(1):31042. doi:10.1038/s41598-025-15370-5
20. Dong Q, Wu J, Zhang H, et al. Deciphering immunometabolic landscape in rheumatoid arthritis: integrative multiomics, explainable machine learning and experimental validation. J Inflamm Res. 2025;18:637–652. doi:10.2147/jir.S503118
21. Chen S, Li Z, Chen D, et al. Piezo1-mediated mechanotransduction promotes entheseal pathological new bone formation in ankylosing spondylitis. Ann Rheum Dis. 2023;82(4):533–545. doi:10.1136/ard-2022-223428
22. Hao W, Chen S, Chao H, et al. IL-33-induced TREM2+ macrophages promote pathological new bone formation through CREG1-IGF2R axis in ankylosing spondylitis. Adv Sci. 2025;12(18):e2500952. doi:10.1002/advs.202500952
23. Feld J, Chandran V, Haroon N, Inman R, Gladman D. Axial disease in psoriatic arthritis and ankylosing spondylitis: a cri tical comparison. Nat Rev Rheumatol. 2018;14(6):363–371. doi:10.1038/s41584-018-0006-8
24. Cheng J, He Z, Jing J, Liu Y, Zhang H. Integrating machine learning and multi-omics to identify key SUMOylati on molecular signature in sarcoma. Life Conflux. 2024;1(1):e88. doi:10.71321/lcflx.00001
25. Hudson G, Gomez Duran A, Wilson IJ, Chinnery PF. Recent mitochondrial DNA mutations increase the risk of developing com mon late-onset human diseases. PLoS Genet. 2014;10(5):e1004369. doi:10.1371/journal.pgen.1004369
26. Dong ZB, Wang YJ, Cheng ML, et al. 2-Bromopalmitate decreases spinal inflammation and attenuates oxalipla tin-induced neuropathic pain via reducing Drp1-mediated mitochondrial dysfunction. PLoS One. 2022;17(10):e0275428. doi:10.1371/journal.pone.0275428
27. Pandey SN, Agrawal N, Moglad E, et al. CHIP and aging: a key regulator of proteostasis and cellular senescence. Biogerontology. 2025;26(3):104. doi:10.1007/s10522-025-10247-6
28. Jo S, Weon S, Nam B, et al. WNT16 elevation induced cell senescence of osteoblasts in ankylosing s pondylitis. Arthritis Res Ther. 2021;23(1):301. doi:10.1186/s13075-021-02670-0
29. Ye G, Li J, Yu W, et al. ALKBH5 facilitates CYP1B1 mRNA degradation via m6A demethylation to al leviate MSC senescence and osteoarthritis progression. Exp Mol Med. 2023;55(8):1743–1756. doi:10.1038/s12276-023-01059-0
30. Vogan K. Immunotherapy for ankylosing spondylitis. Nat Genet. 2023;55(12):2020. doi:10.1038/s41588-023-01612-7
31. Rezaiemanesh A, Abdolmaleki M, Abdolmohammadi K, et al. Immune cells involved in the pathogenesis of ankylosing spondylitis. Biomed Pharmacother. 2018;100:198–204. doi:10.1016/j.biopha.2018.01.108
32. Banci L, Bertini I, Ciofi Baffoni S, et al. A structural-dynamical characterization of human Cox17. J Biol Chem. 2008;283(12):7912–7920. doi:10.1074/jbc.M708016200
33. Guhathakurta S, Erdogdu NU, Hoffmann JJ, et al. COX17 acetylation via MOF-KANSL complex promotes mitochondrial integri ty and function. Nat Metab. 2023;5(11):1931–1952. doi:10.1038/s42255-023-00904-w
34. Zhu SY, Zhou WQ, Niu YY, et al. COX17 restricts renal fibrosis development by maintaining mitochondria l copper homeostasis and restoring complex IV activity. Acta Pharmacol Sin. 2023;44(10):2091–2102. doi:10.1038/s41401-023-01098-3
35. Suzuki C, Daigo Y, Kikuchi T, Katagiri T, Nakamura Y. Identification of COX17 as a therapeutic target for non-small cell lun g cancer. Cancer Res. 2003;63(21):7038–7041.
36. Huang D, Chen L, Ji Q, et al. Lead aggravates Alzheimer’s disease pathology via mitochondrial copper accumulation regulated by COX17. Redox Biol. 2024;69:102990. doi:10.1016/j.redox.2023.102990
37. Zrihan Licht S, Lim J, Keydar I, Sliwkowski MX, Groopman JE, Avraham H. Association of csk-homologous kinase (CHK) (formerly MATK) with HER-2/ ErbB-2 in breast cancer cells. J Biol Chem. 1997;272(3):1856–1863. doi:10.1074/jbc.272.3.1856
38. Bougeret C, Jiang S, Keydar I, Avraham H. Functional analysis of Csk and CHK kinases in breast cancer cells. J Biol Chem. 2001;276(36):33711–33720. doi:10.1074/jbc.M104209200
39. Deng B, Dowler LL, White RA, et al. Structural and functional studies of the intracellular tyrosine kinase MATK gene and its translated product. J Biol Chem. 1995;270(4):1833–1842. doi:10.1074/jbc.270.4.1833
40. Meng Y, Pond MP, Roux B. Tyrosine kinase activation and conformational flexibility: lessons fro m Src-family tyrosine kinases. Acc Chem Res. 2017;50(5):1193–1201. doi:10.1021/acs.accounts.7b00012
41. Lee BC, Avraham S, Imamoto A, Avraham HK. Identification of the nonreceptor tyrosine kinase MATK/CHK as an essential regulator of immune cells using Matk/CHK-deficient mice. Blood. 2006;108(3):904–907. doi:10.1182/blood-2005-12-4885
42. Kim JH, Kim K, Kim I, Seong S, Kim N. c-Src-dependent and -independent functions of Matk in osteoclasts and osteoblasts. J Immunol. 2018;200(7):2455–2463. doi:10.4049/jimmunol.1700582
43. Hwang M, Assassi S, Zheng J, et al. Quantitative proteomic screening uncovers candidate diagnostic and monitoring serum biomarkers of ankylosing spondylitis. Arthritis Res Ther. 2023;25(1):57. doi:10.1186/s13075-023-03044-4
 © 2025 The Author(s). This work is published and licensed by Dove Medical Press Limited. The
full terms of this license are available at https://www.dovepress.com/terms
and incorporate the Creative Commons Attribution
- Non Commercial (unported, 4.0) License.
By accessing the work you hereby accept the Terms. Non-commercial uses of the work are permitted
without any further permission from Dove Medical Press Limited, provided the work is properly
attributed. For permission for commercial use of this work, please see paragraphs 4.2 and 5 of our Terms.
© 2025 The Author(s). This work is published and licensed by Dove Medical Press Limited. The
full terms of this license are available at https://www.dovepress.com/terms
and incorporate the Creative Commons Attribution
- Non Commercial (unported, 4.0) License.
By accessing the work you hereby accept the Terms. Non-commercial uses of the work are permitted
without any further permission from Dove Medical Press Limited, provided the work is properly
attributed. For permission for commercial use of this work, please see paragraphs 4.2 and 5 of our Terms.