Back to Journals » Diabetes, Metabolic Syndrome and Obesity » Volume 18
Inverse Association Between the Dawn Phenomenon and Thyroid Feedback Quantile-Based Index in Type 2 Diabetes Using Continuous Glucose Monitoring: A Cross-Sectional Study
Authors Xia Y, Chen HJ, Yan RN, Zhu XW, Zhao H, Ding B, Hu Y
Received 29 May 2025
Accepted for publication 9 September 2025
Published 12 September 2025 Volume 2025:18 Pages 3465—3475
DOI https://doi.org/10.2147/DMSO.S543452
Checked for plagiarism Yes
Review by Single anonymous peer review
Peer reviewer comments 2
Editor who approved publication: Dr Rebecca Baqiyyah Conway
Yan Xia,1,* Hong-jing Chen,1,* Reng-na Yan,2 Xiao-wei Zhu,1 Han Zhao,1 Bo Ding,2 Yun Hu1,2
1Department of Endocrinology, The Affiliated Wuxi People’s Hospital of Nanjing Medical University, Wuxi People’s Hospital, Wuxi Medical Center, Nanjing Medical University, Wuxi, People’s Republic of China; 2Department of Endocrinology, Nanjing First Hospital, Nanjing Medical University, Nanjing, People’s Republic of China
*These authors contributed equally to this work
Correspondence: Yun Hu, Department of Endocrinology, The Affiliated Wuxi People’s Hospital of Nanjing Medical University, Wuxi People’s Hospital, Wuxi Medical Center, Nanjing Medical University, No. 299 Qingyang Road, Wuxi, 214023, People’s Republic of China, Email [email protected] Bo Ding, Department of Endocrinology, Nanjing First Hospital, Nanjing Medical University, No. 32 Gongqingtuan Road, Nanjing, 210012, People’s Republic of China, Email [email protected]
Purpose: The mechanism of the dawn phenomenon remains poorly understood, and no targeted therapies are currently available. Emerging evidence suggests thyroid dysfunction may contribute to dawn phenomenon by modulating hepatic glucose output, insulin sensitivity, and β-cell function. This study utilized continuous glucose monitoring (CGM) to identify patients with type 2 diabetes exhibiting dawn phenomenon and to investigate its association with thyroid feedback efficiency.
Patients and Methods: This study included patients with type 2 diabetes. All patients underwent CGM before any adjustments to their glucose-lowering therapy. The dawn phenomenon was determined if the elevation of blood glucose from 3 AM to 7 AM was more than 1.11 mmol/L. Clinical data, including medications, diabetic complications and comorbidities, biochemical markers, hemoglobin A1c (HbA1c), beta-cell function, and thyroid function, were recorded.
Results: A total of 524 patients were included, of whom 265 (50.6%) exhibited the dawn phenomenon. A control group of 216 patients was matched based on HbA1c levels from those without dawn phenomenon using propensity score matching. The standard deviation of blood glucose (SDBG) (2.26 vs 1.78, P=0.001) and coefficient of variation (CV) (22.86 vs 16.97, P< 0.001) were significantly higher in the dawn phenomenon group compared to the non-dawn phenomenon group. Thyroid feedback quantile-based index (TFQI) of free thyroxine (FT4) was negatively correlated with the elevation of blood glucose from 3 AM to 7 AM (BG 3– 7) (r=− 0.211, P=0.002). Low-density lipoprotein (LDL) showed a positive correlation with fasting blood glucose (r=0.242, P=0.001) and BG 3– 7 (r=0.123, P=0.083). Regression analysis indicated that TFQI of free triiodothyronine (FT3) (β=− 2.399, P< 0.001) and LDL (β=0.550, P=0.004) were independent predictors of BG 3– 7.
Conclusion: The dawn phenomenon significantly correlates with glycemic fluctuation severity and TFQI. These findings indicate the relationship between thyroid hormones and glucose regulation, providing new insights into the mechanism of the dawn phenomenon.
Keywords: diabetes, dawn phenomenon, blood glucose variability, thyroid hormones
Introduction
Type 2 diabetes mellitus (T2DM) has become a major global public health issue, characterized by regional variations and an increasing prevalence.1,2 Blood glucose variability may exacerbate the onset and progression of diabetic complications (cardiovascular disease, retinopathy, nephropathy, and neuropathy) through oxidative stress, endothelial dysfunction, and inflammatory responses.3–6 Therefore, minimizing glycemic variability is crucial for patients with diabetes.7
The dawn phenomenon refers to a significant rise in blood glucose levels or an increased insulin requirement in the early morning hours, despite relatively stable overnight glucose levels.8 Dawn phenomenon significantly elevates 24-hour mean blood glucose levels, sustains postprandial glucose fluctuations following breakfast,9 and increases hemoglobin A1c (HbA1c) by roughly 4 mmol/mol (0.39%).10
The mechanistic basis of the dawn phenomenon involves disruptions in hormonal secretion rhythms, aggravated insulin resistance, and increased hepatic glucose production.11–13 Relatively low insulin levels combined with significantly increased secretion of counter-regulatory hormones (cortisol, growth hormone, and catecholamines) enhance hepatic gluconeogenesis and glycogenolysis, ultimately elevating blood glucose levels during the dawn period.14–16
Thyroid hormones influence blood glucose levels by regulating hepatic glucose metabolism, insulin secretion, and tissue sensitivity.17,18 In hyperthyroidism, excessive thyroid hormones accelerate hepatic glucose output, promote glycogenolysis, and increase insulin resistance, leading to elevated blood glucose levels; whereas hypothyroidism may reduce glucose metabolic rate and potentially cause hypoglycemic tendency.17 Additionally, thyroid hormones can affect pancreatic β-cell function and intestinal glucose absorption, which are closely related to the development and progression of diabetes.19,20 Thyroid feedback quantile-based index (TFQI) is used to quantify the feedback regulation efficiency of the hypothalamic-pituitary-thyroid (HPT) axis. Compared with conventional separate measurements of free thyroxine (FT4) and thyroid stimulating hormone (TSH), TFQI can more sensitively identify mild thyroid dysfunction.21 This index ranges between −1 and 1. Negative values indicate lower TSH than that expected for the actual Thyroid Hormone (TH) (which means higher sensitivity to TH).22,23 However, no studies have yet investigated the relationship between TFQI characteristics and blood glucose.
The clinical application of continuous glucose monitoring (CGM) technology helped detect the dawn phenomenon and differentiate it from other causes of elevated morning fasting blood glucose, such as the Somogyi effect and sustained nocturnal hyperglycemia.24 It is more precise than nocturnal self-monitoring of blood glucose (SMBG) in detecting the dawn phenomenon.25
The exact mechanism underlying the dawn phenomenon remains unclear, and effective treatment options are lacking. In this study, we used CGM to identify patients with T2DM who experienced the dawn phenomenon and to explore the relationship between dawn phenomenon and thyroid hormones.
Research Design and Methods
Study Participants
This cross-sectional study was approved by the Ethics Committee of Nanjing First Hospital prior to initiation. All procedures complied with the principles of the Helsinki Declaration. Data were retrospectively collected from a medical review database containing no identifiable private information, with approval from the relevant department. Since the study posed no more than minimal risk and the waiver did not adversely affect participants’ rights or welfare, the requirement for informed consent was waived. This study is a sub-study of the trial registered at ClinicalTrials.gov (Analysis of Relevant Influencing Factors of Glycemic Control in Patients With Diabetes, NCT05854862).
Patients with T2DM admitted to the Department of Endocrinology at Nanjing First Hospital between August 2018 and March 2020 were included. Inclusion Criteria: (1) Age 18–90 years; (2) Diagnosis of T2DM according to the 1999 WHO criteria for diabetes diagnosis;26 (3) Patients completed 72-hour CGM while maintaining stable glucose-lowering regimens and tested thyroid function meanwhile. Exclusion Criteria: (1) Patients with blood glucose more than 22.2 mmol/l; (2) Patients with severe systemic disease; (3) Patients treated with systemic glucocorticoids within the last three months; (4) Patients without any records about HbA1c, CGM, SMBG, and thyroid hormones.
Based on preliminary pilot results (dawn phenomenon incidence of 50.6%, correlation coefficient between TFQI and BG 3–7 of r=−0.211), we performed sample size estimation using PASS 15.0 software. With a two-sided α of 0.05 and 90% power to detect a ≥20% intergroup difference in incidence rates (50.6% vs 30.0%), the minimum required sample size was calculated to be 218 cases (109 per group). Accounting for a 20% dropout rate, the theoretical sample size needed was 273 cases. This study ultimately enrolled 524 patients, substantially exceeding the calculated requirement to enhance the robustness of findings.
Clinical and Laboratory Assessments
Basic clinical data included age, sex, duration of T2DM, anthropometric measurements (height, weight, waist circumference, hip circumference), diabetic complications and comorbidities, and history of antidiabetic medication use. These data, along with laboratory results and CGM data, were collected from hospital admission records. Body mass index (BMI) was calculated as weight in kilograms divided by height in meters squared. Waist-to-hip ratio (WHR) was determined by dividing waist circumference by hip circumference.
A standardized 75g OGTT was performed with glucose dissolved in 200mL water. Serum samples were collected at 0, 30, and 120 minutes for measurement of glucose, insulin, and C-peptide levels, which were measured centrally at the central laboratory in Nanjing First Hospital, Nanjing Medical University. FT4, free triiodothyronine (FT3), and TSH, collected by trained phlebotomists at 7:00 AM after an overnight fast (≥8 hours), were detected by chemiluminescence (Abbott, Lake County, IL). HbA1c was measured by a DiaSTAT HbA1c analyzer (Bio-Rad, Hercules, CA). The following thyroid function indices were calculated: thyroid feedback quantile-based index of FT4 (TFQIFT4)=cdfFT4-(1-cdfTSH)(cdf, cumulative distribution function), TFQIFT3=cdf FT3-(1-cdfTSH), thyroid-stimulating hormone index (TSHI)=InTSH+ 0.1345×FT4, thyrotroph thyroxine resistance index (TT4RI)=FT4×TSH.27–29
Patients received standardized education from specialized nurses prior to CGM application, following the Clinical Guidelines for Continuous Glucose Monitoring. All participants from both groups underwent 72-hour blinded CGM using the Medtronic Sof-sensor CGMS-Gold system (Medtronic Incorporated, Northridge, USA) under the supervision of specialized nurses in the hospital setting. Participants were instructed to maintain their usual physical activity levels and adhere to a standardized diet providing 25 kcal/kg/day (60% carbohydrates, 20–25% lipids, and 15–20% protein), with strictly scheduled meal times at 07:00 (breakfast), 11:00 (lunch), and 17:00 (dinner) throughout the 72-hour monitoring period. The CGM system was calibrated four times daily using fingerstick blood glucose measurements. Between-group differences were analyzed for the following parameters: 24-hour mean blood glucose (MBG), standard deviation of blood glucose (SDBG), coefficient of variation (CV), and time in range (TIR). The dawn phenomenon was defined as a blood glucose elevation >1.11 mmol/L between 3:00 AM and 7:00 AM, in the absence of nocturnal hypoglycemia.8
Statistical Analysis
Statistical analyses were performed using SPSS 26.0 (IBM Corp, Armonk, NY). Continuous variables with normal distribution were presented as mean ± standard deviation ( ), and independent samples t-tests were used for between-group comparisons. Propensity score matching was employed to select matched controls from non-dawn phenomenon patients based on HbA1c levels. For non-normally distributed data, we reported median and interquartile range [M (P25, P75)] and used Mann–Whitney U-tests. Categorical variables were expressed as frequencies and percentages [n (%)], analyzed using χ²-tests.
We assessed variable correlations using Spearman’s rank correlation coefficient. For regression analysis, a stepwise linear regression model (entry P < 0.1, removal P > 0.05) evaluated factors influencing nocturnal blood glucose variability. Logistic regression analyzed variable impacts on clinical outcomes. The Kruskal–Wallis test screened for significant differences in BG 3–7 among TFQIFT3 quartile groups, with post hoc analysis identifying specific group differences. Statistical significance was set at p < 0.05.
Results
Baseline Characteristics
A total of 481 patients were included in this study (265 in the dawn phenomenon group and 216 in the non-dawn phenomenon group). Subsequently, patients in both groups were propensity score-matched based on HbA1c levels. After matching, the dawn phenomenon group comprised 145 patients, while the non-dawn phenomenon group included 65 patients (Figure 1).
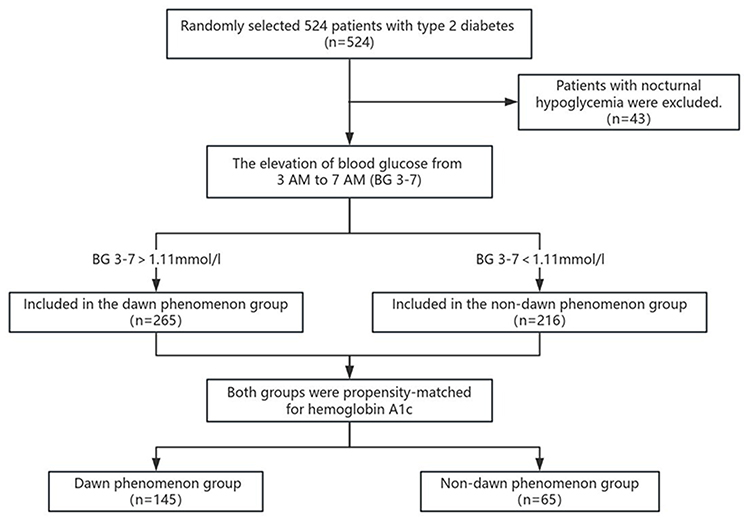 |
Figure 1 Trial profile. |
As shown in Table 1, there were no significant differences between the two groups in baseline characteristics such as age, BMI, disease duration, HbA1c, fasting and postprandial C-peptide levels (P > 0.05). Additionally, in terms of diabetic complications, the difference in the prevalence of neuropathy (5.52% vs 16.92%) approached statistical significance (P = 0.008).
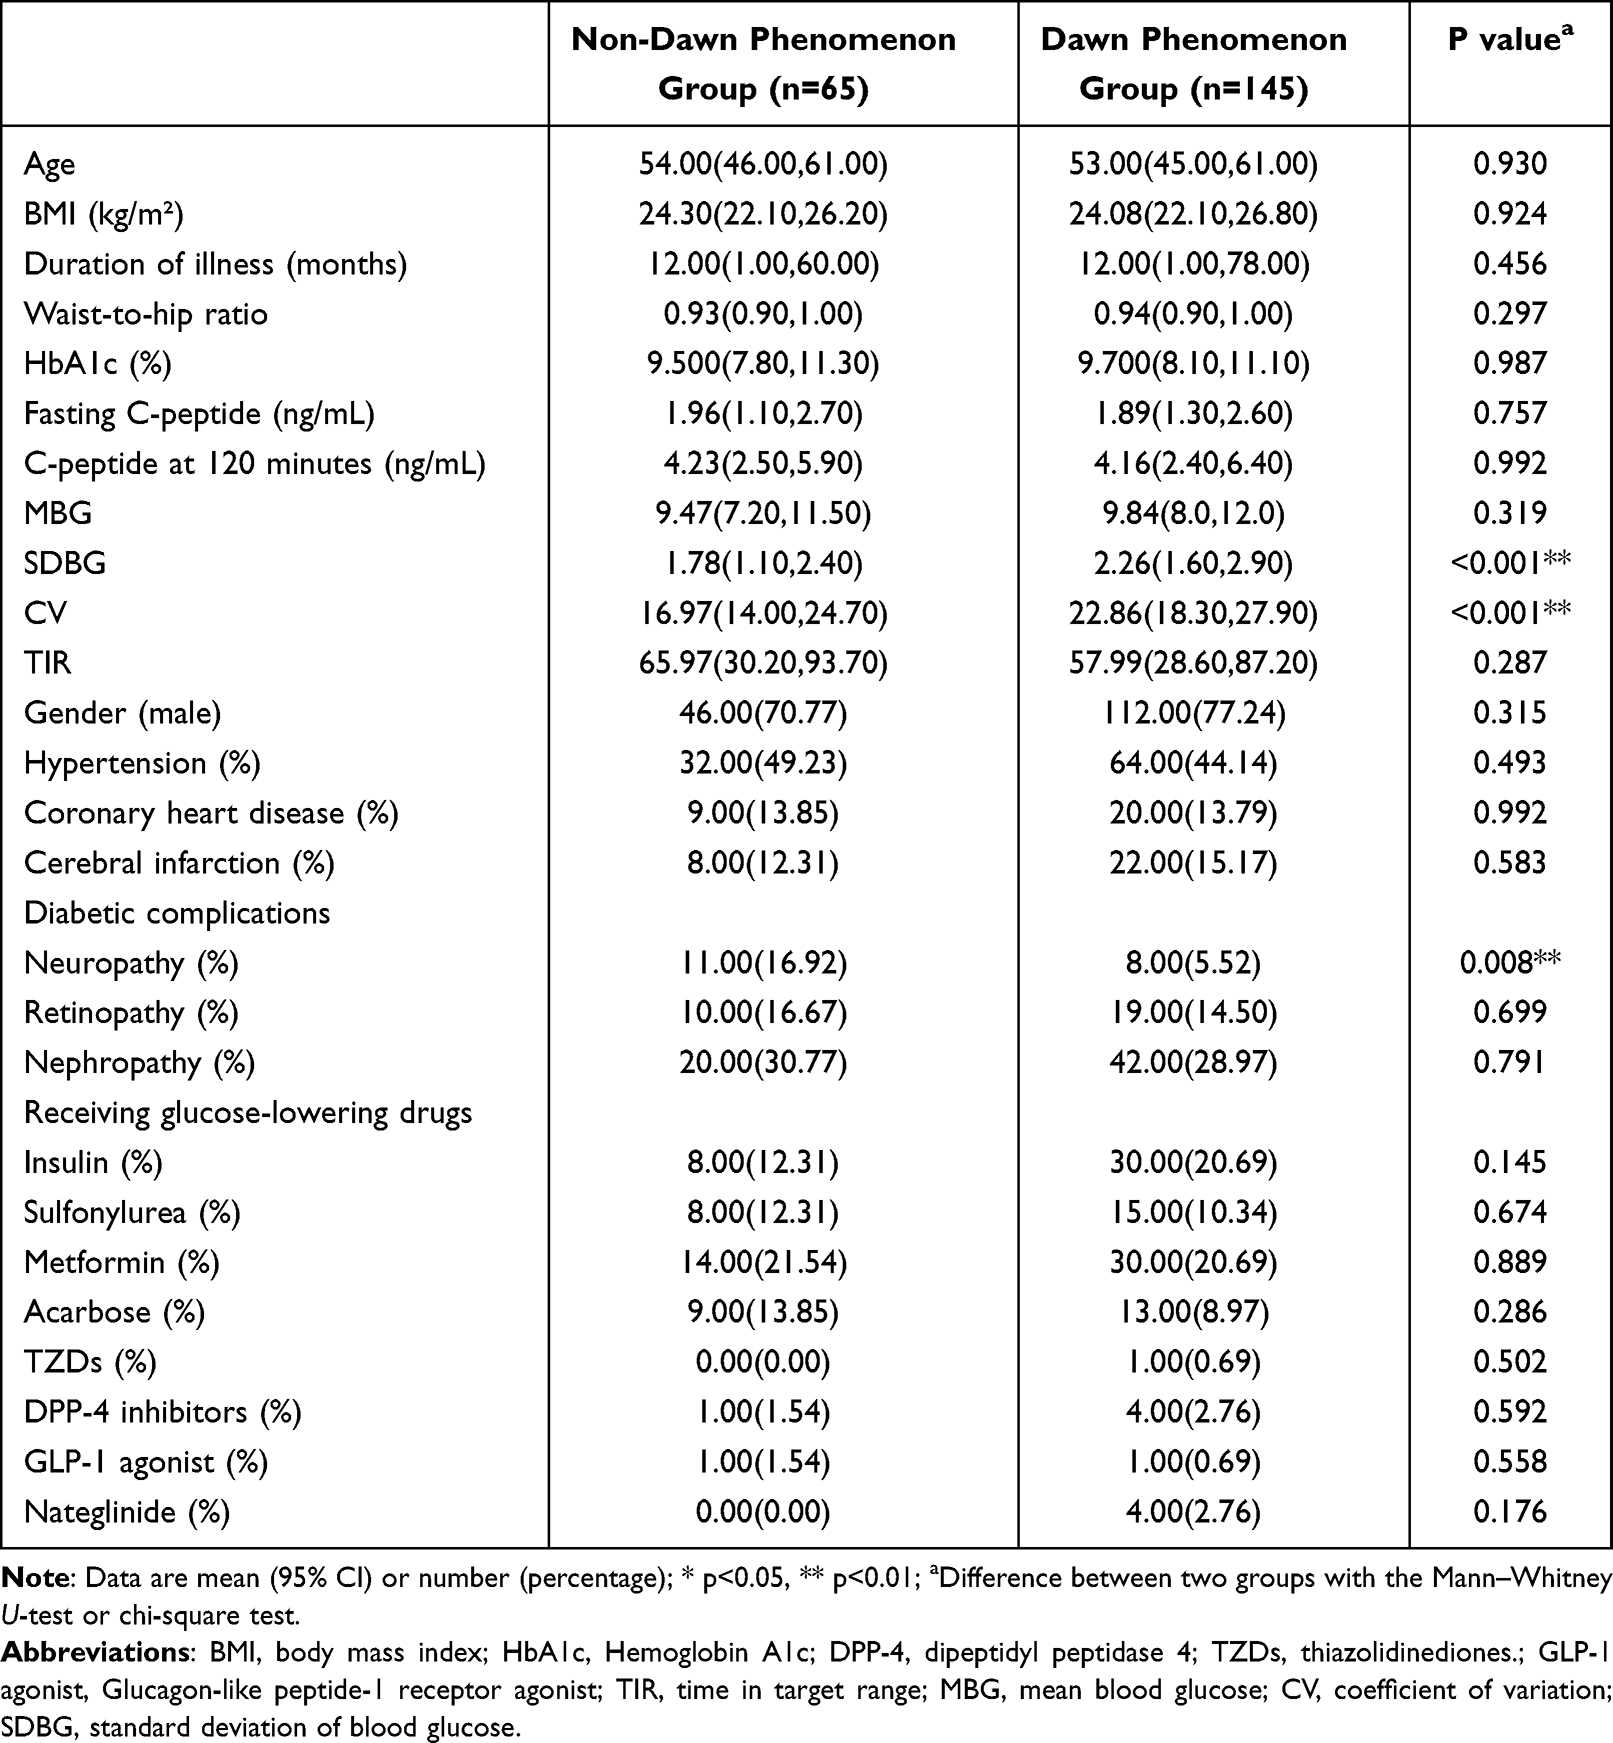 |
Table 1 Baseline Characteristics of Participants |
The blood glucose variability parameters, SDBG (2.26 vs 1.78, P=0.001) and CV (22.86 vs 16.97, P<0.001), were significantly higher in the dawn phenomenon group. We also compared the average glucose concentrations per hour between the two groups (Figure 2). The blood glucose levels in the dawn phenomenon group were higher during the early morning hours (from 7:00 to 9:00) compared to the non-dawn phenomenon group (P all <0.01).
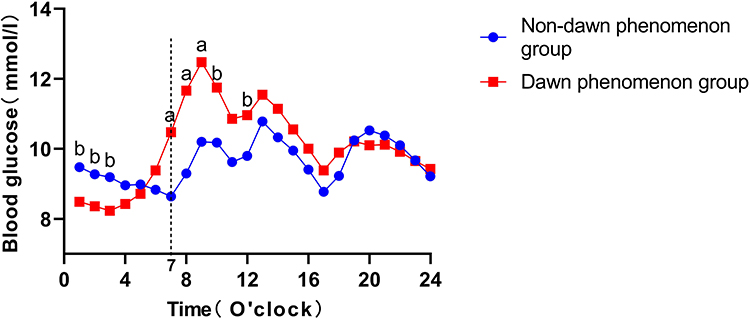 |
Figure 2 The Average Glucose Concentrations Per Hour Between the Two Groups. The blue circles represent the non-Dawn phenomenon group, and the red squares represent the dawn phenomenon group. It can be observed that at 7:00 AM (indicated by the vertical dotted line), 8:00 AM, and 9:00 AM, the blood glucose levels in the dawn phenomenon group are significantly higher. Note: a, P < 0.01; b, P < 0.05. |
Correlation Analysis Between Thyroid Function and Blood Glucose
Thyroid function parameters were significantly correlated with glucose parameters. FT4 was positively correlated with fasting blood glucose (FBG) (r = 0.149, P = 0.049) and negatively correlated with SDBG (r = −0.150, P = 0.040). TT4RI was significantly negatively correlated with blood glucose difference (r = −0.181, P = 0.009). TFQIFT4 was negatively correlated with the elevation of blood glucose from 3 AM to 7 AM (BG 3–7) (r=−0.211, P=0.002). BMI and WHR were significantly negatively correlated with SDBG and CV, suggesting that obesity may suppress variability. Low-density lipoprotein (LDL) showed a positive correlation with FBG and a trending positive correlation with BG 3–7 (P all <0.05), as shown in Figure 3.
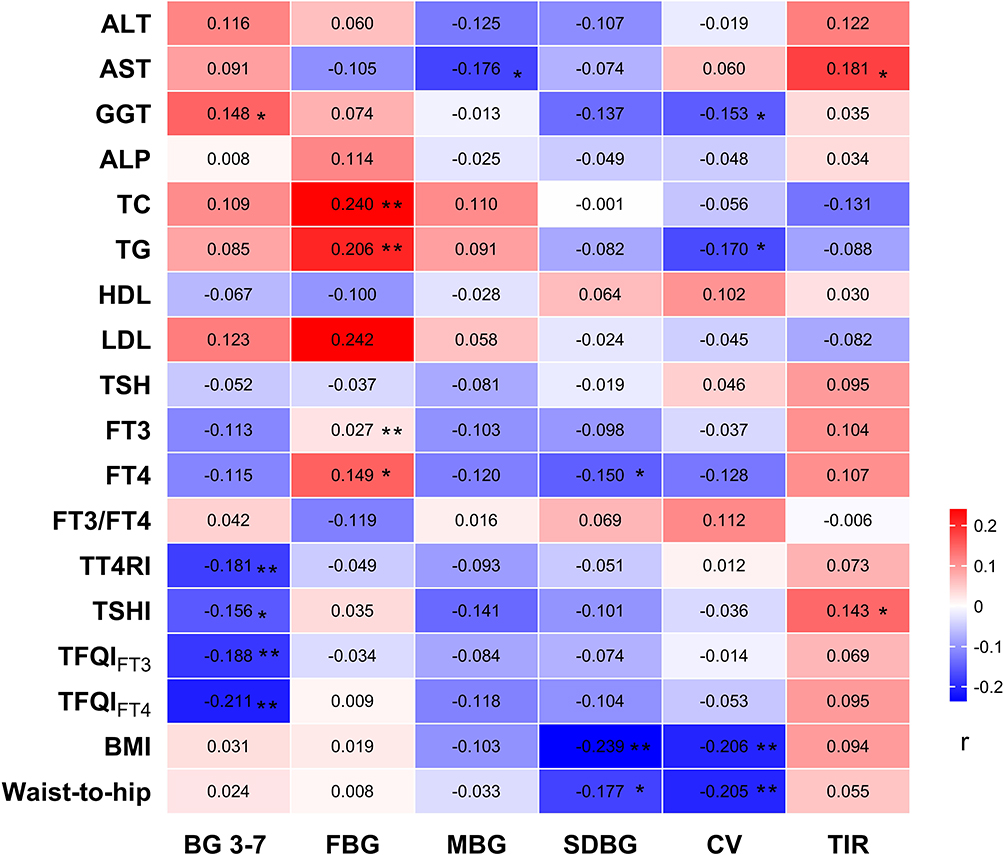 |
Figure 3 Correlations of Thyroid Function, Liver Enzymes, Lipids, and BMI with Glycemic Control in T2DM Patients. The color bar represents the correlation coefficient (r), with red indicating positive correlations and blue indicating negative correlations. Darker colors represent stronger correlations. Abbreviation: BG 3–7, blood glucose elevation from 3 AM to 7 AM; ALT, Alanine aminotransferase; AST, Aspartate aminotransferase; GGT, Gamma-glutamyl transferase; ALP, Alkaline phosphatase; TC, Total cholesterol; TG, Triglycerides; HDL, High-density lipoprotein; LDL, Low-density lipoprotein; TSH, Thyroid Stimulating Hormone; FT3, Free Triiodothyronine; FT4, Free Thyroxine; FT3/FT4, Free Triiodothyronine/Free Thyroxine Ratio; BMI, body mass index; TT4RI, Thyrotroph Thyroxine Resistance Index; TSHI, Thyroid-Stimulating Hormone Index. Note: *p<0.05, **p<0.01. |
Regression Model and Predictive Performance
Based on the results of univariate and correlation analyses, this study employed binary logistic regression to examine the association between the dawn phenomenon and potential influencing factors. The independent variables included age, BMI, TFQIFT3, TT4RI, TSHI, LDL, gamma-glutamyl transferase, neuropathy, SDBG, and CV. The multivariate analysis revealed that TFQIFT3 and Neuropathy had a negative association with the dawn phenomenon group (OR = 0.105, 95% CI = 0.014–0.746, P = 0.029; OR =0.115, 95% CI = 0.0.031–0.433, P = 0.001), while LDL and CV significantly increased the risk of the dawn phenomenon (OR =2.900, 95% CI = 1.379–6.101, P = 0.005; OR =1.126, 95% CI =1.033–1.227, P = 0.007), as shown in Table 2.
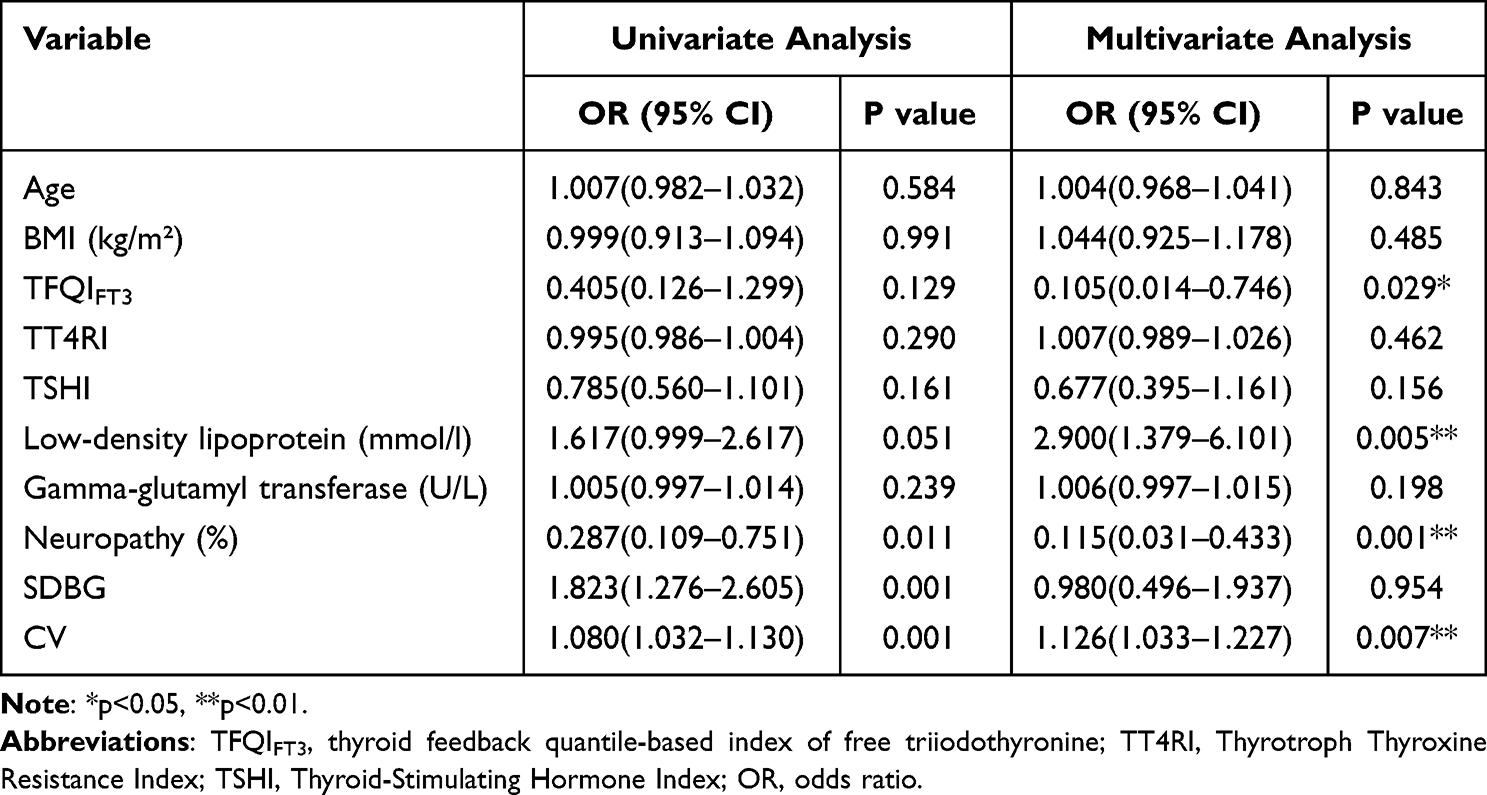 |
Table 2 Univariate and Multivariate Logistic Regression Analyses of Factors Associated with the Dawn Phenomenon |
A stepwise regression analysis was conducted with alanine aminotransferase, aspartate aminotransferase, gamma-glutamyl transferase, alkaline phosphatase, total cholesterol, triglycerides, high-density lipoprotein, LDL, TSH, FT3, FT4, FT3/FT4, TT4RI, TSHI, TFQIFT3, TFQIFT4, BMI, WHR, FBG as independent variables, and BG 3–7 as the dependent variable. TFQIFT3 (β = −2.399, P < 0.001) and LDL (β = 0.550, P = 0.004) were identified as independent predictors of blood glucose difference. The model explained 13.9% of the variance (R² = 0.139, F = 10.468, P < 0.001), indicating the model’s validity. The model formula is: Predicting BG 3–7 = 0.244–2.399TFQIFT3 + 0.550LDL. Additionally, a test for multicollinearity showed that all VIF values in the model were less than 5, indicating no collinearity issues. Furthermore, the Durbin-Watson (D-W) value was around 2, suggesting that there is no autocorrelation, and the sample data are independent, making the model robust, as shown in Table 3.
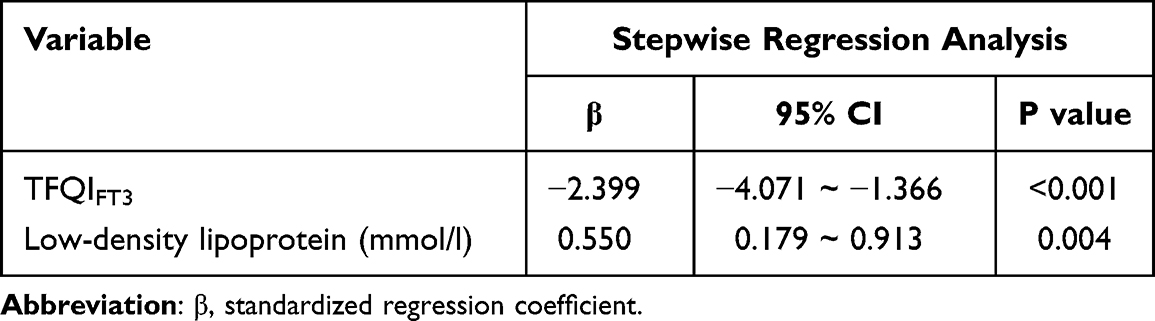 |
Table 3 Stepwise Regression Analysis of Predictors for Blood Glucose Elevation from 3 AM to 7 AM |
The Blood Glucose Characteristics at Different Levels of TFQIFT3
The TFQIFT3 data is divided according to the following quartiles: Quartile 1 (Q1): −0.583 to −0.206, Quartile 2 (Q2): −0.206 to −0.051, Quartile 3 (Q3): −0.051 to 0.117, Quartile 4 (Q4): 0.117 to 0.617, and then the Kruskal–Wallis test is used to analyze the differences of blood glucose characteristics (BG 3–7, MBG, SDBG, CV, and TIR) between the quartile groups. A significant difference in BG 3–7 was observed across different TFQIFT3 quartile groups (Q1 to Q 4) (p=0.011). Further post hoc comparisons revealed a significant difference between Q2 and Q3 (p=0.014), as shown in Table 4.
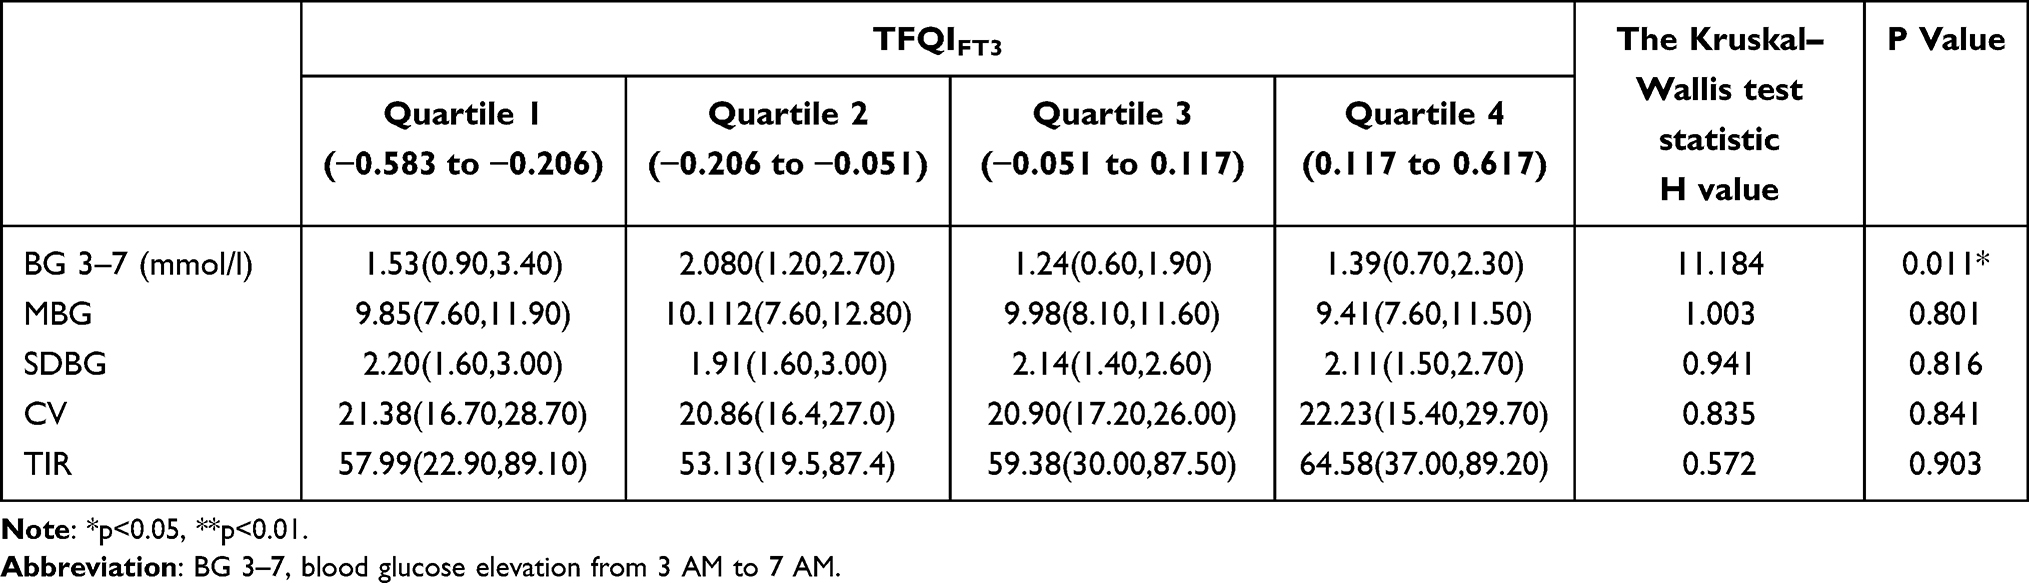 |
Table 4 The Kruskal Wallis Test Results of BGD 3–7 AM Across Different TFQIFT3 Ranges |
Discussion
The current study demonstrated significantly greater blood glucose variability in patients with dawn phenomenon. Notably, TFQI, a quantitative index of hypothalamic-pituitary-thyroid axis sensitivity to thyroid hormone feedback, was negative association with the dawn phenomenon, which has never been reported before.The impact of dawn phenomenon on blood glucose variability has been well-documented. Research indicates that the dawn phenomenon leads to a significant rise in morning blood glucose levels, which elevates SDBG and CV.10,30 These findings are consistent with our study results, supporting the reliability of our data. The dawn phenomenon significantly increases the risk of both macrovascular and microvascular complications in diabetes by exacerbating blood glucose fluctuations and prolonged hyperglycemic states.31 The diabetic neuropathy subgroup in this study had an extremely small sample size (n=19). Although a negative correlation trend with the dawn phenomenon was observed, the statistical power was inadequate. This finding likely reflects confounding influences (eg, differences in disease duration) rather than a genuine biological association. Future prospective studies with larger cohorts are needed to validate this hypothesis.
The present study revealed a significant inverse association between the dawn phenomenon and TFQI. In this study, for every 1-unit increase in central sensitivity to thyroid hormones, the likelihood of the dawn phenomenon occurring is reduced to 0.286 times the original probability. Studies have shown that individuals with higher TFQI are more likely to develop diabetes and metabolic syndrome.32,33 Currently, there are no reported studies on the relationship between TFQI and dawn phenomenon. Research indicates that hypothyroidism, characterized by reduced thyroid hormone levels, decreases basal metabolic rate and enhances hepatic gluconeogenesis, leading to increased nocturnal hepatic glucose output.34 Concurrently, diminished insulin sensitivity in peripheral tissues further exacerbates morning hyperglycemia.9 Additionally, hypothyroidism triggers compensatory activation of the hypothalamic-pituitary-adrenal (HPA) axis, elevating cortisol secretion.35 This effect, combined with the hyperglycemic action of growth hormone, collectively aggravates the dawn phenomenon.36 In contrast, hyperthyroidism markedly increases metabolic rate. Short-term, it may mitigate the dawn phenomenon by enhancing glucose utilization and suppressing cortisol secretion.37 However, chronic hyperthyroidism can ultimately impair glycemic control due to β-cell dysfunction and accumulated oxidative stress.38 Even subclinical thyroid dysfunction, despite milder manifestations, may similarly disrupt glucose circadian rhythms through analogous mechanisms.37 Compared to conventional isolated measurements of TSH and FT4, TFQI demonstrates superior sensitivity in detecting mild thyroid dysfunction.21 Our results reveal a significant inverse correlation between TFQI and the dawn phenomenon, which aligns with previous research findings. On the other hand, previous study found that high glucose-induced ROS accumulation impaired thyroid follicular cells, reducing hormone synthesis.39 Additionally, hyperglycemia and insulin resistance suppress 5′-deiodinase in liver and kidney, decreasing active T3 production.40 These findings demonstrate a close link between thyroid dysfunction and glucose metabolism disorders. This study reveals a potential mechanistic link between thyroid dysfunction and the dawn phenomenon. Building upon previous research evidence (eg, the well-documented association between hyperthyroidism and elevated fasting blood glucose), thyroid disorders may represent a significant contributing factor to the dawn phenomenon. Therefore, for patients with type 2 diabetes, implementing thyroid function assessment and glycemic variability monitoring could facilitate improved management of the dawn phenomenon and enable more personalized precision treatment. Furthermore, our findings provide new insights into the pathogenesis of the dawn phenomenon and establish an evidence-based foundation for future research.
This study found that elevated LDL levels are associated with the occurrence of the dawn phenomenon. Previous studies indicate that the accumulation of cholesterol esters in pancreatic β-cells activates the unfolded protein response, which can inhibit insulin secretion and elevate blood glucose levels.41,42 Meanwhile, ox-LDL promotes macrophage infiltration into adipose tissue through the TLR4/MyD88 pathway, releasing IL-6 and TNF-α, which can interfere with insulin signaling and elevate fasting blood glucose levels.43,44 These studies collectively suggest that elevated LDL levels may be associated with increased fasting blood glucose, which is consistent with the findings of the present study.
Limitations
Several study limitations should be acknowledged. The cross-sectional design of the study cannot establish a causal relationship between central sensitivity to thyroid hormones and the dawn phenomenon. In future research, we plan to conduct prospective cohort studies to better elucidate the temporal relationship between thyroid function parameters and the dawn phenomenon. The present study included patients with T2DM admitted to the hospital. Therefore, the physical activity, medication adherence, and diet were standardized and managed in the hospital, and no adjustments are necessary. However, we have no records of sleep quality, which may have led to result misinterpretation.45,46 Future research should incorporate wearable devices (eg, smart wristbands) to obtain more comprehensive behavioral data. Future studies, both in vivo and in vitro, are still needed to further elucidate the precise mechanisms linking the dawn phenomenon with central thyroid hormone sensitivity.
Conclusion
This study demonstrates a significant correlation between the dawn phenomenon and the magnitude of glycemic fluctuations, and for the first time establishes a significant association between TFQI and the dawn phenomenon, providing novel insights into its pathogenesis. The innovative application of TFQI, a quantitative index of thyroid feedback, proves more effective than conventional thyroid function tests in reflecting subtle regulatory abnormalities of the hypothalamic-pituitary-thyroid (HPT) axis. This study highlights the need for special management of the dawn phenomenon in patients with diabetes and concomitant thyroid dysfunction, while also establishing an evidence-based foundation for future research.
Ethics Statement
The studies involving human participants were reviewed and approved by the Ethics Committee of Nanjing First Hospital.
Acknowledgments
We thank the members of the Endocrinology Department of Nanjing First Hospital for their support. Yan Xia and Hong-jing Chen contributed equally to this article as the first author.
Funding
This work was supported by grants from the National Natural Science Foundation of China (No. 82270838), Wuxi Science and Technology Development Funds (No. Y20232025), Top Talent Support Program for young and middle-aged people of Wuxi Health Committee (BJ2023010) and General Project of Nanjing Medical University Wuxi Medical Center (WMCG202413).
Disclosure
The authors report no conflicts of interest in this work.
References
1. Qian Y, Quan R, Chen X, et al. Clinical features and long-term survival in idiopathic pulmonary arterial hypertension with thyroid dysfunction: insights from a national multicentre prospective study. ERJ Open Res. 2023;9(6):00495–02023. doi:10.1183/23120541.00495-2023
2. Pradeepa R, Mohan V. Epidemiology of type 2 diabetes in India. Indian J Ophthalmol. 2021;69(11):2932–2938. doi:10.4103/ijo.IJO_1627_21
3. Monnier L, Colette C, Dejager S, Owens DR. Near normal HbA1c with stable glucose homeostasis: the ultimate target/aim of diabetes therapy. Rev Endocr Metab Disord. 2016;17(1):91–101. doi:10.1007/s11154-016-9325-8
4. Monnier L, Colette C. Target for glycemic control: concentrating on glucose. Diabetes Care. 2009;32(suppl_2):S199–S204. doi:10.2337/dc09-S310
5. Alfieri V, Myasoedova VA, Vinci MC, et al. The role of glycemic variability in cardiovascular disorders. Int J Mol Sci. 2021;22(16):8393. doi:10.3390/ijms22168393
6. Su G, hua MS, Tao H, et al. Impact of admission glycemic variability, glucose, and glycosylated hemoglobin on major adverse cardiac events after acute myocardial infarction. Diabetes Care. 2013;36(4):1026–1032. doi:10.2337/dc12-0925
7. Belli M, Bellia A, Sergi D, Barone L, Lauro D, Barillà F. Glucose variability: a new risk factor for cardiovascular disease. Acta Diabetol. 2023;60(10):1291–1299. doi:10.1007/s00592-023-02097-w
8. Schmidt MI, Hadji-Georgopoulos A, Rendell M, Margolis S, Kowarski A. The dawn phenomenon, an early morning glucose rise: implications for diabetic intraday blood glucose variation. Diabetes Care. 1981;4(6):579–585. doi:10.2337/diacare.4.6.579
9. Porcellati F, Lucidi P, Bolli GB, Fanelli CG. Thirty years of research on the dawn phenomenon: lessons to optimize blood glucose control in diabetes. Diabetes Care. 2013;36(12):3860–3862. doi:10.2337/dc13-2088
10. Monnier L, Colette C, Dejager S, Owens D. Magnitude of the dawn phenomenon and its impact on the overall glucose exposure in type 2 diabetes: is this of concern? Diabetes Care. 2013;36(12):4057–4062. doi:10.2337/dc12-2127
11. Hasebe M, Satoh S, Ito K, Tamura H, Terauchi Y. Endocrinological evaluation of dawn phenomenon in patients with diabetes and comparison of insulin glargine U-100 biosimilar (Insulin Glargine BS Injection “Lilly”) and glargine U-300 (Lantus XR): a randomized controlled study. Endocr J. 2023;70(8):777–786. doi:10.1507/endocrj.EJ22-0562
12. Barua S, Glantz N, Larez A, Bevier W, Sabharwal A, Kerr D. A probabilistic computation framework to estimate the Dawn phenomenon in type 2 diabetes using continuous glucose monitoring. Sci Rep. 2024;14(1):2915. doi:10.1038/s41598-024-52461-1
13. Ostrovski I, Lovblom LE, Scarr D, et al. Analysis of prevalence, magnitude and timing of the dawn phenomenon in adults and adolescents with type 1 diabetes: descriptive analysis of 2 insulin pump trials. Can. J. Diabetes. 2020;44(3):229–235. doi:10.1016/j.jcjd.2019.08.003
14. Almutairi T, Dargham S, Jayyousi A, Suwaidi JA, Khalil CA. Diabetic ketoacidosis and hyperglycemic hyperosmolar state are associated with higher in-hospital mortality and morbidity in diabetes patients hospitalized with ST-elevation myocardial infarction, but not within 30 days of readmission. PLoS One. 2025;20(2):e0318774. doi:10.1371/journal.pone.0318774
15. Lindmeyer AM, Meier JJ, Nauck MA. Patients with type 1 diabetes treated with insulin pumps need widely heterogeneous basal rate profiles ranging from negligible to pronounced diurnal variability. J Diabetes Sci Technol. 2021;15(6):1262–1272. doi:10.1177/1932296820949939
16. Wang JS, Lee IT, Lee WJ, et al. The Dawn phenomenon in type 2 diabetes: its association with glucose excursions and changes after oral glucose-lowering drugs. Ther Adv Chronic Dis. 2021;12:20406223211033674. doi:10.1177/20406223211033674
17. Kushchayeva YS, Startzell M, Cochran E, et al. Thyroid hormone effects on glucose disposal in patients with insulin receptor mutations. J Clin Endocrinol Metab. 2020;105(3):e158–e171. doi:10.1210/clinem/dgz079
18. Eom YS, Wilson JR, Bernet VJ. Links between thyroid disorders and glucose homeostasis. Diabet Metabol J. 2022;46(2). doi:10.4093/dmj.2022.0013
19. Harris SE, De Blasio MJ, Davis MA, et al. Hypothyroidism in utero stimulates pancreatic beta cell proliferation and hyperinsulinaemia in the ovine fetus during late gestation. J Physiol. 2017;595(11):3331–3343. doi:10.1113/JP273555
20. Calcaterra V, Magenes VC, Siccardo F, et al. Thyroid dysfunction in children and adolescents affected by undernourished and overnourished eating disorders. Front Nutr. 2023:10. doi:10.3389/fnut.2023.1205331
21. Xie H, Li N, Zhou G, et al. The association between the thyroid feedback quantile-based index and serum uric acid in U.S. adults. Eur. J. Med. Res 2023;28(1):259. doi:10.1186/s40001-023-01214-3
22. Laclaustra M, Moreno-Franco B, Lou-Bonafonte JM, et al. Impaired sensitivity to thyroid hormones is associated with diabetes and metabolic syndrome. Diabetes Care. 2019;42(2):303–310. doi:10.2337/dc18-1410
23. Laclaustra M, Alonso-Ventura V, Schipf S, et al. Higher parametric thyroid feedback quantile-based index is a predictor of type 2 diabetes in a german population sample. J Clin Endocrinol Metab. 2024;109(12):e2205–e2213. doi:10.1210/clinem/dgae110
24. Mehrer R, Heins JR. Pharmacology focus: advances in diabetes technology: continuous glucose monitoring. S D Med. 2020;73(3):136–138.
25. Huang X, Yao C, Huang S, et al. Technological advances of wearable device for continuous monitoring of in vivo glucose. ACS Sens. 2024;9(3):1065–1088. doi:10.1021/acssensors.3c01947
26. World Health Organization. Definition, diagnosis and classification of diabetes mellitus and its complications: report of a WHO consultation. Part 1, Diagnosis and classification of diabetes mellitus. 1999. Available from: https://iris.who.int/handle/10665/66040.
27. Yang Q, Dong R, Yan H, et al. Impaired sensitivity to thyroid hormone correlates to all-cause mortality in euthyroid individuals with chronic kidney disease. BMC Public Health. 2024;24(1):2134. doi:10.1186/s12889-024-19660-x
28. W X, Z F, C A, W J, G Y, Z J. Association between sensitivity to thyroid hormone indices and osteoporosis in euthyroid patients with type 2 diabetes mellitus. Ther Adv Chronic Dis. 2023;14. doi:10.1177/20406223231189230
29. Dietrich JW, Landgrafe G, Fotiadou EH. TSH and thyrotropic agonists: key actors in thyroid homeostasis. J Thyroid Res. 2012;2012(1):351864. doi:10.1155/2012/351864
30. Zheng X, Qi Y, Bi L, et al. Effects of exercise on blood glucose and glycemic variability in type 2 diabetic patients with dawn phenomenon. Biomed Res. Int. 2020;2020(1):6408724. doi:10.1155/2020/6408724
31. Roman G, Bala C, Craciun CI, Rusu A, Craciun AE. The correlation of Dawn phenomenon with glycemic variability parameters in type 2 diabetes mellitus. Revista Romana de Medicina de Laborator. 2016;24(1):55–64. doi:10.1515/rrlm-2016-0004
32. Laclaustra M, Moreno-Franco B, Lou-Bonafonte JM, et al. Impaired sensitivity to thyroid hormones is associated with diabetes and metabolic syndrome. Diabetes Care. 2018;42(2):303–310. doi:10.2337/dc18-1410
33. Ladan M, Negar D, Atieh A, Mitra H, Maryam T, Fereidoun A. Reduced sensitivity to thyroid hormone is associated with diabetes and hypertension. J Clin Endocrinol Metab. 2021;(1):1. doi:10.1210/clinem/dgab646
34. Kadiyala R, Peter R, Okosieme OE. Thyroid dysfunction in patients with diabetes: clinical implications and screening strategies. Int J Clin Pract. 2010;64(8):1130–1139. doi:10.1111/j.1742-1241.2010.02376.x
35. Palma CCSSV, Pavesi M, Nogueira VG, et al. Prevalence of thyroid dysfunction in patients with diabetes mellitus. Diabetol Metab Syndr. 2013;5(1):58. doi:10.1186/1758-5996-5-58
36. Maratou E, Hadjidakis DJ, Kollias A, et al. Studies of insulin resistance in patients with clinical and subclinical hypothyroidism. Eur J Endocrinol. 2009;160(5):785–790. doi:10.1530/EJE-08-0797
37. Mohammed Hussein SM, AbdElmageed RM. The relationship between type 2 diabetes mellitus and related thyroid diseases. Cureus. 2021;13(12):e20697. doi:10.7759/cureus.20697
38. Hage M, Zantout MS, Azar ST. Thyroid disorders and diabetes mellitus. J Thyroid Res. 2011;2011:439463. doi:10.4061/2011/439463
39. Wu R, Zhang J, Zou G, et al. Diabetes mellitus and thyroid cancers: risky correlation, underlying mechanisms and clinical prevention. DMSO. 2024;17:809–823. doi:10.2147/DMSO.S450321
40. Romano RM, de Oliveira JM, de Oliveira VM, et al. Could glyphosate and glyphosate-based herbicides be associated with increased thyroid diseases worldwide? Front Endocrinol. 2021:12. doi:10.3389/fendo.2021.627167
41. Hong DY, Lee DH, Lee JY, et al. Relationship between brain metabolic disorders and cognitive impairment: LDL receptor defect. Int J Mol Sci. 2022;23(15):8384. doi:10.3390/ijms23158384
42. Lee DH. Lipoproteins and β-cell functions: from basic to clinical data. Diabetes Metab J. 2014;38(4):274–277. doi:10.4093/dmj.2014.38.4.274
43. Bonilha I, Hajduch E, Luchiari B, Nadruz W, Le Goff W, Sposito AC. The reciprocal relationship between LDL metabolism and type 2 diabetes mellitus. Metabolites. 2021;11(12):807. doi:10.3390/metabo11120807
44. He L, Zheng W, Li Z, Kong W, Zeng T. Association of four lipid-derived indicators with the risk of developing type 2 diabetes: a Chinese population-based cohort study. Lipids Health Dis. 2023;22(1):24. doi:10.1186/s12944-023-01790-7
45. M E, F H, T F, et al. Dietary and lifestyle patterns identified through reduced rank regression and their association with insulin-related disorders: a prospective analysis from the Tehran Lipid and Glucose Study. BMC Nutr. 2025;11(1). doi:10.1186/s40795-025-01022-4
46. S T, K T, Rjm K, et al. Differential impact of lifestyle factors on 2-hour glucose values in individuals with type 2 diabetes: potential for more personalized interventions. BMJ Open Diabetes Res Care. 2024;12(6). doi:10.1136/bmjdrc-2024-004506
 © 2025 The Author(s). This work is published and licensed by Dove Medical Press Limited. The
full terms of this license are available at https://www.dovepress.com/terms
and incorporate the Creative Commons Attribution
- Non Commercial (unported, 4.0) License.
By accessing the work you hereby accept the Terms. Non-commercial uses of the work are permitted
without any further permission from Dove Medical Press Limited, provided the work is properly
attributed. For permission for commercial use of this work, please see paragraphs 4.2 and 5 of our Terms.
© 2025 The Author(s). This work is published and licensed by Dove Medical Press Limited. The
full terms of this license are available at https://www.dovepress.com/terms
and incorporate the Creative Commons Attribution
- Non Commercial (unported, 4.0) License.
By accessing the work you hereby accept the Terms. Non-commercial uses of the work are permitted
without any further permission from Dove Medical Press Limited, provided the work is properly
attributed. For permission for commercial use of this work, please see paragraphs 4.2 and 5 of our Terms.