Back to Journals » Clinical Ophthalmology » Volume 15
Intrasession and Intersession Variabilities of Intraocular Pressure Measured by Noncontact Tonometer in Normal Volunteers
Authors Tatara S ![]() , Maeda F
, Maeda F ![]() , Tsukahara Y, Handa T
, Tsukahara Y, Handa T ![]() , Yaoeda K
, Yaoeda K
Received 30 September 2021
Accepted for publication 9 November 2021
Published 23 November 2021 Volume 2021:15 Pages 4507—4512
DOI https://doi.org/10.2147/OPTH.S342014
Checked for plagiarism Yes
Review by Single anonymous peer review
Peer reviewer comments 3
Editor who approved publication: Dr Scott Fraser
Shunya Tatara,1,2 Fumiatsu Maeda,1,3 Yoshinosuke Tsukahara,4 Tomoya Handa,2,5 Kiyoshi Yaoeda3,6,7
1Department of Orthoptics and Visual Sciences, Faculty of Medical Technology, Niigata University of Health and Welfare, Niigata, Japan; 2Department of Vision Science, Faculty of Sensory and Motor Control, Kitasato University Graduate School of Medical Science, Sagamihara, Kanagawa, Japan; 3Field of Orthoptics and Visual Sciences, Major in Medical and Rehabilitation Sciences, Niigata University of Health and Welfare Graduate School, Niigata, Japan; 4Department of Ophthalmology, University of Yamanashi, Chuo, Yamanashi, Japan; 5Orthoptics and Visual Science, Department of Rehabilitation, School of Allied Health Sciences, Kitasato University, Sagamihara, Kanagawa, Japan; 6Department of Ophthalmology, Yaoeda Eye Clinic, Nagaoka, Niigata, Japan; 7Division of Ophthalmology and Visual Sciences, Niigata University Graduate School of Medical and Dental Sciences, Niigata, Japan
Correspondence: Shunya Tatara
Department of Orthoptics and Visual Sciences, Faculty of Medical Technology, Niigata University of Health and Welfare, 1398 Shimami-cho, kita-ku, Niigata-shi, Niigata, 950-3198, Japan
Tel/Fax +81 25 257 4752
Email [email protected]
Purpose: Intraocular pressure (IOP) measured using a noncontact tonometer is evaluated by performing multiple measurements because IOP is affected by the ocular pulse. We investigated the relationship between value fluctuations in multiple measurements during noncontact tonometer measurements and cardiac rate.
Materials and Methods: Forty-two healthy subjects were included and IOP was measured using a noncontact tonometer. The measurement was performed three times each for the right eye and the left eye, for a total of six times. Blood pressure and cardiac rate were measured at the same time as the IOP measurement. Using repeated-measures analysis of variance, we examined whether the measured IOP and cardiac rate fluctuate throughout the day over the course of 4 days.
Results: There was a fluctuation in the IOP in a sequence only on day 1 of the four measurement days (P < 0.001). The IOP on day 1 tended to be high for the first and second measurements (P = 0.0111– 0.0015). Systolic blood pressure and diastolic blood pressure did not fluctuate over the 4 days (P = 0.6247 and 0.7132), but cardiac rate was high only on day 1 (P = 0.0276).
Conclusion: The IOP on day 1 tended to be high in the first and second measurements. The IOP measured on days 2– 4 did not fluctuate during the sequence of measurements. The cardiac rate measured at the same time as the IOP was high only on the first day.
Keywords: intraocular pressure, noncontact tonometer, blood pressure, cardiac rate, repeated measurement
Introduction
Glaucoma is damage to the optic nerve and visual field, and this damage is essentially progressive and irreversible.1 The most important risk factor for the development and progression of glaucoma is high intraocular pressure (IOP). Evidence-based treatment for glaucoma is to lower the IOP;2 therefore, accurately measuring IOP is critical. The gold standard for IOP measurement is the Goldmann applanation tonometer (GAT),3 which is regarded as the most accurate method of measuring IOP. The simplest and most used tonometer is the noncontact tonometer (NCT), which has the advantages of noncontact with the eye and easy measurement, whereas its limitation is that ocular pulse can influence its results due to the short measurement time.4–6
The IOP measured by either GAT or NCT reportedly fluctuates depending on the order of measurement and the number of measurements in the right and left eyes, so it is necessary to take this into account to measure IOP accurately. Yaoeda et al7 reported that when IOP was continuously measured using GAT on the same day for primary open-angle glaucoma, the IOP decreased with the number of measurements. Bhorade et al8 regularly measured IOP with GAT for 60 months to study ocular hypertension and found out that the IOP gradually decreased over the course of the study. Pekmezci et al9 reported that the IOP measured in the first eye was higher than that measured in the other eye regardless of which eye was measured first. Conversely, according to Maeda et al,10 the IOP measured using NCT on day 1 was lower than that measured on days 2–5. The reason for this observation was that the measurement was repeated until the results of three measurements within 3 mmHg of each other were obtained. Maeda et al reported that it is possible that the high IOP generated by anxiety and tension during the first measurement is not replicated at subsequent measurements and becomes lower as the measurement is repeated.
It has been reported that stress increases IOP in humans.11 Although the exact reason for this remains unclear, one possible explanation is sympathetic hyperactivity. In addition, meta-analyses have reported a trend toward higher IOP with higher blood pressure.12 Given the effect of ocular pulse, NCT measurements are recommended to be repeated until a value within 3 mmHg can be measured three times. However, Maeda et al10 suggested that the measured values may be underestimated because of repeated measurements.
In this study, we examined changes in IOP during sequential IOP measurements by NCT over the course of a day. In addition, by measuring blood pressure and cardiac rate at the same time as IOP was measured, the effect of the autonomic nervous system of the subjects on IOP was examined.
Materials and Methods
Subjects
The subjects included 42 university student volunteers that had no eye diseases or blood pressure abnormalities. In this study, the 84 eyes of these 42 healthy subjects (34 women and 8 men) were analyzed. The mean age of the study participants was 21.4 years (standard deviation, 0.3 years; range, 22.3–20.8 years).
Methods
This study was conducted over 4 days from February 15 to February 18, 2021. IOP was measured with NCT (CT-1; Topcon Corporation, Tokyo, Japan) in the fully automatic mode. On each day, the ocular axis, anterior chamber depth, lens, central corneal thickness, and corneal radius were measured using an optical coherence biometer (OA-2000; Tomey Corporation, Aichi, Japan) before IOP measurement. Following IOP measurement, refraction was measured with an auto ref-keratometer (ARK-1; Nidek Corporation, Aichi, Japan). Systolic blood pressure (SBP), diastolic blood pressure (DBP), and cardiac rate were measured with a sphygmomanometer (UA-772K; A&D Medical, Tokyo, Japan). Blood pressure measurements were taken at the same time as the first IOP measurement on each day. The experimental design is shown in Figure 1. All measurements such as NCT were done between 11:00 and 12:00 each day for four consecutive days to reduce the effects of diurnal variations on IOP.13,14 In addition, the subjects did not exercise or smoke, which affect IOP and blood pressure, before the measurements were taken.
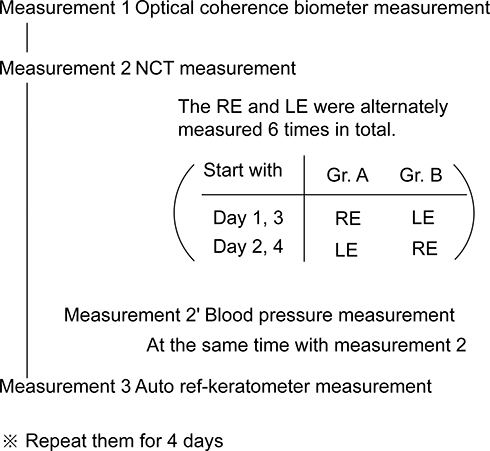 |
Figure 1 Flowchart of the experimental design. The same measurement was repeated for 4 days. The noncontact tonometer measurement order of the right and left eyes was changed depending on the day. For example, in group A, on day 1, the first measurement was of the right eye, and then the left eye was measured. After that, the right and left eyes were examined alternately. On day 2, the first measurement was on the left eye. Then, the right and left eyes were measured alternately. In group B, the measuring order for the right and left eyes was opposite to that in Group A. Abbreviations: RE, right eye; LE, left eye; Gr. A, group A; Gr. B, group B; NCT, noncontact tonometer. |
Intraocular Pressure Measurement
IOP was measured three times in the right eye and three times in the left eye on each day. One ejection of air was regarded as one IOP measurement. The IOP measurement was started in full auto mode by a certified orthoptist when the subjects were positioned with their head on a chin rest and the setting was completed. The IOP measurement was taken when the subject was in a seated position, and the subject did not take their head off the chin rest until a total of six IOP measurements were completed, which were taken alternately for the right and left eyes. The IOP of the first measured eye is typically high,9 so the subjects were randomly divided into Groups A and B to avoid this effect. Based on the results of t-tests, no significant difference in subject characteristics was observed between the groups, and there were no factors that affected the results for these groups. For Group A, on day 1, the first measurement was of the right eye, and then the left eye was measured. After that, the right and left eyes were examined alternately. In contrast, for Group B, on day 1, the first measurement was on the left eye, and then the right eye was measured. After that, the left and right eyes were examined alternately. On day 2, in both groups, the first measurement was recorded from the eye opposite to the eye measured on the previous day. Then, the right and left eyes were measured alternately. On days 3 and 4, the right and left eyes were measured in a different order from the previous day.
Statistical Analysis
To compare characteristics between the successive measurements (days 1–4), one-way repeated-measures analysis of variance (ANOVA) was used. A paired t-test was used to compare the IOP between the left and right eyes. Repeated-measures ANOVA and Bonferroni correction for multiple comparisons were used to compare the six IOP measurements (three for right and three for left) taken on each day. Statistical analyses were performed with MedCalc version 19.1.3 (MedCalc Software Bvba, Mariakerke, Belgium). A P-value < 0.05 was considered to indicate statistical significance. All values are presented as average [confidence interval (CI)] unless otherwise stated.
Ethics Approval and Consent to Participate
This study was conducted under the approval of the Niigata University of Health and Welfare committee (18530-201106). The experiment was conducted in accordance with the Declaration of Helsinki, and written informed consent was obtained from all subjects.
Results
There were no dropouts in this study, and all subjects completed the experiment according to the stated methods. Subject characteristics and comparisons of successive measurements (days 1–4) are shown in Table 1. There were no significant differences in ocular axis, anterior chamber depth, lens, central corneal thickness, corneal radius, or refraction from day 1 to 4. There was also no significant difference in the mean values of IOP measured three times in each eye from day 1 to 4. The results of comparing the mean IOP measured three times for each eye are shown in Table 2. There was no significant difference in IOP between the right and left eyes on any of the days from day 1 to 4. Therefore, IOP was subsequently combined without distinguishing whether the measurement came from the right or left eye in later analyses. The results of the six IOP measurements on each day in the order of measurement are shown in Figure 2. IOP on day 1 showed a tendency to decrease with the number of measurements (repeated-measures ANOVA, P < 0.0001). Figure 3 shows SBP, DBP, and cardiac rate measured using a sphygmomanometer. There was no significant difference in blood pressure from day 1 to 4 for either SBP (repeated-measures ANOVA, P = 0.707) or DBP (repeated-measures ANOVA, P = 0.640), whereas the cardiac rate tended to be higher on day 1 (repeated-measures ANOVA, P = 0.007).
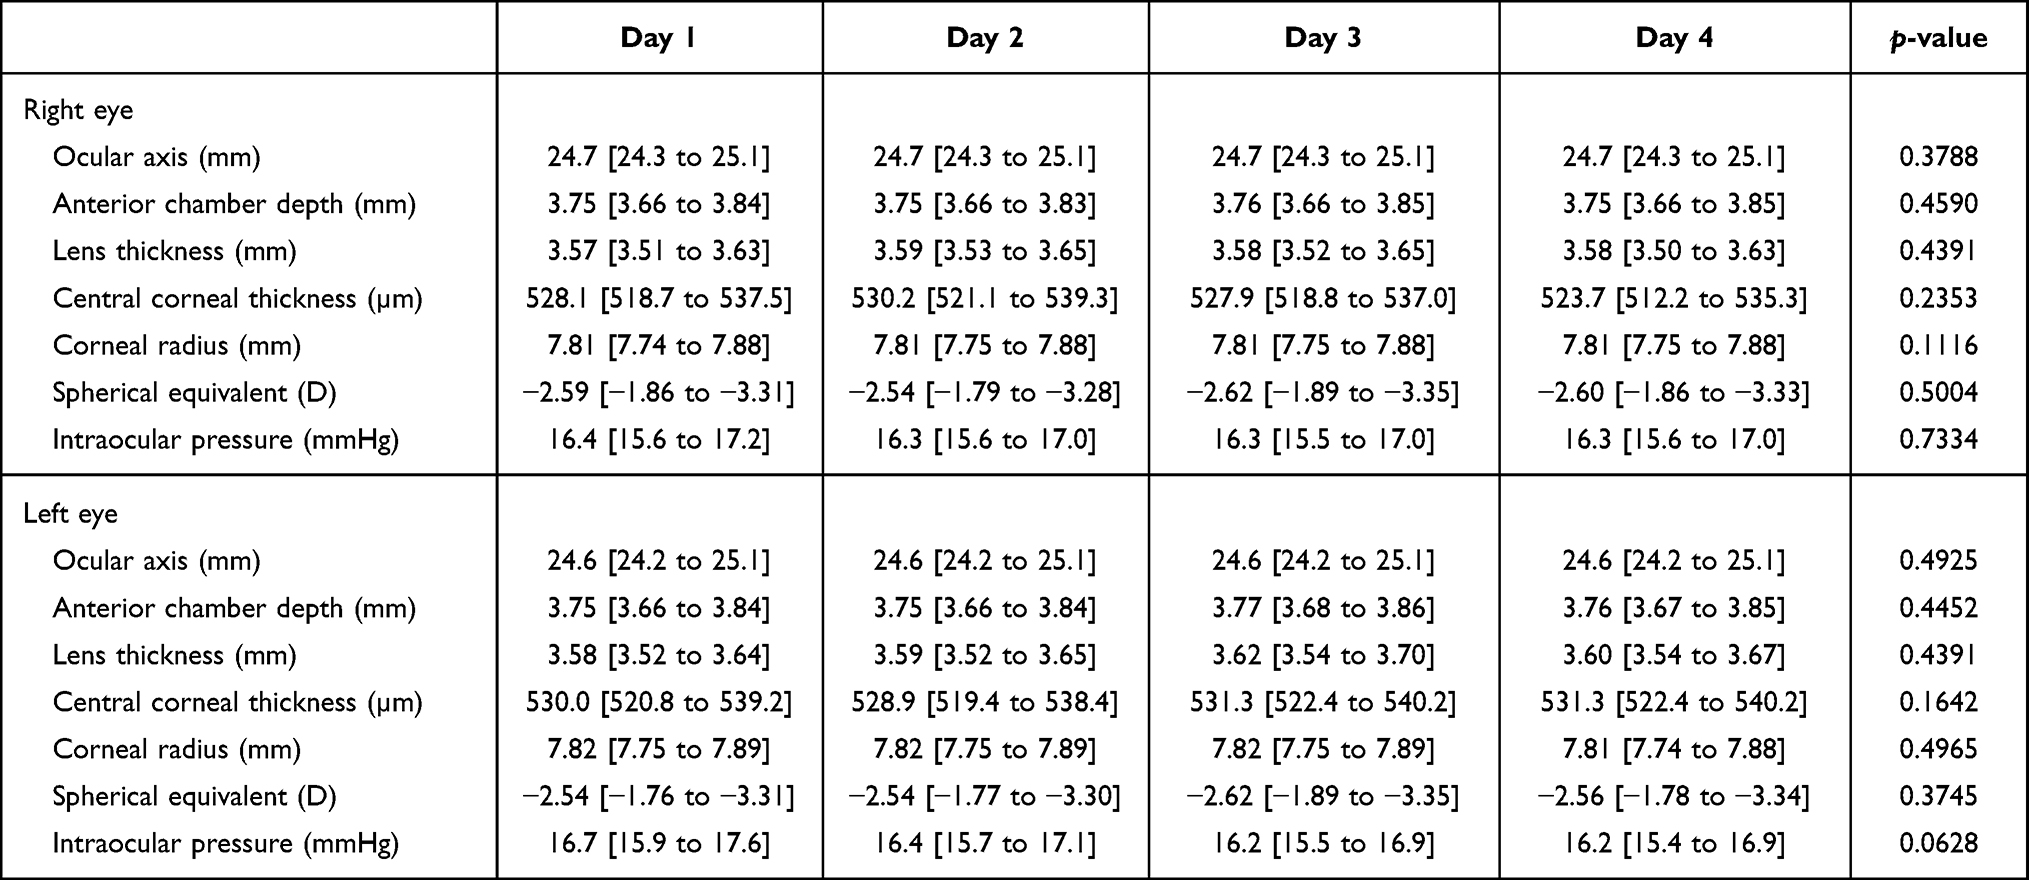 |
Table 1 Subject Characteristics |
 |
Table 2 Comparison of the Right and Left Eye Intraocular Pressures (mmHg) |
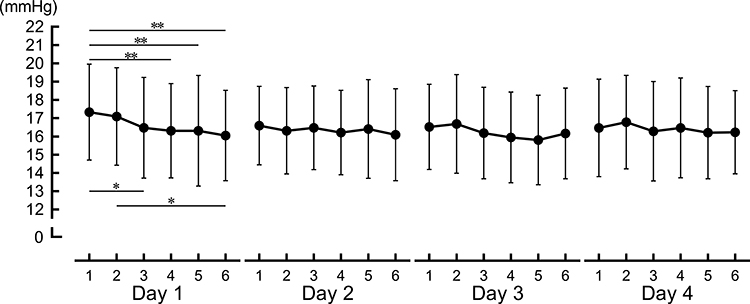 |
Figure 2 Intraocular pressure on each day arranged in measurement order. The results of six intraocular pressure (IOP) consecutive measurements each day are shown in measurement order. Each plot shows the IOP value obtained in one air ejection. Error bars show the standard deviation. The numbers on the X-axis indicate the measurement order as a result of the IOP measured six times each day. In the one-way repeated-measurement analysis, there was a significant difference in the IOP measured among the six measurements recorded on day 1, and there was no significant difference in those recorded on days 2−4. In the one-way repeated-measures analysis of variance with Bonferroni correction, the IOP measured for the first time on day 1 was significantly higher than that during the third and sixth measurements. The IOP measured the second time on day 1 was significantly higher than the IOP measured the sixth time. *P < 0.05, **P < 0.01. |
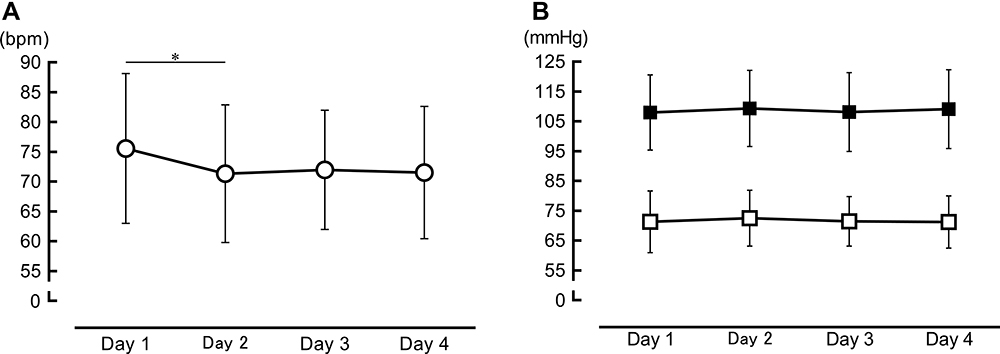 |
Figure 3 Cardiac rate and blood pressure on each day. Cardiac rate and blood pressure were measured with a sphygmomanometer. Error bars show the standard deviation. (A) In the one-way repeated-measures analysis of variance, the cardiac rate was significantly different over the 4 days. As a result of multiple comparisons with a Bonferroni correction, the cardiac rate on day 1 was higher than that on day 2. (B) The black squares indicate systolic blood pressure, and the white squares indicate diastolic blood pressure. In the one-way repeated-measures analysis of variance, systolic and diastolic blood pressures were not significantly different over the 4 days. *P < 0.05. |
Discussion
In this study, IOP was measured using NCT over four consecutive days. This is the first study to investigate the intrasession and intersession variability in IOP measured by NCT. The results showed that there was a difference in sequentially measured IOP on day 1, with a tendency toward decreased IOP as the number of measurements increased. In addition, blood pressure and cardiac rate were measured at the same time as IOP, and the results also showed that the cardiac rate was high on day 1.
IOP reportedly decreases with repeated measurements, whether during the same day or on different days.7–9 However, these studies were conducted using GAT, whereas there are few reports on repeated measurements of NCT. This is unsurprising, with GAT being the gold standard for IOP measurement.3 The reason the gradual decrease in IOP with repeated measurements in GAT is thought to be an effect of an expansion of the anterior chamber angle due to corneal indentation and the accompanying acceleration of aqueous humor drainage. The corneal applanation time of NCT is 1–3 msec, with only a small mechanical applanation. Maeda et al10 reported that the IOP on day 1 of five consecutive days of measurements using NCT was low. That study reported that the reason for this could be a gradual decrease in IOP due to the multiple measurements taken to obtain three IOP results within 3 mmHg. With the effect of ocular pulse, it is advisable to take NCT measurements until the results within 3 mmHg are repeated three times. In our study, we measured IOP sequentially six times (three for the right eye and three for the left eye), and IOP measurements were taken every day for 4 days. As a result, only on day 1, the IOP measured at the beginning of the sequence of measurements tended to be high. Therefore, our results support the theory reported by Maeda et al10 that repeated measurements of IOP within a single sequence result in progressively lower IOP. With the NCT applanation time of 1–3 msec, mechanical applanation is unlikely. As such, it is conceivable that there are factors other than invasive effects on IOP.
In this study, we measured blood pressure and cardiac rate at the same time as IOP in anticipation of the possibility of psychological influences such as anxiety and nervousness of the subjects on the first IOP measurement. For blood pressure, there was no difference in either SBP or DBP between days 1–4. The pooled average increase in IOP associated with a 10-mmHg increase in SBP was 0.26 mmHg (95% CI 0.23 to 0.28), and the average increase associated with a 5-mmHg increase in DBP was 0.17 mmHg (95% CI 0.11 to 0.23).12 Blood pressure did not affect IOP in this study, as we did not observe a change in blood pressure during days 1–4. In contrast, the cardiac rate was higher only on day 1. It is conceivable that this higher cardiac rate was due to the nervousness of the subjects during the first measurements. It is unclear whether a higher cardiac rate is directly responsible for higher IOP.6 However, there was reportedly a positive correlation between stress scores and IOP in women measured with NCT.11 Although the exact reason for this remains unclear, one possible explanation is sympathetic hyperactivity. Additionally, it is conceivable that having air blown into the subject’s eyes with the machine close to the eye at the time of IOP measurement led to higher IOP values. Kataoka et al15 reported that stress enhances sympathetic nerves and increases the cardiac rate. On day 1, the subjects were not accustomed to having their IOP measured, which may result in high IOP values. Moses and Liu16 reported that subjects become acclimated to IOP measurements. It is conceivable that subjects gradually become accustomed to the stress of having air blown into their eyes. In this context, the stress of having air blown into the eyes was expectedly lessened for days 2–4, with less fluctuation in IOP during the day.
NCT is reportedly as reliable as GAT in subjects with normal IOP.17 However, the results of this study suggest that IOP measured using NCT might be inaccurate until the patient becomes accustomed to the measurement and anxiety is reduced. The first day’s inaccurate IOP is common whether the measurements are taken in the way recommended by the NCT, which is to repeat the measurements until three IOP values within 3 mmHg are measured,10 or whether only six measurements are taken in a single sequence. In IOP evaluations, it is therefore preferable to utilize the results after the second visit rather than those taken at the first visit. IOP measured using NCT may be useful in determining the baseline for glaucoma treatment. In total, care should be taken when referring to the IOP at the time of the initial examination. Similar studies should be conducted using other tonometers.
This study has a few limitations. First, the results might have been influenced by ocular pulse and diurnal IOP fluctuations. NCT results reportedly vary by 1–3 mmHg due to the influence of ocular pulse.4 In this study, to reduce the effect of diurnal variation in IOP, measurements were done within an hour; however, diurnal variation of IOP cannot be avoided. Therefore, a small error is introduced in the measurement. Second, because of the single-center design, some bias may be present. There was an unequal gender distribution of subjects in this study; the fact that there were more female subjects than males may have influenced our results. In addition, the range of ages was narrow, with university students used as the subjects. Therefore, it is unclear whether the same results can be obtained when older people are evaluated.
Conclusion
The results of this study suggest that IOP measured using NCT may be inaccurate on the first day of measurement. IOP tended to be higher on the first measurement on day 1. The IOP measured on days 2–4 was stable during all six measurements. Blood pressure and cardiac rate were measured at the same time as IOP, resulting in a high cardiac rate only on day 1.
Disclosure
KY received nonfinancial support from Alcon Japan Ltd., Novartis Japan Ltd., Otsuka Pharmaceutical Co., Ltd., Santen Pharmaceutical Co., Ltd., and Senju Pharmaceutical Co., Ltd. The authors report no other conflicts of interest in this work.
References
1. Coleman AL. Glaucoma. Lancet. 1999;354:1803–1810. doi:10.1016/S0140-6736(99)04240-3
2. GROUP CN-TGS. Comparison of glaucomatous progression between untreated patients with normal-tension glaucoma and patients with therapeutically reduced intraocular pressures. Collaborative Normal-Tension Glaucoma Study Group. Am J Ophthalmol. 1998;126:487–497. doi:10.1016/S0002-9394(98)00223-2
3. Goldmann H, Schmidt T. Applanation tonometry. Ophthalmologica. 1957;134:221–242. doi:10.1159/000303213
4. Forbes M, Pico G
5. Yaoeda K, Shirakashi M, Fukushima A, et al. Measurement of intraocular pressure using the NT-4000: a new non-contact tonometer equipped with pulse synchronous measurement function. J Glaucoma. 2005;14:201–205. doi:10.1097/01.ijg.0000159120.03747.48
6. Queirós A, González-Méijome JM, Fernandes P, et al. Non-contact tonometry synchronized with cardiac rhythm and its relationship with blood pressure. Ophthalmic Physiol Opt. 2006;26:384–391. doi:10.1111/j.1475-1313.2006.00374.x
7. Yaoeda K, Fukushima A, Shirakashi M, et al. Factors associated with fluctuations in repeated measurements of intraocular pressure using the Goldmann applanation tonometer in Japanese patients with primary open-angle glaucoma. Clin Ophthalmol. 2018;12:1473–1478. doi:10.2147/OPTH.S174277
8. Bhorade AM, Gordon MO, Wilson B, et al. Variability of intraocular pressure measurements in observation participants in the ocular hypertension treatment study. Ophthalmology. 2009;116:717–724. doi:10.1016/j.ophtha.2008.12.036
9. Pekmezci M, Chang ST, Wilson BS, et al. Effect of measurement order between right and left eyes on intraocular pressure measurement. Arch Ophthalmol. 2011;129:276–281. doi:10.1001/archophthalmol.2011.33
10. Maeda F, Yaoeda K, Tatara S, et al. Evaluation of changes in intraocular pressure with a noncontact tonometer in healthy volunteers. Clin Ophthalmol. 2020;14:3635–3640. doi:10.2147/OPTH.S281227
11. Yamamoto K, Sakamoto Y, Irie M, et al. The relationship between IMPS-measured stress score and intraocular pressure among public school workers. J Physiol Anthropol. 2008;27:43–50. doi:10.2114/jpa2.27.43
12. Zhao D, Cho J, Kim MH, et al. The association of blood pressure and primary open-angle glaucoma: a meta-analysis. Am J Ophthalmol. 2014;158:615–627.e9. doi:10.1016/j.ajo.2014.05.029
13. Hughes E, Spry P, Diamond J. 24-hour monitoring of intraocular pressure in glaucoma management: a retrospective review. J Glaucoma. 2003;12:232–236. doi:10.1097/00061198-200306000-00009
14. Nakakura S, Nomura Y, Ataka S, et al. Relation between office intraocular pressure and 24-hour intraocular pressure in patients with primary open-angle glaucoma treated with a combination of topical antiglaucoma eye drops. J Glaucoma. 2007;16:201–204. doi:10.1097/IJG.0b013e31802ff85f
15. Kataoka N, Hioki H, Kaneko T, et al. Psychological stress activates a dorsomedial hypothalamus-medullary raphe circuit driving brown adipose tissue thermogenesis and hyperthermia. Cell Metab. 2014;20:346–358. doi:10.1016/j.cmet.2014.05.018
16. Moses RA, Liu CH. Repeated applanation tonometry. Am J Ophthalmol. 1968;66:89–91. doi:10.1016/0002-9394(68)91794-7
17. Ogbuehi KC. Assessment of the accuracy and reliability of the Topcon CT80 non-contact tonometer. Clin Exp Optom. 2006;89:310–314. doi:10.1111/j.1444-0938.2006.00068.x
 © 2021 The Author(s). This work is published and licensed by Dove Medical Press Limited. The
full terms of this license are available at https://www.dovepress.com/terms
and incorporate the Creative Commons Attribution
- Non Commercial (unported, 3.0) License.
By accessing the work you hereby accept the Terms. Non-commercial uses of the work are permitted
without any further permission from Dove Medical Press Limited, provided the work is properly
attributed. For permission for commercial use of this work, please see paragraphs 4.2 and 5 of our Terms.
© 2021 The Author(s). This work is published and licensed by Dove Medical Press Limited. The
full terms of this license are available at https://www.dovepress.com/terms
and incorporate the Creative Commons Attribution
- Non Commercial (unported, 3.0) License.
By accessing the work you hereby accept the Terms. Non-commercial uses of the work are permitted
without any further permission from Dove Medical Press Limited, provided the work is properly
attributed. For permission for commercial use of this work, please see paragraphs 4.2 and 5 of our Terms.