Back to Journals » Clinical Ophthalmology » Volume 19
Intraocular Pressure Equations Utilizing Aqueous Fluid Flow and Flow Facility in the Steady-State and Time-Dependent Domains
Authors Mccafferty S ![]() , Berdahl J
, Berdahl J ![]()
Received 19 May 2025
Accepted for publication 7 August 2025
Published 22 August 2025 Volume 2025:19 Pages 2901—2911
DOI https://doi.org/10.2147/OPTH.S531475
Checked for plagiarism Yes
Review by Single anonymous peer review
Peer reviewer comments 2
Editor who approved publication: Dr Scott Fraser
Video abstract presented by Mccafferty.
Views: 168
Sean Mccafferty,1 John Berdahl2
1Arizona Eye Consultants, University of Arizona, Ophthalmology, Tucson, AZ, 85710, USA; 2Vance Thompson Vision, Sioux Falls, SD, USA
Correspondence: Sean Mccafferty, Email [email protected]
Purpose: Enhanced understanding of intraocular pressure (IOP) dynamics by developing models improving upon foundational work in both steady-state and time-dependent domains.
Methods: Two novel base equations are developed describing IOP dependent upon aqueous fluid flow into and out of the eye. The equations incorporate the parameters of fluid facility, venous and arteriolar pressures as well as initial and steady-state IOP. Basic validation was completed replicating existing glaucoma interventional studies. Equation 1 is a steady-state approximation of equilibrium between linear inflow and outflow facilities whose intercepts are the arteriolar intercept pressure and venous pressure, respectively. Equation 2 is a time-dependent approximation of IOP from an initial IOP also incorporating two or more inflow and outflow facilities as well as the steady-state solution.
Results: The steady-state equation was validated by replicating the results of a published IOP efficacy study of combined netarsudil and latanoprost treatment results with a 3% error. The time-dependent equation was validated by replicating a published study examining mean time response of latanoprost IOP reduction to steady-state with an 8% error.
Discussion: The combined steady-state and time-dependent IOP equations enable IOP equilibrium modeling incorporating inflow and outflow facility and the effects of arteriolar and venous pressures. Validation demonstrates applicability of the model with added interventional outflow and time-dependent IOP responses. Enhanced IOP equations provide a novel framework for modeling IOP dynamics. Potential applications include understanding IOP pathophysiology, evaluating therapeutic interventions, and predicting temporal/diurnal IOP fluctuations.
Keywords: glaucoma, ocular hypertension, IOP, intraocular pressure, Goldmann equation, aqueous humor mechanics, diurnal IOP variation, outflow facility, inflow facility, arteriolar pressure, episcleral venous pressure, aqueous humor dynamics, intracranial hypertension, aqueous equilibrium
Precis
An update to the original Goldmann equation incorporating alterations in flow facilities and venous/arteriolar pressure allowing intraocular pressure prediction from the combined effect of specific glaucoma disease processes and glaucomatous interventions.
Introduction
The teaching of students, residents, and vision scientists on aqueous humor mechanics and IOP has included a basis in the Goldmann Equation for over half a century (equation 1). This equation was developed and still used today to predict the steady-state aqueous equilibrium of a normal eye in which the fluid into the eye was assumed to be constant with respect to IOP.1

Where;
IOP = Intraocular pressure in mmHg,
F = fluid inflow µL/min.,
C = outflow facility µL/min/mmHg,
Pv = episcleral venous pressure mmHg
The Goldmann approximation of aqueous fluid flow is depicted in Figure 1 where the aqueous inflow is constant with respect to pressure and aqueous outflow is linearly predicted by the intercept of venous pressure and slope of outflow facility.
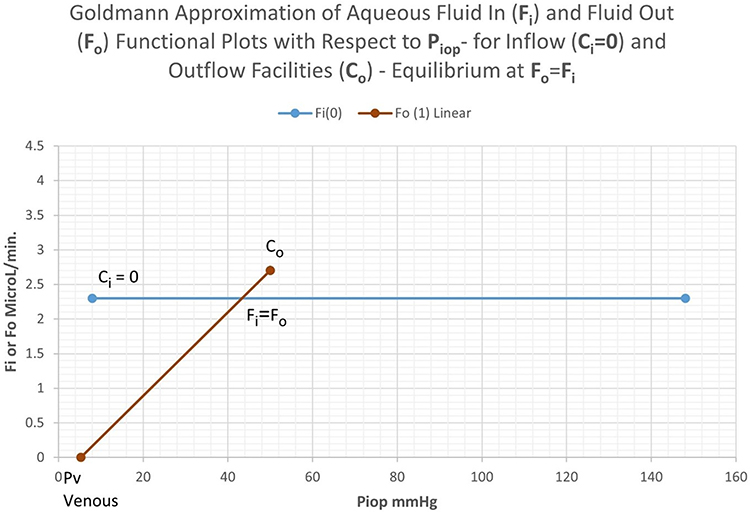 |
Figure 1 Graphical representation of the Goldmann equation where IOP equilibrium is denoted by the intersection of the lines of fluid in and fluid out. |
Since the time of Goldmann, not only has our understanding of aqueous dynamics evolved to include fluid in and fluid out and their related “facilities” or inverse resistances, but now we have a multitude the devices and pharmacologics which alter all aspects of fluid flow and resistance to that flow. Additionally, our understanding of aqueous dynamics has evolved to include the time dependent (non-steady state) importance of IOP to ocular health. Understanding IOP and aqueous humor dynamics requires an updated mathematical description from Goldmann to include inflow facility, arteriolar pressure, and modeling the time dependent variations.
Aqueous inflow is affected by active and passive processes including active transport, secretion and ultrafiltration, including possibly exudative or oncotic formation more so in diseased states with a break down in the blood aqueous barrier.2 Similarly, aqueous outflow occurs through multiple modalities including trabecular and uveoscleral pathway plus others which can vary depending upon a disease state and interventions. Both Goldmann and the present model combine the respective inflow and outflow modalities to a singular quantified “facilty” in order to simplify the equation for practical use.
The classic steady-state Goldmann description is a simplified linear equation with zero order aqueous inflow mechanics. This is an inaccurate description. Many studies have indicated the pressure-dependent slope to aqueous inflow, particularly under the inflow process of ultrafiltration3–5 Moses published the first of many studies in the field of aqueous humor dynamics, particularly the graph in the 7th edition of Adler’s Physiology of the Eye (Figure 2) depicting a pressure-dependent slope to the aqueous inflow curve. Graph 2 illustrates the concept that steady-state intraocular pressure occurs when aqueous humor inflow and outflow are equal.2 Also, the slope of the inflow curve is noted as a differential dFi/dP or the inflow facility Ci, if assumed to be constant.
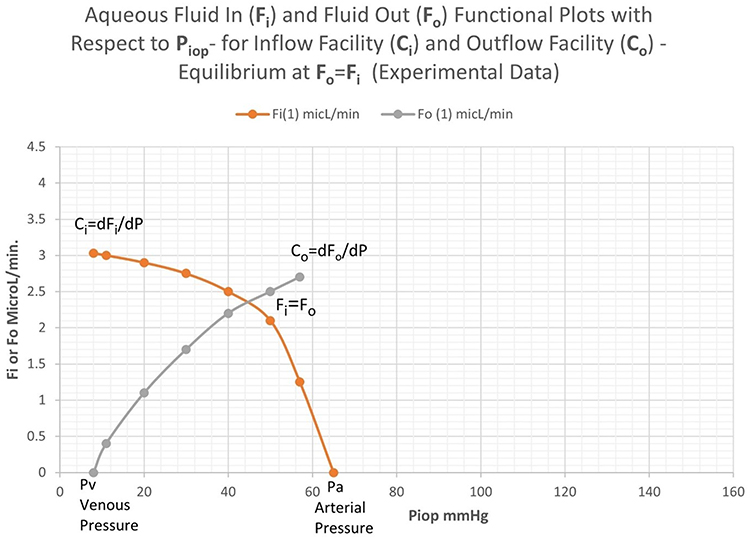 |
Figure 2 Experimental data of ocular inflow and outflow curves with the IOP equilibrium depicted where the two curves intersect. |
Moses first coined the term “inflow facility” noting the negative slope of this entity.4 This has been supported experimentally in the literature.5 The aqueous inflow curve rapidly reduces at high pressure and approaches zero at the systemic mean arteriolar pressure. Likewise, the slope of the outflow curve is noted as a differential dFo/dP or the outflow facility Co, if assumed to be constant.
Methods
The methods overview includes the development of two novel equations describing IOP. The first is a steady-state equilibrium equation, and the second is a time-dependent decay equation to steady-state. The equations are validated by replicating the results of studies in the steady-state and time-dependent cases.6–8
The Steady-State Intraocular Pressure Equation Modification to the Original Goldmann Equation
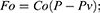
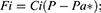
Goldmann’s linear assumptions are reasonably valid in the physiologic range of IOP. Therefore, the same Goldmann outflow equation (2) is used. The inflow equation (3) is a linear fit in the physiologic range below 50 mmHg which is typically significantly below mean arteriolar pressure >65 mmHg. Figure 3 illustrates the linear assumptions. The inflow linearization provides a slope of inflow facility (Ci), unlike Goldmann, and theoretical zero flow x–intercept (Pa*). Pa* is a calculation of the arterial pressure intercept in mmHg and is found experimentally as the slope intercept when Fi= 0
 |
Figure 3 Linear approximation of aqueous outflow and inflow with their respective facilities and intercepts depicting steady-state IOP at their intersection. |
Where;
P = Intraocular pressure in mmHg,
Fo = fluid out µL/min.,
Co = outflow facility µL/min/mmHg,
Pv = episcleral venous pressure mmHg
Where;
P = Intraocular pressure in mmHg,
Fi = fluid in µL/min.,
Ci = inflow facility µL/min/mmHg,
Pa* = Arterial pressure intercept mmHg and is found by experimentally as the slope intercept when Fi= 0
With this linear approach of inflow and outflow, the new IOP equation (Goldmann) based upon aqueous flow at steady-state equilibrium, where Fi = Fo, becomes equation (4)
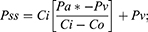
Where;
Pss = Steady-state Intraocular pressure in mmHg,
Co = outflow facility in µL/min/mmHg.,
Ci = inflow facility µL/min/mmHg,
Pa* = Arterial pressure intercept mmHg and is found by experimentally as the slope intercept when Fi= 0
Pv = episcleral venous pressure mmHg.
Combining Multiple Known Interventional Inflow and Outflow Facilities to Determine a New Steady-State IOP
The linear approach to equation (4) with constant inflow and outflow facilities can be modified to model multiple known outflow and inflow facilities. The simplest example of this would be an additional known outflow facility to the natural endogenous ocular outflow facility, such as an added medication or a surgical glaucoma device.
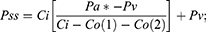
Combining the natural endogenous outflow facility with one or more interventional outflow facilities we can model the predicted effect on intraocular pressure, Pss. Equation 4.1 adds the independent outflow facility to that of a glaucoma intervention. Figure 4 demonstrates the interventional effect on steady-state IOP.
 |
Figure 4 Demonstration of a new aqueous equilibrium IOP, Co(1)+Co(2), from the endogenous outflow, Co(1) added to the interventional outflow Co(2). |
Where;
Pss = Steady-state Intraocular pressure in mmHg,
Co(1) = natural outflow facility in µL/min/mmHg.,
Co(2) = Interventional outflow facility in µL/min/mmHg.,
Ci = inflow facility µL/min/mmHg,
Pa* = Arterial pressure intercept mmHg and is found by experimentally as the slope intercept when Fi= 0
Pv = episcleral venous pressure mmHg.
The Time-Dependent Response Intraocular Pressure Equation
Paul Samuelson describes in “Stability of equilibrium: Comparative statics and dynamics” the basis for the development of time-dependent case.9 The time-dependent Samuelson’s Walrasian treatment is developed below:
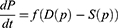


Retaining the first order in the Taylor expansion yields the following differential equation evaluated near equilibrium, P*.
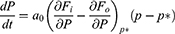
Linearization yields the solution
Note that  is evaluated in the linear region near equilibrium,
  .
.
It is postulated in the partial derivatives that:


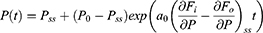
The time-dependent solution yields:

Where;
P(t) = Time-dependent Intraocular pressure in mmHg,
Pss = Steady-state Intraocular pressure in mmHg, eq. (4),
Po = Initial Intraocular pressure in mmHg,
Co = outflow facility in µL/min/mmHg.,
Ci = inflow facility µL/min/mmHg,
 = Time constant mmHg/µL/min. set to =1/60, conversion to hours
This is an exponential decay form provided that


The usefulness of the time-dependent equation can be shown in Figure 5 which clearly relates the inflow facility Ci and the outflow facility Co to a decay toward equilibrium at Pss. In this case, Ci= −0.022 µL/min/mmHg, Co= 0.061 µL/min/mmHg, a0 = 1 mmHg/µL/min, Pss= 23 mmHg and Po= 45 and 15 mmHg, respectively.
The Combined Steady-State and Time-Dependent Equations Used to Determine Diurnal/Cyclical IOP Variation
Many publications have shown diurnal variation in IOP. Most describe an increase in IOP at night. Studies have concomitantly demonstrated a decrease in nocturnal aqueous fluid inflow and a decrease in nocturnal aqueous outflow facility.10 These two observations would tend to work against each other in terms of their effect on nocturnal IOP. Decreased aqueous inflow which has been demonstrated to decrease by about 45% at night and outflow facility has been shown to decrease by about 50%.10 The arterial pressure and venous pressure change minimally in the supine position.11,12 Both the steady-state equation (4) and the time-dependent equation (6) are required for this solution as Pss(t) changes with variation in the aqueous inflow and outflow facility.
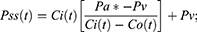
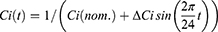
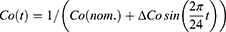
Assuming a sinusoidal variation in outflow facility beginning nominally at 8 am and cycling over the subsequent 24 hours. Likewise, the aqueous inflow which is equivocal to a percent change in inflow facility alters over a 24-hour period, which can also be assumed to sinusoidal starting nominally at 8 am. The following equations account for this diurnal change.
Where;
 time varied change in inflow facility

 fractional amplitude of inflow facility change
 time varied change in outflow facility


t = time in hrs.
Other cyclical equations could be used in lieu of7 and,8 if supported as more appropriate. Equations (7) and (8) are substituted into equation (4) to determine the time-dependent change in steady-state IOP, Pss(t). The time-dependent substituted equation (4.1) Pss(t) is then substituted into equation (6.1)

The equation yields some interesting results depicted in Figure 6 with the same nominal input variables as the above demonstrations but the P0= 23 mmHg and the cyclical amplitudes ΔCi at 50% and 55% and ΔCo were set to 45% and 40%, respectively.10 The diurnal inflow and outflow variation demonstrates a delayed IOP spike in the early morning. The amplitude of the spike is directly related to the difference in cyclic amplitude between the inflow and outflow, ΔCi and ΔCo. When the cyclical variation amplitudes are equal, there is no spike.
 |
Figure 5 Demonstration of the time-dependent decay to steady-state IOP from a given initial condition IOP. |
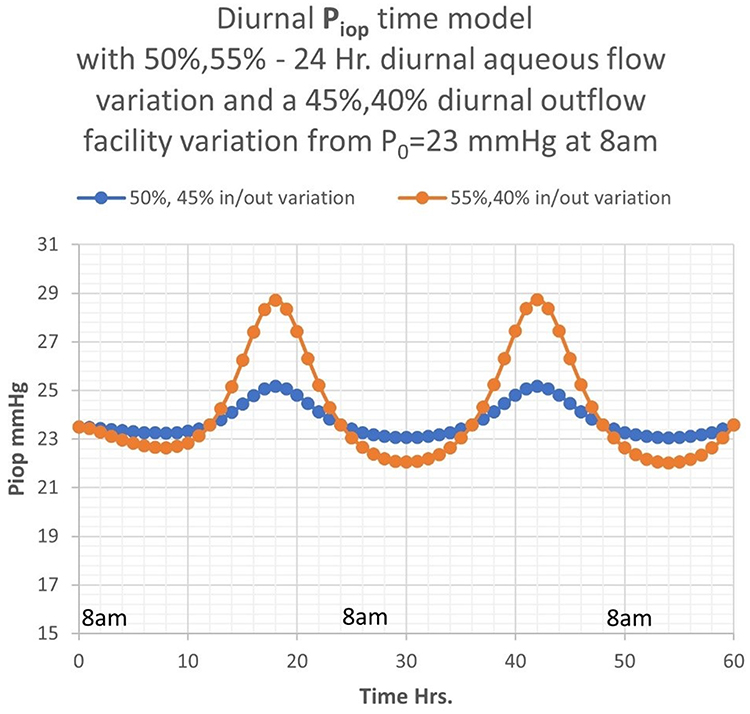 |
Figure 6 Demonstration of diurnal cyclical variation in IOP dependent upon the amplitude differences in diurnal inflow and outflow facility. |
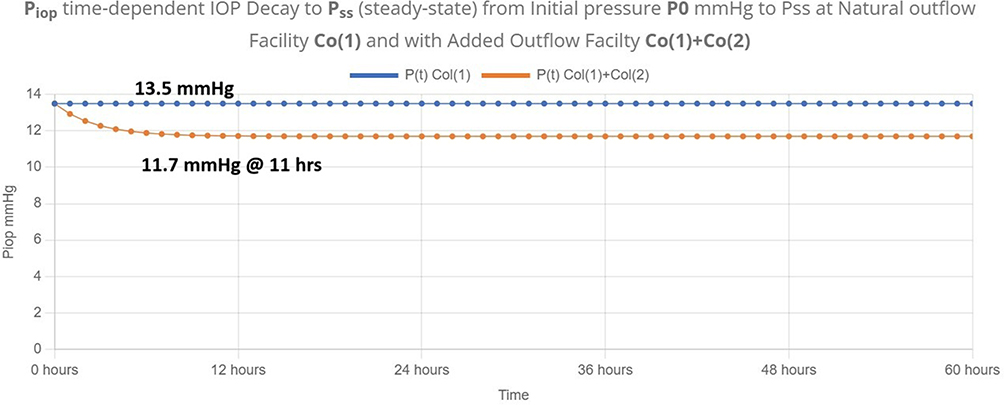 |
Figure 7 Time-dependent decay to steady-state IOP using the mean study parameters. |
Results
The steady-state and time-dependent equations can be validated using many clinical IOP studies with known initial conditions and basic assumption on the mechanisms of action. The steady-state equation should be able to replicate the combined intervention results of the clinical trial, “Netarsudil/latanoprost fixed-dose combination for elevated intraocular pressure: three-month data from a randomized Phase 3 trial”.6 This study was chosen for its simplicity of two glaucoma medications which can be assumed to act predominantly on outflow facility. The study includes the baseline IOPs and the individual as well as combined effect of the medications on IOP. Table 1 summarizes the study’s mean baseline, individual, and combined treatment IOPs. Additionally, Table 1 summarizes the assumed constant inflow facility, episcleral venous pressure, and arteriolar pressure intercept.
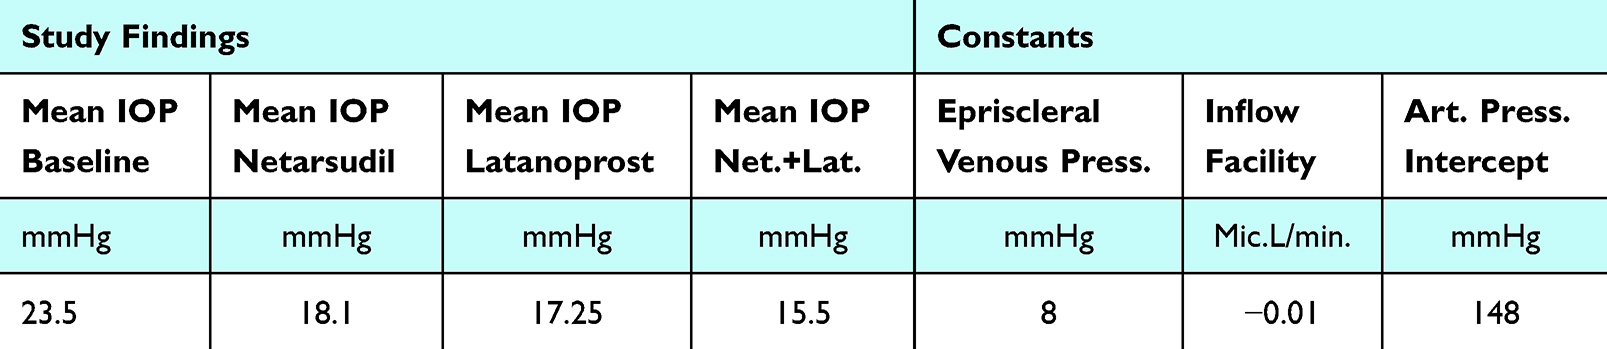 |
Table 1 Steady-State Equation Validation Study Parameters |
The study’s baseline IOP can be used with the constant parameters in Table 1 to calculate the mean endogenous outflow facility in the glaucoma patients enrolled by using equation (4). Additionally, the added individual interventional outflow facilities of netarsudil and latanoprost can be calculated using equation (4.1) from the respective IOP responses in Table 1.7 These facilities are summarized in Table 2.
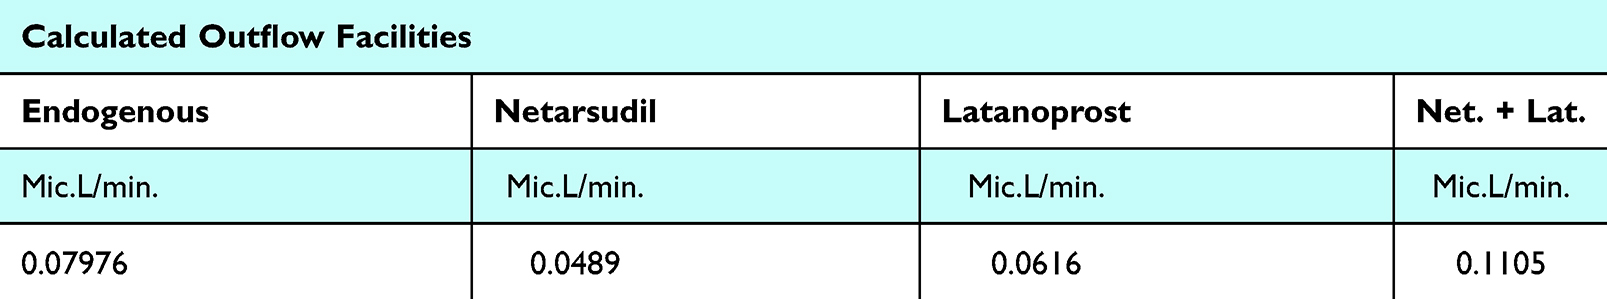 |
Table 2 Calculated Endogenous and Individual Outflow Facilities |
Utilizing equation (4.1), the constants in Table 1 and the calculated outflow facilities in Table 2 predicts the mean study outcome of the combined endogenous and increased outflow facility of both netardusil + latanoprost.7 The model results predicts a mean combined drug IOP reduction to 15.0 mmHg and the study demonstrated a combined drug IOP reduction to 15.5 mmHg. Equation (4.1) model prediction produced a 3% error with the assumption that the arteriolar, venous, and inflow facility are constant.
The time-dependent equation (6) can be validated by reasonably replicating the results of the study, Intraocular pressure over 24 hours after single-dose administration of latanoprost 0.005% in healthy volunteers. A randomized, double-masked, placebo controlled, cross-over single center study.8
This study was chosen as it was a quality placebo control crossover design, which provides a baseline IOP and time to peak IOP reduction with latanoprost modulating outflow facility. Table 3 includes the study baseline IOP and reduced IOP reduction to trough with latanoprost at a maximum effectiveness at 12 hours as well as constant inflow facility, arteriolar, and venous pressure. Equations (4) and (4.1) can be used to calculate the mean endogenous outflow facility and mean latanoprost interventional outflow facility in the study groups, which are 0.2445 µL/min and 0.124 µL/min, respectively.7 Using these combined endogenous and interventional outflow facilities and the constants in Table 3, equation (6) can be used to graph the time-dependent decay to steady-state in Figure 7. The decay to steady-state occurs at hour 11. The study results indicate this same decay at hour 12 which is approximately an 8% error from the observations. If we include the diurnal variation calculation from equation 6.1 we can closely replicate the diurnal response in the time-dependent latanoprost study.8 For brevity, these results are not included. In a similar fashion, the equations can be shown to replicate the results of most quality IOP efficacy studies.
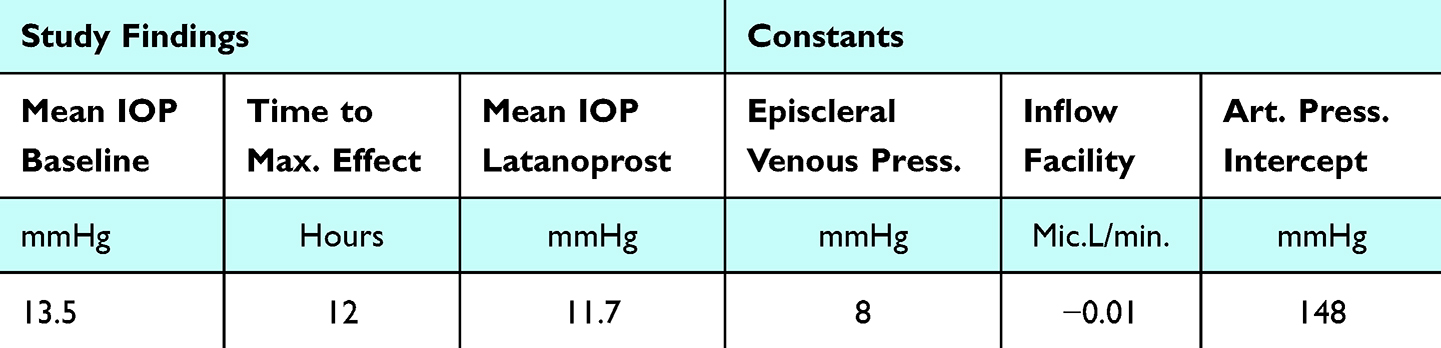 |
Table 3 Time-Dependent Equation Validation Study Parameters |
Discussion
The two equations: 1. steady-state IOP, Eq. (4) and 2. time-dependent IOP, Eq. (6) enable a more complete description of modern ocular fluid mechanics and dynamics. These equations are validated by replicating clinical study finding results. The model/study comparisons were meant to be a basic validation of the equations and not a compendium of all possible combinations. This could be completed with any number of quality clinical IOP studies examining variations in the input parameters. The advantages of the two equations over the historic Goldmann equation include: 1. Calculation of the steady-state IOP incorporating the inflow facility in addition to the standard outflow facility. 2. Modeling glaucomatous and other pressure-related disease states in which pressure dependent altered inflow is affected. 3. Predicting IOP dependence upon systemic arterial pressure which has been demonstrated clinically.13,14 4. Calculate equilibrium IOP due to additional interventional outflow or inflow facilities such as drainage device surgical procedures or pharmacologic interventions. 5. Enabling model prediction of time-dependent IOP responses and its alteration due to pharmacologic and surgical interventions. 6. Calculating probable diurnal and other cyclical variations in IOP.
The model enables a demonstration of IOP response by glaucoma type with a basic understanding of its mechanistic effects and likewise the probable outcome of treatment combinations. Assignments of independent pharmacologic or surgical outflow and inflow facilities allow prediction of the new interventional IOP responses in any possible combination. The equations enable calculation of the interventional facilities by their IOP responses. In practical terms, the equations facilitate its use in a glaucoma pressure calculator, not unlike an intraocular lens calculator.
The mathematical model is developed for demonstrating changes in intraocular pressure, however it is applicable to any closed fluidic system with active pressure-dependent inflow and outflow processes. This can include other physiological processes such as intracranial pressure, which has clinically demonstrated the same diurnal variation and response times.15
Acknowledgments
Eniko Enikov, PhD – University of Arizona, Aerospace and Mechanical Engineering. Anastasio Tsoularis, MS – Leeds Beckett University, Computational Economics. The abstract of this paper was presented at the ARVO conference 2025 as a poster presentation/conference talk with interim findings. The poster’s abstract was published in ‘Poster Abstracts’ in IOVS: https://iovs.arvojournals.org/article.aspx?articleid=2803214
Author Contributions
S.M. – conception, study design, execution, acquisition of data, analysis, and interpretation. J.B. – conception, study design, execution, acquisition of data, analysis and interpretation. All authors made a significant contribution to the work reported, whether that is in the conception, study design, execution, acquisition of data, analysis and interpretation, or in all these areas; took part in drafting, revising, or critically reviewing the article; gave final approval of the version to be published; have agreed on the journal to which the article has been submitted; and agree to be accountable for all aspects of the work.
Funding
There is no funding to report.
Disclosure
Dr Sean Mccafferty reports a patent pending to University of Arizona. The authors report no other conflicts of interest in this work.
References
1. Goldmann H. Outflow pressure, minute volume and resistance of human aqueous flow. Documenta Ophthalmologica. 1951;1:278–356. doi:10.1007/BF00143664
2. Toris C, Gagrani M, Ghate D. Current methods and new approaches to assess aqueous humor dynamics. Exp Rev Ophth. 2021;16:139–160. doi:10.1080/17469899.2021.1902308
3. Moses R. Intraocular Pressure. In: Moses R Editor Adler’s Physiology of the Eye: Clinical Application.
4. Moses R. A Graphic Analysis of Aqueous Humor Dynamics. Am J Ophthalmol. 1972;73:665–669. doi:10.1016/0002-9394(72)90383-2
5. Pederson J, Green K. Aqueous Humor Dynamics: a mathematical approach to facility, pseudofacility, capillary pressure, active secretion and x. Exp Eye Res. 1973;15:265–276. doi:10.1016/0014-4835(73)90146-2
6. Asrani S, Robin AL, Serle JB, et al. Netarsudil/latanoprost fixed-dose combination for elevated intraocular pressure: three-month data from a randomized phase 3 trial. Am J Ophthalmol. 2019;207:248–257. doi:10.1016/j.ajo.2019.06.016
7. CATSIOP - IOP Simulator; 2025 (Ver. 1.0). Accessed April 12, 2025. https://catsiop.com/iop-simulator/.
8. Larsson L. Intraocular pressure over 24 hours after single-dose administration of latanoprost 0.005% in healthy volunteers. A randomized, double-masked, placebo controlled, cross-over single center study. Acta Ophthalmol Scand. 2001;79:567–571. doi:10.1034/j.1600-0420.2001.790604.x
9. Samuelson P. The stability of equilibrium: comparative statics and dynamics. Econometrica. 1941;9:97–120. doi:10.2307/1906872
10. Lui H, Fan S, Gulati V, et al. Aqueous humor dynamics during the day and night in healthy mature volunteers. Arch Ophthalmol. 2011;129:269–275. doi:10.1001/archophthalmol.2011.4
11. Asavama K, Satoh M, Kikuya M. Diurnal blood pressure changes. Hypertension Rsch. 2018;41:669–678. doi:10.1038/s41440-018-0054-0
12. Sattur M, Patel S, Helke K, et al. Head elevation, cerebral venous system, and intracranial pressure: review and hypothesis. Stroke Vasc Interv Neurol. 2023;122:1–6.
13. Yasukawa T, Hanyuda A, Yamagishi A, et al. Relationship between blood pressure and Intraocular pressure int the JPHC-NEXT eye study. Sci Rep. 2022;12(1):17493. doi:10.1038/s41598-022-22301-1
14. Kiel J, Hollingsworth M, Rao R, et al. Ciliary blood flow and aqueous production. Prog Retin Eye Res. 2010;30:1–17. doi:10.1016/j.preteyeres.2010.08.001
15. Mitchell J, Buckham R, Lyons H, et al. Evaluation of diurnal and postural intracranial pressure employing telemetric monitoring in idiopathic intracranial hypertension. Fluids and Barriers CNS. 2022;19:85. doi:10.1186/s12987-022-00384-2
 © 2025 The Author(s). This work is published and licensed by Dove Medical Press Limited. The
full terms of this license are available at https://www.dovepress.com/terms
and incorporate the Creative Commons Attribution
- Non Commercial (unported, 4.0) License.
By accessing the work you hereby accept the Terms. Non-commercial uses of the work are permitted
without any further permission from Dove Medical Press Limited, provided the work is properly
attributed. For permission for commercial use of this work, please see paragraphs 4.2 and 5 of our Terms.
© 2025 The Author(s). This work is published and licensed by Dove Medical Press Limited. The
full terms of this license are available at https://www.dovepress.com/terms
and incorporate the Creative Commons Attribution
- Non Commercial (unported, 4.0) License.
By accessing the work you hereby accept the Terms. Non-commercial uses of the work are permitted
without any further permission from Dove Medical Press Limited, provided the work is properly
attributed. For permission for commercial use of this work, please see paragraphs 4.2 and 5 of our Terms.
Recommended articles
Intraocular Pressure Measurement with Pneumatonometry and a Tonometer Tip Cover During Negative Pressure Application
Brambilla E, Ferguson TJ, Chu N, Ammar D, Yoo P
Clinical Ophthalmology 2022, 16:1289-1300
Published Date: 26 April 2022