Back to Journals » Drug Design, Development and Therapy » Volume 12
Intranasal niosomes of nefopam with improved bioavailability: preparation, optimization, and in-vivo evaluation
Authors Abou-Taleb HA ![]() , Khallaf RA
, Khallaf RA ![]() , Abdel-Aleem JA
, Abdel-Aleem JA ![]()
Received 20 June 2018
Accepted for publication 18 August 2018
Published 17 October 2018 Volume 2018:12 Pages 3501—3516
DOI https://doi.org/10.2147/DDDT.S177746
Checked for plagiarism Yes
Review by Single anonymous peer review
Peer reviewer comments 3
Editor who approved publication: Prof. Dr. Georgios Panos
Heba A Abou-Taleb,1 Rasha A Khallaf,2 Jelan A Abdel-Aleem3
1Department of Pharmaceutics and Industrial Pharmacy, Faculty of Pharmacy, Nahda University (NUB), Beni Suef, Egypt; 2Department of Pharmaceutics and Industrial Pharmacy, Faculty of Pharmacy, Beni-Suef University, Beni Suef, Egypt; 3Department of Industrial Pharmacy, Faculty of Pharmacy, Assiut University, Assiut, Egypt
Objective: One of the greatest challenges drug formulation is facing is poor bioavailability via oral route. In this regard, nasal drug delivery has been commonly used as an alternative route to improve drug bioavailability. Nefopam hydrochloride (NF) is an analgesic drug that suffers from poor bioavailability due to extensive metabolism in liver. Accordingly, the goal of the present study was to improve NF bioavailability via niosomal-based formulation designed for intranasal delivery.
Materials and methods: Vesicles were developed by mixing surfactants (Span 20, Span 40, Span 80, and Span 85) at four molar ratios of 1:1, 1:2, 1:3, and 1:4 of cholesterol to surfactant. Entrapment efficiency, particle size, zeta potential, release percentage, ex-vivo permeation parameters, and niosomes’ stability were determined. Also, the pharmacokinetic parameters of the optimized formula in in-situ gel base were measured in rats.
Results: Niosomes showed entrapment efficiency >80%, particle size <550 nm, and zeta potential ranging from -16.8±0.13 to -29.7±0.15. The produced vesicles showed significantly higher amounts of drug permeated across nasal mucosa (2.5 folds) and prolonged NF release compared with NF solution. Stability studies of optimum formula showed nonsignificant changes in niosomes parameters over a storage period of 6 months. The in-vivo studies showed a 4.77-fold increase in bioavailability of optimized nasal niosomes compared with oral solution of drug.
Conclusion: The obtained results revealed the great ability of the produced NF-loaded niosomes to enhance drug penetration through nasal mucosa and improve its relative bioavailability compared with NF oral solution.
Keywords: nefopam hydrochloride, intranasal permeation, niosomes, optimization, nonopioid analgesics
Introduction
An increasing attention has been given to the nasal route for systemic drug administration, as it offers an alternative pass way for drugs with low oral bioavailability due to their susceptibility to metabolism by gastrointestinal fluids or hepatic enzymes. Nasal route is also a convenient, safe, and noninvasive way of drug delivery. Moreover, nasal route has a quick onset of action compared with other routes (eg, oral and transdermal routes).1
Dosage forms formulators mainly aim to develop delivery systems that can convey the active ingredients with maximum bioavailability and accuracy and minimum side effects to the required site of action.2,3
Nefopam hydrochloride (NF) is a drug that belongs to a class of analgesics that relieve moderate and acute pain. It exerts its mechanism of action in brain and spinal cord by increasing the activity of certain neurotransmitters such as serotonin, dopamine, and norepinephrine, which affects pain signaling. Moreover, it inhibits glutamate release, which is considered a key neurotransmitter involved in the process of pain signaling.4 It exhibits low bioavailability (about 36%) due to its first pass degradation in liver.5,6 The mentioned characters of NF make it a good candidate for uploading onto nano-sized drug delivery systems, which were proved to enhance the bioavailability of many poorly bioavailable drugs.7–11
Niosomes are core–shell systems in which the shell is composed of nonionic surfactants along with stabilizers like cholesterol while the core is usually aqueous.12 Considering nasal delivery, niosomes could be the vesicular system of choice due to 1) their chemical and physical stabilities, which are higher than those of liposomes; 2) their ability to carry both lipophilic and hydrophilic drugs; 3) their nonionic nature, which contributes to their low toxicity; 4) their high permeability through biological membranes; and 5) their biodegradable nature, which contributes to their easy removal from body.13 There are a few reports on formulating NF as advanced drug delivery systems.14 However, NF has not been formulated as intranasal niosomes to the best of our knowledge.
Accordingly, the aim of the current study is to employ niosomes for effective nasal delivery of NF. This novel approach would help deliver NF directly into bloodstream and bypass liver metabolism and hence, improve NF bioavailability.
Materials and methods
Materials
Nefopam HCl powder was a kind gift from Egyptian International Pharmaceuticals Industries Company (EIPICO) (10th of Ramadan, Egypt), Span 20, Span 40, Span 80, Span 85, cholesterol, PBS tablets, acetonitrile, chloroform, methanol, absolute ethanol, and formic acid were purchased from Sigma-Aldrich Co. (St Louis, MO, USA). Potassium dihydrogen orthophosphate, sodium dihydrogen phosphate, disodium hydrogen phosphate, sodium bicarbonate, sodium chloride, calcium chloride dehydrate, and potassium chloride were purchased from El Gomhouria CO. (Cairo, Egypt). All solvents used were of HPLC grade. All other chemicals and reagents used were of analytical or better grade.
Experimental design
Sixteen NF-loaded niosomes formulae were prepared using 42 full factorial design layout using the factors and levels mentioned in Table 1. The studied variables were cholesterol: surfactant ratio (A) and surfactant type (B). Each variable was used in four levels which were determined based on preliminary studies. The responses chosen were entrapment efficiency (EE%; R1), niosomes’ size (R2), cumulative percent NF released after 8 hours (R3), cumulative amount of drug permeated after 24 hours per 1 cm2 of nasal mucosa (Q24; R4), and finally, the permeation coefficient of drug across nasal mucosa (Kp; R5). The design was carried out using Design-expert software (version 10.0.0.3, Manugistics Inc., Rockville, MD, USA). All experiments were carried out in triplicate and sample size was calculated by taking average of the three runs.15,16 The samples were analyzed using one-way ANOVA statistical test. The data were normally distributed, and the distribution was tested with Kolmogorov–Smirnov test.
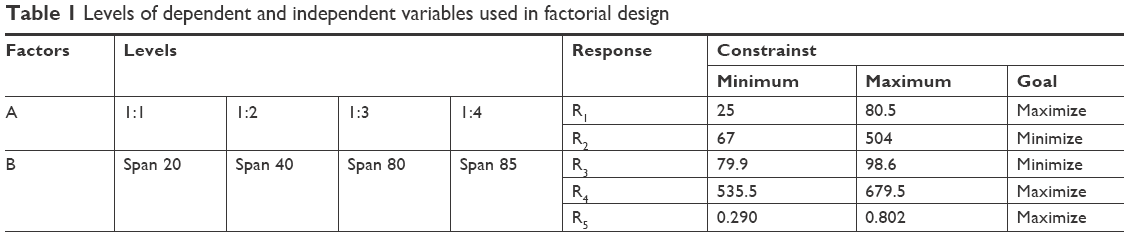 | Table 1 Levels of dependent and independent variables used in factorial design |
NF-loaded niosomes development
NF-loaded niosomes were developed by thin-film hydration method17 as follows: accurately weighed amounts of the Spans and cholesterol in molar ratios of 1:1, 1:2, 1:3, and 1:4 of cholesterol to surfactants, respectively (Table 2), were dissolved in 5 mL of organic solvents mixture (chloroform: methanol [2:1, v/v]). The solvents mixture was evaporated by Stuart rotary evaporator (RE300) equipped with vacuum pump (RE3022C; Stuart Equipment, Staffordshire, UK) to form a thin film on the inner wall of the flask. Thin-film hydration was done using PBS (pH 7.4/10 mL) containing 10 mg of NF at 55°C;18,19 afterward, niosomal suspensions were sonicated for 1 hour at room temperature (Ney ultrasonic cleaner, AS 5150 BD, Jamestown, NY, USA) to reduce the size of produced niosomes. Spans were chosen as emulsifiers as they gave the best thin film after a series of trials using different nonionic surfactants like tweens and brijs.
 | Table 2 Composition of NF-loaded niosomes and the measured responses (means±SD, n=3) |
Characterization of niosomes
Determination of entrapment efficiency
NF-loaded niosomes were isolated from free NF by centrifugation12 at 24,000 rpm for 1 hour (Sigma cooling centrifuge, 3-30 K, Sigma-Elektro, Neustadt an der Weinstrasse, Germany). The pellets were removed, washed twice, and recentrifuged for accuracy. The isolated niosomes were digested using absolute ethanol; then, the produced solution was heated to 60°C to ensure dissolution of any debris of niosomes, cooled to room temperature, and finally centrifuged at 5,000 rpm for 20 minutes. Eventually, 0.1 mL of the supernatant was diluted with PBS (pH 7.4/10 mL) and the amount of NF entrapped was determined using ultra-performance liquid chromatography (UPLC/MS/MS) method with modification.20 The instrument used is composed of an Acquity UPLC™ system (Waters, Milford, MA, USA), a Quattro Premier XE Mass Spectrometer (Waters), Waters Mass Lynx™ software V4.1, and an Acquity UPLC BEH Shield RP18 column, 3.5 μm 4.6×50 mm (Waters). A mixture of acetonitrile and 0.1% formic acid (90:10 %v/v) was used as mobile phase and was introduced into the mass spectrometer’s electrospray ionization chamber with a flow rate of 0.3 mL/min and an injection volume of 150 μL. Tandem mass spectrometry in a positive electrospray ionization mode, using 25 eV cone voltage and 20 eV colliding energy was used to monitor the column effluent. Multiple reaction monitoring mode was employed for the quantification; m/z 253.88 → 180.99 for NF and m/z 342.19 → 112.1 for the internal standard (Sulpiride) with a dwell time of 0.161 seconds per transition. A gas flow rate of 400 L/hour and a gas temperature of 400°C were used.
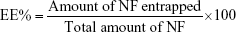
The NF EE% was calculated using Equation (1): 21
|
|
Zeta potential and particle size measurement
Dynamic light scattering technique (Zetasizer Nano ZS, Malvern Instruments, Malvern, UK) was used to measure particle size (PS), polydispersity index (PDI), and zeta potential (ZP) of NF-loaded niosomes. Suspensions of niosomes were diluted with distilled water before assessments.19,22,23 To ensure accuracy; measurements were carried out in triplicate.
Morphology of niosomes
Transmission electron microscope analyzer (JEM AM300F, Jeol, Boston, MA, USA) was used to examine the morphology of NF-loaded niosomes. The instrument was operated at an accelerating voltage of 80 kV. Examination was done by applying one drop of the niosomal suspension on a copper grid, drying the sample, adding one drop of uranyl acetate as a negative stain, then, finally examining the sample to determine the morphology of niosomes.24
In-vitro release study of NF-loaded niosomes
The in-vitro release of NF from NF-loaded niosomes was assessed using a reported method with modification.25 Briefly, vertical Franz diffusion cells with an effective diffusion area of 5 cm2 were employed to perform the in-vitro release studies. Different volumes of NF niosomal suspension containing fixed weights of drug (3 mg) were placed in the cell’s donor compartment.
The receptor compartment contained simulated nasal electrolyte solution (SNES, 50 mL, pH 5.5) as a receptor medium. The SNES was prepared using the following: 7.45 mg/mL NaCl, 1.29 mg/mL KCl, and 0.32 mg/mL CaCl2.2H2O, and finally pH of solution was adjusted at 5.5 using 0.1 N HCl.26
The donor and the receptor compartments were separated by a semipermeable cellulose dialyzing membrane of 12,000 Da molecular weight cutoff. The medium in receptor compartment was stirred by a magnetic bar at 50 rpm for 8 hours and maintained at 37°C±0.5°C. A 1 mL sample was withdrawn at specified intervals, and the dissolution medium was compensated with equal volumes of fresh SNES. The drug release from a control solution of NF (1 mg/mL) was also examined. The drug present in the withdrawn samples was measured using an UPLC/MS/MS method previously mentioned, and the drug release percent was calculated using Equation (2)
|
|

where
Mt is the amount of NF released at time t
Mi is the initial amount of NF entrapped in niosomal suspension.
Ex-vivo permeability study
Freshly excised sheep nasal mucosa obtained from local slaughterhouse was collected and kept in PBS (pH 6.4) for 30 minutes to equilibrate before performing permeation experiment.27 The obtained mucosa was placed between donor and receptor chambers of a Franz diffusion cell with the mucosal surface facing the donor chamber. The receiver chamber contained 50 mL of PBS pH 6.4 at a temperature of 37°C±0.5°C stirred at 50 rpm with a magnetic stirrer. The donor chamber was loaded with different volumes of niosomal suspension containing fixed concentrations of NF (4 mg). Samples of 1 mL were withdrawn from the receptor chamber at predetermined time intervals (ie, 0.5, 1, 2, 3, 4, 6, 8, 10, 12, and 24 hours). The withdrawn volumes were replaced by equal volumes of fresh medium to maintain sink conditions and avoid saturation. Samples were filtered through 0.45 Millipore filter and finally measured by the previously mentioned UPLC/MS/MS method.
Cumulative amount of drug permeated per unit area was graphically constructed as a function of time. Permeation parameters like Q24 (μg/cm2; which can be defined as the drug accumulated in receptor chamber for 24 hours), permeability coefficient Kp (cm/hour; which was obtained by dividing the slope of the straight line portion of permeation curve by drug concentration originally added), lag time (which is the X-intercept of the straight line portion of the permeation graph), and the steady state flux (Jss; which is the slope of the straight line portion of the permeation graph) were calculated for each formula and for free drug.
Data optimization
The used experimental design yielded a polynomial equation to optimize the levels of A and B to get optimum values of R1, R2, R3, R4, and R5 at the required conditions. An optimum formula was developed according to the predicted levels of A and B. The actual responses of optimum formula obtained were compared with values of the same responses predicted by the software used.
Physical stability study of niosomes
Average EE%, PS, and ZP of optimum formula were remeasured monthly for 6 months. The optimum formula was kept at 4°C during the storage period. The stability study was conducted according to a reported method.28 Data were analyzed by one-way ANOVA followed by Tukey–Kramer post Test using SPSS 22 statistical program (SPSS, Chicago, IL, USA), and the significance level was set at a P-value <0.05.
Preparation of NF-loaded niosomal in-situ nasal gel
The formulation was prepared on a weight/weight basis using the cold method with modification.29 An appropriate amount of hydroxypropyl methylcellulose (1% w/w) was dissolved in a certain volume of NF niosomal suspension and then cooled to 4°C and used for dispersing a mixture of PF127 and PF68 with ratio 2:1 w/w of the two Poloxamers, respectively, with continuous stirring. The dispersion stored in a refrigerator at 4°C overnight resulted in a clear solution. The concentrations of the polymers used were determined based on preliminary studies to get optimum characters of the formula used. The in-situ formula was characterized for rheological properties, mucoadhesive strength, phase transition temperature, in-vitro release, and ex-vivo permeation. A sample of free drug in the same in-situ gel base was prepared for comparative purposes (NF concentration was 3 mg/mL).
Tolerability studies (histopathological studies)
The study was approved by the Animal Ethics Committee of Beni-Suef University following the ICH guidelines for animal welfare. Six Female Wistar albino rats weighing 150–175 g received 50 μL of optimum nasal formula (as it is the maximum amount that can be incorporated into rats’ nostrils) embedded in a thermosensitive, mucoadhesive in-situ gel base in each nostril. The experiment was continued for 14 days; at the end of the experiment, the rats were sacrificed and the epithelial cell membrane of nasal septum was removed. The samples were then fixed in Davidson solution for 24 hours, dehydrated by ethyl alcohol, stabilized in 10% formalin solution, and finally stored in low melting paraffin. Tissues in paraffin blocks were cut into 5-μm thick sections with microtome and finally stained with H&E for histological examination.30 A second group of rats was used and received no treatment and served as a control group. A neutral and unbiased observer detected the histopathological changes such as necrosis, hemorrhage, and inflammation signs in the examined specimens using a light microscope equipped with a camera (Proway Optics & Electronics Co., Ltd., Ningbo, China).
In-vivo studies
Animals
The study was conducted based on approval of local animal ethical committee of University of Beni-Suef, and the ICH guidelines for animal welfare were followed throughout the experiment. Two groups each containing ten male Wister albino rats weighing 150–175±10 g were used. The animals were kept fasting overnight. The rats received the required dose and were kept conscious throughout the experiment period.
Dosage and drug administration
All rats used in the experiment received a dose of 20 mg/kg.31
Group 1 received NF solution (1 mg/mL) in sterile water orally, while Group 2 received the optimum formula in an in-situ gel base (30 mg/mL) with the composition previously mentioned through intranasal route where each rat received a 50 μL of the in-situ gel in each nostril using a micropipette. Group 3 received a 50 μL of NF solution through intranasal route.
Collection of samples
Volumes of 1 mL of blood were withdrawn from animals at specified time intervals (0.5, 1, 2, 4, 8, 12, and 24 hours) and collected in tubes containing EDTA to inhibit samples clotting. Afterward, clear plasma was obtained by centrifuging blood samples at 5,000 rpm for 10 minutes. Finally, the plasma samples were stored at −20°C for further analysis.
Chromatographic conditions
NF content of plasma samples was determined using the previously mentioned UPLC/MS/MS method.
Samples preparation for analysis
The frozen plasma samples were left to be thawed at room temperature. To extract drug from plasma, the plasma samples (250 μL) were mixed with 25 μL NaOH (0.1 M) and 25 μL of stock solution of the internal standard, and then vortexed for 15 seconds. Three milliliters of diethyl ether was added and the samples were then vortexed for 1 minute. Centrifugation of the tubes was performed for 10 minutes at 4,000 rpm. The upper organic phases were then transferred to clean glass tubes and evaporated to dryness at 45°C. Dry residues were dissolved in 150 mL of methanol and vortexed for 1 minute to reconstitute residues, and were injected using the autosampler. The NF recovery (50–200 ng/mL) ranged from 96.43% to 101.56%. The linearity was between 50 and 200 ng/mL (R2=0.9952; n=10).
Data analysis
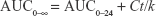
Pharmacokinetic parameters of plasma data for each rat were calculated using WinNonlin software (version 1.5, Scientific Consulting, Inc., Rockville, MD, USA), and a noncompartmental analysis was employed. Parameters like maximum drug concentration and the time needed to reach such a concentration, namely, Cmax (ng/mL) and tmax (h), respectively, were determined. Moreover, the area under the curve, AUC0–24 (ng hour/mL), for each group was determined by employing the trapezoidal rule from time 0 to the last time interval used for withdrawing blood samples. Equation 3 was used to calculate AUC from 0 to infinity, AUC0–∞(ng hour/mL):
|
|
where
Ct is the last measured concentration at time t
k is the terminal elimination rate constant
Finally, the apparent terminal elimination half-life (t1/2) was determined using the relation t1/2 = 0.693/k.
Statistical analysis
Data that were presented as means±SD were analyzed by one-way ANOVA followed by Tukey–Kramer post Test using SPSS 22 statistical program (SPSS, Chicago, IL, USA), and a P-value <0.05 was set to be significant.
Results
EE%, ZP, and PS measurements
NF was successfully entrapped in niosomes with an EE% ranging from 25%±1.8% to 80.4%±2.5%.
The EE% was in the following order: Span 40> Span 20> Span 85> Span 80.
Niosomal suspensions of NF had ZP values ranging from −16.8±1.5 to −29.7±0.5 mV. According to these results, the produced niosomes were physically stable. The negative values of niosomes’ ZP may be due to adsorption of counterions on the vesicles’ surface.
ZP values ranged from −16.8±0.13 to −29.7±0.15, while PS analysis showed that niosomes have PS values ranging from 67±3.1 to 504±1.8 nm and PDI ranged between 0.09±0.008 and 0.46±0.007.
Niosomes morphology
Transmission electron microscopy showed the formation of spherical niosomes with closed bilayer structure (Figure 1). The photomicrographs illustrated that the produced niosomes were homogenously distributed; this is consistent with PS and PDI results.
 | Figure 1 Transmission electron photomicrographs of NF-loaded niosomes. |
In-vitro release study
The in-vitro release data revealed the ability of NF-loaded niosomes to sustain NF release as shown in Figure 2. The percentage of NF released from niosomes ranged between 79.9%±1.07% and 98.6%±1.24%. According to the obtained results, Span 85 gave the highest release percent and Span 40 gave the lowest release percent.
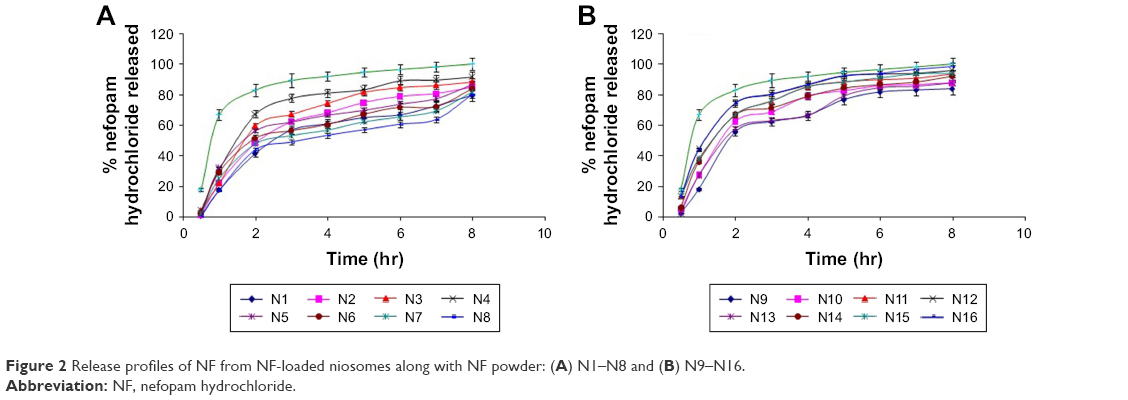 | Figure 2 Release profiles of NF from NF-loaded niosomes along with NF powder: (A) N1–N8 and (B) N9–N16. |
Ex-vivo permeation study
The permeation parameters obtained are provided in Table 3. According to the results, NF-loaded niosomes increased the permeation of drug through nasal mucosa compared with free NF. The values of Q24, Kp, and Jss of free drug were 283.05±10 μg/cm2, 0.199±0.09 cm/hour, and 15.59±2.44 μg/cm2/hour, respectively, which were less than that of any NF-loaded niosomes formula. Whereas, the lag time of NF solution was 48.0±1.23 minutes exceeding that of all NF-loaded niosomes. The obtained ex-vivo permeation results revealed that Span 85 gave the highest permeation parameters and Span 40 gave the lowest permeation parameters.
 | Table 3 Ex-vivo permeation parameters of NF loaded niosomes and free NF (means±SD,a n=3) |
Statistical analysis
Determination of quantitative effects of studied factors
Statistical results that reveal the effects of variables of the factorial design model and their P-values for the studied five responses are provided in Table 4. The results showed that factor A did not have any significant effect on the studied responses where the P-values were 0.8061, 0.7534, 0.9893, 0.1887, and 0.7012 for R1, R2, R3, R4, and R5, respectively. Meanwhile, factor B had a significant antagonistic effect on R1 and R2 with P-values of 0.0001 for both responses, while it had a significant synergistic effect on R3, R4, and R5 with a P-value of 0.0001 for R1 and R2 and a P-value of 0.0028 for R5.
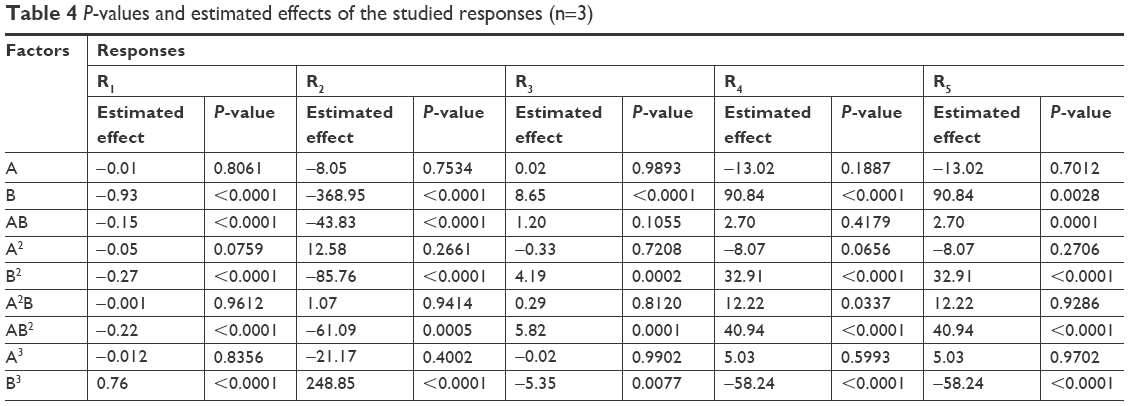 | Table 4 P-values and estimated effects of the studied responses (n=3) |
Physical stability of niosomes
At the end of storage period, PS of optimum formula increased from 211±4.0 to 219.5±3.0 nm, while the EE% decreased from 52.5±0.73 to 51.1±0.90 mg%, and ZP value increased from −29.6±0.3 to −27.6±1.5 mV. One-way ANOVA was used to test the significance of these changes, and the changes were found to be insignificant.
Development of NF niosomal in-situ gel
The tested NF niosomal in-situ formula had very low values of viscosity at room temperature that ranged from 219.04±8.5 to 333.68±13.5 cP indicating that at room temperature the prepared formula was in liquid state. Conversely, at 35°C, a dramatic shear-thinning behavior was observed in the corresponding profiles of the formulation indicating temperature-induced gel structure formation of poloxamer, as shown by the flow curve (Figure S1), and completes rheogram (Figure S2) of formula at body temperature. Rheological parameters of formula are provided in Table S1. The mucoadhesive strength of NF-loaded niosomal in-situ gel was 8,820±181 dyne/cm2.
NF release from niosomal NF-loaded in-situ gel was somewhat lower compared with NF release from niosomal suspension of the drug. This could be due to increased viscosity of the medium due to the polymers used. The release percent of NF from in-situ formula was 78.15±1.45 after 8 hours (Figure S3). The mucoadhesive in-situ formula gave better permeation parameters compared with NF-loaded niosomal suspension. This result could be attributed to the great mucoadhesive force of the in-situ formula, which allowed longer contact time with nasal mucosa and increased permeation (Figure S4 and Table S2).
Tolerability studies
Niosomes are nonionic surfactants-based vesicles; hence, it was necessary to investigate their ability to cause irritation of nasal mucosa. Light photomicrographs of the anterior cross-sections of rats’ olfactory region following exposure to the in-situ gel of optimum formula are presented in Figure 3. Samples’ examination showed that there were no severe signs of inflammation-like sloughing of epithelial cells, necrosis, or hemorrhage. However, mild degenerative changes in nasal mucosa (Figure 3A) along with mild inflammatory cell infiltrations were noticed in the region of lamina propria (Figure 3B).
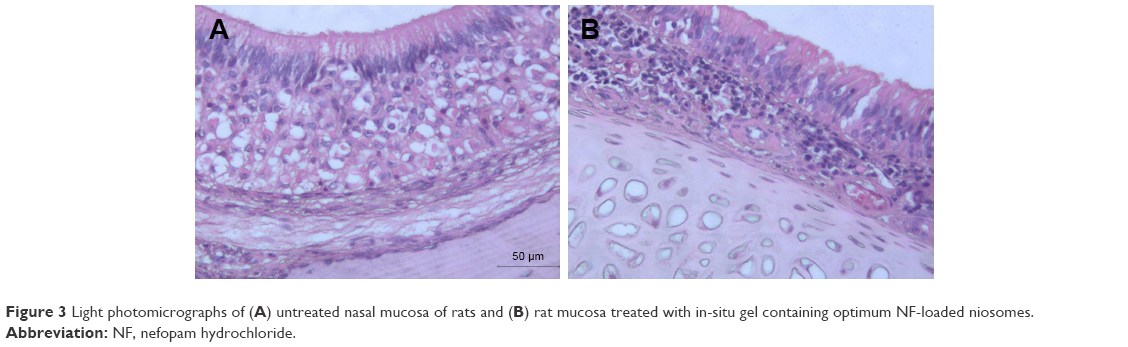 | Figure 3 Light photomicrographs of (A) untreated nasal mucosa of rats and (B) rat mucosa treated with in-situ gel containing optimum NF-loaded niosomes. |
Pharmacokinetic studies
The mean NF plasma concentration-time curves constructed after administering the optimized NF-loaded niosomal nasal suspension, NF nasal solution, and NF oral solution are presented in Figure 4. The mean peak plasma concentrations of oral drug solution, NF nasal solution, and optimized nasal formulae were 174.2, 387.4, and 658.8 ng/mL, respectively. The tmax value for groups 1 and 2 was 2 hectoseconds, while that of group 3 was 1 hectoseconds.
 | Figure 4 Plasma concentration-time curve obtained after oral administration of a single dose (20 mg/kg) of NF oral solution and intranasal administration of the optimum formulation of NF-loaded niosomes and NF nasal solution to rats (means±SD, n=10). |
The mean area under the plasma concentration-time curve for oral solution was found to be 615.7 ng hours/mL while that of optimum nasal formula was calculated to be 2,940.7 ng hours/mL and that of NF nasal solution was found to be 1,562.3 ng hours/mL. The optimized NF-loaded niosomes nasal formula had a percentage relative bioavailability of 477.5% when compared with the NF oral solution.
The current investigation revealed that the optimized nasal formulation exhibited a higher Cmax value and an elongated mean elimination half-life compared with that of NF oral solution and NF nasal solution. The NF oral solution had a t1/2 of 4.12 hours; in the meantime, the optimum NF-loaded niosomal nasal suspension had a t1/2 of 9.2 hours and the nasal solution of drug had a t1/2 of 2.3 hours. The pharmacokinetic parameters of the studied groups were calculated and provided in Table 5.
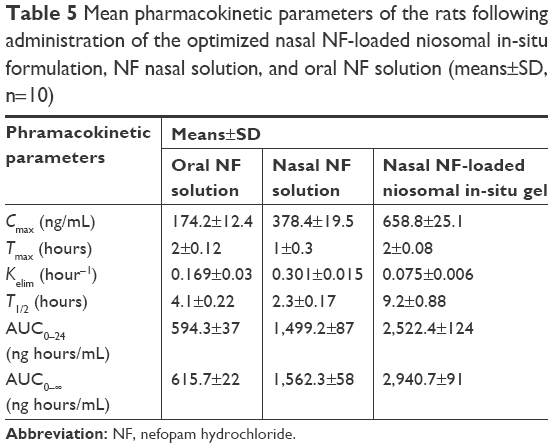 | Table 5 Mean pharmacokinetic parameters of the rats following administration of the optimized nasal NF-loaded niosomal in-situ formulation, NF nasal solution, and oral NF solution (means±SD, n=10) |
Discussion
EE%, ZP, and PS measurements
The EE% results can be understood in the light of surfactant structure. All Spans have similar head group and variable chain length. The longer the alkyl chain of a surfactant, the higher is the EE% it can afford. Although Span 80 have alkyl chains longer than that of Span 40, however, Span 80 and Span 85 have unsaturated alkyl chains. The presence of such unsaturation causes an increase of the permeability of the thin film leading to decrease in EE%. Moreover, the lower EE% of Span 80 can be attributed to its transition temperature as it has the lowest transition temperature among the used Spans.12,32
ZP values obtained were hydrophilic–lipophilic balance (HLB) dependent.33 Span 20 (HLB 8.6) had ZP values higher than that of Span 40, Span 80, or Span 85 niosomes (HLB values 6.7, 4.3, and 1.8, respectively).34,35 The higher hydrophilic content in Span 20 compared with the other surfactants could have resulted in adsorption of less counter ions on the vesicles’ surface and end up increasing ZP values.
It was observed that increasing Span 40: cholesterol molar ratio increased EE%, while, increasing Span 20, Span 80, and Span 85: cholesterol molar ratios decreased EE%. The reason behind such results could be the increase in rigidity of vesicles’ membrane in case of increasing Span 40 amount, and decrease in the rigidity of membrane while increasing the amounts of Span 20, Span 85, and Span 80.
According to PDI results obtained, the produced niosomes can be considered homogenously distributed. Increasing Span 40 amounts yields higher PS. The opposite was observed in case of other surfactants.
PS results are consistent with the concept saying that surfactants with higher alkyl chain length give larger vesicles. Since Span 40 has the longest alkyl chain with no unsaturation, it gives niosomes with the largest diameter.36 Increasing Span 40 amounts yields higher PS. The opposite was observed in case of other surfactants.
In-vitro release study
Surfactant chemical structure had a prominent effect on in-vitro release results of NF from niosomes. As reported in literature, release rate of drugs loaded into nonionic surfactants-based vesicles depends on surfactant’s alkyl chain length; the longer the alkyl chain length, the slower will be the release rate.37 Span 40 niosomes have the longest saturated alkyl chain and the slowest release rate. Despite the longer chain length of Span 80 and Span 85, the presence of a double bond in chain increases the leaking of drug out of niosomes and hence increases the release rate. Moreover; Span 40 is distinguished with great lipophilic portion which leaves only small hydrophilic surface area for NF release. In addition, surfactant transition temperature controls release rate of drug from the vesicles. It was found that increasing the transition temperature decreases the drug release from niosomes.12 Such a fact contributes to Span 40 niosomes’ slow release rate as it gives more rigid vesicle membrane.37
Surfactant: cholesterol molar ratio affects the release of NF from NF-loaded niosomes. Higher molar ratios of Span 80, Span 85, and Span 20 to cholesterol yielded high drug release rate because it contributed to smaller PS and hence larger surface areas offered for release. On the other hand, increasing the molar ratio of Span 40: cholesterol resulted in a slower release from niosomes because it yielded larger vesicles with only a small surface area available for drug release.
Ex-vivo permeation studies
The phenomenon of higher transmucosal permeation exhibited by NF-loaded niosomes compared with free drug can be attributed to the presence of nonionic surfactants in niosomes’ shell which can actually be considered as excellent penetration enhancers.38 Span 85 and Span 80 niosomes were found to permeate more readily than other formulae.
The variation of the PS of the produced niosomes is the reason behind the variation observed in transmucosal permeation results. The smaller PS of Span 80 niosomes compared with other niosomes led to an increase in the surface area available for permeation. Span 20, Span 80, and Span 85 have transition temperatures lower than that of Span 40; in accordance, they can produce more flexible vesicles and hence allow greater permeation to take place.39 Increasing the molar ratios of Span 20, Span 80, and Span 85 to cholesterol promoted transmucosal permeation and the opposite was observed in case of Span 40 niosomes. The increase in permeation of NF from all NF-loaded niosomes was found to be highly significant (P-value <0.01) compared with free drug using one-way ANOVA. The permeation profiles of NF-loaded niosomes and NF powder are presented in Figure 5.
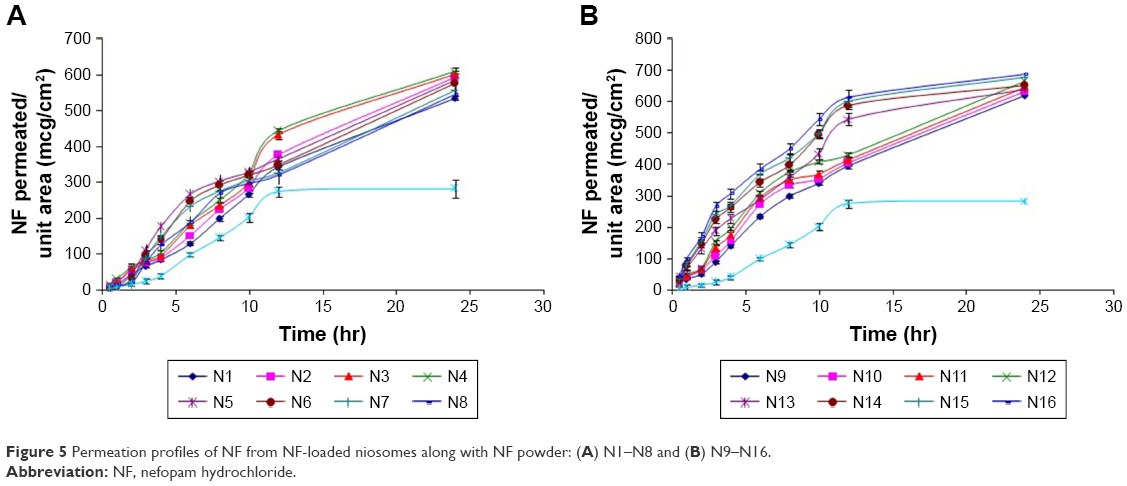 | Figure 5 Permeation profiles of NF from NF-loaded niosomes along with NF powder: (A) N1–N8 and (B) N9–N16. |
Statistical analysis
Determination of quantitative effects of studied factors
The interaction effect of AB affected R1 and R2 antagonistically with a P-value of 0.0001 for both responses and affected R3 synergistically with a P-value of 0.0001. Moreover, the responses R1 and R2 were significantly affected by the antagonistic effect of the quadratic term of B2, while, R3, R4, and R5 were synergistically affected by the quadratic term of the same factor.
The negative coefficients of factors A and B in case of responses R1 and R2 clarify that both factors have a decreasing effect on NF-loaded niosomes’ size and EE% through increasing leakage of drug from thin film. Meanwhile, factors A and B had a positive coefficient concerning response R3 indicating that both factors retard drug release from niosomes. In case of R4 and R5, factor A had a negative coefficient, while factor B had a positive coefficient indicating that factor A had a decreasing effect on R4 and R5, while factor B has an increasing effect on the same responses.
The change in the response surface was evaluated by constructing the 3D response surface (Figure 6, upper section) and contour plots (Figure 6, lower section) of the measured responses with respect to the model polynomial equations. The illustrated plots give a good idea about the exact percent of factors A and B, which will yield the desired levels of the estimated responses.
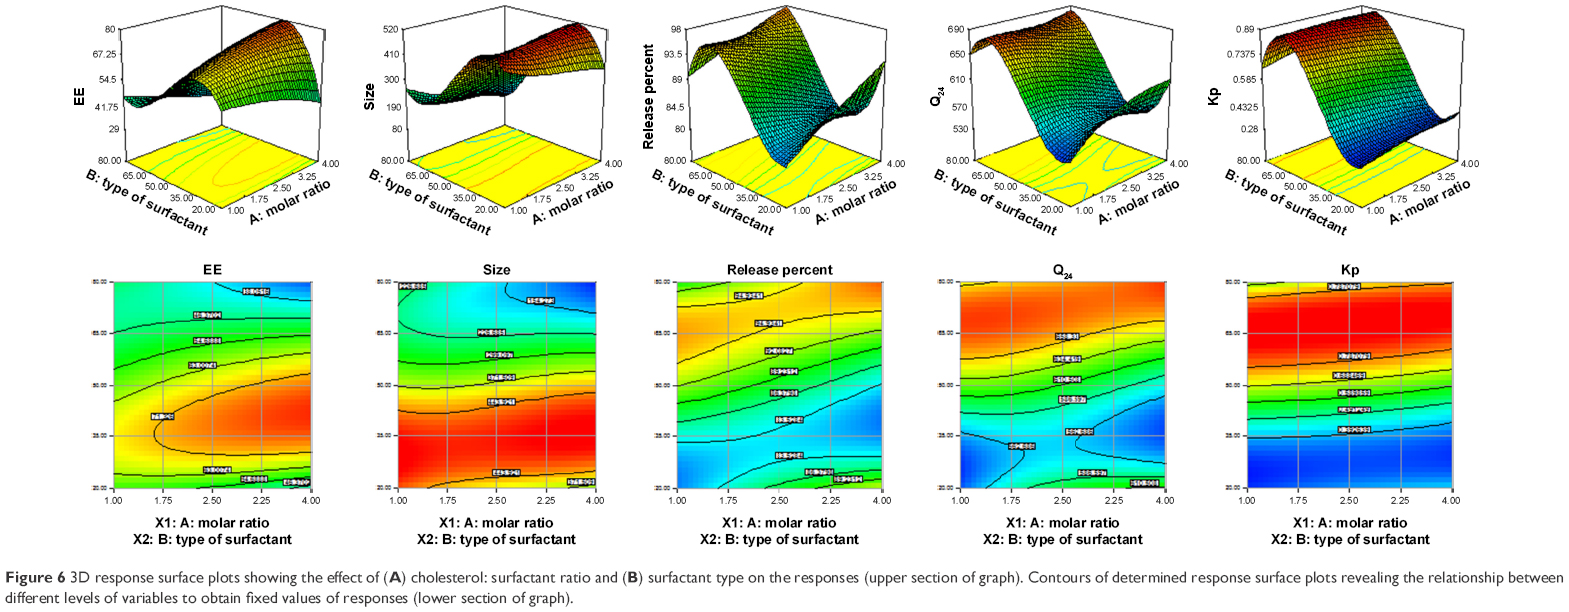 | Figure 6 3D response surface plots showing the effect of (A) cholesterol: surfactant ratio and (B) surfactant type on the responses (upper section of graph). Contours of determined response surface plots revealing the relationship between different levels of variables to obtain fixed values of responses (lower section of graph). |
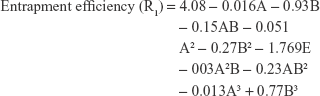
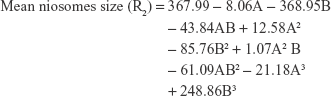
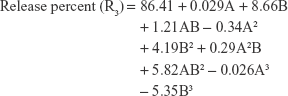
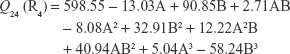
The polynomial equations were established (Equations 4 to 8) to relate the factors and responses as follows:
|
|
|
|
|
|
|
|
|
|
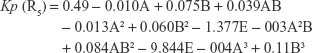
As mentioned previously, optimization was done to get the levels of A and B that will minimize both R2 and R3, while maximize R1, R4, and R5. The type of span (B) chosen by software was Span 80 while the predicted molar ratio (A) was 1.59. To validate the expected values of the responses, a new formulation was prepared according to the estimated levels of A and B. The responses obtained from the optimum formula prepared according to the predicted levels of A and B were measured and compared to the responses expected by the software used. The values of R1, R2, R3, R4, and R5 predicted by the software and the measured values of the same responses are provided in Table 6. The predicted and experimental values of the tested responses were found to be very close.
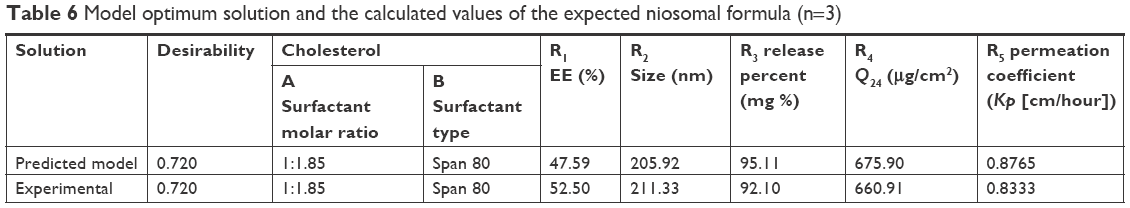 | Table 6 Model optimum solution and the calculated values of the expected niosomal formula (n=3) |
Physical stability of niosomes
The insignificant increase in ZP values of stored formula may have resulted in increased attraction between niosomes which might have led to the insignificant increase noticed in PS. Leakage of NF from niosomes to the surrounding medium could be the reason behind the insignificant decrease in EE% noticed at end of storage period. Similar results were reported in literature.12
Pharmacokinetic studies
Despite the slow release pattern attained by the optimized formula, it exhibited a low value of tmax. The reason behind such an unexpected result could be the interaction between the membrane of niosomes and opsonins present in serum, which can promote vesicles’ lysis and release of the entrapped NF into bloodstream.40 Moreover, the lipid contents of niosomal membrane are usually destabilized by low-density lipoproteins and high-density lipoproteins, ending up with escape of drug from the niosomes.41 These results were similar to previously reported results.42–44
The prolonged plasma levels and elimination half-life of optimum NF-loaded niosomal nasal formula observed in the results could be due to the ability of niosomes to retard drug release. Therefore, the developed optimum NF-loaded niosomal nasal formula can be advantageous in minimizing the fluctuations of NF plasma levels and providing drug delivery with constant rates.
The in-vivo study showed that the optimum NF-loaded niosomal nasal formula had significantly improved the pharmacokinetic parameters (t1/2, AUC0–24, and AUC0–∞) compared with the oral and nasal solutions of NF. It was obvious that the developed nasal formulation provided a 4.77-fold increase in the bioavailability compared with oral solution. The higher bioavailability exhibited by the developed nasal formulation could be explained by the ability of nasal route to avoid the first-pass metabolism of NF and the ability of niosomes to enhance the drug permeation across nasal mucosa due to their lipophilic nature which enable them to pass through nasal mucosa cell wall and deliver drug into bloodstream more efficiently than the solution of NF. Similar results were reported in literature.45
Conclusion
The investigated drug (NF) was successfully incorporated into the core of the developed vesicles. The formulated niosomes significantly improved NF permeation across nasal mucosa and prolonged the drug release rate. In-vivo studies showed that niosomes can be a promising tool to increase the drug bioavailability and hence reduces the required effective dose. The obtained outcomes support our theory, which implies that intranasal delivery of NF-loaded niosomes can be helpful in bypassing the drug first-pass metabolism and offer a good alternative for the conventional oral route.
Acknowledgment
The authors are greatly indebted to the Egyptian International Pharmaceuticals Industries Company (EIPICO) for the supply of the studied drug.
Disclosure
The authors report no conflicts of interest in this work.
References
Ozsoy Y, Gungor S, Cevher E. Nasal delivery of high molecular weight drugs. Molecules. 2009;14(9):3754–3779. | ||
Tiwari G, Tiwari R, Sriwastawa B, et al. Drug delivery systems: an updated review. Int J Pharm Investig. 2012;2(1):2–11. | ||
Abdelbary A, Salem HF, Khallaf RA. Niosomal 5-flourouracil gel for effective treatment of skin cancer; In-vitro and In-vivo evaluation. Int J Drug Deliv. 2015;7:223–232. | ||
Bilotta F, Pietropaoli P, Rosa G. Nefopam for refractory postoperative hiccups. Anesth Analg. 2001;93(5):1358–1360. | ||
Holdgate A, Pollock T. Nonsteroidal anti-inflammatory drugs (NSAIDs) versus opioids for acute renal colic. Cochrane Database Syst Rev. 2005;18(2):CD004137. | ||
Aymard G, Warot D, Démolis P, et al. Comparative pharmacokinetics and pharmacodynamics of intravenous and oral nefopam in healthy volunteers. Pharmacol Toxicol. 2003;92(6):279–286. | ||
Nirmal HB, Bakliwal SR, Pawar SP. In-Situ gel: new trends in controlled and sustained drug delivery system. Int J PharmTech Res. 2010;2:1398–1408. | ||
Rajoria G, Gupta A. In-situ gelling system: a novel approach for ocular drug delivery. Am J PharmTech Res. 2012;4:24–53. | ||
Komori C, Okada K, Kawamura K, Suzuki N, Chida S, Suzuki T. Sonodynamic effects of lomefloxacin derivatives conjugated with methoxy polyethylene glycol on sarcoma 180 cells. Anticancer Res. 2009;29(1):243–248. | ||
Liu S, Jones L, Gu FX, Fx G. Nanomaterials for ocular drug delivery. Macromol Biosci. 2012;12(5):608–620. | ||
Mishra GP, Bagui M, Tamboli V, Mitra AK. Recent applications of liposomes in ophthalmic drug delivery. J Drug Deliv. 2011;2011:1–14. | ||
Abdelbary A, Salem HF, Khallaf RA, Ali AM, Ama A. Mucoadhesive niosomal in situ gel for ocular tissue targeting: in vitro and in vivo evaluation of lomefloxacin hydrochloride. Pharm Dev Technol. 2017;22(3):409–417. | ||
Moghassemi S, Hadjizadeh A. Nano-niosomes as nanoscale drug delivery systems: an illustrated review. J Control Release. 2014;185:22–36. | ||
Sukhbir S, Yashpal S, Sandeep A. Development and statistical optimization of nefopam hydrochloride loaded nanospheres for neuropathic pain using Box-Behnken design. Saudi Pharm J. 2016;24(5):588–599. | ||
Aboud HM, Hassan AH, Ali AA, Abdel-Razik AH. Novel in situ gelling vaginal sponges of sildenafil citrate-based cubosomes for uterine targeting. Drug Deliv. 2018;25(1):1328–1339. | ||
Salem HF, Kharshoum RM, Abo El-Ela FI, F AG, Abdellatif KRA. Evaluation and optimization of pH-responsive niosomes as a carrier for efficient treatment of breast cancer. Drug Deliv Transl Res. 2018;8(3):633–644. | ||
Azeem A, Ahmad FJ, Khan ZI, Talegaonkar S. Nonionic surfactant vesicles as a carrier for transdermal delivery of frusemide. J Dispers Sci Technol. 2008;29(5):723–730. | ||
Pardakhty A, Varshosaz J, Rouholamini A, Abbas P, Jaleh V, Abdolhossein R. In vitro study of polyoxyethylene alkyl ether niosomes for delivery of insulin. Int J Pharm. 2007;328(2):130–141. | ||
Ruckmani K, Sankar V. Formulation and optimization of zidovudine niosomes. AAPS PharmSciTech. 2010;11(3):1119–1127. | ||
Hoizey G, Goglin A, Malinovsky JM, et al. Specific and sensitive analysis of nefopam and its main metabolite desmethyl-nefopam in human plasma by liquid chromatography-ion trap tandem mass spectrometry. J Pharm Biomed Anal. 2006;42(5):593–600. | ||
Hao Y, Zhao F, Li N, Yang Y, Li K. Studies on a high encapsulation of colchicine by a niosome system. Int J Pharm. 2002;244(1–2):73–80. | ||
Junyaprasert VB, Teeranachaideekul V, Supaperm T. Effect of charged and non-ionic membrane additives on physicochemical properties and stability of niosomes. AAPS PharmSciTech. 2008;9(3):851–859. | ||
Manosroi A, Jantrawut P, Manosroi J. Anti-inflammatory activity of gel containing novel elastic niosomes entrapped with diclofenac diethylammonium. Int J Pharm. 2008;360(1–2):156–163. | ||
Khallaf RA, Salem HF, Abdelbary A. 5-Fluorouracil shell-enriched solid lipid nanoparticles (SLN) for effective skin carcinoma treatment. Drug Deliv. 2016;23(9):3452–3460. | ||
Rangasamy S, Ayyasamy B, Raju S, Gummadevelly S, Shaik S. Formulation and in vivo evaluation of niosomes encapsulated acyclovir. J Pharm Res. 2008;1:163–166. | ||
Callens C, Ceulemans J, Ludwig A, Foreman P, Remon JP. Rheological study on mucoadhesivity of some nasal powder formulations. Eur J Pharm Biopharm. 2003;55(3):323–328. | ||
Pund S, Rasve G, Borade G. Ex vivo permeation characteristics of venlafaxine through sheep nasal mucosa. Eur J Pharm Sci. 2013;48(1–2):195–201. | ||
Gianasi E, Cociancich F, Uchegbu IF, Florence AT, Duncan R. Pharmaceutical and biological characterisation of a doxorubicin-polymer conjugate (PK1) entrapped in sorbitan monostearate Span 60 niosomes. Int J Pharm. 1997;148(2):139–148. | ||
Moawad FA, Ali AA, Salem HF. Nanotransfersomes-loaded thermosensitive in situ gel as a rectal delivery system of tizanidine HCl: preparation, in vitro and in vivo performance. Drug Deliv. 2017;24(1):252–260. | ||
Zaki NM, Awad GA, Mortada ND, Abd Elhady SS. Enhanced bioavailability of metoclopramide HCl by intranasal administration of a mucoadhesive in situ gel with modulated rheological and mucociliary transport properties. Eur J Pharm Sci. 2007;32(4–5):296–307. | ||
Yu J, Solon E, Shen H, Modi NB, Mittur A. Pharmacokinetics, distribution, metabolism, and excretion of the dual reuptake inhibitor [(14)C]-nefopam in rats. Xenobiotica. 2016;46(11):1026–1048. | ||
Abraham Lingan M, Abdul Hasan Sathali A, Vijaya Kumar MR, Gokila A. Formulation and evaluation of topical drug delivery system containing clobetasol propionate niosomes. Sci Rev Chem Commun. 2011;1:7–17. | ||
Ranga PM, Natarajan R, Rajendran NN. Formulation and evaluation of zidovudine loaded niosomes. J Pharm Nanotechnol. 2013;1:12–18. | ||
Bayindir ZS, Yuksel N. Characterization of niosomes prepared with various nonionic surfactants for paclitaxel oral delivery. J Pharm Sci. 2010;99(4):2049–2060. | ||
Kamboj S, Saini V, Bala S. Formulation and characterization of drug loaded nonionic surfactant vesicles (niosomes) for oral bioavailability enhancement. Sci World J. 2014;2014:1–8. | ||
Varshosaz J, Pardakhty A, Hajhashemi VI, Najafabadi AR. Development and physical characterization of sorbitan monoester niosomes for insulin oral delivery. Drug Deliv. 2003;10(4):251–262. | ||
Abdelbary G, El-Gendy N. Niosome-encapsulated gentamicin for ophthalmic controlled delivery. AAPS PharmSciTech. 2008;9(3):740–747. | ||
Chen Y, Lu Y, Chen J, et al. Enhanced bioavailability of the poorly water-soluble drug fenofibrate by using liposomes containing a bile salt. Int J Pharm. 2009;376(1–2):153–160. | ||
Uchegbu IF, Vyas SP. Non-ionic surfactant based vesicles (niosomes) in drug delivery. Int J Pharm. 1998;172(1–2):33–70. | ||
Ishida T, Harashima H, Kiwada H. Liposome clearance. Biosci Rep. 2002;22(2):197–224. | ||
Comiskey SJ, Heath TD. Serum-induced leakage of negatively charged liposomes at nanomolar lipid concentrations. Biochemistry. 1990;29(15):3626–3631. | ||
Aboud HM, Ali AA, El-Menshawe SF, Elbary AA, Shf E-M, Abdelbary A. Nanotransfersomes of carvedilol for intranasal delivery: formulation, characterization and in vivo evaluation. Drug Deliv. 2016;23(7):2471–2481. | ||
Salama HA, Mahmoud AA, Kamel AO, Abdel Hady M, Awad GA. Brain delivery of olanzapine by intranasal administration of transfersomal vesicles. J Liposome Res. 2012;22(4):336–345. | ||
Salama HA, Mahmoud AA, Kamel AO, Abdel Hady M, Awad GA. Phospholipid based colloidal poloxamer-nanocubic vesicles for brain targeting via the nasal route. Colloids Surf B Biointerfaces. 2012;100:146–154. | ||
Ammar HO, Haider M, Ibrahim M, El Hoffy NM. In vitro and in vivo investigation for optimization of niosomal ability for sustainment and bioavailability enhancement of diltiazem after nasal administration. Drug Deliv. 2017;24(1):414–421. |
Supplementary materials
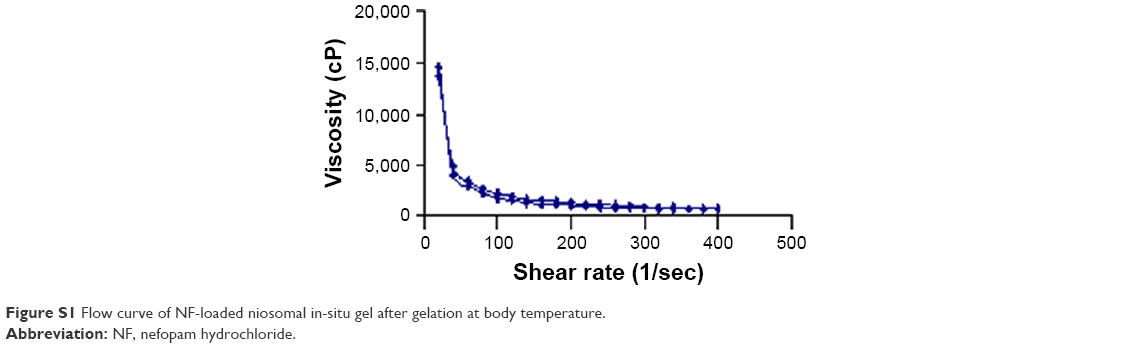 | Figure S1 Flow curve of NF-loaded niosomal in-situ gel after gelation at body temperature. |
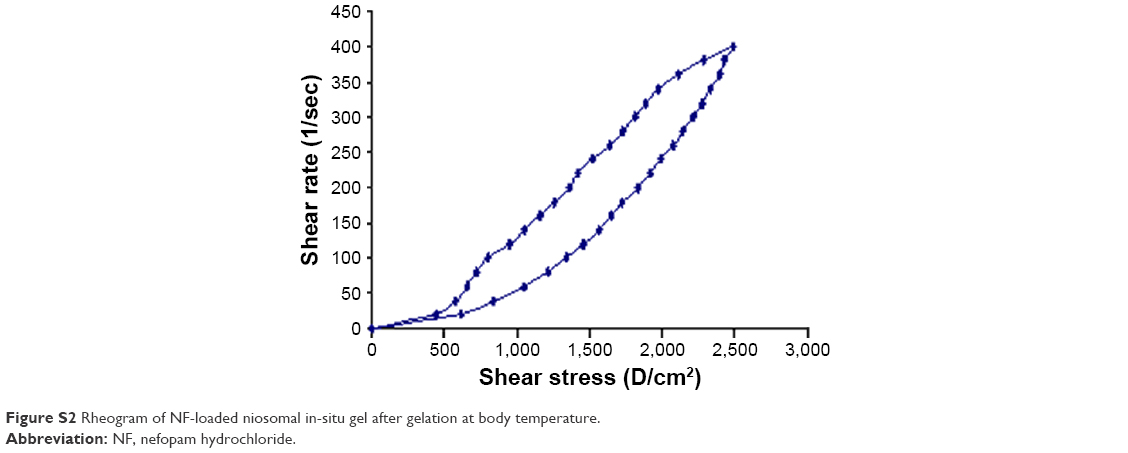 | Figure S2 Rheogram of NF-loaded niosomal in-situ gel after gelation at body temperature. |
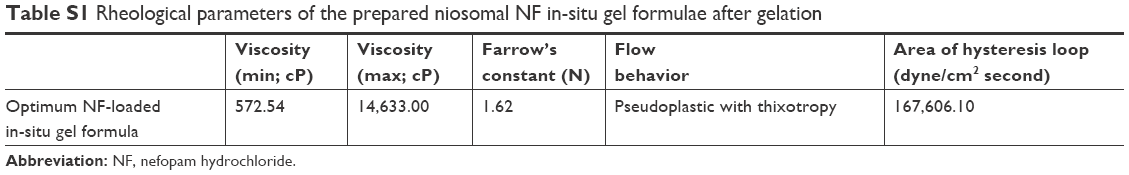 | Table S1 Rheological parameters of the prepared niosomal NF in-situ gel formulae after gelation |
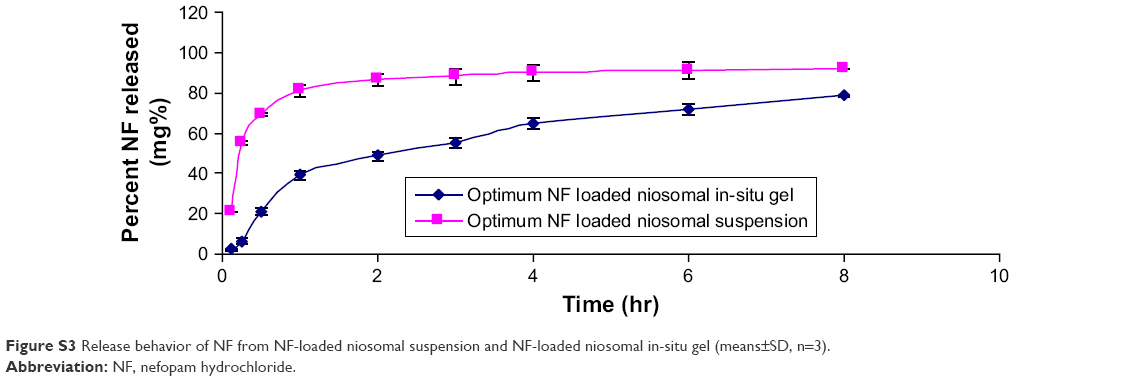 | Figure S3 Release behavior of NF from NF-loaded niosomal suspension and NF-loaded niosomal in-situ gel (means±SD, n=3). |
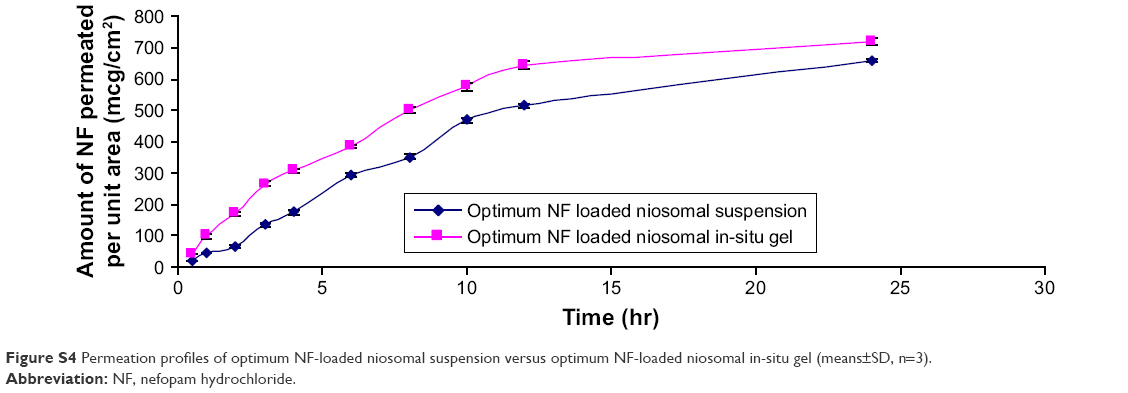 | Figure S4 Permeation profiles of optimum NF-loaded niosomal suspension versus optimum NF-loaded niosomal in-situ gel (means±SD, n=3). |
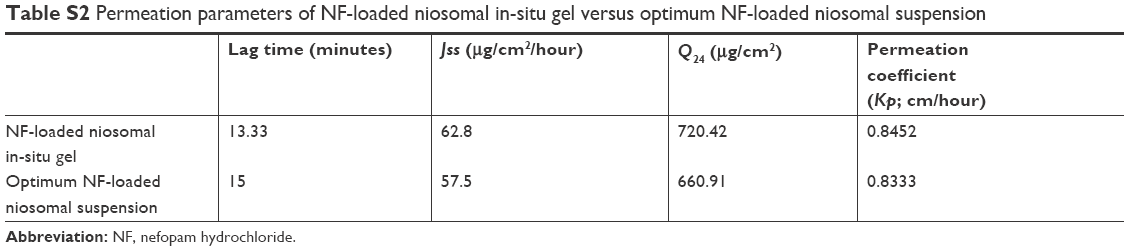 | Table S2 Permeation parameters of NF-loaded niosomal in-situ gel versus optimum NF-loaded niosomal suspension |
 © 2018 The Author(s). This work is published and licensed by Dove Medical Press Limited. The
full terms of this license are available at https://www.dovepress.com/terms
and incorporate the Creative Commons Attribution
- Non Commercial (unported, 3.0) License.
By accessing the work you hereby accept the Terms. Non-commercial uses of the work are permitted
without any further permission from Dove Medical Press Limited, provided the work is properly
attributed. For permission for commercial use of this work, please see paragraphs 4.2 and 5 of our Terms.
© 2018 The Author(s). This work is published and licensed by Dove Medical Press Limited. The
full terms of this license are available at https://www.dovepress.com/terms
and incorporate the Creative Commons Attribution
- Non Commercial (unported, 3.0) License.
By accessing the work you hereby accept the Terms. Non-commercial uses of the work are permitted
without any further permission from Dove Medical Press Limited, provided the work is properly
attributed. For permission for commercial use of this work, please see paragraphs 4.2 and 5 of our Terms.