Back to Journals » International Journal of Chronic Obstructive Pulmonary Disease » Volume 11 » Issue 1
Interpreting patient-reported outcomes from clinical trials in COPD: a discussion
Authors Jones PW ![]() , Rennard S, Tabberer M, Riley JH, Vahdati-Bolouri M, Barnes NC
, Rennard S, Tabberer M, Riley JH, Vahdati-Bolouri M, Barnes NC ![]()
Received 16 July 2016
Accepted for publication 26 September 2016
Published 7 December 2016 Volume 2016:11(1) Pages 3069—3078
DOI https://doi.org/10.2147/COPD.S117378
Checked for plagiarism Yes
Review by Single anonymous peer review
Peer reviewer comments 4
Editor who approved publication: Prof. Dr. Richard Russell
Video abstract presented by Paul W Jones.
Views: 743
Paul W Jones,1,2 Stephen Rennard,3,4 Maggie Tabberer,5 John H Riley,2 Mitra Vahdati-Bolouri,2 Neil C Barnes2,6
1Institute for Infection and Immunity, University of London, London, 2Global Respiratory Franchise, GlaxoSmithKline, Uxbridge, UK; 3Division of Pulmonary, Critical Care, Sleep and Allergy, Nebraska Medical Center, Omaha, NE, USA; 4Clinical Discovery Unit, AstraZeneca, Cambridge, 5Global R&D, GlaxoSmithKline, Uxbridge, 6William Harvey Institute, Bart’s and the London School of Medicine and Dentistry, London, UK
Abstract: One of the challenges faced by the practising physician is the interpretation of patient-reported outcomes (PROs) in clinical trials and the relevance of such data to their patients. This is especially true when caring for patients with progressive diseases such as COPD. In an attempt to incorporate the patient perspective, many clinical trials now include assessments of PROs. These are formalized methods of capturing patient-centered information. Given the importance of PROs in evaluating the potential utility of an intervention for a patient with COPD, it is important that physicians are able to critically interpret (and critique) the results derived from them. Therefore, in this paper, a series of questions is posed for the practising physician to consider when reviewing the treatment effectiveness as assessed by PROs. The focus is on the St George’s Respiratory Questionnaire for worked examples, but the principles apply equally to other symptom-based questionnaires. A number of different ways of presenting PRO data are discussed, including the concept of the minimum clinically important difference, whether there is a ceiling effect to PRO results, and the strengths and weaknesses of responder analyses. Using a worked example, the value of including a placebo arm in a study is illustrated, and the influence of the study on PRO results is considered, in terms of the design, patient withdrawal, and the selection of the study population. For the practising clinician, the most important consideration is the importance of individualization of treatment (and of treatment goals). To inform such treatment, clinicians need to critically review PRO data. The hope is that the questions posed here will help to build a framework for this critical review.
Keywords: patient-centered outcomes research, St George’s Respiratory Questionnaire, COPD, data interpretation, statistical
Introduction
The number of treatments for COPD is increasing. Twenty years ago, “usual care” was largely short-acting bronchodilators, but now at least five classes of long-acting drugs are available: long-acting muscarinic antagonists (LAMA), long-acting β2-agonists (LABA), inhaled corticosteroids (ICS), phosphodiesterase inhibitors, and theophyllines.1 A particular advance has been fixed-dose combination (FDC) inhalers, and a number of LABA/ICS and LAMA/LABA FDCs are currently available, with “triple” LAMA/LABA/ICS FDCs in development. Each new agent obtains a product license based upon clinical trial data demonstrating efficacy and safety, but these trials are seldom designed to guide the practising clinician about when to change or add a treatment. This results in disease management guidelines that, due to the lack of clear evidence, do not provide treatment pathway recommendations.1–3
A further problem is that in most COPD trials, especially those involving bronchodilators, the primary outcome has focused on lung function, typically forced expiratory volume in 1 second (FEV1). In contrast, physicians generally make decisions to modify therapy based on patients’ symptoms and their impact on daily activity and well-being, together with the occurrence of exacerbations. That decision requires a discussion between physician and patient, which usually involves asking a question along the lines of, “How are you doing?”. This works in routine practice when caring for an individual patient, but a systematic approach is needed if the patient perspective is to be incorporated into clinical trials, since standardized assessment and data analysis are then required. This led to the development of patient-reported outcomes (PROs) as formalized methods of capturing this type of clinically relevant information.
The formal definition of a PRO used by the European Medicines Agency is “Any outcome evaluated directly by the patient himself and based on patient’s perception of a disease and its treatment(s)”.4 PROs should be reported directly by the patient without interpretation by others and are usually captured in the form of a questionnaire or diary. To ensure consistency in measurement and interpretation, PROs need to be developed using rigorous psychometric methods that permit their derived scores to be used as quantitative measures and allow statistical comparisons between treatments. In a well-constructed PRO, a numerical difference has the same meaning across the range of scores, like a ruler. Most importantly, modern PROs are developed with patient input to ensure that what is measured, as well as the way it is measured, is relevant and understandable to patients. Furthermore, any PRO used in a trial should have evidence of validity and reliability in the specific population being studied, with careful translation and cultural validation to ensure that these tools are applicable globally.
To help physicians interpret results derived from PROs, in this paper a series of questions is posed to consider when evaluating patient-centered clinical trial data. The focus is on the St George’s Respiratory Questionnaire (SGRQ; now included in the US Food and Drug Administration’s draft guidance Chronic obstructive pulmonary disease: Developing drugs for treatment5) for worked examples, but the principles apply equally to other symptom-based questionnaires.
What is a PRO?
PROs capture various aspects of the impact of a disease and the effects of treatment (positive or negative) as reported by the patient, from core symptoms of the disease, such as shortness of breath or cough, through to health status, satisfaction with health, or overall disease impact (eg, ability to go to work). The choice of PRO will depend on the clinical outcome(s) that the treatment targets, although an overall summative measure such as health status may be appropriate in many therapeutic settings.
How should the results be presented?
Until relatively recently, PRO results have typically been expressed as mean values, presented as relative or absolute differences or changes. Relative differences are superficially attractive since they give a measure of the relative size of the change, for example, “a 10% reduction in breathlessness with X compared with Y”. However, the percentage will be determined not only by the size of change but also by the baseline severity; if the baseline score is small, a large relative change may not be particularly meaningful in practice. Absolute differences allow a direct comparison between patient groups and studies, since the baseline state does not need to be taken into consideration in the way that it does when assessing relative changes. Both methods of reporting data can be useful – and according to the Consolidated Standards for Reporting Trials (CONSORT), presentation of both relative and absolute effect sizes is recommended.6
How big is the benefit, and what is a minimum clinically important difference (MCID)?
If the difference between two values is found to be statistically significant, this only means that the result observed is unlikely to have occurred by chance and provides no information on the clinical relevance of the result. As a result, therefore, the concept of the MCID was developed to allow clinicians to set PRO data into context. An MCID can be defined as “the smallest difference in score that patients perceive as beneficial”. This topic has been addressed in depth elsewhere,7,8 so it will only be described briefly here. Two main methods have been used to derive MCIDs: statistical (derived from the distribution of the data) and anchor based (by reference to other measurements). Distribution-based values do not take into consideration whether a patient can perceive any difference, so they cannot be considered clinically relevant. Anchor-based methods can use a variety of measures (depending on the disease in question), but the most commonly used anchors are global questions, for example, the patient’s retrospective judgment about whether they have improved, stayed the same, or worsened. The mean score of patients who report a minimum detectable change is then used for the MCID.9 As an example, to derive the MCID for the SGRQ, patients were asked to rate a treatment as “ineffective”, “satisfactory”, “effective”, or “very effective”.10 The mean improvement in the SGRQ score in patients who described the treatment as effective was 4.1. A similar value of ~4 units was obtained in two other anchor-based MCID estimates, one being the change within patients and the other comparing differences between patients, so the MCID was set at 4 units.10
However, note that whichever method was used to derive them, all MCIDs are indicative values and do not form rigid boundaries. In particular, it is not correct to interpret an SGRQ change of −3.99 as not clinically significant, whereas −4.01 is significant. Further, the MCID is a population average, which may differ from individual patient experience.
It has been suggested that MCID estimates, such as the 4 units for the SGRQ, may be too high, since treatments that are clinically effective in day-to-day practice often produced mean improvements vs placebo in clinical trials of rather less than the MCID. For example, in one systematic review of tiotropium, a drug that has proved very effective in clinical practice, the mean difference in the SGRQ score vs placebo was −2.9 units.11 In contrast, more recent studies with new LAMAs report mean SGRQ total scores vs placebo that have been very close to,12 or in some cases exceeded a 4-unit improvement.13 However, such arguments over the numerical value miss a key point: focusing on mean treatment effects can mask the benefit seen in individual patients. Since PRO scores (including the SGRQ) are usually normally distributed, for the mean improvement in a study population to exceed the MCID, more than half of the patients must improve by at least that amount. This is a very challenging target for any therapy used in a chronic and generally progressive condition. A treatment that would improve 40% of the population by a clinically significant amount would be very useful in practice, but benefit to those patients would not be recognized if the focus was simply on average benefit. Moreover, in a disease as heterogeneous as COPD, it is possible that only a subset of patients may derive benefit from a specific treatment, so that the change in PRO score resulting from a treatment would not be normally distributed (although no examples of this have yet emerged), as represented in the top panel of Figure 1.
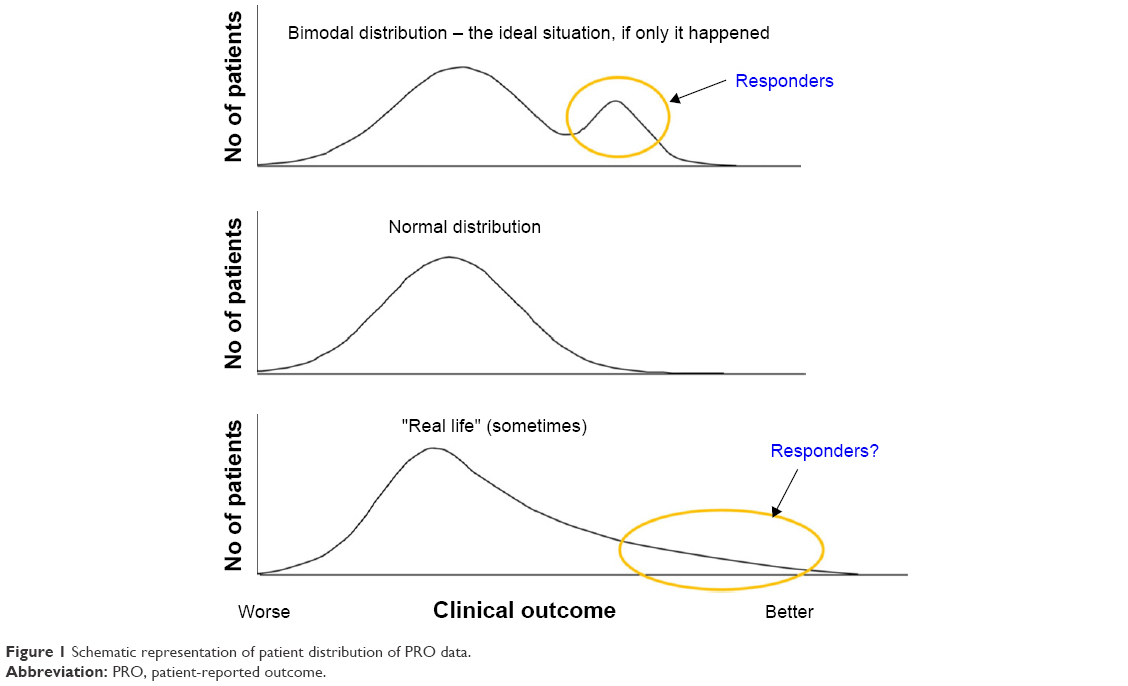 | Figure 1 Schematic representation of patient distribution of PRO data. |
Another question about MCIDs is: should there be a different MCID for different degrees of COPD severity? There is no single answer to that question. A well-designed questionnaire should behave like a ruler, in that the distance between two points at one end of the scale should correspond to the same difference measured at the other end. However, it is important to draw a distinction between a change in health status and the consequence of that change. The consequence of a change will depend on the patient’s baseline state, since a worsening that is the size of the MCID may only cause milder patients to seek medical advice, whereas in a severe patient, it could trigger a hospital admission. It should also be recognized that an MCID is an average estimate obtained in studies that included patients with a range of disease severity. This means that, for group mean data, an MCID should be valid as long as it was determined in patients of similar range of severities to those being studied. This was the case with the SGRQ; in the two COPD studies used to calculate the MCID,14,15 the baseline scores fell in the same range as that seen in clinical trials (typically 40–55 units). A recent study in patients with COPD who had more severe disease than those usually studied (baseline mean SGRQ total score of 62) recalculated higher values for the SGRQ MCID (−8.3 at 1 month and −7.1 at 6 months).16 Unfortunately, the authors did not use the methodology used to derive the MCID in a moderately severe population, so it is not possible to conclude from their analysis whether a higher MCID should be used for more severe patients.16 Intuitively, a higher MCID for more severe patients appears incorrect, since such patients may be more aware of the benefits of small improvements than patients with milder disease.
Finally, although COPD is a very heterogeneous disease, there is currently no evidence to support the creation of different MCIDs for different phenotypes, because treatment effects are measured in relatively unselected populations. In the future, there may be an argument to calculate MCIDs in defined subgroups, but this will require adequately powered studies.
Ceiling effects – no further room for PRO improvement?
Now that COPD treatments are becoming more effective, another question concerns the potential for “ceiling effects” – that is, whether the patients improve so much with treatment that there is no room for further improvement. Unfortunately, that is not yet the case (at least for the SGRQ), as illustrated by data from the ECLIPSE study (Figure 2).17 Even in patients with Global Initiative for Chronic Obstructive Lung Disease (GOLD) grade II disease (recruited from secondary and tertiary care centers and presumably effectively treated), the mean SGRQ score was 42.5, with few patients having scores <25 (the threshold suggested by GOLD as the point above which regular treatment for symptoms should be considered1). Given that modern drugs produce an improvement in the SGRQ score of ~4 units, it is clear that there is a lot of capacity for further improvement before a ceiling is reached.
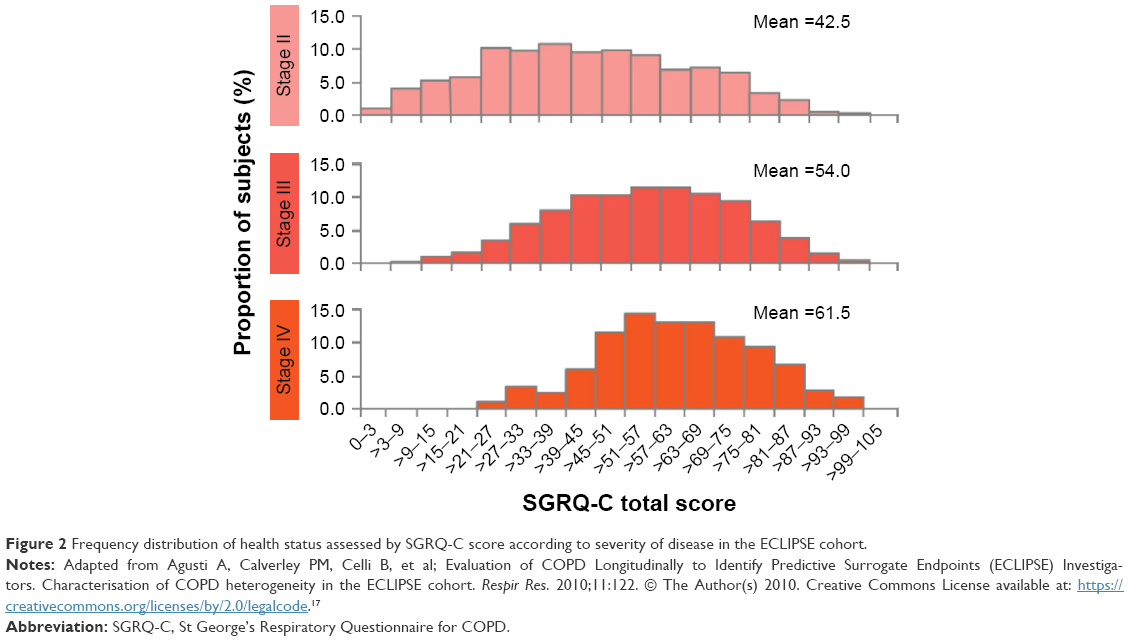 | Figure 2 Frequency distribution of health status assessed by SGRQ-C score according to severity of disease in the ECLIPSE cohort. |
What is a responder analysis?
A responder analysis simply counts the number of patients who improved by more than the chosen response threshold (usually the MCID). There are two main ways of reporting responder analyses, either as a percentage (eg, 15% more patients responded with Treatment A compared to Treatment B) or as an odds ratio (OR), which gives the odds of response vs non-response (eg, an OR of 1.6 shows that there was a 60% greater odds of a patient reporting a clinically significant response vs non-response with Treatment A than Treatment B). However, such values provide no information on the shape of the distribution curve.
When searching for responders, a bimodal distribution such as that shown in the top panel of Figure 1 would be ideal, as this suggests that there is a discrete population of responders who stand out from the rest of the patient population. This almost never happens; a normal distribution of scores is more typical, as shown in the middle panel. At best, there may be a number of patients who show a large response, resulting in a skewed distribution as in the bottom panel of Figure 1. Such a population would have characteristic frequency distributions, as simulated in Figure 3. It can be seen that Treatment A shifted the distribution to the right, that is, there were more responders. (Note also that there is a slight skew suggesting that there may be more large responders with Treatment A than with Treatment B.)
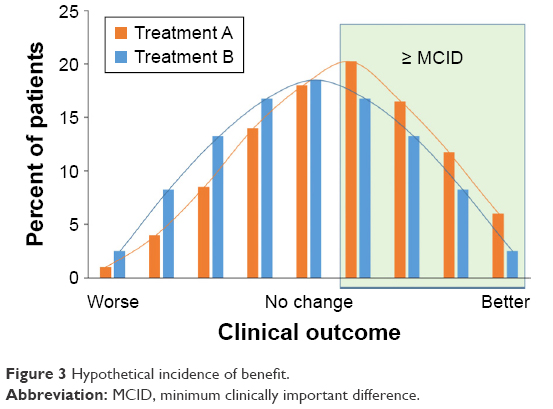 | Figure 3 Hypothetical incidence of benefit. |
In the preceding example, the cut-point used for determining who is or is not a responder is usually the MCID. However, Figure 3 shows that at each level of improvement, the ratio of the proportion of patients receiving Treatment A vs Treatment B remains relatively constant. A useful alternative to presenting the data is cumulative distribution curves, as these show the entire distribution of responses, as represented in Figure 4 (which uses the same data as Figure 3). Although the data in Figures 3 and 4 are provided as a hypothetical example, this phenomenon is commonly seen in clinical study results and has been shown using a range of threshold values, both above and below the MCID,18,19 even down to half of the MCID.20 This is an important observation, since it makes discussions about the precise value of the MCID largely redundant.
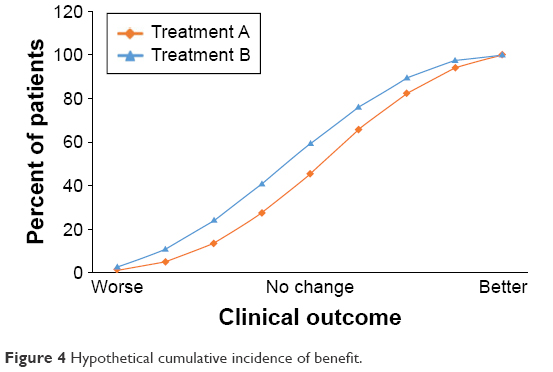 | Figure 4 Hypothetical cumulative incidence of benefit. |
Responder analyses have typically considered only the proportion of patients who experience a clinically relevant improvement, and so are treated as dichotomous variables (ie, improved/not improved). This may be regarded as a limitation, however, because it is also important to consider the patients who experienced a clinically relevant deterioration. For that reason, consideration is being given to parameters such as “net change” – which is the difference between the proportion of responders and the proportion who worsened.21
A worked example
In a 24-week study (Study A) comparing a LAMA/LABA combination with the individual bronchodilators and placebo, all three active treatment groups reported large changes from baseline in SGRQ total score, with big differences from placebo.13 However, in the responder analysis, only 44%–48% of patients in the active groups had an improvement from baseline of at least the MCID. In a similar study (Study B) comparing a different LAMA/LABA combination with its components and placebo, 64% of patients in the LAMA/LABA arm were considered responders.22 In isolation, these data could suggest that this combination offers better efficacy than that seen in Study A. However, in Study B, 57% of patients in the placebo group were responders to treatment, compared with 34% in Study A. Further, the mean differences from placebo in SGRQ total score were much smaller than those in Study A. These data illustrate the value of including a placebo control arm and of considering both mean data and responder analyses. It is reasonable to suggest that in Study B, very large placebo responses may have eroded some of the estimated treatment effect and led to an underestimation of the “true” relative clinical benefit of an active intervention. Clearly, it is important to understand the mechanisms of the placebo response and measure what the equivalent placebo or “medical attention” effect is in routine clinical practice.
In both the analysis of mean data and responder data in these two studies, there were small differences between the combination group and the monotherapies. In isolation, this could be taken to suggest that combination treatment offered little advantage compared to the individual components – yet clinical experience is that a proportion of patients do perceive additional benefit from combining bronchodilators.
Hypothetical data are used in Table 1 to illustrate these points. In this example, there are large changes from baseline in the mean score in all three active groups, with differences from placebo of just under or just over the MCID in the two mono-bronchodilator groups and a larger difference from placebo in the dual bronchodilator group. The additional number of patients who benefit from one treatment compared to another can then be calculated. The difference in percentage responders between LAMA and placebo (18%) translates to 18 patients in every 100 benefiting from LAMA compared with placebo. Furthermore, an additional 12 patients would be anticipated to gain benefit from LAMA/LABA over LAMA alone. A more commonly used way of presenting the response data in publications is ORs. This calculation shows that patients have 70% greater odds of response vs non-response to LAMA compared to placebo; the odds of response vs non-response with the dual bronchodilator compared to placebo would be more than doubled (2.5 times) (Table 1). Therefore, this way of expressing the data can be useful when describing not only active vs placebo comparisons but also active vs active comparisons.
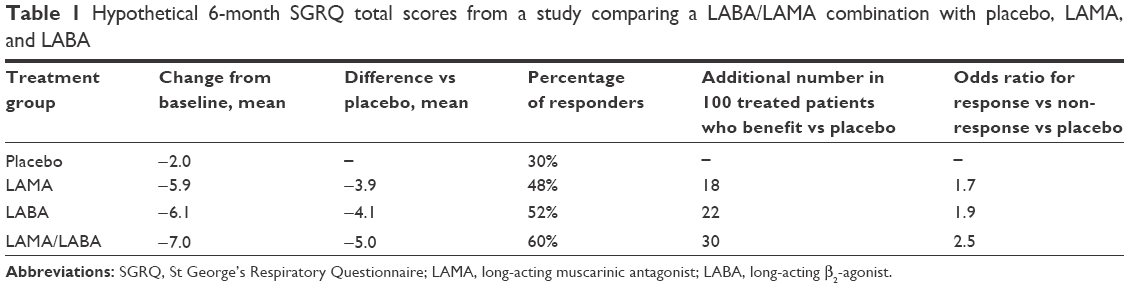 | Table 1 Hypothetical 6-month SGRQ total scores from a study comparing a LABA/LAMA combination with placebo, LAMA, and LABA |
As this example shows, there is no single correct way to represent the size of the additional benefit. However, physicians do have a grasp of probabilities and understand what is meant by a statement that “with drug X there is a Y% greater chance of a clinically significant response than with drug Z.”
How does the study design influence the PRO results?
A number of study design factors should be taken into account when considering whether results of PROs obtained in clinical trials are applicable to clinical practice. For example, treatment during the run-in period can affect the baseline SGRQ score. In the majority of trials, there is some washout period of medication prior to the baseline assessments, whereas in clinical practice, it is more likely that treatment will be “stepped up” rather than “washed out”. The issue of washing out a previous treatment effect is particularly important when interpreting crossover study results where an inadequate washout prevents patients returning to a baseline value before the second treatment block.
Concurrent medication may also affect the magnitude of any treatment effect on PRO and other end points. Most studies permit the use of rescue medication and may report changes in rescue use as an end point; however, the use of other concurrent medication and oxygen supplementation can vary widely.
A final point related to study design concerns blinding. Some authors have suggested that randomizing patients can reduce bias even if open-label comparators are used.23 However, the potential influence of patients receiving medication they recognize, and may have a favorable (or unfavorable) impression of, should be considered when interpreting both PRO and adverse event data. This can be a particular challenge when study procedures cannot be blinded – pulmonary rehabilitation as an example.
What’s the effect of early withdrawal from the study?
A key aspect to consider when interpreting PRO results is the statistical model used in the analysis and especially whether there was an assessment of the impact of missing data. Premature withdrawal from a study is common, particularly in a study with a placebo arm. This can result in a “healthy survivor” population completing the study, with differential withdrawal between treatment arms potentially reducing the observed treatment–placebo difference. Differential dropout being greatest in the placebo arm has been observed in a number of large, long-term studies in COPD, including TORCH (Towards a Revolution in COPD Health)24 and UPLIFT (Understanding Potential Long-Term Impacts on Function with Tiotropium).25 This can even be an issue with studies that do not have a placebo group – in the POET-COPD (Prevention of Exacerbations with Tiotropium in COPD) study, for example, patients receiving salmeterol were significantly more likely to withdraw prematurely (17.7%) than those receiving tiotropium (15.8%; P=0.02).26
The influence of early withdrawal can also alter the reported results, depending on the type of analysis presented. Pharmacological intervention clinical trials are typically analyzed on an “intention-to-treat” basis, with every patient who is randomized to treatment being included in the analysis, even if they only attend the randomization visit. In contrast, some designs (such as pulmonary rehabilitation studies) tend to use “per protocol” or “completer” analyses, in which the data are analyzed for patients who reached a specific visit or complete a specific proportion of the treatment.27,28 The two different analyses could potentially give very contrasting results, with a healthy survivor effect having a particular impact on completer analyses since patients who did not benefit from study treatment would be more likely to withdraw. However, intention-to-treat analyses have their own problems, since they require some form of imputation method (with its associated assumptions) to substitute values for the missing data.
Has the choice of study population influenced the PRO results?
Although relevant to all efficacy and safety end points, given the inherently patient-centric nature of PROs, it is especially important to consider whether the population recruited into a trial is representative of the patient that a clinician is treating. Clinical trial inclusion and exclusion criteria can have an impact on the data. In COPD trials, it is common to limit patient recruitment to a population with not only a defined level of disease severity, usually measured as FEV1, but also a minimum level of breathlessness as measured by the Medical Research Council (MRC) dyspnea score. In studies investigating exacerbations, the recruited population may be “enriched” by requiring a history of exacerbations. These inclusion criteria are often not standardized across trials. Finally, the geographic distribution of a study may limit its application to individual clinical practice. Although standardized procedures are used in the translation and cultural adaptation of PRO instruments, the underlying health system may affect results as may any differences in efficacy caused by ethnic variations in drug metabolism.
What’s the influence of the clinical trial process on PRO results?
Patients who enter clinical trials often improve even if they receive no active treatment. This is probably due to a number of mechanisms. First, there is the well-known Hawthorne effect, first described in the 1950s to explain the results of a series of productivity studies (it is named after the factory where the first study took place).29 This term is now used to describe the positive impact and resulting behavioral changes of study participants due to the fact that they are being observed. This may affect not only the patient (eg, greater adherence to concomitant therapy) but also the investigator (earlier intervention in response to a deterioration). One mechanism may be the high frequency of visits, since it has been shown that patients randomized to be seen regularly in a clinical trial showed a larger response (in terms of quality of life) compared to those seen only at the beginning and end.30 Another potential mechanism is a regression to the mean effect – a statistical phenomenon where, when repeated measurements are made on the same patient, an extreme (relatively high or relatively low) measurement is likely to be followed by a measurement that is closer to the population mean.31 For example, patients recruited because the inclusion criteria dictate high symptom scores are likely to have lower scores when tested a second time. This is different from another source of bias that may come about because patients recruited to trials may be those best known to the physician since they have very active disease and troublesome symptoms. Such patients may subsequently become more stable over the duration of the trial even if they receive placebo, so their PRO score will improve. Finally, there is also perhaps a true placebo effect in which the patients feel better just because they are receiving increased medical attention.
Health status measurements are designed to capture a range of disease and treatment effects, so they may be particularly sensitive to the various effects of joining a trial. With the SGRQ, an improvement from baseline is almost always seen, typically 2 units (ie, approximately half of the MCID). Recent evidence, reported in abstract form, suggests that this effect may be greater in low-to-medium socioeconomic countries, where patients can get access to better health care through participation in a clinical trial.32 Importantly, such patients appear to have a commensurately larger response to treatment.
How relevant are the results to routine clinical practice?
Use of PROs was previously confined to clinical research because the instruments were too long and complex for use in routine clinical practice. Translating changes in PRO score into something that is meaningful for clinicians has proved challenging. The MCID and responder analysis discussed earlier help that process; however, short validated instruments such as the COPD Assessment Test (CAT) have now become available.33 The CAT was specifically designed both for use in routine practice and to be applicable to clinical trials, and there is emerging evidence that it has a level of sensitivity to treatment that is equivalent to the SGRQ.34 In this context, it is worth noting that mapping the CAT score to SGRQ score would suggest a value of 1.6 for the CAT MCID,35 but an individual patient estimate would be 2 units.36 Thus, for the first time, PRO data from clinical trials are directly comparable to measurements obtainable in clinical practice, which may help the translation of efficacy measured in trials to potential effectiveness in practice.
Summary
This manuscript has discussed a range of important issues that arise when critically reviewing PRO data generated from clinical trials. The importance is explained of evaluating the tool selected by the investigators and critically reviewing the way that the data are presented and interpreted, including how the MCID is used. Evaluating data in different ways was also suggested. It is important to understand that clinical trial results are specific both to the populations and the treatments studied; indeed, a new treatment’s eventual indication may be limited to the population in which it has been studied. Therefore, study results may be more or less applicable to broader clinical practice, depending on factors such as the design of the study, the patients recruited, and the end points used.
Current treatment guidelines provide few evidence-based recommendations on the incremental effectiveness of an additional maintenance therapy, reflecting the limited evidence base. Furthermore, although most treatments provide an incremental gain at a population level, that improvement can be the result of all patients getting better, some patients having no improvement, whereas others gain a large benefit, or (and more likely) a combination of these. This means that, even if a treatment is associated with a large effect at a population level, it is difficult to predict the level of response for an individual patient. This emphasizes the importance of reviewing PRO data using different methods of analysis and with the results presented in a range of ways in order to gain a more complete picture of a treatment’s effectiveness. If we stick to the view that benefit is only present if the mean change in a population exceeds the MCID improvement, we may not be aware of large treatment effects that some patients experience. Thus, there appears to be an argument for exploring other methods of reporting benefit. For example, when considering the extent of benefit from the addition of a second agent, the proportion of patients who benefit may be more informative than the mean difference alone – although this will, of course, require a consensus around what constitutes a minimum worthwhile additional number. Alternatively, and for the practising clinician possibly more usefully, the data could be expressed as the probability that a patient will respond to the addition of a second drug.
A further and more contentious area of discussion is the role of placebo as a comparator, given the clinical trial effect in PRO scores. Although it has not been studied, it is likely that some of the factors that contribute to this effect in a clinical trial will also operate in routine practice – for example, changing health behaviors, better adherence to concomitant therapy, better inhaler use, and the effect of a health care professional showing interest and understanding of a patient’s condition.
Conclusion
Data from PROs are crucial when evaluating the effectiveness of a treatment in COPD. For the practising clinician, the most important consideration is the importance of individualization of treatment (and of treatment goals). To inform such treatment, clinicians need to critically review PRO data. It is hoped that the questions posed here will help to build a framework for this critical review.
Acknowledgments
Medical writing and editorial support was provided by David Young of Young Medical Communications and Consulting Ltd. This support was funded by GlaxoSmithKline. The authors would like to acknowledge David Young’s contribution to this manuscript.
Disclosure
Professor Jones reports that in the past he received speaker and advisory board fees from AstraZeneca, GlaxoSmithKline (GSK), Mundipharma, and Novartis. He also received funding for his role as an External Expert consultant prior to joining GSK. He is currently employed, in part, by GSK as a Global Medical Expert in addition to his position in St George’s, University of London. Professor Rennard has received reimbursement for attending a symposium, speaking, and/or consulting from ABIM, Able Associates, Advantage Healthcare, Align2Action, Almirall, APT, ATS, AstraZeneca, Baxter, Boehringer-Ingelheim, Chiesi, CIPLA, ClearView Healthcare, Cleveland Clinic, CME Incite, Complete Medical Group, COPD Foundation, Cory Paeth, CSA, CSL, CTS Carmel, Daiichi Sankyo, Decision Resources, Dunn Group, Easton Associates, Elevation Pharma, FirstWord, Forest, Frankel Group, Gerson, GSK, Gilead, Grifols, GroupH, Guidepoint Global, Haymarket, HealthStar, Huron Consulting, Incite, Inthought, IntraMed (Forest), Johnson & Johnson, LEK, McKinsey, Medical Knowledge, Mediummune, Methodist Health System (Dallas), Navigant, NCI Consulting, Novartis, Nuvis, Pearl, Penn Technology, Pfizer, PlanningShop, Prescott, Pro Ed Comm, ProiMed, PSL FirstWord, Pulmatrix, Quadrant, Qwessential, Regeneron, Saatchi and Saatchi, Schlesinger Associates, Strategic North, Synapse, Takeda, Theron, WebMD. Professor Rennard’s institution has received grant support from NHLBI, Nebraska DHHS, Otsuka, Pfizer, GSK, Boehringer Ingelheim, Nycomed, Astra-Zeneca, Centocor, and Almirall. In August 2015, Professor Rennard became an employee of AstraZeneca and owns shares. Ms Tabberer is an employee of, and holds stock in, GSK. Mr Riley is an employee of, and holds stock in, GSK. Doctor Vahdati-Bolouri is an employee of, and holds stock in, GSK. Professor Barnes is an employee of GSK and owns shares/share options in GSK. The authors report no other conflicts of interest in this work.
References
Global Initiative for Chronic Obstructive Lung Disease [homepage on the Internet]. Global Strategy for the Diagnosis, Management, and Prevention of Chronic Obstructive Pulmonary Disease; 2016. www.goldcopd.org. Accessed July 16, 2016. | ||
National Institute for Health and Care Excellence [webpage on the Internet]. Chronic Obstructive Pulmonary Disease Pathway; 2015. http://pathways.nice.org.uk/pathways/chronic-obstructive-pulmonary-disease. Accessed August 24, 2015. | ||
Rennard S, Thomashow B, Crapo J, et al. Introducing the COPD foundation guide for diagnosis and management of COPD, recommendations of the COPD foundation. COPD J Chronic Obstr Pulm Dis. 2013;10(3):378–389. | ||
European Medicines Agency. Reflection Paper on the Regulatory Guidance for the Use of Health-Related Quality of Life (HRQL) Measures in the Evaluation of Medicinal Products. London: European Medicines Agency; 2005. | ||
US Department of Health and Human Services. Chronic Obstructive Pulmonary Disease: Developing Drugs for Treatment – Guidance for Industry. Silver Spring, MD; 2016. http://www.fda.gov/ucm/groups/fdagov-public/@fdagov-drugs-gen/documents/document/ucm071575.pdf. Accessed July 16, 2016. | ||
Schulz KF, Altman DG, Moher D. CONSORT 2010 Statement: updated guidelines for reporting parallel group randomised trials. BMJ. 2010;340:c332. | ||
Jones PW, Beeh KM, Chapman KR, Decramer M, Mahler DA, Wedzicha JA. Minimal clinically important differences in pharmacological trials. Am J Respir Crit Care Med. 2014;189(3):250–255. | ||
Rennard SI. Minimal clinically important difference, clinical perspective: an opinion. COPD. 2005;2(1):51–55. | ||
Norman GR, Sloan JA, Wyrwich KW. Interpretation of changes in health-related quality of life: the remarkable universality of half a standard deviation. Med Care. 2003;41(5):582–592. | ||
Jones PW. St George’s Respiratory Questionnaire: MCID. COPD. 2005;2(1):75–79. | ||
Karner C, Chong J, Poole P. Tiotropium versus placebo for chronic obstructive pulmonary disease. Cochrane Database Syst Rev. 2014;7:CD009285. | ||
Cope S, Donohue JF, Jansen JP, et al. Comparative efficacy of long-acting bronchodilators for COPD: a network meta-analysis. Respir Res. 2013;14:100. | ||
Donohue JF, Maleki-Yazdi MR, Kilbride S, Mehta R, Kalberg C, Church A. Efficacy and safety of once-daily umeclidinium/vilanterol 62.5/25 mcg in COPD. Respir Med. 2013;107(10):1538–1546. | ||
Jones PW, Quirk FH, Baveystock CM, Littlejohns P. A self-complete measure of health status for chronic airflow limitation. The St George’s Respiratory Questionnaire. Am Rev Respir Dis. 1992;145(6):1321–1327. | ||
Jones PW, Bosh TK. Quality of life changes in COPD patients treated with salmeterol. Am J Respir Crit Care Med. 1997;155(4):1283–1289. | ||
Welling JB, Hartman JE, Ten Hacken NH, Klooster K, Slebos D-J. The minimal important difference for the St George’s Respiratory Questionnaire in patients with severe COPD. Eur Respir J. 2015;46(6):1598–1604. | ||
Agusti A, Calverley PM, Celli B, et al; Evaluation of COPD Longitudinally to Identify Predictive Surrogate Endpoints (ECLIPSE) Investigators. Characterisation of COPD heterogeneity in the ECLIPSE cohort. Respir Res. 2010;11:122. | ||
Norman GR, Sridhar FG, Guyatt GH, Walter SD. Relation of distribution- and anchor-based approaches in interpretation of changes in health-related quality of life. Med Care. 2001;39(10):1039–1047. | ||
Jones PW. Interpreting thresholds for a clinically significant change in health status in asthma and COPD. Eur Respir J. 2002;19(3):398–404. | ||
Jones PW, Gelhorn H, Wilson H, et al. Responder analyses for treatment effects in COPD using the SGRQ appear to be largely independent of the value used to determine a clinically significant response. Am J Respir Crit Care Med. 2015;191:A4454. | ||
Jones PW, Leidy NK, Hareendran A, Lamarca R, Chuecos F, Garcia Gil E. The effect of aclidinium bromide on daily respiratory symptoms of COPD, measured using the evaluating respiratory symptoms in COPD (E-RS: COPD) diary: pooled analysis of two 6-month Phase III studies. Respir Res. 2016;17:61. | ||
Bateman ED, Ferguson GT, Barnes N, et al. Dual bronchodilation with QVA149 versus single bronchodilator therapy: the SHINE study. Eur Respir J. 2013;42(6):1484–1494. | ||
Beeh K-M, Beier J, Donohue JF. Clinical trial design in chronic obstructive pulmonary disease: current perspectives and considerations with regard to blinding of tiotropium. Respir Res. 2012;13:52. | ||
Calverley PM, Anderson JA, Celli B, et al. Salmeterol and fluticasone propionate and survival in chronic obstructive pulmonary disease. N Engl J Med. 2007;356(8):775–789. | ||
Tashkin DP, Celli B, Senn S, et al. A 4-year trial of tiotropium in chronic obstructive pulmonary disease. N Engl J Med. 2008;359(15):1543–1554. | ||
Vogelmeier C, Hederer B, Glaab T, et al. Tiotropium versus salmeterol for the prevention of exacerbations of COPD. N Engl J Med. 2011;364(12):1093–1103. | ||
Casaburi R, Kukafka D, Cooper CB, Witek TJ, Kesten S. Improvement in exercise tolerance with the combination of tiotropium and pulmonary rehabilitation in patients with COPD. Chest. 2005;127(3):809–817. | ||
Laviolette L, Bourbeau J, Bernard S, et al. Assessing the impact of pulmonary rehabilitation on functional status in COPD. Thorax. 2008;63(2):115–121. | ||
Landsberger HA. Hawthorne Revisited. Ithaca, NY: The New York State School of Industrial and Labor Relations; 1958. | ||
McCarney R, Warner J, Iliffe S, van Haselen R, Griffin M, Fisher P. The Hawthorne effect: a randomised, controlled trial. BMC Med Res Methodol. 2007;7(1):30. | ||
Barnett AG, van der Pols JC, Dobson AJ. Regression to the mean: what it is and how to deal with it. Int J Epidemiol. 2005;34(1):215–220. | ||
Jones PW, Gelhorn H, Wilson H, et al. Effect of bronchodilator and placebo therapy on SGRQ score in patients over 3 years: difference between low/medium and high socio-economic countries. Am J Respir Crit Care Med. 2014;189(Meeting Abstracts):A5962. | ||
Jones PW, Harding G, Berry P, Wiklund I, Chen W-H, Kline Leidy N. Development and first validation of the COPD Assessment Test. Eur Respir J. 2009;34(3):648–654. | ||
Singh D, Worsley S, Zhu C-Q, Hardaker L, Church A. Umeclidinium/vilanterol versus fluticasone propionate/salmeterol in COPD: a randomised trial. BMC Pulm Med. 2015;15:91. | ||
Jones PW. Responsiveness of the COPD Assessment Test: the minimal clinically important difference does matter (response). Chest. 2012;142(1):267–268. | ||
Kon SS, Canavan JL, Jones SE, et al. Minimum clinically important difference for the COPD Assessment Test: a prospective analysis. Lancet Respir Med. 2014;2(3):195–203. |
 © 2016 The Author(s). This work is published and licensed by Dove Medical Press Limited. The
full terms of this license are available at https://www.dovepress.com/terms
and incorporate the Creative Commons Attribution
- Non Commercial (unported, 3.0) License.
By accessing the work you hereby accept the Terms. Non-commercial uses of the work are permitted
without any further permission from Dove Medical Press Limited, provided the work is properly
attributed. For permission for commercial use of this work, please see paragraphs 4.2 and 5 of our Terms.
© 2016 The Author(s). This work is published and licensed by Dove Medical Press Limited. The
full terms of this license are available at https://www.dovepress.com/terms
and incorporate the Creative Commons Attribution
- Non Commercial (unported, 3.0) License.
By accessing the work you hereby accept the Terms. Non-commercial uses of the work are permitted
without any further permission from Dove Medical Press Limited, provided the work is properly
attributed. For permission for commercial use of this work, please see paragraphs 4.2 and 5 of our Terms.