Back to Journals » International Journal of General Medicine » Volume 14
International Normalized Ratio to Albumin Ratio (PTAR): An Objective Risk Stratification Tool in Patients with Sepsis
Authors Wang S, Ding S, Luo H ![]() , Chai X
, Chai X
Received 5 February 2021
Accepted for publication 20 April 2021
Published 12 May 2021 Volume 2021:14 Pages 1829—1841
DOI https://doi.org/10.2147/IJGM.S305085
Checked for plagiarism Yes
Review by Single anonymous peer review
Peer reviewer comments 3
Editor who approved publication: Dr Scott Fraser
Shaoxiong Wang,1– 3,* Shuizi Ding,4,* Hong Luo,4 Xiangping Chai1– 3
1Department of Emergency Medicine, The Second Xiangya Hospital, Central South University, Changsha, Hunan, People’s Republic of China; 2Emergency Medicine and Difficult Disease Institute, The Second Xiangya Hospital, Central South University, Changsha, Hunan, People’s Republic of China; 3Trauma Center, The Second Xiangya Hospital, Central South University, Changsha,Hunan, People’s Republic of China; 4Department of Pulmonary and Critical Care Medicine, The Second Xiangya Hospital, Central South University, Changsha, Hunan, People’s Republic of China
*These authors contributed equally to this work
Correspondence: Xiangping Chai
Central South University, 139 Renmin Middle Road, Changsha City, Hunan Province, People’s Republic of China
Tel +13687318830
Email [email protected]
Background: Sepsis is a life-threatening multiple-organ dysfunction caused by dysregulation of host response to severe infection. Liver failure is a validated independent predictor of mortality. Accurate and rapid assessment of liver function is critical in patients with sepsis. However, an appropriate scoring system for liver function requires further development.
Objective: Our study aimed to validate the usefulness of the prothrombin time–international normalized ratio (PT-INR) to albumin ratio (PTAR) in predicting the mortality of patients with sepsis.
Methods: Data on a total of 4536 patients, obtained from the Multiparameter Intelligent Monitoring in Intensive Care III database, were included in our retrospective study. Logistic regression, Poisson regression with robust variance estimate analysis, and Cox proportional hazards models were used to explore the relationship between PTAR and mortality. Area under the curve (AUC) and decision curve analysis (DCA) were used to estimate the performance of PTAR in predicting the prognosis in septic patient.
Results: Multivariable Poisson regression showed that the relative risk (RR) of PTAR to ICU mortality, hospital mortality, and 28-day and 90-day mortality in septic patients was 1.26 (95% CI: 1.15– 1.37), 1.24 (95% CI: 1.15– 1.34), 1.23 (95% CI: 1.15– 1.31), and 1.21 (95% CI: 1.13– 1.28), respectively. Multivariable Cox regression showed that the hazard ratio (HR) of PTAR to 28-day mortality and 90-day mortality was 1.56 (95% CI: 1.44– 1.70), and 1.55 (95% CI: 1.43– 1.68), respectively. PTAR showed a moderate discrimination capacity in predicting hospital mortality (AUC: 0.655, 95% CI: 0.636– 0.675) and 90-day mortality (AUC: 0.650, 95% CI: 0.633– 0.667).
Conclusion: The PTAR scoring system is a convenient tool for predicting the prognosis of patients with sepsis.
Keywords: albumin, INR, PTAR, sepsis, liver injury, prognosis
Introductions
Sepsis, which is a life-threatening multiple organ dysfunction resulting from a dysregulated host response to severe infection, is a common cause of hospital mortality.1 Although the mortality caused by sepsis has decreased substantially due to improved recognition and intervention over the past 2 decades, the mortality of patients with sepsis and septic shock remains at 32.8% according to the study of Surviving Sepsis Campaign (SSC).2 Liver, a key integrator of microbial responses in sepsis, is a target organ during sepsis, and decreased hepatic function is associated with poor prognosis. According to previous studies, mortality rates of septic patients with hepatic dysfunction or failure range from 54 to 68%, which is higher than the mortality rates of septic patients with lung dysfunction or failure which is commonly observed in sepsis.3 Therefore, recognizing liver injury and dysfunction in sepsis is of great importance to clinicians and scientists.
Several ICU scoring models have been developed to assess the severity of sepsis in patients. Among these models, the Sepsis-related Organ Failure Assessment (SOFA) score is widely used to evaluate the extent of organ dysfunction and has become one of the criteria in sepsis diagnosis.4 However, although it evaluates the serum bilirubin level, which is a biomarker of liver function, the SOFA scoring system was not originally developed for assessing liver function. The current liver-specific scoring models, such as the Child-Pugh model5 and the model for end-stage liver disease (MELD),6 were constructed to predict the prognosis of patients with severe or chronic liver disease. Although previous studies have validated the potential value of the aforementioned models, the complex and subjective parameters utilized by these models limit their clinical use. Recently, Haruki et al7 created a new objective liver function scoring model named the prothrombin time–international normalized ratio (PT-INR) to albumin ratio (PTAR) via a retrospective study including 199 patients who received elective hepatic resection for hepatocellular carcinoma, and validated the excellent performance of PTAR in predicting outcomes of those patients. Similar with patients with hepatocellular carcinoma resection, patients with sepsis also have liver function disorder and reserves damage. Albumin and PT-INR abnormalities have been widely described in patients with sepsis, particularly in intensive care units.8–10
Based on previous studies, we speculated that PTAR may be a potentially valuable tool for assessing liver function in patients with sepsis. Therefore, in this retrospective study, we explored the prognostic value of PTAR in predicting the mortality of patients with sepsis.
Materials and Methods
Database
Patient data were collected from the Medical Information Mart for Intensive Care III (MIMIC-III), which is a large publicly accessible database containing data on more than 40,000 ICU patients admitted to the Beth Israel Deaconess Medical Center (BIDMC) from 2001 to 2012.11 The MIMIC-III database includes general information (ie, demographics, ICD-9 codes, and common ICU scores), intervention approaches (ie, medications, procedures, and laboratory tests), and survival (ie, length of stay and mortality) on ICU patients. After completing the training course entitled “Protecting Human Research Participants,” from the National Institute of Health, we obtained access to the database (certificate number: 36983240) and performed data extraction.
Study Population and Exclusion Criteria
Our study included adult patients meeting the criteria for sepsis 3.0.1 The exclusion criteria were as follows: (1) age ≤16 years old or >90 years old; (2) spent less than 24 hr in the ICU; (3) lack of PT-INR, bilirubin or albumin data in 24 hr after admission to ICU; and (4) missing mortality data. With respect to patients admitted to ICU more than once, only the first ICU admission data were included in our study.
Data Extraction and Definition
We used the structure query language (SQL) with pgAdmin4 PostgreSQL 9.6 to extract data from the MIMIC-III database. Data included those on patient demographics, clinical vital signs (ie, blood pressure, heart rate, respiratory rate, and temperature), and related laboratory parameters (ie, commonly performed blood tests, liver function assessments, coagulation tests, renal function assessments, and electrolyte levels). The parameters used in our study had less than 10% of missing values, and the missing values were filled using median values. Common prognostic models (ie, SOFA, qSOFA, SIRS, LODS, OASIS, APS-III, SAPS, SAPS-II, MELD, and PTAR) were also extracted or evaluated in our study. For those prognostic models, we used the worst value for related parameters, assessed on the first day in the ICU; our calculations for the evaluation of these models were based on formulas obtained in previous studies.4,6,7,12–16 Especially, the ALBI score was calculated according to the formula: ALBI = log10 (bilirubin (μmol/L)) * 0.66–0.085 * albumin (g/L),15 and PTAR was calculated by dividing the PT-INR by serum albumin level (g/dl).7 We also extracted the liver function score in SOFA scoring model and defined four grades, point 0, 1, 2 and ≥3 to assess the effect of SOFA score to evaluate liver function during sepsis.
The primary endpoint was hospital mortality, defined as death during hospitalization. Other endpoints included length of ICU and hospital stay, ICU mortality, and 28- and 90-day mortality after discharge from hospital. Additionally, we divided the study population into two subgroups, biliary liver disease subgroup and non-biliary liver disease subgroup, by carefully screening the diagnosis of those patients. Biliary liver disease patient in biliary liver disease subgroup had a history of hepatic or biliary diseases such as hepatitis, cholangitis, and hepatic tumors.
Statistical Analyses
Continuous variables were tested for normality using the Skewness-Kurtosis test, and expressed as mean ± SD or median (IQR) depending on normal or non-normal distribution; continuous variables were compared using Student’s t-test or Kruskal–Wallis test, as appropriate. Categorical variables were expressed as N (%) and compared using the Chi-square test. Correlations between PTAR and endpoints (ICU mortality, hospital mortality, 28- and 90-day mortality) were examined using univariable and multivariable logistic regression by reporting the odds ratio (OR). Because of the relatively high mortality rate, Poisson regression analysis with robust variance estimate was used to report the relative risk (RR) values.17 Multicollinearity was examined using the variance inflation factor (VIF), with a VIF ≥ 10 indicating the presence of multicollinearity. To further estimate the effectiveness of PTAR in predicting prognosis, univariate and multivariate Cox proportional hazards models were used to report the hazard ratio (HR). Confounders, including age, gender, weight, and APS-III score, were adjusted in all the multivariable regression models and multivariable Cox models. The interaction between age and SAPS-II score was also adjusted in multivariable Cox models. Patients were assigned to the following three groups based on their PTAR grades: low PTAR group (PTAR < 0.54); medium PTAR group (0.54≤ PTAR < 0.82); and high PTAR group (PTAR ≥ 0.82) using X-tile software (Version 3.6.1, Yale University, USA) to calculate the optimal cut-off values. Cumulative survival curves of these three groups were plotted using the Kaplan–Meier method and compared using the Log rank test. A receiver operating characteristic curve (ROC) of PTAR and other models were then plotted, and their areas under the curve (AUC) were calculated and compared using the Chi-square test. With regard to clinical usefulness, we examined net benefit by using Decision Curve Analysis (DCA).18,19 All the tests were operated in Stata 16.0, and a two-tailed p value of less than 0.05 was considered statistically significant.
Results
Characteristics of Included Patients
As per our inclusion and exclusion criteria, 4536 patients were enrolled in our study (Figure 1). The mean age of all the patients with sepsis was 63.3 (51.3–75.8) years, and 57.9% of the participants were male. Patients in the non-survivor cohort had a higher percentage of biliary or hepatic diseases than those in the survivor cohort (49.4% vs 38.8%, p < 0.001). The median PTAR scores in the non-survivor and survivor cohorts were 0.7 (IQR 0.5–1.0) and 0.5 (IQR 0.4–0.7), respectively. Compared with the survivor cohort, the non-survivor cohort showed significantly higher SOFA (9.0 vs 5.0, p<0.001), APS-III (71.0 vs 50.0, p<0.001), MELD (18.8 vs 12.1, p<0.001), and ALBI (−1.3 vs −1.6, p<0.001) scores, as well as a higher percentage of liver failure (19.2% vs 4.7%, p<0.001), kidney failure (57.0% vs 30.5%, p<0.001), coagulation failure (41.0% vs 16.3%, p<0.001), and circulatory failure (73.1% vs 41.9%, p<0.001), during the ICU stay. The overall mortality in the ICU, in hospital, and during 28 and 90 days after discharge from hospital, were 17.7%, 22.2%, 27.9%, and 32.2%, respectively. Details on the baseline characteristics of the patients included in our present study are shown in Tables 1 and 2 and S1.
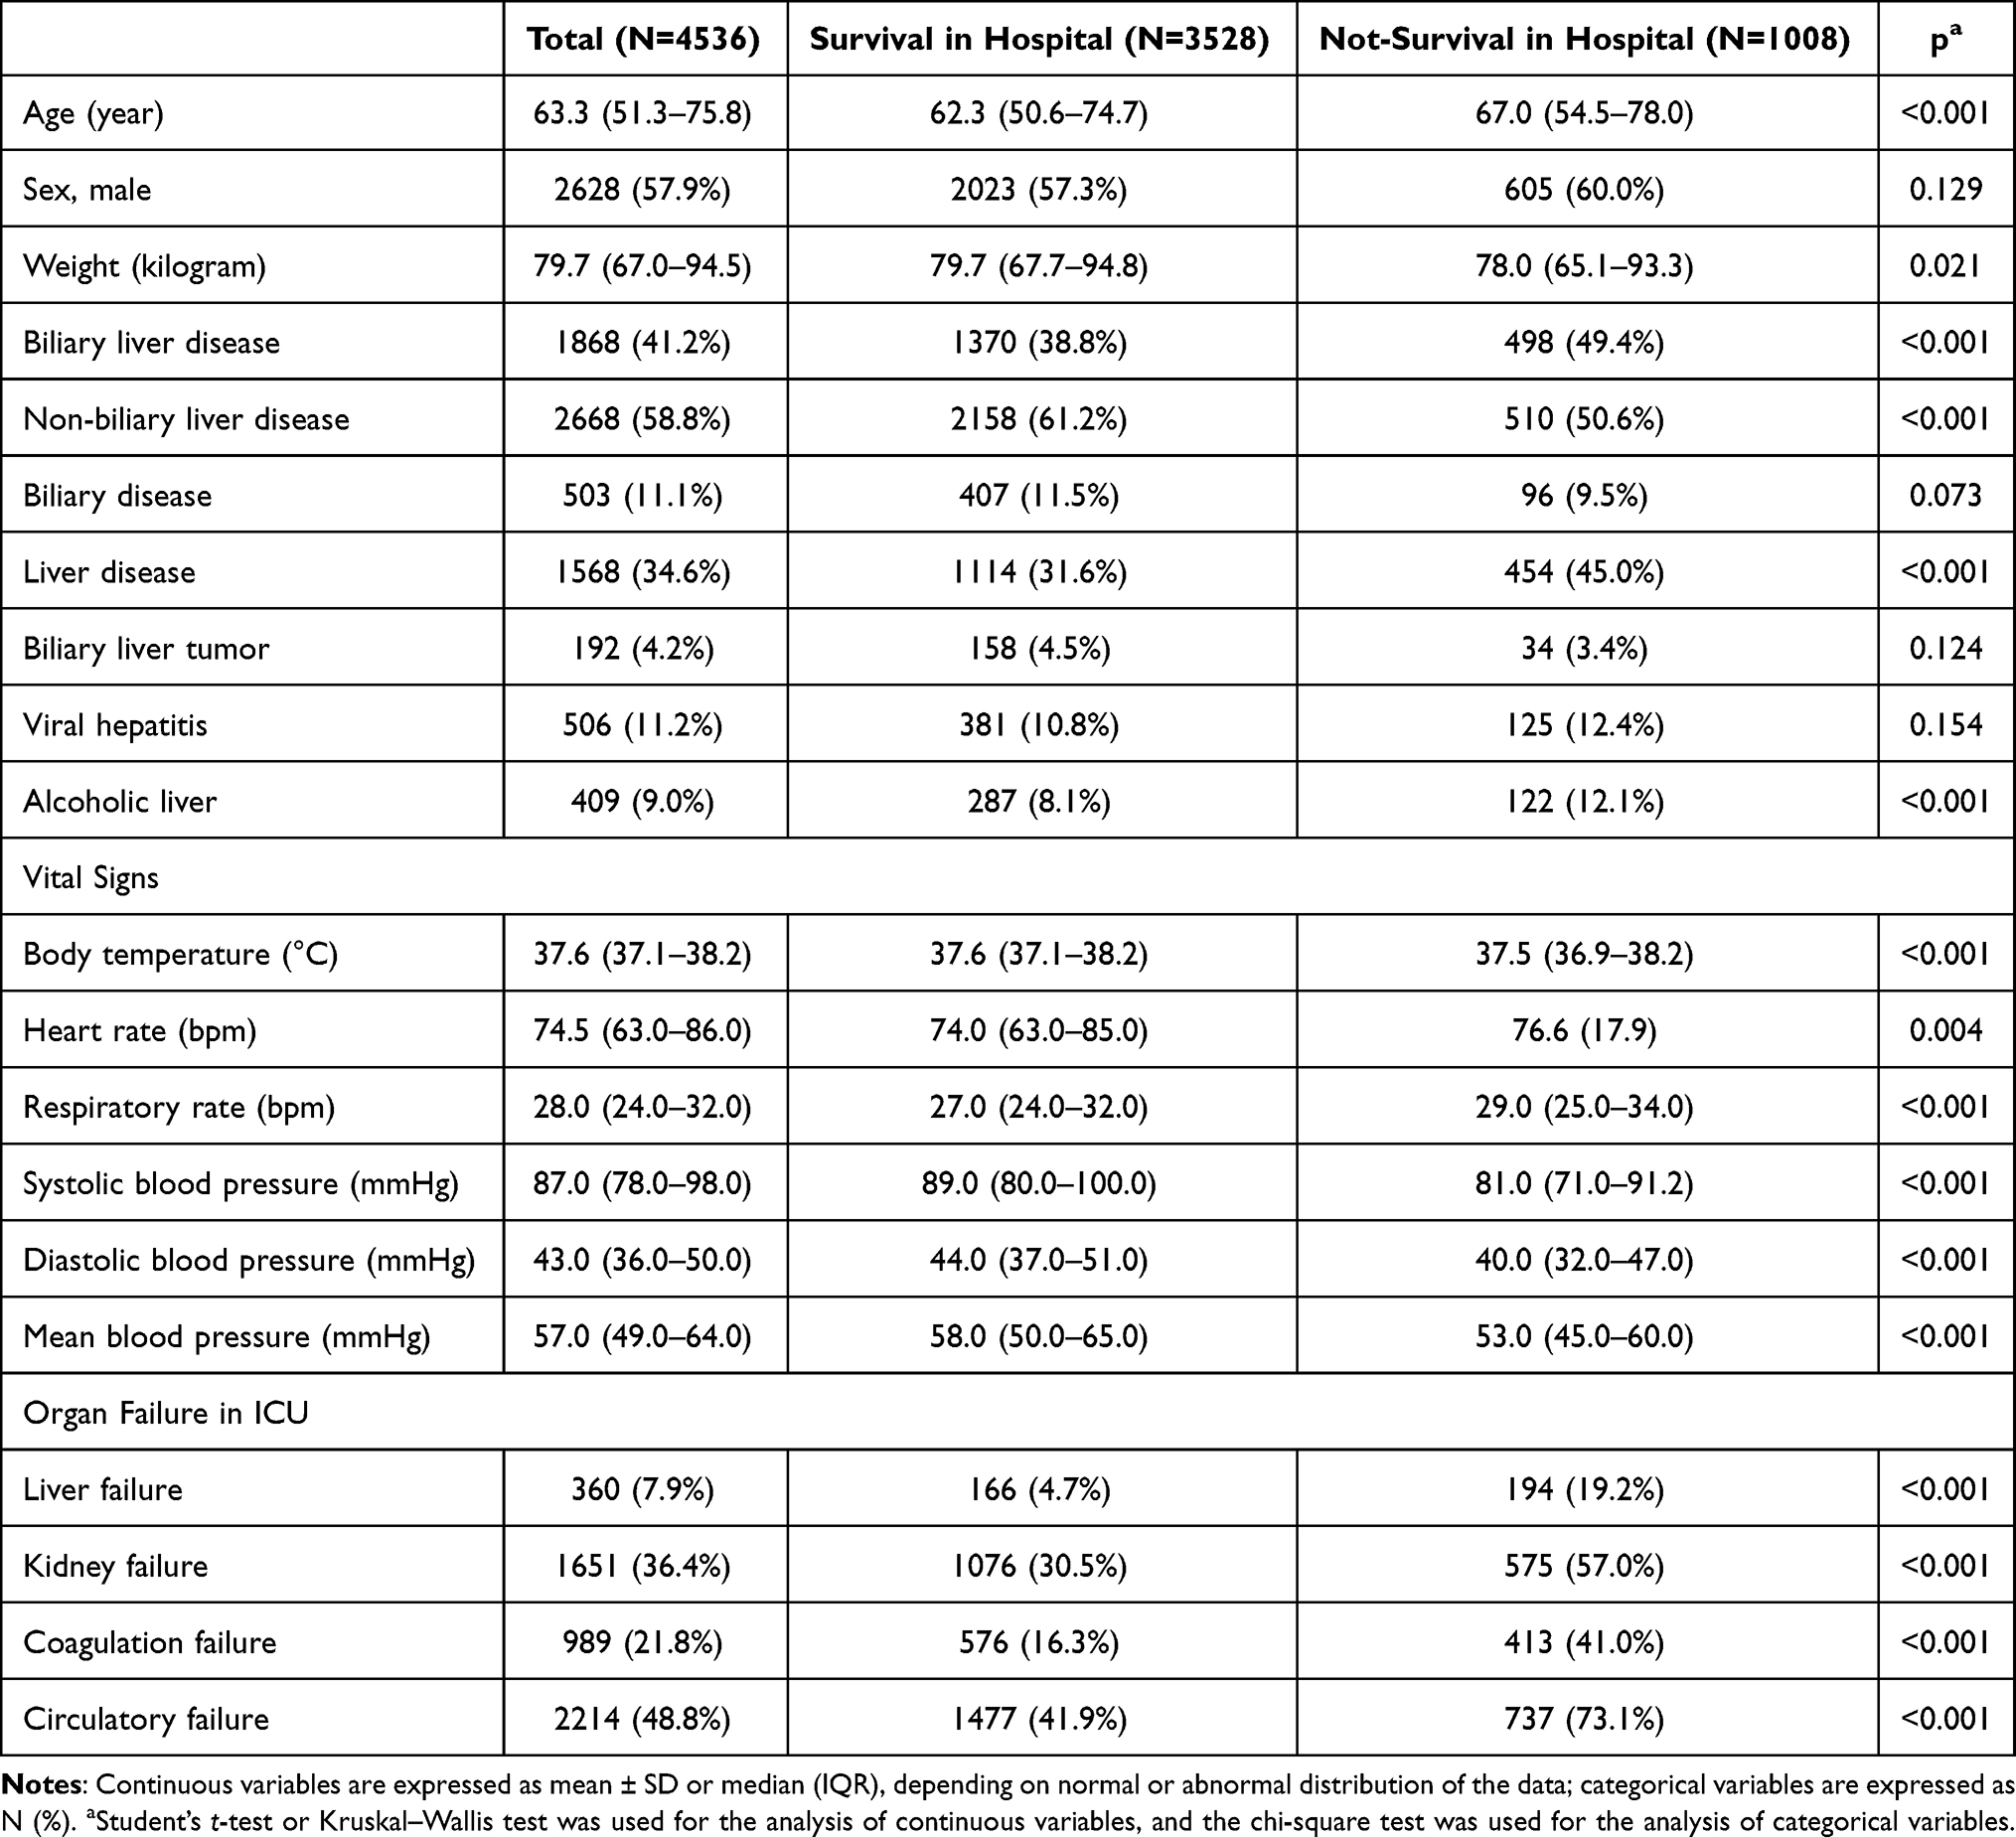 |
Table 1 Characteristics of the Study Population, Stratified by Survival |
 |
Table 2 Clinical Scores and Outcomes, Stratified by Survival |
 |
Figure 1 A flow diagram on the study participants included in our study. |
Association Between PTAR and Outcomes
As shown in Table 1, PTAR scores were significantly higher in non-survivors compared to survivors (0.7 vs 0.5, p<0.001). Logistic regression and Poisson regression with robust variance estimate analysis were conducted in all the patients and subgroup patients included in our study (Table 3,Table 4 and S2). Multivariable logistic regression analysis shows that the adjusted OR of PTAR to ICU mortality, hospital mortality, and 28- and 90-day mortality in all the patients was 1.64 (95% CI: 1.40–1.92), 1.66 (95% CI: 1.42–1.94), 1.70 (95% CI: 1.46–1.99), 1.67 (95% CI: 1.43–1.95) respectively. After Poisson regression with robust variance analysis, the adjusted RR of PTAR to these four kinds of mortality in all the patients included in our study was 1.26 (95% CI: 1.15–1.37), 1.24 (95% CI: 1.15–1.34), 1.23 (95% CI: 1.15–1.31), and 1.21 (95% CI: 1.13–1.28), respectively, which suggested an increase in PTAR score increased the risk of mortality events of patients with sepsis.
 |
Table 3 Univariate and Multivariate PRRV for RR of PTAR to Mortalities |
Cox regression was also used to further estimate the association of PTAR with 28-day and 90-day mortality. After adjusting for covariates including age, sex, weight, SAPS-II score, and the interaction of age and SAPS-II score, the HR of PTAR to 28- and 90-day mortality was 1.56 (95% CI: 1.44–1.70), and 1.55 (95% CI: 1.43–1.68), respectively.
The patients were divided into three groups, based on their PTAR scores, as follows: low PTAR group (PTAR < 0.54); medium PTAR group (0.54≤ PTAR < 0.82); and high PTAR group (PTAR ≥ 0.82). The 28-day mortality rates in these three groups were 16.4% (380/2318), 26.6% (337/1269), and 42.8% (404/945), respectively; 90-day mortality rates were 21.1% (489/2318), 35.0% (444/1269), and 50.8% (480/945), respectively. Kaplan-Meier curves show that mortality rates differed significantly among the low, medium, and high PTAR-score groups and differed poorly among SOFA-liver score groups (Figure 2).
 |
Figure 2 Kaplan–Meier curves stratified by different PTAR grades and SOFA-liver grades. Kaplan–Meier curves of (A and C) 28-day mortality and (B and D) 90-day mortality in all the patients with sepsis included in our study. |
Performance of PTAR Score in Predicting Mortality in Patients with Sepsis
Further analysis of PTAR in predicting the mortality of patients with sepsis indicated that this scoring system showed a moderate discrimination capacity in predicting hospital mortality (AUC: 0.655, 95% CI: 0.636–0.675) and 90-day mortality (AUC: 0.650, 95% CI: 0.633–0.667). Other widely used ICU scoring systems and models used to estimate liver function were also analyzed in this study (Table 5 and Figure 3). The widely used SOFA score showed a slightly better AUC than that of PTAR in predicting hospital mortality (AUCSOFA VS AUCPTAR: 0.700 VS 0.655, p<0.001); however, AUC did not differ significantly between SOFA and PTAR in predicting 90-day mortality (AUCSOFA VS AUCPTAR: 0.664 VS 0.650, p=0.294). Another widely used model, qSOFA, performed worse than PTAR in predicting both hospital mortality (AUCqSOFA VS AUCPTAR: 0.560 VS 0.655, p<0.001) and 90-day mortality (AUCqSOFA VS AUCPTAR: 0.558 VS 0.650, p<0.001). Compared with other liver function assessment models, PTAR presented similar effect with MELD and better effect than ALBI and SOFA-liver score. Detailed results of these analyses, as well as those of subgroup analyses, are shown in Table 5 and Figure 3.
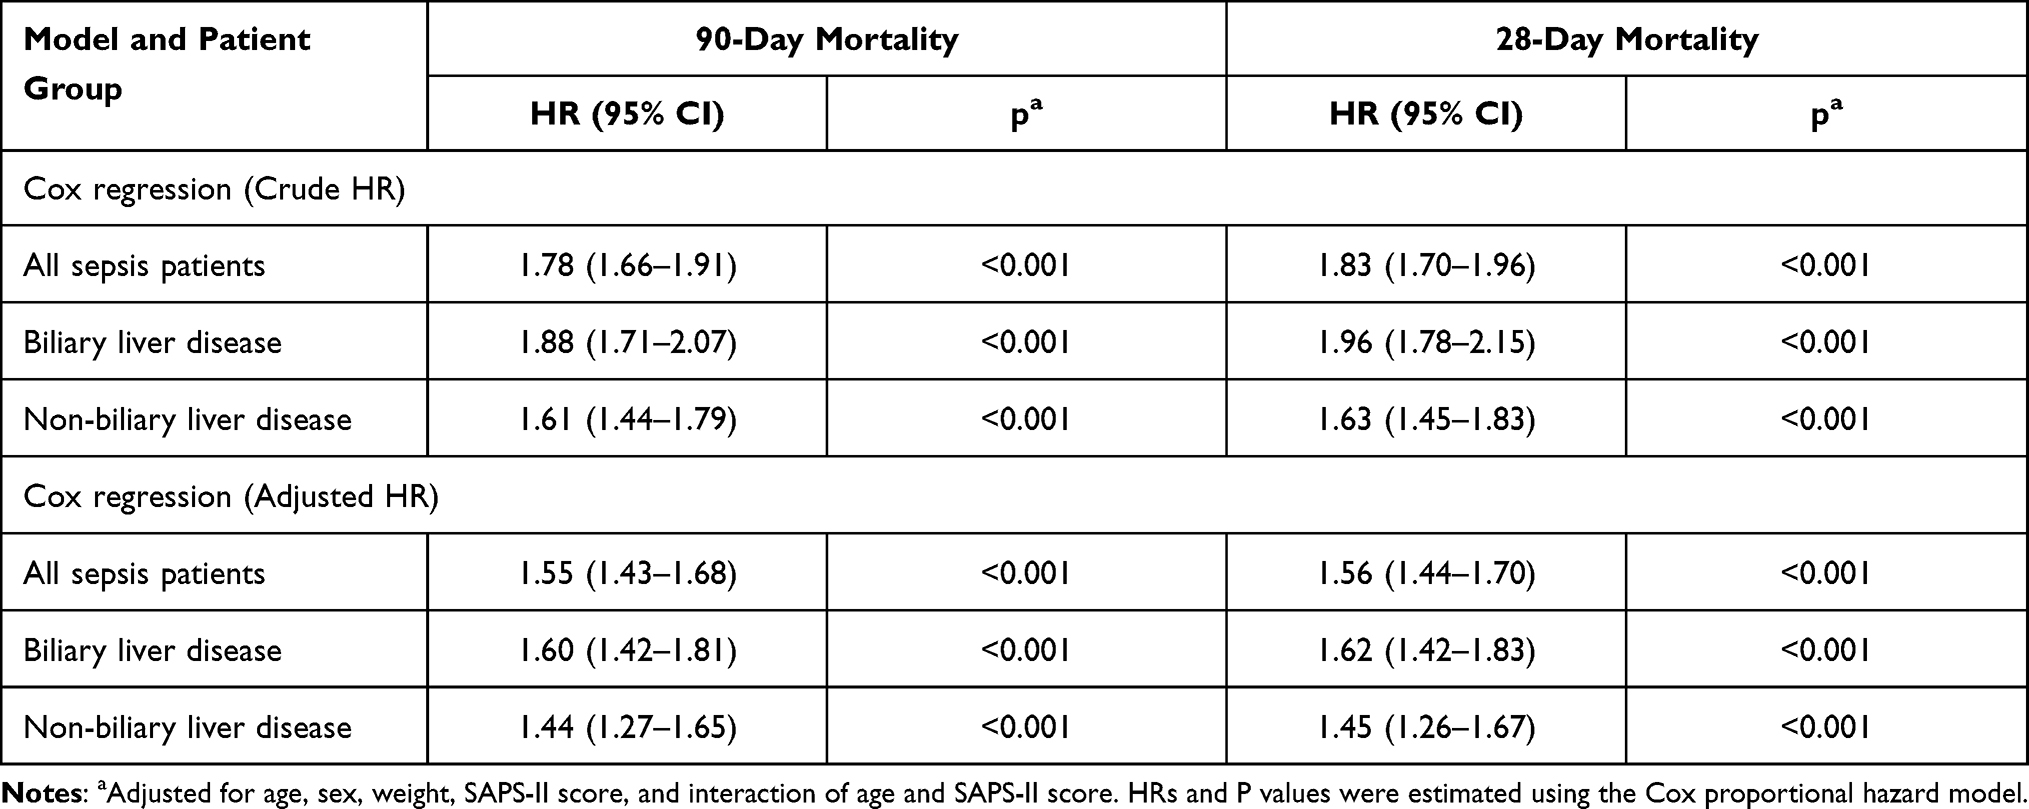 |
Table 4 Cox Regression Analysis to Evaluate the Usefulness of PTAR in Predicting 28-and 90-Day Mortality |
 |
Table 5 AUROC of Scores to Predict Mortality, and the Comparison Between PTAR and Other Scores |
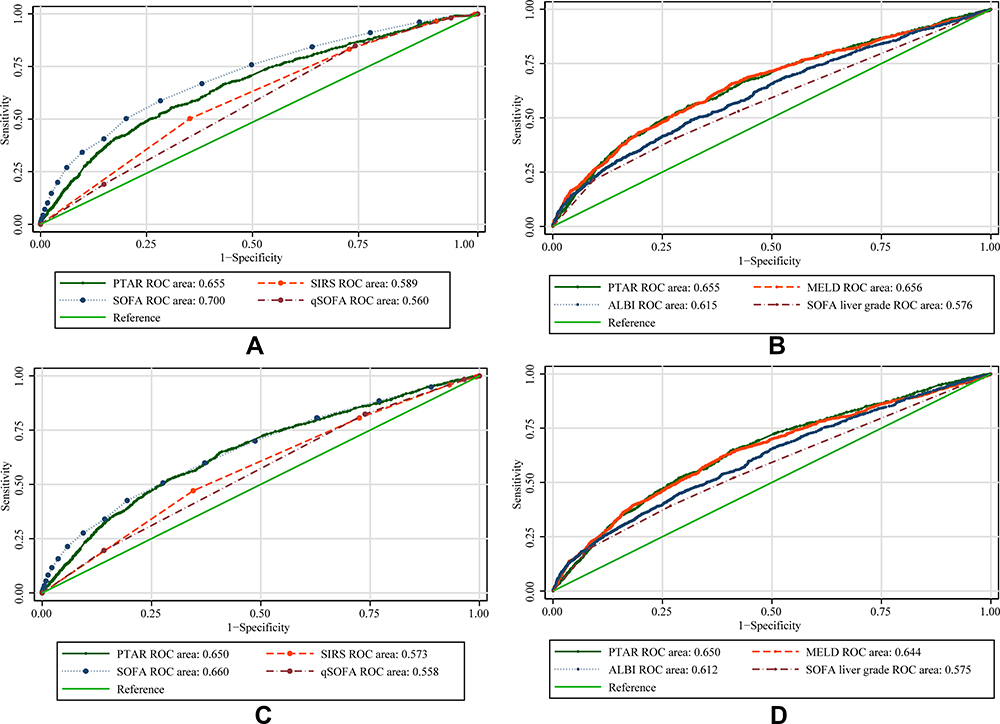 |
Figure 3 Area under the receiver operating characteristic curve (AUROC) analysis of the predictive ability of PTAR and other scoring models in all the patients with sepsis. AUROC of the (A) PTAR, SIRS, SOFA, qSOFA and (B) MELD, PTAR, ALBI, SOFA-liver models’ ability to predict hospital mortality. AUROC of the (C) PTAR, SIRS, SOFA, qSOFA and (D) MELD, PTAR, ALBI, SOFA-liver models’ ability to predict 90-day mortality. Abbreviations: SIRS, systemic inflammatory response syndrome; MELD, model for end-stage liver disease; PTAR, prothrombin time–international normalized ratio to albumin ratio; SOFA, sequential organ failure assessment; ALBI, albumin-bilirubin. |
Figure 4 illustrates the decision curves for PTAR and other models to predict the 90-day mortality. All models were useful between a narrow range of threshold probabilities of 35–45%, and the net benefit of PTAR was better than most models between threshold probabilities of 30–50%.
 |
Figure 4 Decision curve analysis of PTAR and other prognostic models for 90-day mortality of (A and B) all sepsis patients, (C and D) sepsis patients with biliary liver diseases and (E and F) sepsis patients without biliary liver diseases. |
Subgroup Analyses
To explore whether PTAR showed different efficiencies in predicting the mortality of patients with and without the history of biliary-liver diseases, we performed a subgroup analysis of patients with or without biliary-liver disease (Tables 1–5 and Supplementary Data). These subgroup results were consistent with those obtained for all the patients with sepsis evaluated in our study. Poisson and Cox regression analyses showed that after adjustment, RR for hospital mortality was 1.24 (95% CI: 1.11–1.38) and HR for 90-day mortality was 1.60 (95% CI: 1.42–1.81) in patients with biliary-hepatic diseases. RR for hospital mortality was 1.20 (95% CI: 1.08–1.34) and HR for 90-day mortality was 1.44 (95% CI: 1.27–1.65) in patients without biliary-hepatic diseases. KM analysis also showed that high PTAR grade patient had high risk of mortality in both patients with or without biliary-liver diseases.
Interestingly, when predicting hospital mortality and 90-day mortality, PTAR showed no significantly different performances with SOFA score in non-biliary liver disease patients, but significant differences in patients with biliary liver disease. Consistent with analysis of all patients, PTAR performed better than other scoring models including qSOFA, SOFA-liver score and ALBI during subgroup analysis. Additionally, the decision curve illustrated PTAR was useful between threshold probabilities of 30–60% in patient with biliary liver disease and threshold probabilities of 30–40% in patient without biliary liver disease.
Discussion
Consistent with the results obtained in other studies, we observed a poor outcome in ICU patients with sepsis. We also observed a higher proportion of liver failure (19.2% vs 4.7%, p<0.001) in the non-survival cohort in all the septic patients included in our study. To explore the prognostic value of PTAR in estimating the liver function of patients with sepsis, we validated the association between increased PTAR and increased mortality. Furthermore, PTAR presented comparable performance of predicting mortality especially in predicting 90-day mortality with SOFA score model and showed better risk stratification of liver function than SOFA score model.
Sepsis is a complex disorder resulted from an overwhelming infection. Described by Bone et al in 1989,12,20 sepsis is defined as a maladaptive systematic inflammation due to infection, and was previously diagnosed using the systemic inflammatory response syndrome (SIRS) criteria. However, after decades of research and clinical practice, the poor specificity of SIRS was finally examined in 2003.21 In 2016, the Third International Consensus officially defined sepsis and septic shock as a life-threatening organ dysfunction following a dysregulated host response to an infection.1 The Sequential Organ Failure Assessment (SOFA) score is currently widely used to estimate the extent of multiple-organ dysfunction, including hepatic injury, in patients with sepsis.
As one of concerned organs in sepsis diagnosis criterion, previous studies have validated the crucial role of the liver in immune surveillance, defense, and regulation during sepsis.22 Because of its unique anatomical structure, liver is consistently exposed to pathogens, toxins, danger signals, and antigens from both arterial and portal systems, and is an essential line of defense in inhibition of pathogens and prevention of sepsis.23 Several studies have been reported that liver is susceptible to sepsis-induced impairment.24–26 Attacks from pathogens, excessive inflammatory responses, and pathologic events, such as hepatocellular injury, hypoxic hepatitis, and cholestasis, can facilitate hepatic injury and even failure during sepsis.27
Though unlike acute respiratory failure, acute kidney failure and acute heart failure, liver dysfunction or impairment gained relatively low attention in patients with sepsis. Indeed, liver failure or impairment has been validated an independent predictor of mortality in patients with sepsis.28 Consistent with previous reports, we observed an increased incidence of hepatic failure in the non-survival cohort under the criteria that included serum bilirubin level of ≥12.0 mg/dL, which indicated the crucial role of liver during sepsis and suggested the potential benefit of recognizing liver status and damage pattern of patients with sepsis.
Actually, pre-existing liver dysfunction has been well recognized an important role in poor outcome and high mortality of critical patients. However, the clinical meaning of mild or moderate liver injury in patients without pre-existing liver dysfunction is less clear.29 The impact of liver dysfunction on mortality and morbidity of critical patients has been controversially reported ranging from the assumption that liver dysfunction contributes little effect on mortality to the opinion that it contributes a higher risk for mortality than other commonly observed organ failure such as lung, renal failure.29 According to previous reports, the prevalence of liver dysfunction was uncertainly estimated range from 1% to 26%.30 In our study, a significantly low incidence (7.9%) of liver failure compared with other organ dysfunction (kidney failure: 36.4%, coagulation failure: 21.8% and circulatory failure: 48.8%) in all sepsis patients was examined. Earlier, Kramer et al conducted a study including a total of 4146 patients with early hepatic dysfunction and found the occurrence of sepsis was significantly higher in the group of patients with hepatic dysfunction than in the control group.31 Similar result was reported by Jensen et al recently.32 Jensen et al reported a study measuring circulating biomarkers in 1096 medical and surgical ICU patients without pre-existing chronic liver disease to assess their hepatic dysfunction. According to their study, they found a strong interaction between severe infection and liver impairment (p = 0.04) when exploring mortality and found no liver variable carried an increased mortality when analyzing patients without severe infection. Jensen et al hypothesized that the liver dysfunction leads to dysregulation in the immune surveillance resulting in increased susceptibility for infections. The conclusion might need to expand, since sepsis-induced liver dysfunction also contribute to this finding. Based on our result and previous studies, whether the prevalence of liver dysfunction was underestimated should be carefully estimated. Besides, assessment of the extent of liver injury in sepsis is worth for further exploration. More specifically, whether the currently used definitions of liver impairment are relevant for septic critically ill patients should be answered and an appropriate assessment tool of liver injury or dysfunction should be well considered.30,33
The PTAR scoring model, first proposed by Haruki et al for the estimation of hepatic function, uses only two objective and accessible parameters: albumin and INR.7 As synthetic indicators of liver, INR and albumin were validated their prognostic value in mortality of patients with sepsis according to previous reports. By combining two objective and accessible parameters, PTAR could be a promising tool in assessing liver function during sepsis.
In our retrospective study, we observed a significant association and correlation between the PTAR score and patient outcomes, with an increased PTAR score indicating worse patient prognosis during all patient analysis and the following subgroup analysis. Furthermore, we observed significant differences in prognoses with respect to different PTAR grades (low, medium, and high) in both all patient and subgroups KM curves analysis. The PTAR score had moderate discrimination ability in predicting hospital and 90-day mortality with AUC of 0.655 and 0.650, respectively. We also found PTAR performed better in patients with biliary liver disease with higher AUC value and better DCA threshold probability compared with patients without biliary liver disease. These results indicated that the PTAR classification may be a practical and accessible tool for rapidly evaluating patients with sepsis upon admission to ICU.
Besides PTAR score model, multiple common ICU and hepatic-specific scoring models have been employed in clinical practice. However, a suitable liver function assessment tool of sepsis remains uncertain. As a criterion in Sepsis 3.0, the SOFA scoring model includes serum bilirubin level as an essential marker for detecting hepatic dysfunction. Derived from SOFA, the Chronic Liver Failure (CLIF)-SOFA model was constructed to evaluate patients with acute to chronic liver failure. Although both SOFA models include hepatic-function analyses, the former model was developed to assess the function of multiple systems, while the later model was intended for patients with liver disease rather than those with sepsis. The currently recommended hepatic-specific scoring models include the End-Stage Liver Disease (MELD), Liver Injury and Failure Evaluation (LiFe), the Child-Pugh system, and albumin-bilirubin (ALBI) originally developed to assess liver function in patients with end-stage chronic liver diseases or hepatic tumors. However, further application of those models was limited because of containing a hepatic-encephalopathy assessment, which is a subjective marker that can introduce bias, or their complex calculation system, especially in ICU situation where objective evidence and rapid assessments are required.
Compared with those models, the PTAR scoring system is simple to use and effective in predicting prognosis in this patient population, as it only requires simple, objective and accessible laboratory-based parameters. Our study showed that the performance of PTAR was better than that of AIBL (0.655 vs 0.615, p<0.001), SIRS (0.655 vs 0.585, p<0.001), qSOFA (0.655 vs 0.560, p<0.001), as well as MELD (0.655 vs 0.656, p=0.903), but was worse than SOFA (0.655 vs 0.700, p<0.001). The SOFA scoring model, which includes multiple parameters for the assessment of different organ function, provided a more comprehensive and systemic assessment of septic patients compared with that of PTAR, thereby showing better performance in predicting hospital mortality than that of PTAR. However, as a comprehensive model, SOFA presented a weak risk stratification capability in different status of liver function. We extracted the SOFA liver score in all patients and found terrible discrimination in KM curves, which suggested that estimating liver function via SOFA or liver score in SOFA was unreliable (Figure 2). Additionally, PTAR performed as well as SOFA in predicting 90-day mortality (0.650 vs 0.664, p=0.294), suggesting its potential prognostic value in long-term events. In regard of another objective liver function assessment tool, though statistically, the PTAR scoring system showed similar performance with MELD in our study, a simple formula of PTAR would be much easier to calculate and applicate in clinical situation.
Application of PTAR in patients on anticoagulant should be careful, since INR is included in PTAR. Usage of coagulation markers in liver function assessment would be limited when patients are on an anticoagulant. The anticoagulant treatment would artificially increase INR resulting overestimate liver injury. For example, MELD-XI was suggested because MELD can overestimate risk when INR is artificially elevated by anticoagulation, which may affect organ allocation.34 Indeed, due to the role of liver in versatile functions, virtually no single parameter is completely applicable in different situation, which explains why it remains challenge to accurately assess liver dysfunction in different clinical situation. For patients with sepsis, the possible bias of PTAR result from anticoagulant and its impact on clinical decision need further estimation.
Limitations
Our study had several limitations. First, patients from MIMIC III database were admitted into the ICU from 2001 to 2012; the criteria and guidelines for sepsis have changed greatly since then. Using the Sepsis 3.0 definition as our inclusion criteria could have led to potential bias in patient selection. Additionally, although several liver-specific models were mentioned above, we only compared the PTAR score with MELD and ALBI, because some parameters required by other scores, such as the extent of hepatic encephalopathy and arterial lactate level, were not available in the database.
Conclusions
In conclusion, PTAR score includes two objective and accessible laboratory parameters, and is appropriately stratified into three levels, rendering it a convenient tool for estimation of liver function in septic patients. The PTAR score may be a useful adjunction to general ICU scoring models, and may help to rapidly identify patients with liver injury and dysfunction. However, more prospective studies are needed to further evaluate this scoring system.
Data Statement and Linking
MIMIC-III database is available at https://mimic.physionet.org/about/mimic/.
Ethics Approval and Consent to Participate
The current study is based on a publicly accessible database, MIMIC-III. The need for patients’ informed consent was waived for this study because all included patients’ information was de-identified.
Acknowledgments
We thank LetPub (www.letpub.com) for its linguistic assistance during the preparation of this manuscript.
Author Contributions
Shaoxiong Wang and Shuizi Ding contributed equally to this work. All authors contributed to data analysis, drafting or revising the article, have agreed on the journal to which the article will be submitted, gave final approval of the version to be published, and agree to be accountable for all aspects of the work. All authors have approved the manuscript and agree with submission.
Disclosure
The authors have no conflicts of interest to declare.
References
1. Singer M, Deutschman CS, Seymour CW, et al. The third international consensus definitions for sepsis and septic shock (Sepsis-3). JAMA. 2016;315(8):801–810. doi:10.1001/jama.2016.0287
2. Levy MM, Rhodes A, Phillips GS, et al. Surviving sepsis campaign: association between performance metrics and outcomes in a 7.5-year study. Intensive Care Med. 2014;40(11):1623–1633. doi:10.1007/s00134-014-3496-0
3. Sun J, Zhang J, Wang X, et al. Gut-liver crosstalk in sepsis-induced liver injury. Critical Care. 2020;24(1):614. doi:10.1186/s13054-020-03327-1
4. Vincent JL, Moreno R, Takala J, et al. The SOFA (Sepsis-related Organ Failure Assessment) score to describe organ dysfunction/failure. On behalf of the Working Group on sepsis-related problems of the European Society of Intensive Care Medicine. Intensive Care Med. 1996;22(7):707–710. doi:10.1007/BF01709751
5. Albers I, Hartmann H, Bircher J, Creutzfeldt W. Superiority of the Child-Pugh classification to quantitative liver function tests for assessing prognosis of liver cirrhosis. Scand J Gastroenterol. 1989;24(3):269–276. doi:10.3109/00365528909093045
6. Kamath PS, Wiesner RH, Malinchoc M, et al. A model to predict survival in patients with end-stage liver disease. Hepatology (Baltimore, Md). 2001;33(2):464–470. doi:10.1053/jhep.2001.22172
7. Haruki K, Shiba H, Saito N, et al. Risk stratification using a novel liver functional reserve score of combination prothrombin time-international normalized ratio to albumin ratio and albumin in patients with hepatocellular carcinoma. Surgery. 2018;164(3):404–410. doi:10.1016/j.surg.2018.02.022
8. Domínguez de Villota E, Mosquera JM, Rubio JJ, et al. Association of a low serum albumin with infection and increased mortality in critically ill patients. Intensive Care Med. 1980;7(1):19–22. doi:10.1007/BF01692917
9. Yin M, Si L, Qin W, et al. Predictive value of serum albumin level for the prognosis of severe sepsis without exogenous human albumin administration: a prospective cohort study. J Intensive Care Med. 2018;33(12):687–694. doi:10.1177/0885066616685300
10. Lyons PG, Micek ST, Hampton N, Kollef MH. Sepsis-associated coagulopathy severity predicts hospital mortality. Crit Care Med. 2018;46(5):736–742. doi:10.1097/CCM.0000000000002997
11. Johnson AE, Pollard TJ, Shen L, et al. MIMIC-III, a freely accessible critical care database. Scientific Data. 2016;3:160035. doi:10.1038/sdata.2016.35
12. Bone RC, Balk RA, Cerra FB, et al. Definitions for sepsis and organ failure and guidelines for the use of innovative therapies in sepsis. The ACCP/SCCM Consensus Conference Committee. American College of Chest Physicians/Society of Critical Care Medicine. Chest. 1992;101(6):1644–1655. doi:10.1378/chest.101.6.1644
13. Le Gall JR, Klar J, Lemeshow S, et al. The Logistic Organ Dysfunction system. A new way to assess organ dysfunction in the intensive care unit. ICU Scoring Group. JAMA. 1996;276(10):802–810. doi:10.1001/jama.1996.03540100046027
14. Le Gall JR, Lemeshow S, Saulnier F. A new Simplified Acute Physiology Score (SAPS II) based on a European/North American multicenter study. JAMA. 1993;270(24):2957–2963. doi:10.1001/jama.1993.03510240069035
15. Johnson PJ, Berhane S, Kagebayashi C, et al. Assessment of liver function in patients with hepatocellular carcinoma: a new evidence-based approach-the ALBI grade. J Clin Oncol. 2015;33(6):550–558. doi:10.1200/JCO.2014.57.9151
16. Johnson AE, Kramer AA, Clifford GD. A new severity of illness scale using a subset of Acute Physiology And Chronic Health Evaluation data elements shows comparable predictive accuracy. Crit Care Med. 2013;41(7):1711–1718. doi:10.1097/CCM.0b013e31828a24fe
17. McNutt LA, Wu C, Xue X, Hafner JP. Estimating the relative risk in cohort studies and clinical trials of common outcomes. Am J Epidemiol. 2003;157(10):940–943. doi:10.1093/aje/kwg074
18. Fitzgerald M, Saville BR, Lewis RJJJ. Decision curve analysis. JAMA. 2015;313(4):409–410. doi:10.1001/jama.2015.37
19. Vickers AJ, Elkin EB. Decision curve analysis: a novel method for evaluating prediction models. Med Decis Making. 2006;26(6):565–574. doi:10.1177/0272989X06295361
20. Bone RC, Fisher CJ, Clemmer TP, Slotman GJ, Metz CA, Balk RAJCCM. Sepsis syndrome: a valid clinical entity. Critical Care Med. 1989;17(5):389–393.
21. Levy MM, Fink MP, Marshall JC, et al. 2001 SCCM/ESICM/ACCP/ATS/SIS International Sepsis Definitions Conference. Intensive Care Med. 2003;29(4):530–538. doi:10.1007/s00134-003-1662-x
22. Heymann F, Tacke F. Immunology in the liver–from homeostasis to disease. Nat Rev Gastroenterol Hepatol. 2016;13(2):88–110. doi:10.1038/nrgastro.2015.200
23. Schnabl B, Brenner DA. Interactions between the intestinal microbiome and liver diseases. Gastroenterology. 2014;146(6):1513–1524. doi:10.1053/j.gastro.2014.01.020
24. Tacke F, Zimmermann HW. Macrophage heterogeneity in liver injury and fibrosis. J Hepatol. 2014;60(5):1090–1096. doi:10.1016/j.jhep.2013.12.025
25. Ren D, Bi Q, Li L, et al. Myeloid-derived suppressor cells accumulate in the liver site after sepsis to induce immunosuppression. Cell Immunol. 2012;279(1):12–20. doi:10.1016/j.cellimm.2012.08.005
26. Hammerich L, Tacke F. Emerging roles of myeloid derived suppressor cells in hepatic inflammation and fibrosis. World J Gastrointest Pathophysiol. 2015;6(3):43–50. doi:10.4291/wjgp.v6.i3.43
27. Strnad P, Tacke F, Koch A, Trautwein C. Liver - guardian, modifier and target of sepsis. Nat Rev Gastroenterol Hepatol. 2017;14(1):55–66. doi:10.1038/nrgastro.2016.168
28. Koch A, Horn A, Dückers H, et al. Increased liver stiffness denotes hepatic dysfunction and mortality risk in critically ill non-cirrhotic patients at a medical ICU. Critical Care. 2011;15(6):R266. doi:10.1186/cc10543
29. Kluge M, Tacke F. Liver impairment in critical illness and sepsis: the dawn of new biomarkers? Ann Transl Med. 2019;7(Suppl 8):S258–S.
30. Nesseler N, Launey Y, Aninat C, et al. Liver dysfunction is associated with long-term mortality in septic shock. Am J Respir Crit Care Med. 2016;193(3):335–337. doi:10.1164/rccm.201508-1660LE
31. Kramer L, Jordan B, Druml W, Bauer P, Metnitz PG. Incidence and prognosis of early hepatic dysfunction in critically ill patients – a prospective multicenter study. Crit Care Med. 2007;35(4):1099–1104. doi:10.1097/01.CCM.0000259462.97164.A0
32. Jensen JS, Peters L, Itenov TS, et al. Biomarker-assisted identification of sepsis-related acute liver impairment: a frequent and deadly condition in critically ill patients. Clin Chem Lab Med. 2019;57(9):1422–1431. doi:10.1515/cclm-2018-1350
33. Nesseler N, Launey Y, Aninat C, Morel F, Mallédant Y, Seguin P. Clinical review: the liver in sepsis. Critical Care. 2012;16(5):235. doi:10.1186/cc11381
34. Heuman DM, Mihas AA, Habib A, et al. MELD‐XI: a rational approach to “sickest first” liver transplantation in cirrhotic patients requiring anticoagulant therapy. Liver Transpl. 2007;13(1):30–37. doi:10.1002/lt.20906
 © 2021 The Author(s). This work is published and licensed by Dove Medical Press Limited. The
full terms of this license are available at https://www.dovepress.com/terms
and incorporate the Creative Commons Attribution
- Non Commercial (unported, 3.0) License.
By accessing the work you hereby accept the Terms. Non-commercial uses of the work are permitted
without any further permission from Dove Medical Press Limited, provided the work is properly
attributed. For permission for commercial use of this work, please see paragraphs 4.2 and 5 of our Terms.
© 2021 The Author(s). This work is published and licensed by Dove Medical Press Limited. The
full terms of this license are available at https://www.dovepress.com/terms
and incorporate the Creative Commons Attribution
- Non Commercial (unported, 3.0) License.
By accessing the work you hereby accept the Terms. Non-commercial uses of the work are permitted
without any further permission from Dove Medical Press Limited, provided the work is properly
attributed. For permission for commercial use of this work, please see paragraphs 4.2 and 5 of our Terms.