Back to Journals » Patient Preference and Adherence » Volume 15
Intention and Perceptions of Healthy Eating versus Actual Intake Among Patients with Type 1 and Type 2 Diabetes and the General Population
Authors Ewers B ![]() , Sørensen MR, Fagt S, Diaz LJ
, Sørensen MR, Fagt S, Diaz LJ ![]() , Vilsbøll T
, Vilsbøll T
Received 17 June 2021
Accepted for publication 21 August 2021
Published 14 September 2021 Volume 2021:15 Pages 2027—2037
DOI https://doi.org/10.2147/PPA.S325214
Checked for plagiarism Yes
Review by Single anonymous peer review
Peer reviewer comments 2
Editor who approved publication: Dr Johnny Chen
Bettina Ewers,1 Mette Rosenlund Sørensen,2 Sisse Fagt,2 Lars J Diaz,1 Tina Vilsbøll1,3
1Clinical Research, Steno Diabetes Center Copenhagen, Gentofte, Denmark; 2The National Food Institute, Technical University of Denmark, Søborg, Denmark; 3Department of Clinical Medicine, Faculty of Health and Medical Sciences, University of Copenhagen, Copenhagen, Denmark
Correspondence: Bettina Ewers
Clinical Research, Steno Diabetes Center Copenhagen, Niels Steensens Vej 2, Gentofte, DK-2820, Denmark
Tel +45 3091 2997
Email [email protected]
Purpose: Intention and perceptions of healthy eating may affect diet-related behavior. We assessed the intention and perceptions of eating healthily in patients with type 1 (T1D) and type 2 diabetes (T2D) compared with the general population. Secondly, differences in diet quality were assessed in patients with diabetes perceiving their dietary habits as more or less healthy.
Materials and Methods: This cross-sectional study included data on socioeconomic status, dietary intake, and questions on healthy eating from adults with T1D (n=426), T2D (n=348) and from the general population (n=2899).
Results: Patients with T2D were less likely to perceive their dietary habits as healthy compared with T1D and the general population. Patients with T1D or T2D perceiving their dietary habits as healthy reported higher intake of vegetables, fruit, fish, fibre and protein. In addition, patients with T1D with perceived healthy versus less healthy dietary habits had lower sugar intake and higher alcohol intake. Overall, adherence to dietary guidelines in patients with T1D and T2D was too low both in self-perceived healthy and less healthy eaters. In comparison with T1D patients, patients with T2D were less likely and the general population was more likely to strive to eat a healthy diet.
Conclusion: Patients with T2D had poorer self-perception of their dietary healthiness and less intention of eating healthily, compared with patients with T1D and the general population. Actual diet quality was higher amongst patients with T1D and T2D perceiving their dietary habits as healthy than those perceiving their dietary habits as less healthy. But inadequate intakes were found in all groups. Health care providers should address and explore the patient’s intention and perceptions of healthy eating when discussing dietary changes in diabetes to improve nutritional support.
Keywords: diabetes, dietary adherence, dietary intake, nutrition
Introduction
Quality of diet and adherence to dietary recommendations are challenging, but essential elements of diabetes self-management with a high impact on glycemic control.1,2 Diabetes research and self-management education programs in nutrition primarily focus on improving nutrition knowledge to achieve metabolic control, and not on how the intention to eat healthily or how perception of healthy eating may affect food choices and diet-related behaviour.3 However, several studies have found a discrepancy between perceptions of diet healthiness and actual diet quality primarily in non-diabetic populations.4–6 If individuals with diabetes perceive their dietary intake to be of higher quality than it actually is, the intention or readiness to change their diet in a healthier direction may be diminished. According to the theory of planned behavior, health-related behavior is best predicted by behavioral intention. An intention is determined by the individual’s attitude towards the behavior (eg expected outcome of performing the behavior), the individual’s perceived confidence in the ability to perform the behavior, and the individual’s perception of others’ approval or disapproval of the behaviour.7 The importance of these components may differ depending on the target population. Patients with type 1 (T1D) and type 2 diabetes (T2D) may perceive that they have a strong personal gain from eating more according to dietary recommendations due to their diabetes. Similarly, social support from family and friends in favor of dietary adherence may also be more prevalent in diabetes compared with individuals without diabetes. We have previously shown that patients with T1D and T2D consume a healthier diet compared with the general Danish population.8 Differences in type and availability of nutrition education and support of patients with T1D and T2D and the general population may also have an impact on how these three groups perceive a healthy diet, and whether they are likely to strive to eat a healthy diet. Patients with diabetes may have misperceptions of the nutritional quality of their diet compared with the dietary recommendations, as found in T2D and non-diabetic populations eg, for intakes of fruit, vegetables, total fat, saturated fat and sodium.4,5,9–11 Additionally, patients’ misperceptions of own dietary healthiness compared with recommendations could misguide health care providers. Especially doctors and nurses, when asking only a few questions to assess overall diet quality and dietary adherence in consultations. Doctors and nurses are gatekeepers determining which patient need further nutrition support with a dietitian. Therefore, they need to be aware that patients with diabetes may perceive their diet as healthier than it actually is according to the dietary recommendations. These aspects have not previously been investigated thoroughly in patients with T1D and T2D. Therefore, the aims of this study were to examine differences in intention and self-perceptions of healthy eating including healthy diet characteristics in patients with T1D and T2D compared with the general population with no known diabetes. Furthermore, to examine differences in actual dietary intake separately for T1D and T2D, in those who assess themselves as healthy or less healthy eaters.
Materials and Methods
Subjects and Methods
Design and Participants
This exploratory cross-sectional study is based on data derived from a Danish dietary survey of 774 patients with diabetes (T1D: n= 426; T2D: n= 348) and data from 2899 individuals with no known diabetes from the Danish National Survey of Diet and Physical Activity (DANSDA).12 A comparison of dietary intake and adherence to dietary guidelines based on data from these two surveys has previously been published.8 The dietary survey of patients with diabetes was an online survey with a cross-sectional design based on a self-administered questionnaire with questions concerning the participant’s dietary intake, physical activity, social background and perceptions of diet healthiness. Data were collected between July 2014 and January 2015. A random sample of adults (>18 years of age); 1500 with T1D and 1500 with T2D from the capital region of Denmark treated at the outpatient clinic at Steno Diabetes Center Copenhagen, Gentofte, Denmark, received a mail with an invitation to participate. The selection of participants has been described previously.8 Exclusion criteria were severe mental or life-threatening disorders. Data on social background and perceptions of diet healthiness in the general population were derived from DANSDA, a cross-sectional survey based on a representative sample of the Danish population randomly drawn from the Danish Civil Registration System.12 Danish citizenship was a criterion for inclusion. Additional exclusion criteria were being residents of nursing homes, individuals receiving meals from outside their home, and those reported being diagnosed with diabetes (n=117). Data were collected between April 2011 and August 2013 and the present study comprises data from 2899 adults (18 to 75 years of age) with no known history of diabetes. Participation rates were 26% in the dietary online survey and 52% in DANSDA.8,12 Both surveys were conducted in accordance with the Declaration of Helsinki and approved by the Danish Data Protection Agency. The Danish Ethics Committee for the Capital Region of Denmark has reviewed both study protocols and reported that no approval was acquired by this authority for these non-invasive studies according to Danish law. In accordance with the Danish regulations for biomedical research, participants gave written informed consent by participating in the dietary survey.
Dietary Data
Data on dietary intake from patients with diabetes were assessed using a web-based semiquantitative 270-items food frequency questionnaire (FFQ) covering dietary intake within the last three months. The FFQ has previously been described and validated in adults with T1D and T2D.13 The dietary data included calculated intake of total energy (kJ/d) and percentages of energy intake (E%) deriving from carbohydrates, saturated fatty acids (SFA), monounsaturated fatty acids (MUFA), polyunsaturated fatty acids (PUFA), protein and added sugar, and calculated intake of alcohol in g/d, dietary fibre in g/d and g/MJ, and the following healthy food groups fruits, vegetables and fish in g/d and g/MJ. Dietary data were used to compare patients with T1D and T2D perceiving their dietary habits as more or less healthy to assess misperceptions of diet healthiness.
Perceived Diet Healthiness and Intention to Eat Healthily
In DANSDA, information about perceived healthy diet characteristics and intention to eat healthily was collected using a structured face-to-face interview with open-ended questions conducted by trained interviewers. The interviewer categorized all answers. In the dietary online survey, patients with T1D and T2D were asked the same questions closed-ended based on the response categories determined in DANSDA. Drop-down response choices for each question were used to compare the results with the general population. The question: “What do you consider a healthy diet?” consisted of 15 possible response categories including “dietary variety”, “home cooked”, “fresh foods/ingredients”, “organic”, “sustainable”, “low-fat”, “high in dietary fibre”, “high in wholegrain foods”, “includes whole meal bread eg ryebread”, “high in vegetables”, “high in fruit”, “includes proteins, vitamins and minerals”, “includes lean meat”, “high in fish”, “low in added sugar”. Up to three answers were allowed for each participant in all three study groups. The question to examine intention to eat healthily: “Do you aim to eat healthily every day?” had five response categories: (1) “Yes, very often”, (2) “Yes, often”, (3) “Occasionally”, (4) “No never”, (5) “Do not know”. Self-perceived dietary habits in patients with T1D and T2D were assessed asking the question: “How do you consider your dietary habits?” with five response categories: (1) “Very unhealthy”, (2) “Unhealthy”, (3) “Neither healthy nor unhealthy”, (4) “Healthy” and (5) “Very healthy”. This question is used in the ongoing Danish National Health Survey.14 For the purpose of analyzing actual intake of nutrients and selected healthy food groups the answers were split into two large groups including “Neither healthy nor unhealthy” and “Healthy and very healthy”.
Other Variables
For patients with diabetes, data on diabetes type, age, gender, height and weight (to calculate body mass index (BMI)), smoking status and diabetes duration were extracted from the electronic medical records using the values closest to the time of study participation. Data on education, occupation, cohabitation and physical activity were collected from the web-based questionnaire. This included the International Physical Activity Questionnaire short form (IPAQ-SF) to assess the level of physical activity.15 Data from DANSDA concerning age, gender, height and weight (for BMI calculation), smoking habits, education, occupation and cohabitation were collected by trained interviewers at the personal interviews. Weight and height were measured by the interviewer. Physical activity level was categorized into a low, moderate or high physical activity level, as described previously.8 In patients with diabetes the IPAQ-SF questionnaire was used to assess physical activity, categorizing into low, moderate and high levels according to standard definitions.15 In the general population physical activity was measured using 7-days with pedometer, adjusted for biking time defining <7500 daily steps as low, 7500 to 9999 daily steps as moderate, and ≥10,000 daily steps as high physical activity. Data on social background included cohabitation (living with a partner/spouse), level of education (no further education, vocational education eg, skilled worker, short further education eg, 1–2 years in a university college, medium further education eg, 2–4 years in a university college, long further education eg, 5 years in a university or unspecified education) and occupational status (employed, unemployed, pensioner, other).
Statistical Analyses
All continuous data were non-normally distributed and presented as medians with interquartile range (IQR). Differences in perceptions of healthy diet characteristics were tested using logistic regression analysis for each binary (yes/no) response category variable in patients with T1D and T2D and the general population adjusted for age, gender and education. We used ordinal logistic regression models to model the behavior of the following ordinal level dependent response category variables to the questions concerning the intention to eat healthily and self-perceived diet healthiness: 1) “Do you aim to eat healthily every day?” and 2) “How do you consider your dietary habits?” including the following independent variables in each model: study group, age, gender and education. In the analysis of response category variable to question 1 we excluded individuals who answered “I do not know” which was not part of the ordinal scale response categories. In the statistical analysis of response category variables to question 2 we excluded the response categories “Unhealthy” and “Very unhealthy”. No one reported having very unhealthy dietary habits and only 20 patients (2.6%) with diabetes assessed their dietary habits as unhealthy. Differences in perceived and actual diet quality were assessed by classifying respondents with T1D and T2D into two groups respectively based on self-perceived dietary habits reported as either “Neither healthy nor unhealthy dietary habits” or “Healthy and very healthy dietary habits”, and testing for significant differences in calculated dietary quality of carbohydrates, added sugar, total fat, SFA, MUFA, PUFA, protein, alcohol, dietary fibre, fruit, vegetables and fish between these groups using the nonparametric Mann Whitney U-test. For all statistical tests, a two-sided significance level of P < 0.05 was used. We used SPSS software version 25.0 (IBM Corp, Armonk, NY, USA) for descriptive statistical data, SAS Enterprise Guide software version 7.1 (SAS Institute Inc., Cary, NC, USA) for logistic regression data analyses and R software version 4.0.2 (R Core Team, R Foundation for Statistical Computing, Vienna, Austria) for ordinal regression analyses.
Results
Participants with T2D were older, more frequently male and pensioners, less physically active and with a higher BMI compared with T1D and the general population (Table 1). Participants with T1D were comparable with the general population concerning gender distribution, age, BMI, numbers living with a partner or spouse, being employed and having a high level of physical activity. More smokers and individuals with no education or a vocational education were represented in the general population compared with patients with T1D and T2D, and more patients with T1D had a long further education compared with in T2D and the general population.
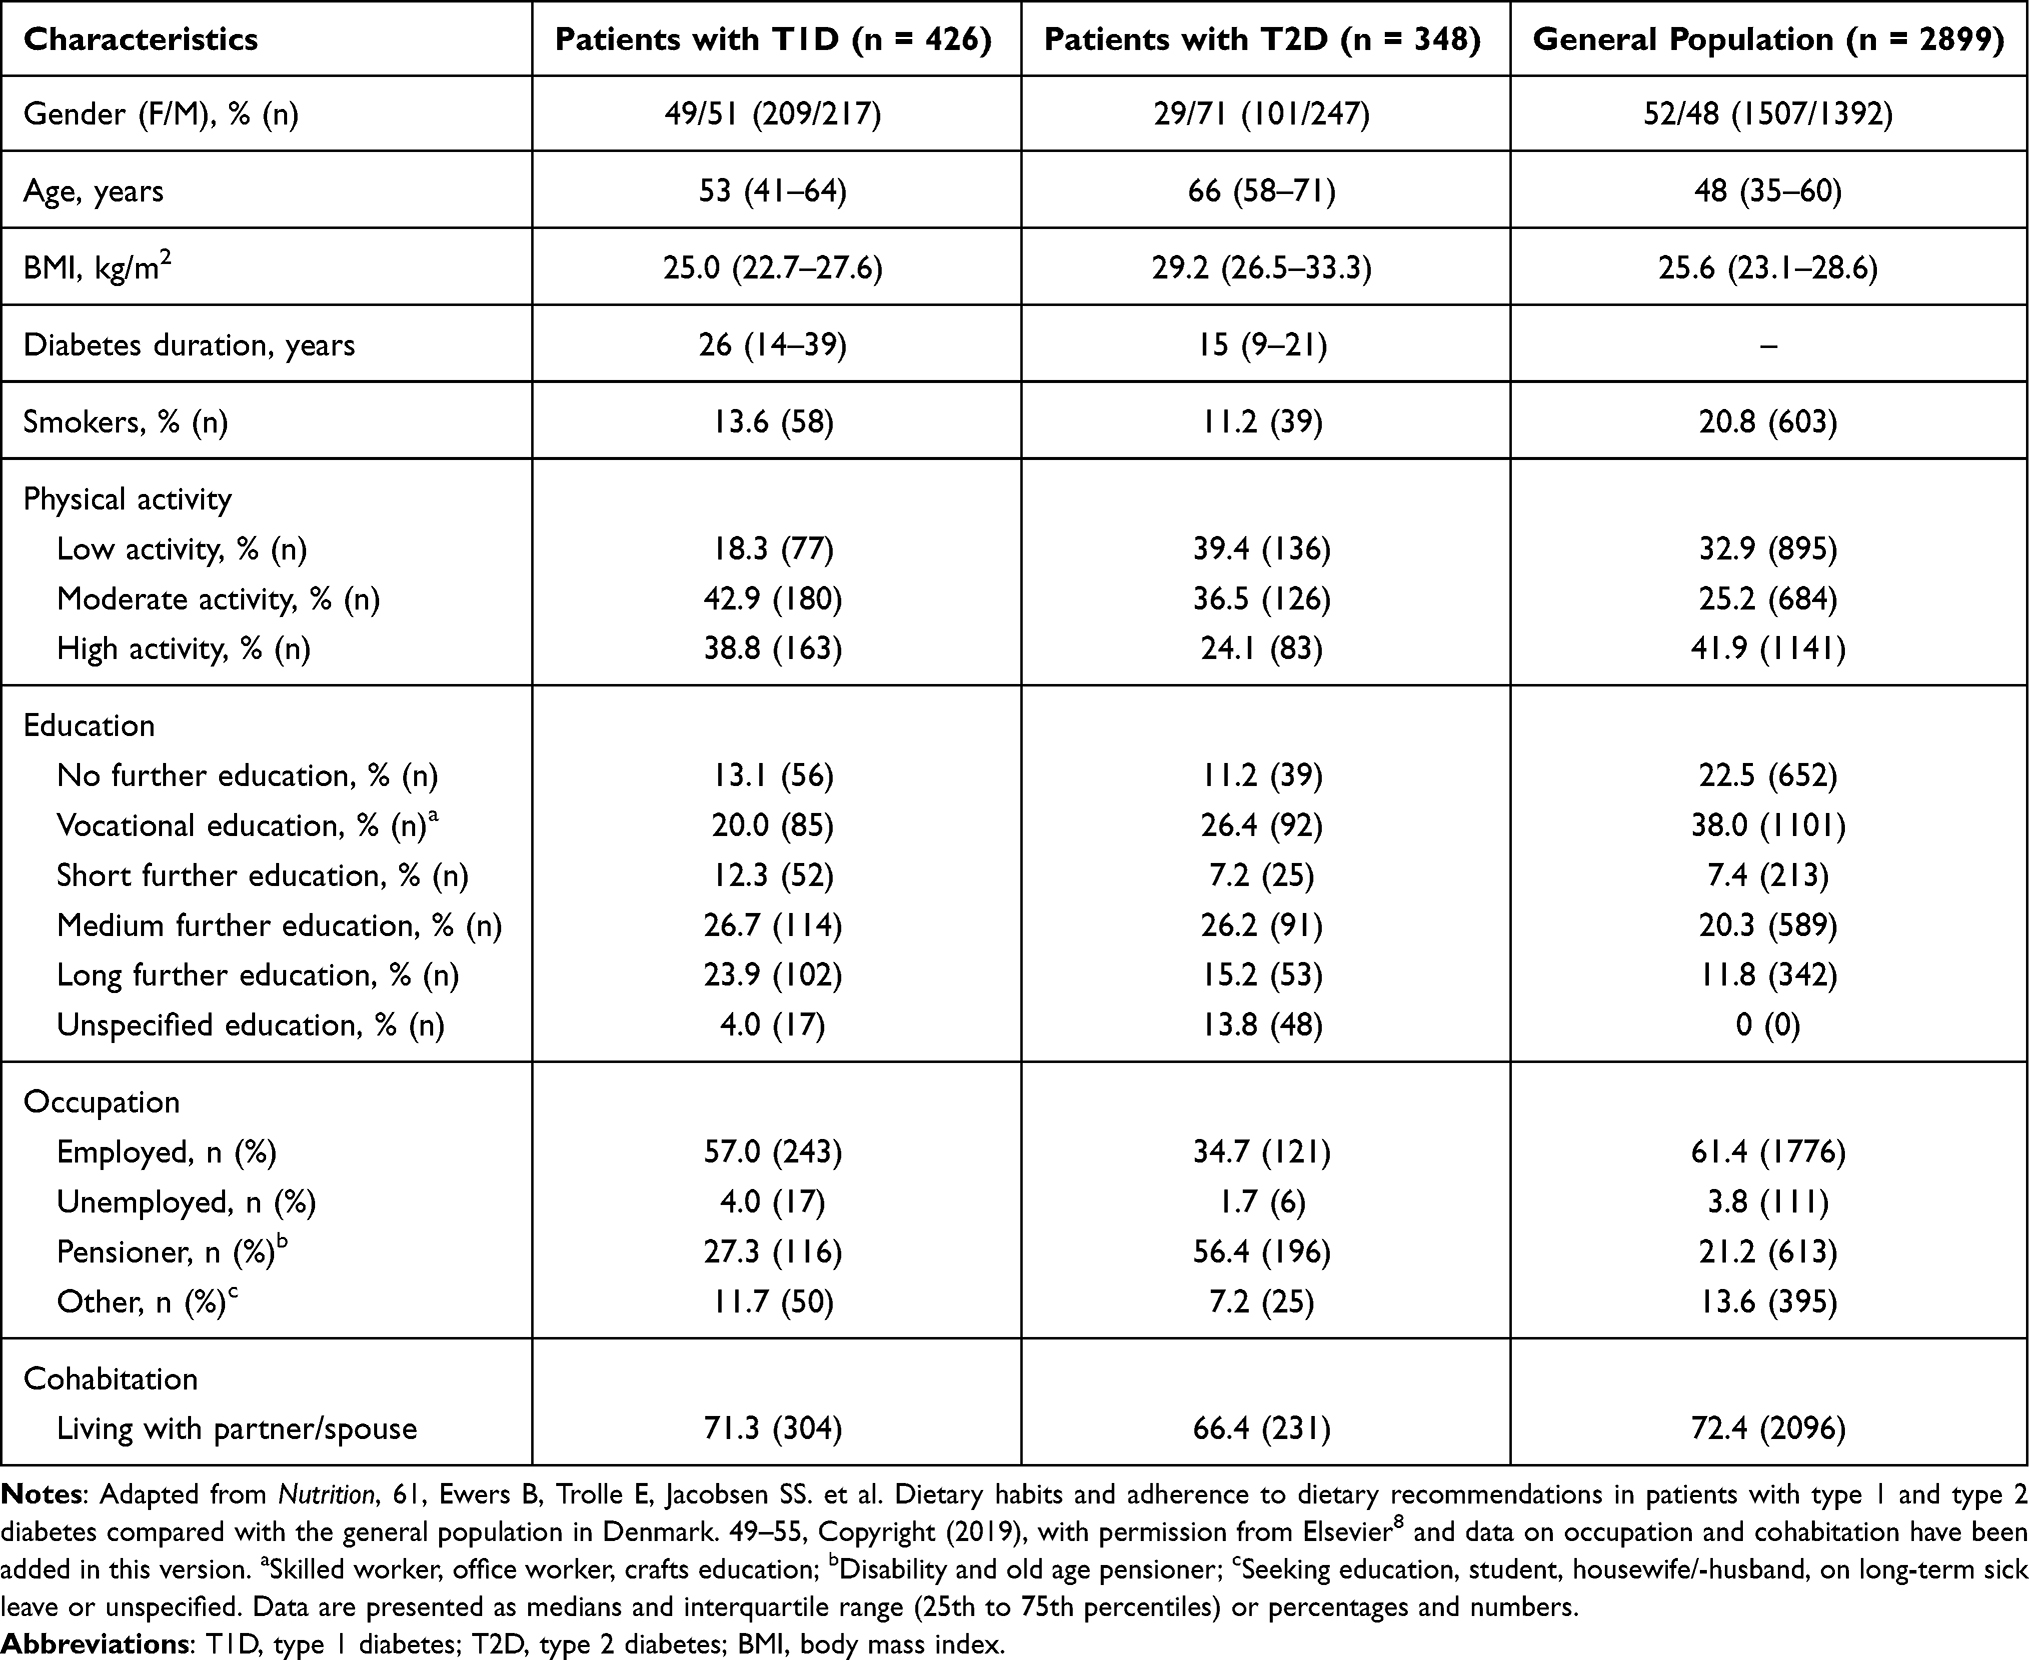 |
Table 1 Background Characteristics |
Twenty-three percent with T1D and 40% with T2D perceived their dietary habits as “neither healthy nor unhealthy”, while 75% with T1D and 57% with T2D perceived their dietary habits as “healthy” or “very healthy” (Table 2). The likelihood (odds ratio (OR)) of moving towards self-perceived healthier dietary habits on the ordinal scale was 0.41 (95% CI 0.29–0.57), p<0.001 in T2D compared with T1D adjusted for gender (p=0.011), age (p=0.001) and education (p=0.037), meaning that T2D were less likely to perceive their dietary habits as healthy compared with T1D. Self-perceived healthy eaters with T1D assessing their dietary habits as “healthy or very healthy” (n = 319) were significantly older and significantly more had a higher education compared with self-perceived less healthy eaters with T1D assessing their dietary habits as “neither healthy nor unhealthy” (n = 98) (Table 3). The diet among self-perceived healthy eaters with T1D compared with self-perceived less healthy eaters with T1D was characterized by a lower sugar intake (3.1 E% vs 3.8 E%, p=0.005) and a higher intake of dietary fibre (31.5 g/10 MJ vs 27.7 g/10 MJ, p=0.001), protein (17.0 E% vs 16.5 E%, p=0.026), vegetables (382 g/10 MJ vs 264 g/10 MJ, p=0.0001), fruit (145 g/10 MJ vs 101 g/10 MJ, p=0.001), fish (216 g/week vs 141 g/week, p=0.0001) and alcohol (8.0 g/d vs 4.8 g/d, p=0.014). Self-perceived healthy eaters with T2D assessing their dietary habits as “healthy or very healthy” (n = 199) included significantly more women compared with the self-perceived less healthy eaters with T2D assessing their dietary habits as “neither healthy nor unhealthy” (n = 138). The diet among self-perceived healthy eaters with T2D compared with self-perceived less healthy eaters with T2D was characterized by a higher intake of dietary fibre (31.1 g/10 MJ vs 28.0 g/10 MJ, p=0.001), protein (17.6 E% vs 17.1 E%, p=0.036), vegetables (369 g/10 MJ vs 227 g/10 MJ, p=0.0001), fruit (108 g/d vs 92 g/d, p=0.035) and fish (228 g/week vs 173 g/week, p=0.006).
 |
Table 2 Self-Assessment of Dietary Habits in Patients with T1D and T2D |
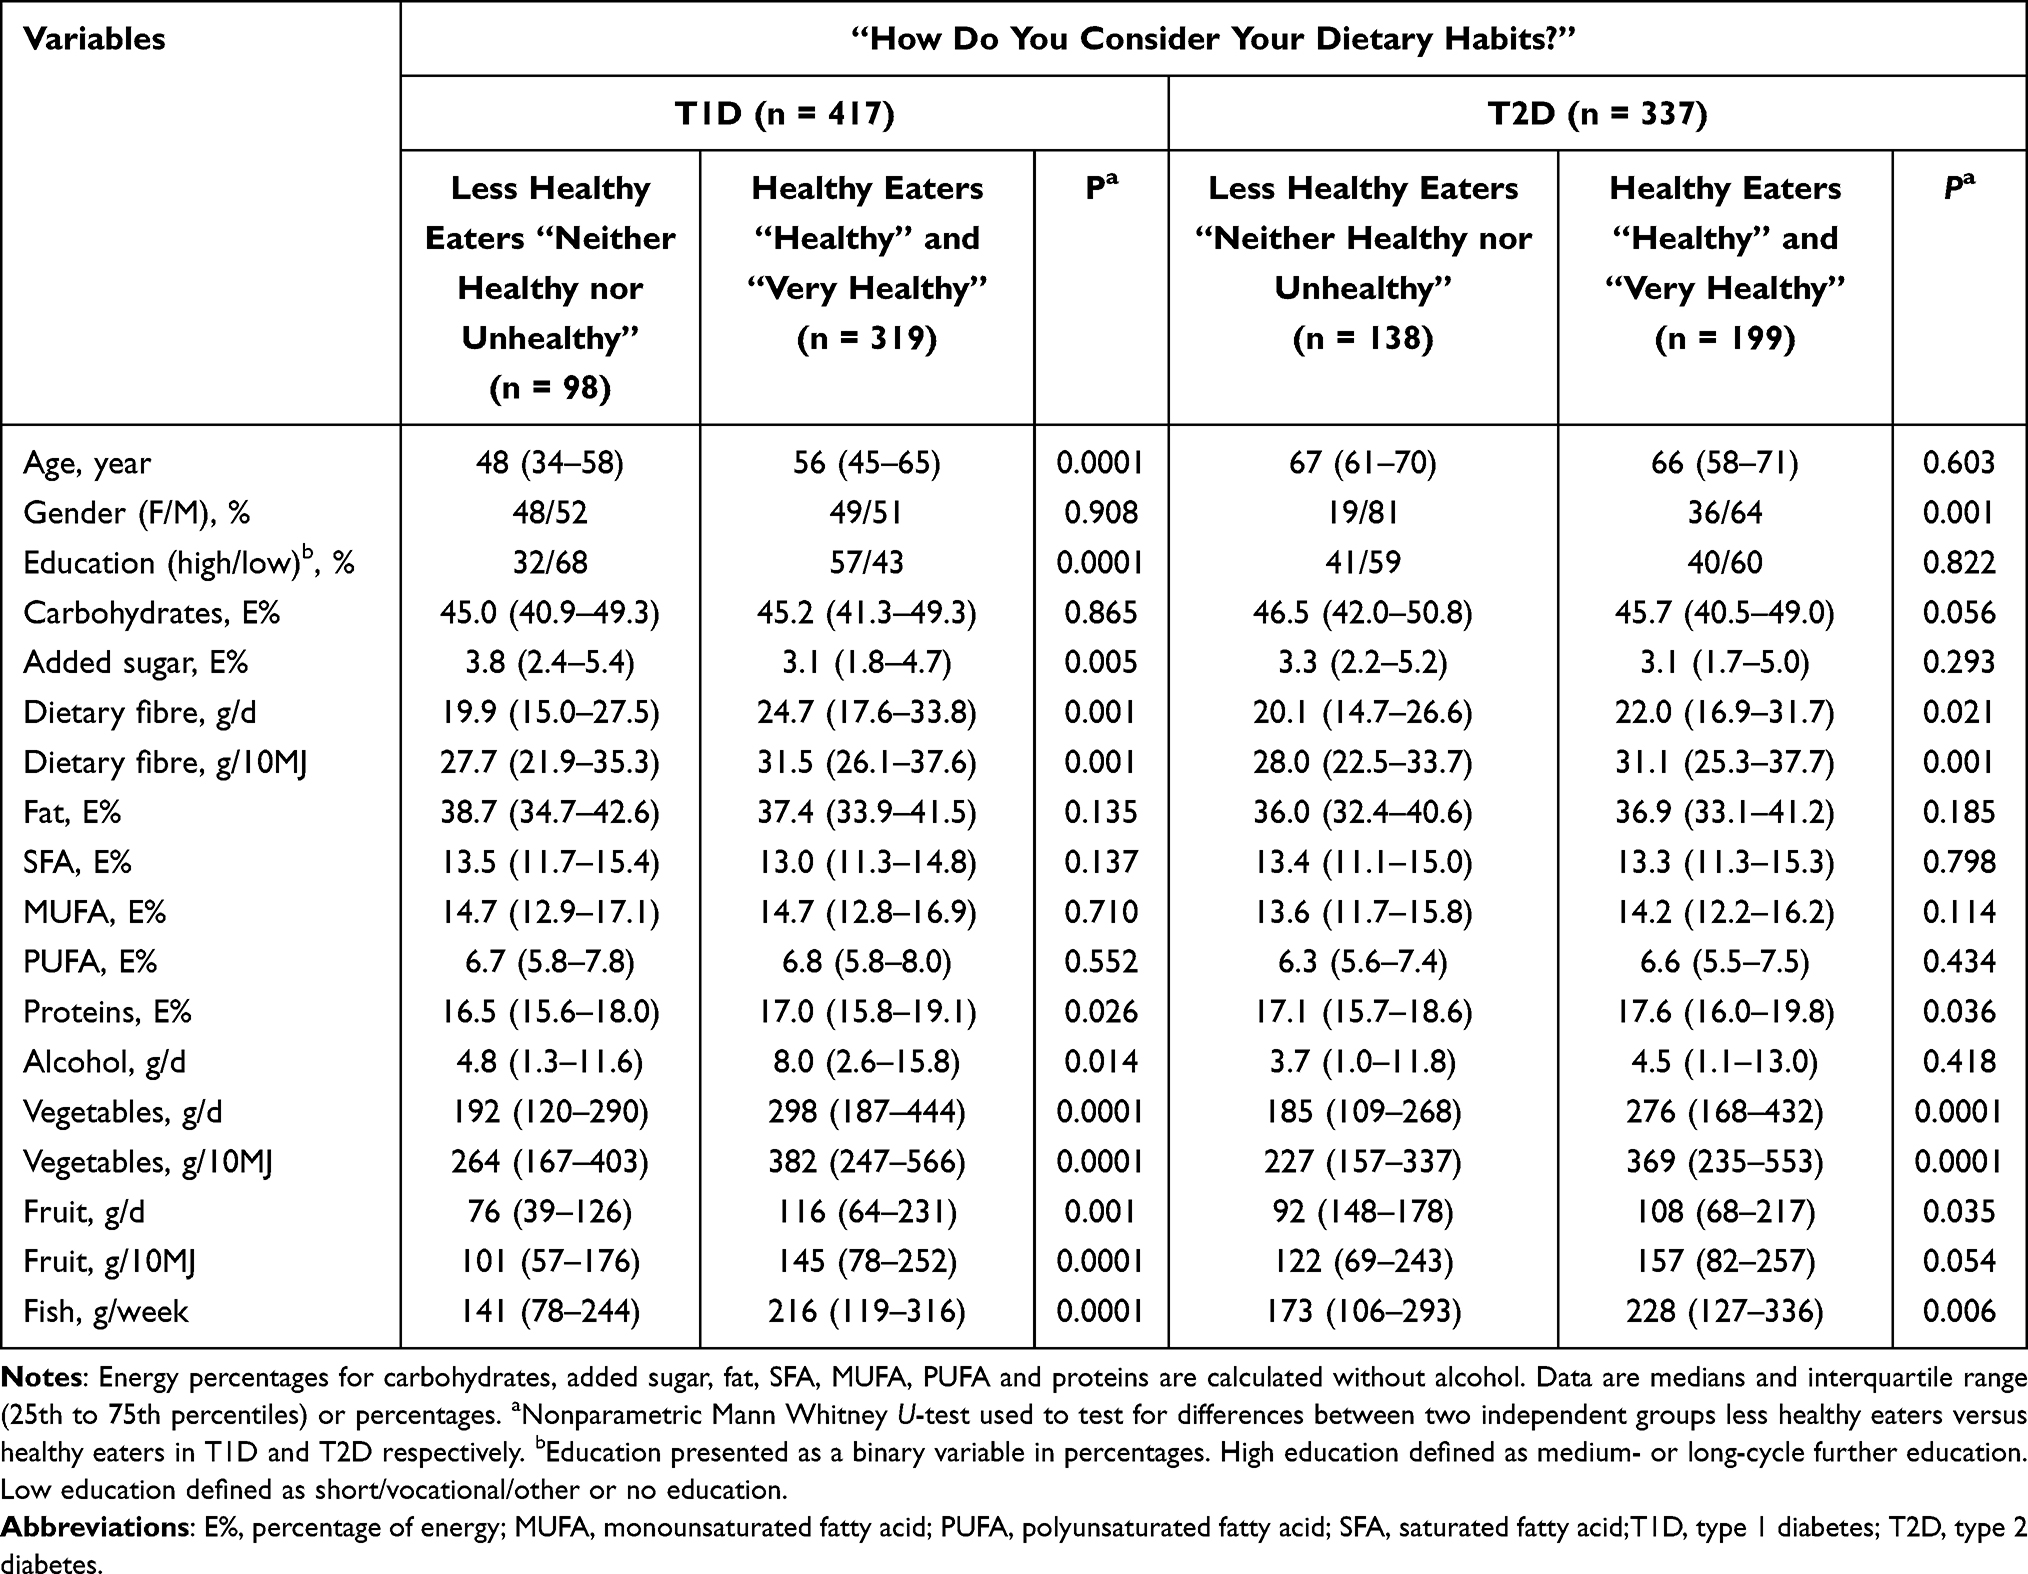 |
Table 3 Distribution of Macronutrients and Healthy Food Groups in Patients with T1D and T2D Who Assess Their Dietary Habits to Be “Neither Healthy nor Unhealthy” or “Healthy and Very Healthy” |
The three most frequent responses for characterizing a healthy diet were “dietary variety”, “low in fat” and “high in vegetables” in all three study groups and, additionally, “high in dietary fibre” in T1D and T2D and “high in fresh food/ingredients” in the general population (Table 4). Significant differences in healthy diet characteristics between the three study groups adjusted for age, gender and education were found for “dietary variety”, “home cooked”, “organic”, “high in dietary fibre”, “wholegrain foods”, “includes whole meal bread”, “high in vegetables”, “high in fruit”, “includes proteins, vitamins and minerals”, “includes lean meat” and “low in added sugar”. Supplementary Table S1 shows OR and 95% CI for all response categories for healthy diet characteristics in all three groups adjusted for age, gender and education. The likelihood of choosing “dietary variety” OR 0.65 (95% CI 0.53–0.81), “high in fibre” OR 0.33 (95% CI 0.26–0.41) or “low added sugar” OR 0.36 (95% CI 0.24–0.54) was lower in the general population compared with T1D, whereas twice as many in the general population chose “organic” OR 2.03 (95% CI 1.32–3.12) and “high in vegetables” OR 2.06 (95% CI 1.67–2.55) as important dietary components of a healthy diet. Ranking what patients with diabetes and the general population consider as important for choosing what food or meals to eat, the three most frequent responses in all study groups were “That I think the food/meals taste good” in all three groups; “Dietary variety” in T1D and T2D; “A lot of vegetables” in T1D; “That the food/meals are home cooked” in T2D; and “That my family/the ones I live with like the food/meals” in the general population (Figure S1).
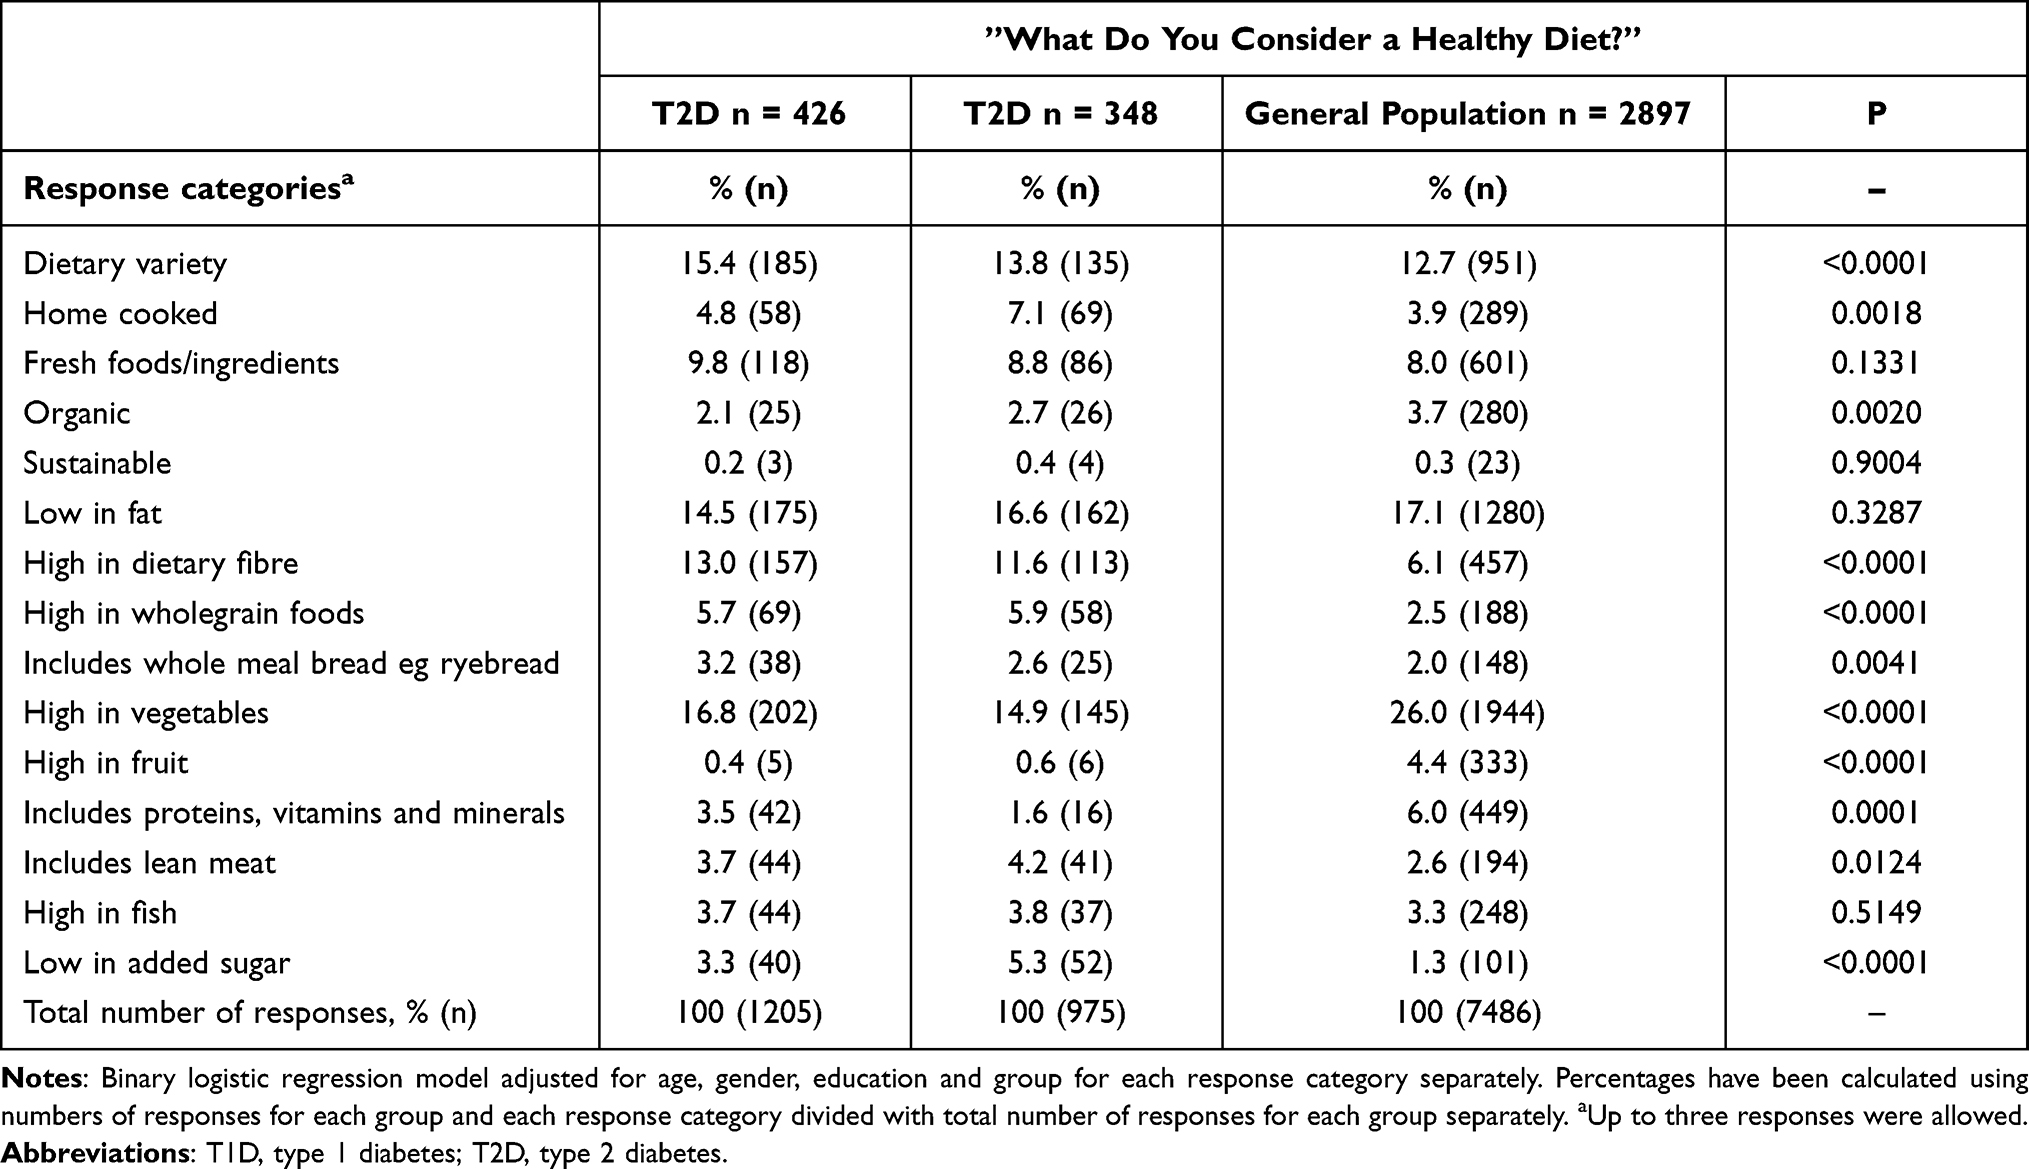 |
Table 4 Perceived Healthy Diet Characteristics in Patients with Diabetes and General Population |
The intention to eat healthily in patients with diabetes and the general population is presented in Table 5. Eighty-one percent with T1D, 69% with T2D and 79% in the general population responded that they aim to eat healthily every day “often” or “very often” with a higher proportion of the general population aiming to do so “very often” (35% vs 23% in T1D and 15% in T2D). The likelihood of moving towards a poorer intention to eat healthily on the ordinal scale was OR 1.66 (95% CI 1.26–2.17), p<0.0003 in T2D and OR 0.62 (95% CI 0.51–0.75), p<0.0001 in the general population compared with T1D as the reference group adjusted for gender (p<0.0001), age (p<0.0001) and education (p<0.0001). Meaning that T2D patients were less likely to aim to eat a healthy diet and the general population was more likely to aim to eat a healthy diet compared with T1D. The most frequently reported reasons for aiming to eat healthily often or very often were “because I have diabetes” in T1D and T2D and “due to my well-being/to have more energy” in the general population. Second and third most frequent reasons in all groups were “because of my health” and “because I want to lose or maintain body weight” (Figure S2).
 |
Table 5 Effort to Eat Healthily in Patients with Diabetes and the General Population |
Discussion
In our study, we found that patients with T2D perceived their dietary habits as less healthy than patients with T1D even though we have previously found their actual dietary intake to be just as healthy.8 In addition, patients with T2D aimed less at eating healthily every day compared with patients with T1D and the general population. Patients with T1D and T2D perceiving their dietary habits as healthy had a significant higher intake of important healthy food groups and nutrients including vegetables, fruit, fish and dietary fibre compared with those perceiving their dietary habits as less healthy. However, adherence according to the dietary guidelines was generally poor, independently of self-perceived diet healthiness in patients with T1D and T2D as described previously.8 Perceptions of what a healthy diet should consist of were very similar in patients with diabetes and the general population, pointing at dietary food variety, limiting fat and eating plenty of vegetables as key elements.
The adjusted analysis of self-perceived healthiness of dietary habits showed that T2D had a 59% lower likelihood of perceiving their dietary habits as healthy compared with T1D patients. Correspondingly, women (vs men) had a 49% higher likelihood, and individuals with long further education (vs no education) had twice as high a likelihood of perceiving their dietary habits as healthy. These findings support what is already known. Gender and education have a huge impact on health including nutrition-related behavior and beliefs.16–19 Fewer patients with T2D reported that they aimed to eat a healthy diet every day compared with T1D and the general population. Compared with T1D, the likelihood of aiming less to eat healthily was 68% higher in T2D and 40% lower in the general population adjusted for age, gender and education. These findings that patients with T2D had lower intention to eat healthily and poorer self-perceived diet healthiness could be due to characteristics of our T2D study population. Among our T2D participants, 41% were overweight (BMI 25.0–29.9 kg/m2) and 43% obese (BMI ≥30.0 kg/m2), diabetes duration was 15 years, and all received medical treatment to improve their diabetes regulation. These patients know that T2D is a chronic condition which together with the management of overweight and obesity need lifelong adjustments of their lifestyle, including eating healthily. Patients with T2D may have higher self-expectations and standards for healthy eating compared with patients with T1D and the general population. They know how crucial healthy eating is. In addition, in our analyses we only adjusted for age, gender and education. Unknown confounders, eg, sleeping status, mental well-being, overall health or health beliefs could have affected the observed results of a poorer perceived diet healthiness and intention to eat healthily in patients with T2D. In our study, patients with T1D and the general population were more comparable being younger aged and more being normal weight and physically active, employed and living with a partner/spouse. This may have an impact on diet-related behavior. Studies have also found that being obese is associated with a more realistic or even pessimistic self-assessment of diet healthiness.5 Furthermore, a Danish qualitative study based on DANSDA also found that people use their body weight and overall health status to assess the healthiness of their diet.20 Ensuring enough support especially for patients with T2D to put effort into eating healthily, by helping them identify and overcome barriers for this, is important. Seventy-eight percent with T1D and 80% with T2D responded that having diabetes was one of the most important reasons for eating healthily. Health care providers should explore the reason for this with the patient. Is the patient actually eating healthily due to diabetes-related worries which are common in diabetes and can result in poor adherence to diabetes self-care in the long term,21,22 or does the patient use the diagnosis as a personal driver for making healthy self-management decisions?23,24
We examined diet quality in relation to self-perceived diet healthiness and found that diet quality was higher among self-perceived healthy eaters compared with less healthy eaters based on higher intakes of vegetables, fruit, fish, fibre and protein both in T1D and T2D respectively, and additionally a lower sugar intake in the T1D group. Perceived healthy eaters with T1D also had a significantly higher alcohol consumption which may reflect the higher percentage of highly educated people in this group. Education-related health inequalities are well-documented. Several studies demonstrate that highly educated people adhere to most health recommendations including eating healthily, quitting smoking and exercising more, but alcohol remains the one disease-related risk factor with a reverse social gradient.25–28 We did not find any differences in dietary fat intake between self-perceived healthy eaters versus self-perceived less healthy eaters, as seen previously.9–11 Others have reported higher intakes of food groups promoted as healthy (eg vegetables and fish) among self-perceived healthy eaters.29 Despite an overall accordance between objectively assessed diet quality and self-assessments, studies have also found notable differences. For instance, among adult participants with objectively assessed poor diet quality from a Danish national health survey, up to 18% perceived their dietary habits as very healthy or healthy and up to 67% perceived their dietary habits as fairly healthy.30 These results indicate how difficult it is to assess the healthiness of one’s diet, or that some people may have other perceptions of “healthy eating” than what is recommended based on the official dietary guidelines.
A high consistency for what a healthy diet consists of was found across all three groups in our study. Most frequent responses to characteristics of a healthy diet were dietary food variety, low-fat and high in vegetables in patients with T1D and T2D and the general population. This may be due to several decades with dietary recommendations including these elements both in diabetes and the general population.31,32 Other important diet characteristics were high in dietary fibre and low in sugar, most frequently stressed in T2D. This may be due to several years of recommendations to avoid added sugar when you have diabetes. Today most people with T1D know that they can adjust with more bolus insulin if they eat a cake or other foods high in sugar. The likelihood of choosing dietary variety, fibre or added sugar as healthy diet characteristics were significantly lower in the general population compared with T1D. This may reflect their actual dietary intake since we have previously shown that sugar intake was statistically significantly higher and fibre intake significantly lower in the general population compared with T1D and T2D.8
Our study has several limitations. Our diabetes population may be less representative of diabetes patients in general due to their urban attachment (all based in the capital region of Denmark) and higher education level (especially T1D). Participants from the general population represented all parts of the country with a higher proportion than the diabetes-populations having no or only limited education. Besides regional differences, education is a social determinant with high impact on dietary habits.19 More educated people tend to live in urban areas with less educated people living in rural areas.33 Comparing the diabetes study population with the general population in DANSDA, limitations are the same (educational and regional differences) together with differences in age range. This may have underestimated the differences especially in intention to eat healthily between the general population and patients with T1D and T2D. The general population was 18 to 75 years while the age range was 18 to 88 years in T1D and 22 to 94 years in T2D due to different inclusion criteria. Particularly T2D participants were older with more pensioners. Today, younger people from the working population are diagnosed with T2D. They may resemble the T1D and general population more in terms of intention and perceptions of healthy eating. Research also demonstrate gender differences in eating behavior and food choices. Women are more likely to place greater importance on healthy eating.16,18 This could also have affected our results since significantly more men were represented in the T2D group, however, we adjusted for gender differences in most statistical analyses. Differences in data collection methods could have affected who and how participants with diabetes versus the general population responded. Both higher and lower participation rates have been found in online surveys compared with other data collection methods potentially introducing non-participation bias. Additionally, educated people are more likely to participate in studies irrespective of the data collection methods used.34 In general, non-respondents in surveys are less educated, have poorer health and health behaviour.34 To increase the survey response rates and reduce non-response bias in the online dietary survey, reminders were sent and different data collection methods were used including telephone interview and face-to-face interview. Nevertheless, nonresponse bias was prevalent in our diabetes survey. Our participants had a better metabolic control compared with non-respondents and higher diet quality was associated with a better metabolic control in T1D and T2D.8,35 This could also explain why self-perceived very unhealthy dietary habits was non-existing and only 3% with diabetes perceived their dietary habits as unhealthy in our study. On the other hand, the face-to-face interview method used in the DANSDA study may have introduced social desirability bias. This could lead to more positive self-assessments of diet healthiness compared with using a self-administered questionnaire with no or limited contact with the researcher, although the opposite with higher truthfulness in face-to-face situations has also been found.36 Furthermore, our study does not represent individuals with ethnic minority backgrounds, since 96% of all participants with diabetes were ethnic Danes with less than 3% originating from a non-Western country.
Finally, perceptions of diet healthiness are subjective ratings, and studies have found that optimistic self-assessments of diet quality make people less likely to intend to change their eating behavior in a healthier direction.4,6
Conclusions
Patients with T1D and T2D with perceived healthy dietary habits had an overall higher diet quality compared with patients with perceived less healthy dietary habits. However, self-perceived healthy eaters’ intake of particularly dietary fibre, fruits, fish and saturated fat still did not meet dietary recommendations. Patients with T2D had poorer self-perceptions of the healthiness of their diet and less intention of eating healthily every day compared with patients with T1D and the general population. It is important that health care providers with limited nutrition knowledge understand and acknowledge these potential differences and address these aspects with the patient as a first step to engage in changing dietary behavior. Ideally, patients with diabetes should be referred to dietitians for a thorough professional nutrition assessment, education and support. Dietitians can help integrate personal perceptions of healthy eating into a personalized healthy diet to promote and maintain long-lasting realistic healthy eating habits contributing to glycemic and metabolic control.
Acknowledgments
We thank the Beckett Foundation and funds for research and development in the clinic at Steno Diabetes Center Copenhagen, Denmark, for supporting our work.
Disclosure
The authors report no conflicts of interest in this work.
References
1. American Diabetes Association. 5. Facilitating behavior change and well-being to improve health outcomes: standards of medical care in diabetes - 2021. Diabetes Care. 2021;44(suppl 1):S53–S72. doi:10.2337/dc21-S005
2. Evert AB, Dennison M, Gardner CD. Nutrition therapy for adults with diabetes or prediabetes: a consensus report. Diabetes Care. 2019;42(5):731–754. doi:10.2337/dci19-0014
3. Monterrosa EC, Frongillo EA, Drewnowski A, de Pee S, Vandevijvere S. Sociocultural influences on food choices and implications for sustainable healthy diets. Food Nutr Bull. 2020;41(2_suppl):59S–73S. doi:10.1177/0379572120975874
4. Jansink R, Braspenning J, Keizer E, van der Weijden T, Elwyn G, Grol R. Misperception of patients with type 2 diabetes about diet and physical activity, and its effects on readiness to change. J Diabetes. 2012;4(4):417–423. doi:10.1111/j.1753-0407.2012.00207.x
5. Sørensen MR, Matthiessen J, Holm L, Knudsen VK, Andersen EW, Tetens I. Optimistic and pessimistic self-assessment of own diets is associated with age, self-rated health and weight status in Danish adults. Appetite. 2017;114:15–22. doi:10.1016/j.appet.2017.03.014
6. Variyam JN, Shim Y, Blaylock J. Consumer misperceptions of diet quality. J Nutr Educ. 2001;33(6):314–321. doi:10.1016/S1499-4046(06)60353-9
7. Ajzen L. The theory of planned behavior. Organ Behav Hum Decis Process. 1991;50(2):179–211. doi:10.1016/0749-5978(91)90020-T
8. Ewers B, Trolle E, Jacobsen SS, et al. Dietary habits and adherence to dietary recommendations in patients with type 1 and type 2 diabetes compared with the general population in Denmark. Nutrition. 2019;61:49–55. doi:10.1016/j.nut.2018.10.021
9. Batis C, Castellanos-Gutierrez A, Aburto TC, Jimenez-Aguilar A, Rivera JA, Ramirez-Silva I. Self-perception of dietary quality and adherence to food groups dietary recommendations among Mexican adults. Nutr J. 2020;19(1):59. doi:10.1186/s12937-020-00573-5
10. Glanz K, Brug J, van Assema P. Are awareness of dietary fat intake and actual fat consumption associated?–a Dutch-American comparison. Eur J Clin Nutr. 1997;51(8):542–547. doi:10.1038/sj.ejcn.1600442
11. Powell-Wiley TM, Miller PE, Agyemang P, Agurs-Collins T, Reedy J. Perceived and objective diet quality in US adults: a cross-sectional analysis of the National Health and Nutrition Examination Survey (NHANES). Public Health Nutr. 2014;17(12):2641–2649. doi:10.1017/S1368980014000196
12. Pedersen AN, Christensen T, Matthiessen J, et al. Dietary Habits in Denmark 2011–2013. Main Results. Søborg, Denmark: The National Food Institute, Technical University Denmark; 2015. Report in Danish with an English summary.
13. Bentzen SM, Knudsen VK, Christiensen T, Ewers B. Relative validity of a web-based food frequency questionnaire for patients with type 1 and type 2 diabetes in Denmark. Nutr Diabetes. 2016;6(9):e232. doi:10.1038/nutd.2016.40
14. Den national sundhedsprofil 2010 - Hvordan har du det? [The National Health Profile 2010 - How are you?] The Danish Health Authority 2011. Only available in Danish. Available from: www.sst.dk. Accessed September 06, 2021.
15. Guidelines for data processing and analysis of the International Physical Activity Questionnaire (IPAQ) - short and long forms; 2015. Available from: www.ipaq.ki.se.
16. Grzymislawska M, Puch EA, Zawada A, Grzymislawski M. Do nutritional behaviors depend on biological sex and cultural gender? Adv Clin Exp Med. 2020;29(1):165–172. doi:10.17219/acem/111817
17. Irala-Estevez JD, Groth M, Johansson L, Oltersdorf U, Prattala R, Martinez-Gonzalez MA. A systematic review of socio-economic differences in food habits in Europe: consumption of fruit and vegetables. Eur J Clin Nutr. 2000;54(9):706–714. doi:10.1038/sj.ejcn.1601080
18. Wardle J, Haase AM, Steptoe A, Nillapun M, Jonwutiwes K, Bellisle F. Gender differences in food choice: the contribution of health beliefs and dieting. Ann Behav Med. 2004;27(2):107–116. doi:10.1207/s15324796abm2702_5
19. Rippin HL, Hutchinson J, Greenwood DC, et al. Inequalities in education and national income are associated with poorer diet: pooled analysis of individual participant data across 12 European countries. PLoS One. 2020;15(5):e0232447. doi:10.1371/journal.pone.0232447
20. Sørensen MR, Holm L. “I feel good and I am not overweight” - a Qualitative Study of considerations underlying lay people’s self-assessments of unhealthy diets. Appetite. 2016;107:135–143. doi:10.1016/j.appet.2016.07.032
21. Arend F, Muller UA, Schmitt A, Voigt M, Kuniss N. Overestimation of risk and increased fear of long-term complications of diabetes in people with type 1 and 2 diabetes. Exp Clin Endocrinol Diabetes. 2019;127(10):645–652. doi:10.1055/a-0977-2667
22. Peyrot M, Rubin RR, Lauritzen T, Snoek FJ, Matthews DR, Skovlund SE. Psychosocial problems and barriers to improved diabetes management: results of the Cross-National Diabetes Attitudes, Wishes and Needs (DAWN) Study. Diabet Med. 2005;22(10):1379–1385. doi:10.1111/j.1464-5491.2005.01644.x
23. Ahola AJ, Groop PH. Barriers to self-management of diabetes. Diabet Med. 2013;30(4):413–420. doi:10.1111/dme.12105
24. Anderson RM, Funnell MM. Patient empowerment: myths and misconceptions. Patient Educ Couns. 2010;79(3):277–282. doi:10.1016/j.pec.2009.07.025
25. World Health Organization. Global Status Report on Alcohol and Health. Genève; 2014.
26. Danskernes alkoholvaner - alkoholstatistik (Danes’ alcohol habits - alcohol statistics). Sundhedsstyrelsen. 2015.
27. OECD. Health for Everyone?: Social Inequalities in Health and Health Systems, OECD Health Policy Studies. Paris: OECD Publishing; 2019.
28. Groth MV, Sorensen MR, Matthiessen J, Fagt S, Landvad N, Knudsen VK. Disparities in dietary habits and physical activity in Denmark and trends from 1995 to 2008. Scand J Public Health. 2014;42(7):611–620. doi:10.1177/1403494814547668
29. Sørensen, MR, Iversen JD, Groth MV, Fagt S. Danskernes faktiske kost og oplevelsen af sunde kostvaner. [The Danes' actual diet and self-perception of healthy dietary habits]. The National Food Institute, Technical University Denmark; Søborg 2013. 2nd. ed. Only available in Danish. Available from: www.food.dtu.dk. Accessed September 06, 2021.
30. Danskernes Sundhed. Den nationale Sundhedsprofil 2013. Sundhedsstyrelsen 2014 [Internet]. Available from: www.sst.dk.
31. Haraldsdóttir J. Dietary guidelines and patterns of intake in Denmark. Br J Nutr. 1999;81(S1):S43–S48. doi:10.1017/S0007114599000884
32. Mann JI, De Leeuw I, Hermansen K, et al. Evidence-based nutritional approaches to the treatment and prevention of diabetes mellitus. Nutr Metab Cardiovasc Dis. 2004;14(6):373–394. doi:10.1016/S0939-4753(04)80028-0
33. Befolkningens uddannelsesniveau (Educational level in the Danish population) statistics Denmark; 2020.
34. Galea S, Tracy M. Participation rates in epidemiologic studies. Ann Epidemiol. 2007;17(9):643–653. doi:10.1016/j.annepidem.2007.03.013
35. Jacobsen SS, Vistisen D, Vilsboll T, Bruun JM, Ewers B. The quality of dietary carbohydrate and fat is associated with better metabolic control in persons with type 1 and type 2 diabetes. Nutr J. 2020;19(1):125. doi:10.1186/s12937-020-00645-6
36. Christensen AI, Ekholm O, Glumer C, Juel K. Effect of survey mode on response patterns: comparison of face-to-face and self-administered modes in health surveys. Eur J Public Health. 2014;24(2):327–332. doi:10.1093/eurpub/ckt067
 © 2021 The Author(s). This work is published and licensed by Dove Medical Press Limited. The
full terms of this license are available at https://www.dovepress.com/terms
and incorporate the Creative Commons Attribution
- Non Commercial (unported, 3.0) License.
By accessing the work you hereby accept the Terms. Non-commercial uses of the work are permitted
without any further permission from Dove Medical Press Limited, provided the work is properly
attributed. For permission for commercial use of this work, please see paragraphs 4.2 and 5 of our Terms.
© 2021 The Author(s). This work is published and licensed by Dove Medical Press Limited. The
full terms of this license are available at https://www.dovepress.com/terms
and incorporate the Creative Commons Attribution
- Non Commercial (unported, 3.0) License.
By accessing the work you hereby accept the Terms. Non-commercial uses of the work are permitted
without any further permission from Dove Medical Press Limited, provided the work is properly
attributed. For permission for commercial use of this work, please see paragraphs 4.2 and 5 of our Terms.