Back to Journals » Clinical, Cosmetic and Investigational Dermatology » Volume 19
Integrative Multi-Omics and Experimental Analyses Identify TAPBP as a Key Mediator Linking Genetic Susceptibility to Melanocyte Dysfunction in Vitiligo
Authors Shi J, Guo M, Fu L, He J, Hu Y ![]()
Received 29 October 2025
Accepted for publication 20 January 2026
Published 23 January 2026 Volume 2026:19 577486
DOI https://doi.org/10.2147/CCID.S577486
Checked for plagiarism Yes
Review by Single anonymous peer review
Peer reviewer comments 2
Editor who approved publication: Dr Monica K. Li
Jinlong Shi,1,* Mingzhen Guo,2,* Liying Fu,1 Jiangman He,1 Yuan Hu3
1Department of Dermatology, Zhengzhou People’s Hospital, Zhengzhou, Henan, People’s Republic of China; 2Department of Laboratory, Women and Children’s Hospital Affiliated to Qingdao University, Qingdao, Shandong, People’s Republic of China; 3Department of Dermatology, Suining Central Hospital, Suining, Sichuan, People’s Republic of China
*These authors contributed equally to this work
Correspondence: Yuan Hu, Email [email protected]
Background: Vitiligo is an autoimmune depigmenting disorder characterized by selective melanocyte loss; however, the specific molecular bridges between genetic risk variants and melanocyte-intrinsic immune vulnerability remain largely unexplored.
Objective: To elucidate the molecular link between genetic susceptibility and melanocyte injury in vitiligo by integrating multi-omics data.
Methods: We integrated large-scale genome-wide association data (FinnGen R12, n=466,064), expression quantitative trait loci (eQTLgen, n=31,684), and single-cell transcriptomic profiles to identify genes mediating vitiligo susceptibility.
Results: Cross-omic analysis identified TAPBP as a top candidate, which is significantly upregulated in lesional melanocytes and core to the antigen-processing network. Functional validation in human melanocytes demonstrated that TAPBP overexpression significantly increased HLA class I expression, suppressed cell proliferation, and induced apoptosis. Transcription factor analysis further identified STAT2 as a key upstream regulator, linking interferon signaling to aberrant antigen presentation.
Conclusion: These findings suggest that the STAT2–TAPBP axis enhances melanocyte immunogenicity and vulnerability to cytotoxic attack. Our study provides a novel mechanistic link between genetic variation and immune-mediated destruction, positioning TAPBP as a potential biomarker and a target for precision immunotherapy in vitiligo.
Keywords: vitiligo, TAPBP, antigen presentation, multi-omics integration
Introduction
Vitiligo is a chronic autoimmune depigmenting disorder characterized by the selective loss of functional melanocytes. Although genetic predisposition and immune dysregulation are central to its pathogenesis, the precise molecular mechanisms linking genetic risk variants to melanocyte-intrinsic dysfunction remain incompletely understood.1 Current evidence highlights that autoreactive CD8⁺ T cells target melanocytes via interferon-γ (IFN-γ)–mediated signaling, involving the JAK/STAT and antigen-presentation cascades.2,3
Genome-wide association studies (GWAS) have identified numerous susceptibility loci within the major histocompatibility complex (MHC) region, underscoring the pivotal role of antigen processing in disease initiation.4,5 However, as most GWAS signals reside in non-coding regions, their functional impact on gene expression requires integration with expression quantitative trait loci (eQTL) and single-cell RNA sequencing (scRNA-seq) data.6,7 While high-resolution profiling has revealed that lesional melanocytes display transcriptional signatures of cellular stress and altered immune responses,8 the specific regulators bridging genetic susceptibility to these melanocyte-intrinsic immune phenotypes remain elusive.
Among the molecules involved in MHC-I assembly, TAP-binding protein (TAPBP, or tapasin) is critical for bridging the transporter associated with antigen processing (TAP) to nascent MHC-I complexes.9,10 In contrast to the structural components of the MHC-I machinery previously identified in vitiligo GWAS, such as TAP1,11 TAPBP acts as a specialized chaperone that orchestrates the selection of high-affinity peptides, thus serving as a critical gatekeeper of melanocyte immunogenicity.
While TAPBP dysregulation is linked to altered immune surveillance and autoimmunity,12 its role in pigmentary disorders has not been elucidated. Given that aberrant antigen presentation may enhance melanocyte visibility to cytotoxic lymphocytes, TAPBP represents a biologically plausible link between genetic risk and immune-mediated melanocyte damage.
In this study, we integrated GWAS data from the FinnGen R12 cohort, eQTL data, and scRNA-seq profiles to identify genes mediating vitiligo susceptibility. Our cross-omic analysis identified TAPBP as a top candidate gene. We subsequently validated the functional role of TAPBP in human melanocytes (MC-1), focusing on its impact on antigen presentation, cellular fitness, and its upstream regulation via the STAT2–TAPBP axis. Collectively, our findings identify TAPBP as a potential molecular bridge between genetic predisposition and melanocyte dysfunction, offering new mechanistic insights into vitiligo pathogenesis and highlighting a possible therapeutic target.
Materials and Methods
Data Sources and Overall Analytical Design
This study integrated genome-wide association, expression quantitative trait loci (eQTL), and single-cell transcriptomic analyses with experimental validation to elucidate the molecular mechanisms underlying vitiligo pathogenesis. Detailed dataset descriptions and accession links are summarized in Supplementary Table S1.
Genome-wide association study (GWAS) summary statistics for vitiligo were obtained from the FinnGen R12 cohort (n=466,064,European ancestry). Gene-level association results derived from MAGMA are provided in Supplementary Table S2.
Expression quantitative trait loci (eQTL) data were retrieved from the eQTLgen consortium (https://www.eqtlgen.org/) which provides large-scale blood transcriptomic profiles (n=31,684). The association between eQTLGen-derived eQTLs and vitiligo identified using SMR is summarized in Supplementary Table S3.
Single-cell RNA sequencing (scRNA-seq) data were downloaded from the GSE203262 dataset in the Gene Expression Omnibus (GEO), which includes epidermal cells from vitiligo lesions and matched normal skin.
Genome-Wide and Gene-Level Association Analysis
Gene-level association analyses were conducted using MAGMA (v1.10)13 based on the FinnGen R12 GWAS summary statistics.14
Single nucleotide polymorphism (SNP)–wise p-values were aggregated to the gene level, and genes with p < 0.05 were considered nominally significant.15 All analyses were performed using the GRCh37/hg19 genome build.
Summary-Based Mendelian Randomization (SMR)
To identify genes whose expression may mediate genetic susceptibility to vitiligo, summary-based Mendelian randomization (SMR) analysis was performed by integrating GWAS and eQTLgen datasets16 using SMR v1.03 with default parameters. The HEIDI test was applied to distinguish pleiotropy from linkage.17,18 Genes satisfying p < 0.05 in the SMR test and p > 0.01 in the HEIDI test were retained as significant candidates.
Single-Cell RNA Sequencing Analysis
Single-cell transcriptomic analysis was performed using the Seurat (v4.4.0) R package. Raw count matrices were normalized and log-transformed using the “LogNormalize” method, with a scale factor of 10,000. Low-quality cells were excluded (features <200 or mitochondrial gene percentage >20%).19,20
To minimize potential batch effects between different donor samples and experimental runs, the “IntegrateData” function within the Seurat pipeline was utilized, ensuring a cohesive clustering analysis of the combined dataset. Dimensionality reduction was performed via principal component analysis (PCA) followed by Uniform Manifold Approximation and Projection (UMAP).21
Cell clusters were annotated based on canonical marker genes (PMEL and MLANA for melanocytes, KRT15 and KRT14 for keratinocytes, CD1A and CD207 for antigen-presenting cells). Differentially expressed genes (DEGs) were identified using the “FindMarkers” function (Wilcoxon rank-sum test, |log2FC| > 0.25, p < 0.05). The proportions of each cell type between groups were compared using Student’s t-test.
Functional Enrichment and Pathway Analysis
DEGs from melanocytes were analyzed using the clusterProfiler (v4.10.1) R package.22
Gene Ontology (GO) and Kyoto Encyclopedia of Genes and Genomes (KEGG) analyses were conducted,23 with significance defined as p < 0.05. In addition, Gene Set Enrichment Analysis (GSEA) was performed to evaluate enriched biological pathways in melanocytes from lesional skin, using the “c2.cp.kegg.v7.5.1” gene set from the MSigDB database.24,25
Protein–Protein Interaction and Transcription Factor Prediction
Candidate genes were analyzed using the GeneMANIA web platform (https://genemania.org/) to construct a protein–protein interaction network integrating co-expression, co-localization, and shared pathway data.26 Upstream transcription factors (TFs) of TAPBP were predicted using the TF-Target Finder tool,27 which integrates four major transcription factor databases (hTFtarget, GTRD, ChIP_Atlas, and KnockTF). The expression and correlation patterns of predicted TFs with TAPBP were further examined at the single-cell level.
Cell Culture
The normal human melanocyte cell line MC-1 was obtained from Shanghai Qisai Biotechnology Co., Ltd. (Shanghai, China). Cells were cultured in high-glucose Dulbecco’s Modified Eagle Medium (DMEM, Gibco, USA) supplemented with 10% fetal bovine serum (FBS, Gibco, USA) and 1% penicillin–streptomycin (Gibco, USA). Cells were maintained in a humidified incubator at 37 °C with 5% CO2. All experiments were performed using cells in the logarithmic growth phase.
Plasmid Construction and Transfection
The full-length human TAPBP coding sequence was cloned into the pcDNA3.1(+) expression vector (pcDNA3.1-TAPBP) by GeneChem Co., Ltd. (Shanghai, China). The empty pcDNA3.1 vector served as a negative control. Transfection was performed using Lipofectamine 3000 reagent (Invitrogen, USA) according to the manufacturer’s instructions when cell confluence reached approximately 70%. Cells were harvested 24–48 h after transfection for subsequent assays.
RNA Extraction and Quantitative Real-Time PCR (RT–qPCR)
Total RNA was extracted using TRIzol reagent (Takara, Japan) and reverse-transcribed into cDNA using a Reverse Transcription Kit (Vazyme, China). Quantitative PCR was conducted using SYBR Green Master Mix (Vazyme, China) on an ABI 7500 Real-Time PCR System (Applied Biosystems, USA). ACTIN was used as the internal reference gene, and relative expression levels were calculated using the 2^-ΔΔCt method.28 Target genes included TAPBP and HLA class I ABC, with all reactions performed in triplicate. Primer sequences are listed in Supplementary Table S4.
Protein Extraction and Western Blotting
Cells were lysed in RIPA buffer (Beyotime, China) containing protease inhibitors and incubated on ice for 30 min, followed by centrifugation to collect the supernatant. Protein concentrations were determined using a BCA Protein Assay Kit (Beyotime, China). Equal amounts (20–30 µg) of protein were separated by 10–12% SDS–PAGE and transferred onto PVDF membranes (Millipore, USA). Membranes were blocked with 5% nonfat milk in TBST for 1 h at room temperature and incubated with primary antibodies overnight at 4 °C.
Primary antibodies (all from Proteintech Group, Wuhan, China) were as follows: TAPBP (Cat No. 30500-1-AP, 1:1000); HLA class I ABC (Cat No. 15240-1-AP, 1:1000); ACTIN (Cat No. 66009-1-Ig, 1:5000). After washing, membranes were incubated with HRP-conjugated secondary antibodies (1:5000, Proteintech) for 1 h at room temperature. Protein bands were visualized using an ECL detection kit (Beyotime, China) and imaged with a Bio-Rad ChemiDoc MP system (USA). Band intensities were quantified using ImageJ software29 and normalized to ACTIN.
Cell Proliferation Assay (CCK-8)
Cell proliferation was assessed using the Cell Counting Kit-8 (CCK-8, Dojindo, Japan). After 24 h of transfection, cells were seeded into 96-well plates (3–5 × 10³ cells/well) and cultured for 24, 48, and 72 h. Based on established protocols in vitiligo functional studies, each experimental condition was performed in triplicate (n=3 independent biological replicates) to provide sufficient statistical power for detecting significant differences. At each time point, 10 µL of CCK-8 solution was added to each well and incubated for 2 h.Absorbance was measured at 450 nm using a microplate reader. Relative proliferation rates were normalized to the control group.
Flow Cytometry Analysis of Apoptosis
Cell apoptosis was detected using an Annexin V-FITC/PI Apoptosis Detection Kit (Beyotime, China) following the manufacturer’s protocol. At 48 h post-transfection, cells were collected, washed twice with PBS, and resuspended in binding buffer. Annexin V-FITC and PI were added and incubated in the dark for 15 min. Apoptosis assays were conducted in three independent biological replicates. Samples were analyzed using a BD FACSCalibur flow cytometer (BD, USA), and at least 10,000 cells per sample were acquired. Data were analyzed with FlowJo software (Tree Star, USA) to determine the proportions of early and late apoptotic cells.
Statistical Analysis
Statistical analyses were performed using R (v4.3.2) and Prism 10.0 (GraphPad). To control the false discovery rate in high-throughput analyses, multiple testing corrections were applied using the Benjamini-Hochberg (FDR) method for SMR, MAGMA, and single-cell DEG analyses, with an adjusted p < 0.05 considered statistically significant. For in vitro experimental data, results are expressed as mean ± SD from three independent biological replicates. Differences between two groups were analyzed using Student’s t-test, and multiple group comparisons were performed via one-way ANOVA followed by Tukey’s post-hoc test. A p-value < 0.05 was defined as the threshold for statistical significance in functional assays.
Results
Genome-Wide and Single-Cell Analyses Highlight Antigen-Presenting Cells and Melanocytes as Key Cell Types in Vitiligo
The FinnGen R12 GWAS (Figure 1A) identified multiple loci achieving genome-wide significance, with the most prominent signals located on chromosome 6, corresponding to the MHC region. Integration with the eQTLgen dataset via SMR analysis (Figure 1B) revealed several expression-associated genes potentially mediating genetic risk for vitiligo. Single-cell transcriptomic profiling from GSE203262 (Figure 1C) resolved major epidermal populations, including melanocytes, keratinocytes, and APCs. Marker gene expression (Figure 1D) validated robust cluster annotation. Comparative cellular composition analysis (Figure 1E and F) demonstrated a significant expansion of APCs (p = 0.047) and a trend toward reduced melanocyte abundance (p = 0.23) in vitiligo lesions, indicating immune–melanocyte imbalance as a defining feature.
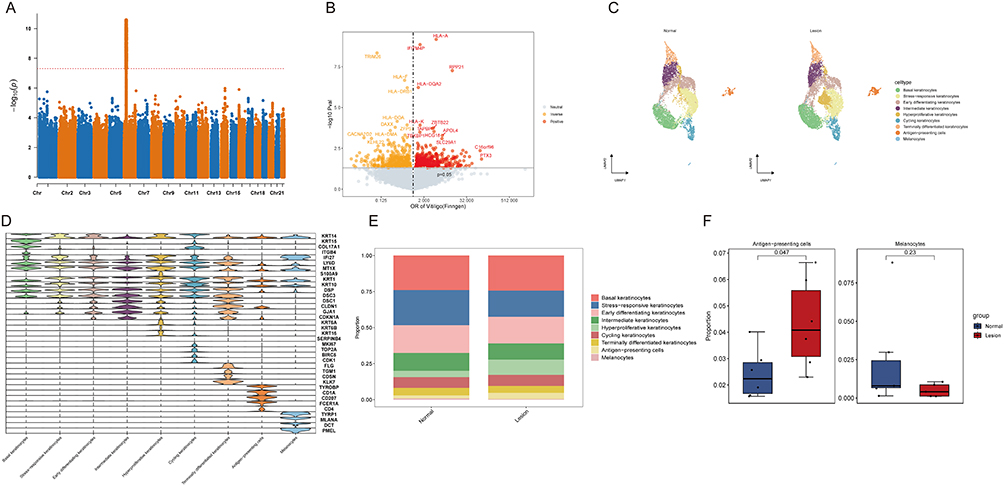 |
Figure 1 Integrative genome-wide and single-cell transcriptomic profiling of vitiligo. (A) Manhattan plot representing the FinnGen R12 GWAS results for vitiligo, highlighting significant susceptibility loci within the MHC region on chromosome 6. (B) Locus plot of SMR analysis integrating vitiligo GWAS and eQTLgen data to screen for expression-associated candidate genes. (C) UMAP visualization of major epidermal cell populations resolved from the GSE203262 single-cell RNA-seq dataset. (D) Dot plot showing the expression of canonical marker genes used for robust cluster annotation. (E) Bar plots comparing the proportions of major cell types between normal and lesional skin. (F) Box plots illustrating the differential abundance of antigen-presenting cells (APCs) and melanocytes in vitiligo lesions. |
To further delineate the specific immune subsets responsible for this expansion, we performed sub-clustering of the APC population, identifying five distinct subpopulations: Langerhans cells (CD207⁺/CD1A⁺), Macrophages (CD206⁺), Stress-responsive APCs, T-cell like APCs, and Cycling APCs. Notably, compositional analysis revealed that CD206⁺ Macrophages were significantly enriched in lesional epidermis compared to normal skin (Supplementary Figure S1). While Langerhans cells are traditional initiators of T-cell priming, the marked accumulation of Macrophages suggests a potential role in amplifying the local inflammatory milieu and processing apoptotic debris, thereby sustaining the autoimmune response.
Integrative eQTL and Single-Cell Analyses Identify TAPBP as a Candidate Mediator Linking Genetic Risk to Melanocyte Dysfunction
Cross-comparison among eQTLgen, MAGMA, and single-cell melanocyte DEGs (Figure 2A) yielded four shared genes—DBNL, SND1, TAPBP, and MVP. Among these, TAPBP stands out as the most biologically relevant candidate due to its direct role in the MHC class I peptide-loading complex, where it influences peptide selection, MHC stability, and the ultimate “immune visibility” of melanocytes to CD8⁺ T cells.30 In contrast, while the other three candidates may contribute to cellular stress or survival, they lack established links to antigen-dependent autoimmunity: DBNL primarily regulates actin cytoskeleton dynamics,31 SND1 participates in RNA processing and transcriptional regulation,32 and MVP modulates intracellular signaling and drug resistance.33 Thus, TAPBP uniquely connects genetic risk to the key effector mechanism of vitiligo—antigen-dependent CD8⁺ T-cell killing of melanocytes—making it the strongest candidate for further functional validation.
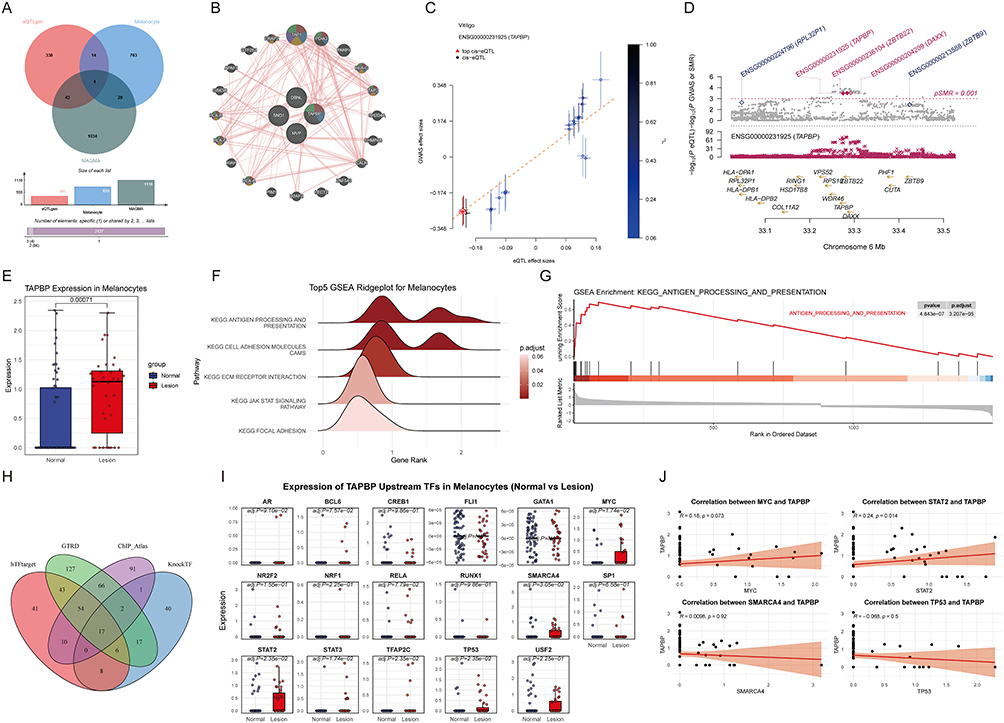 |
Figure 2 Prioritization of TAPBP as a key mediator of melanocyte dysfunction via multi-omic integration. (A) Venn diagram showing the intersection of candidate genes derived from eQTLgen-SMR, MAGMA gene-level association analysis, and single-cell DEGs in lesional melanocytes. (B) GeneMANIA network analysis highlighting the central regulatory role of TAPBP within antigen-processing and MHC-I presentation modules. Enriched pathways are indicated by color: Red (antigen processing and presentation of peptide antigen via MHC class I); Blue (integral component of endoplasmic reticulum membrane); Yellow (antigen processing and presentation of endogenous peptide antigen); Purple (antigen processing and presentation of endogenous antigen); Green (antigen processing and presentation of exogenous peptide antigen via MHC class I). (C) SMR effect plot and (D) corresponding LocusCompare plot for TAPBP, revealing the association between vitiligo susceptibility and gene expression. (E) Violin plot displaying significant upregulation of TAPBP in lesional melanocytes. (F) Top 5 GSEA ridgeplot and (G) GSEA enrichment plot for DEGs in melanocytes, emphasizing the antigen processing and presentation pathway. (H) Venn diagram of predicted upstream transcription factors (TFs) for TAPBP. (I) Box plots showing differential expression of candidate TFs in melanocytes. (J) Scatter plots illustrating the correlation between candidate TFs and TAPBP expression. |
GeneMANIA network analysis (Figure 2B) positioned TAPBP centrally within an antigen-processing and MHC class I presentation module, suggesting a pivotal regulatory role.
In SMR analysis (Figure 2C and D), TAPBP expression exhibited a positive association with vitiligo susceptibility (p < 0.001). At the single-cell level, TAPBP expression was significantly upregulated in melanocytes from lesional skin (Figure 2E). Functional enrichment of melanocyte DEGs (Figure 2F and G) confirmed “antigen processing and presentation” as the top enriched KEGG pathway (GSEA p = 4.84 × 10⁻⁷). Upstream TF prediction (Figure 2H–J) identified STAT2 as the most strongly correlated TF with TAPBP, suggesting a STAT2–TAPBP axis in melanocyte immune stress.
TAPBP Overexpression Upregulates HLA Class I Expression and Suppresses Melanocyte Proliferation
To experimentally validate these findings, TAPBP was overexpressed in MC-1 melanocytes. Western blotting (Figure 3A) confirmed elevated TAPBP protein levels accompanied by increased HLA class I expression. Consistently, RT-qPCR results (Figure 3B and C) demonstrated significant transcriptional upregulation of both TAPBP and HLA class I ABC (p < 0.001). CCK-8 assays (Figure 3D) revealed marked inhibition of melanocyte proliferation at 48 h and 72 h (p < 0.0001). Flow cytometry (Figure 3E and F) showed significantly elevated apoptotic fractions in the TAPBP-overexpressing group (p < 0.001), confirming its pro-apoptotic effect.
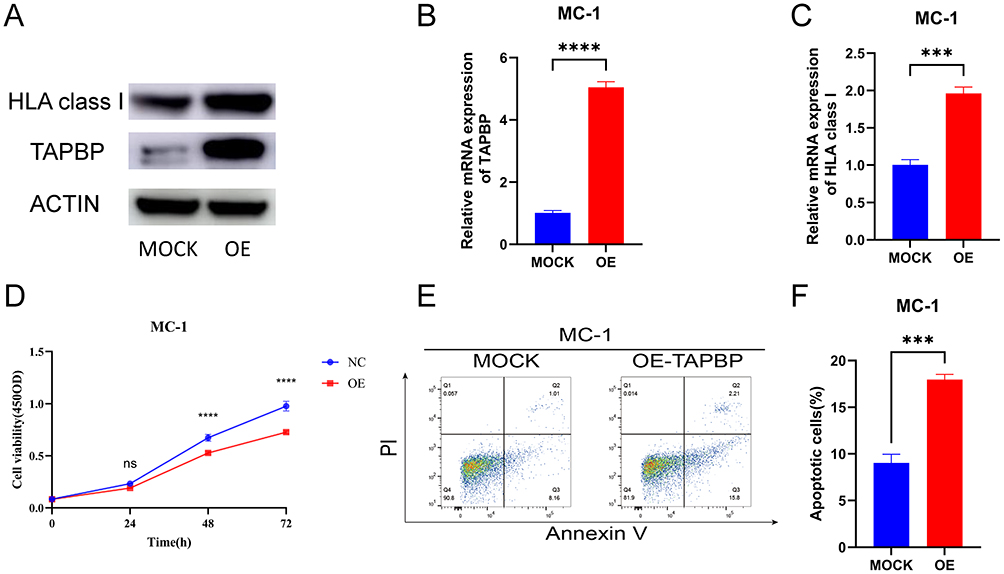 |
Figure 3 Impact of TAPBP overexpression on MHC-I expression, proliferation, and apoptosis in melanocytes. (A) Western blot analysis of TAPBP and HLA class I protein levels in MC-1 cells following TAPBP overexpression. (B and C) RT-qPCR validation of TAPBP and HLA-ABC mRNA expression levels. (D) CCK-8 assay proliferation curves of MC-1 cells over 72 hours. (E) Representative flow cytometry plots and (F) quantitative analysis of apoptotic fractions in control and TAPBP-overexpressed groups. Statistical significance is indicated as: ns, P ≥ 0.05; ***0.0001 < P ≤ 0.001; ****P ≤ 0.0001. |
Discussion
In this study, we combined genome-wide association, eQTL, and single-cell transcriptomic analyses with experimental validation to elucidate the molecular mechanisms underlying melanocyte injury in vitiligo. Integrative analyses identified TAPBP as a gene whose expression was genetically associated with vitiligo susceptibility. Single-cell data demonstrated significant upregulation of TAPBP in melanocytes from lesional skin, and pathway enrichment highlighted antigen processing and presentation as one of the most prominently dysregulated biological processes. Functional assays confirmed that TAPBP overexpression increased HLA class I expression, suppressed melanocyte proliferation, and induced apoptosis. Together, these findings indicate that TAPBP may promote melanocyte loss through enhanced antigen presentation and immune recognition.
The present results provide a mechanistic explanation for how genetic susceptibility can be translated into cellular vulnerability in vitiligo. TAPBP encodes tapasin, an endoplasmic reticulum chaperone that bridges the transporter associated with antigen processing (TAP) to nascent MHC class I complexes, thereby facilitating peptide loading and stabilization of HLA-I molecules.9,10 Enhanced TAPBP expression can increase the efficiency of peptide loading and surface expression of HLA-I, rendering melanocytes more visible to autoreactive cytotoxic T lymphocytes. This mechanism fits well with the established immune signature of vitiligo, characterized by epidermal infiltration of IFN-γ–producing CD8⁺ T cells that target melanocytes via perforin and granzyme-dependent cytotoxicity.34,35 Thus, elevated TAPBP expression may represent a molecular bridge connecting inherited immune regulatory variation with melanocyte-specific immune attack.
Our findings align with previous multi-omic evidence emphasizing the pivotal role of antigen presentation in vitiligo. Genome-wide studies have consistently identified significant susceptibility signals within the MHC region on chromosome 6p.15,36 Notably, while our single-cell analysis shows that TAPBP is upregulated across various epidermal cells—likely as a shared response to the lesional interferon (IFN) environment—its genetic association with vitiligo susceptibility (via SMR) and its pronounced expression in lesional melanocytes suggest a cell-intrinsic vulnerability. This implies that while IFN-driven TAPBP elevation is a common epidermal phenomenon, the intrinsic regulatory machinery of melanocytes may disproportionately translate this signal into a state of heightened immunogenicity, rendering them primary targets for autoimmune attack.
In this context, specific HLA-A alleles (eg, HLA-A24:02 or HLA-A02:01) have been long implicated in disease risk.4 The discovery of TAPBP extends this immunogenetic network by highlighting a key chaperone that orchestrates the quality and stability of peptide–MHC I complexes. Nonetheless, a critical question remains: does TAPBP upregulation primarily increase the global abundance of surface MHC class I molecules, or does it specifically enhance the presentation of melanocyte-specific autoantigens? Given its established role in “peptide editing” and the selection of high-affinity ligands, it is plausible that TAPBP elevation optimizes the display of specific melanocyte-derived peptides, thereby shaping a pathogenic antigenic landscape that directs CD8⁺ T-cell cytotoxicity. Future studies employing immunopeptidomics will be essential to distinguish between increased global MHC stability and the selective enrichment of such pathogenic autoantigens.
Furthermore, our single-cell data reinforce observations that lesional melanocytes adopt stress-related and immune-responsive transcriptional profiles. The enrichment of antigen-presentation and interferon-responsive pathways in these cells provides a mechanistic link between chronic IFN signaling and aberrant HLA-I upregulation, consistent with the interferon-driven immunogenicity reported downstream of the JAK/STAT axis.37
Transcription factor prediction further indicated STAT2 as a potential upstream regulator of TAPBP. STAT2 is a major effector of type I interferon signaling,38 which is chronically activated in vitiligo. The observed positive correlation between STAT2 and TAPBP expression implies that persistent interferon signaling may transcriptionally induce TAPBP, thereby sustaining heightened antigen presentation. This STAT2–TAPBP regulatory axis provides a plausible link between innate antiviral pathways and adaptive cytotoxic responses. Continuous activation of this pathway could perpetuate melanocyte destruction even after the initial inflammatory trigger has resolved, explaining the chronic and relapsing nature of vitiligo.39
Beyond immune signaling, our functional assays revealed that TAPBP overexpression reduced melanocyte proliferation and increased apoptosis. We hypothesize that this cytotoxicity may involve induced endoplasmic reticulum (ER) stress, a phenomenon previously noted when antigen-presentation machinery is overactivated.40,41 Excessive TAPBP could potentially lead to an accumulation of misfolded proteins or an energetic imbalance during the intensified MHC-I assembly process. While our current data confirm the pro-apoptotic role of TAPBP, further experimental evidence is needed to formally link this to specific ER stress pathways (eg, PERK or IRE1α) in vitiligo.
These findings hold translational implications. Current therapies for vitiligo, including topical corticosteroids, calcineurin inhibitors, and JAK inhibitors,42 primarily target immune activation or promote repigmentation but rarely address the intrinsic factors that render melanocytes susceptible to immune attack. Identifying molecules such as TAPBP that regulate melanocyte antigenicity provides an upstream therapeutic opportunity. Furthermore, given its central role in the IFN-STAT2 signaling axis, TAPBP expression levels in the epidermis could potentially serve as a molecular biomarker for assessing disease progression or predicting treatment responsiveness, particularly for therapies targeting the JAK/STAT pathway. Pharmacologic modulation of antigen-processing components or inhibition of interferon-dependent transcriptional regulators like STAT2 may help protect melanocytes from immune surveillance and reduce relapse rates. In addition, TAPBP expression may serve as a biomarker of disease activity or treatment responsiveness, particularly in interferon-dominant subtypes of vitiligo.
Despite the robustness of this integrative approach, several limitations warrant consideration. First, the reliance on GWAS and eQTL data primarily from cohorts of European ancestry may not capture the full genetic architecture of vitiligo across diverse global populations, necessitating further trans-ethnic studies to confirm the universality of our findings. Second, while functional validation was performed in the MC-1 immortalized melanocyte line, this model lacks the complex cellular interactions and cytokine microenvironment present in vivo. Importantly, although this standardized cell line provides initial mechanistic insights, immortalized cells may exhibit exaggerated proliferative responses or heightened stress sensitivity compared to primary human melanocytes. Therefore, the magnitude of TAPBP-induced apoptosis observed in vitro should be interpreted with caution when extrapolating to the clinical skin microenvironment. Moreover, although STAT2 was identified as a putative upstream regulator, direct transcriptional regulation remains to be experimentally confirmed through promoter-binding assays such as chromatin immunoprecipitation. Future work employing patient-derived skin organoids or humanized in vivo models will be crucial to establish the causal role of the STAT2–TAPBP axis in melanocyte destruction and repigmentation failure.
Conclusion
In conclusion, this study identifies TAPBP as a novel molecular link between genetic susceptibility and immune-mediated melanocyte dysfunction in vitiligo. By integrating GWAS, eQTL, and single-cell transcriptomic data with experimental evidence, we demonstrate that TAPBP upregulation enhances MHC class I antigen presentation, thereby facilitating cytotoxic T-cell recognition and melanocyte apoptosis. The positive association between STAT2 and TAPBP further implicates interferon signaling in driving this process. These findings provide new insight into the antigen-presentation axis in vitiligo pathogenesis and suggest that targeting TAPBP or its upstream regulators may represent a promising therapeutic strategy to preserve melanocyte integrity and prevent disease recurrence. Looking forward, further studies utilizing immunopeptidomics to characterize the TAPBP-dependent peptide repertoire, along with validation in skin organoids or patient-derived models, will be essential to fully elucidate the clinical potential of the STAT2–TAPBP axis. Investigating whether this pathway can be pharmacologically modulated to shield melanocytes from immune recognition could open new avenues for precision medicine in vitiligo.
Data Sharing Statement
The datasets supporting this study are publicly available: GWAS summary statistics were obtained from the FinnGen R12 cohort (https://www.finngen.fi/en/access_results), blood eQTL data from the eQTLgen consortium (https://www.eqtlgen.org/), and epidermal single-cell RNA-seq datasets from GEO (GSE203262). Additional processed data and analytical code are available upon reasonable request from the corresponding author.
Ethics Statement
This study is exempt from ethical review as per Article 32 of the Measures for Ethical Review of Life Science and Medical Research Involving Human Beings (National Science and Technology Ethics Committee, China). The exemption is based on the use of non-harmful, non-sensitive data from open, legal databases.
Acknowledgments
We sincerely thank all co-authors for their invaluable contributions: Jinlong Shi and Mingzhen Guo (co-first authors) contributed equally to the study design, data analysis, and manuscript preparation. Liying Fu performed experimental validation, while Jiangman He and Yuan Hu conducted bioinformatics analyses. Yuan Hu also provided overall supervision for the project.
Disclosure
The author(s) report no conflicts of interest in this work.
References
1. Upadhya S, Andrade MJ, Shukla V, Rao R, Satyamoorthy K. Genetic and immune dysregulation in vitiligo: insights into autoimmune mechanisms and disease pathogenesis. Autoimmun Rev. 2025;24(8):103841. doi:10.1016/j.autrev.2025.103841
2. Liu H, Wang Y, Le Q, Tong J, Wang H. The IFN-γ-CXCL9/CXCL10-CXCR3 axis in vitiligo: pathological mechanism and treatment. Eur J Immunol. 2024;54(4):e2250281. doi:10.1002/eji.202250281
3. Wu J, Zhou M, Wan Y, Xu A. CD8+ T cells from vitiligo perilesional margins induce autologous melanocyte apoptosis. Mol Med Rep. 2013;7(1):237–10. doi:10.3892/mmr.2012.1117
4. Jin Y, Hayashi M, Fain PR, et al. Major association of vitiligo with HLA-A*02:01 in Japanese. Pigment Cell Melanoma Res. 2015;28(3):360–362. doi:10.1111/pcmr.12356
5. Jin Y, Andersen G, Yorgov D, et al. Genome-wide association studies of autoimmune vitiligo identify 23 new risk loci and highlight key pathways and regulatory variants. Nat Genet. 2016;48(11):1418–1424. doi:10.1038/ng.3680
6. Gellatly KJ, Strassner JP, Essien K, et al. scRNA-seq of human vitiligo reveals complex networks of subclinical immune activation and a role for CCR5 in Treg function. Sci Transl Med. 2021;13(610):eabd8995. doi:10.1126/scitranslmed.abd8995
7. Cai M, Yuan T, Huang H, et al. Integrative analysis of omics data reveals regulatory network of CDK10 in vitiligo risk. Front Genet. 2021;12:634553. doi:10.3389/fgene.2021.634553
8. Zhang J, Xiang F, Ding Y, et al. Identification and validation of RNA-binding protein SLC3A2 regulates melanocyte ferroptosis in vitiligo by integrated analysis of single-cell and bulk RNA-sequencing. BMC Genomics. 2024;25(1):236. doi:10.1186/s12864-024-10147-y
9. Jiang J, Taylor DK, Kim EJ, et al. Structural mechanism of tapasin-mediated MHC-I peptide loading in antigen presentation. Nat Commun. 2022;13(1):5470. doi:10.1038/s41467-022-33153-8
10. Margulies DH, Jiang J, Ahmad J, Boyd LF, Natarajan K. Chaperone function in antigen presentation by MHC class I molecules-tapasin in the PLC and TAPBPR beyond. Front Immunol. 2023;14:1179846. doi:10.3389/fimmu.2023.1179846
11. Casp CB, She JX, McCormack WT. Genes of the LMP/TAP cluster are associated with the human autoimmune disease vitiligo. Genes Immun. 2003;4(7):492–499. doi:10.1038/sj.gene.6364016
12. Walker-Sperling V, Digitale JC, Viard M, et al. Genetic variation that determines TAPBP expression levels associates with the course of malaria in an HLA allotype-dependent manner. Proc Natl Acad Sci U S A. 2022;119(29):e2205498119. doi:10.1073/pnas.2205498119
13. de Leeuw CA, Mooij JM, Heskes T, Posthuma D. MAGMA: generalized gene-set analysis of GWAS data. PLoS Comput Biol. 2015;11(4):e1004219. doi:10.1371/journal.pcbi.1004219
14. Kurki MI, Karjalainen J, Palta P, et al. FinnGen provides genetic insights from a well-phenotyped isolated population. Nature. 2023;613(7944):508–18.
15. Shen C, Gao J, Sheng Y, et al. Genetic susceptibility to vitiligo: GWAS approaches for identifying vitiligo susceptibility genes and loci. Front Genet. 2016;7:3. doi:10.3389/fgene.2016.00003
16. Võsa U, Claringbould A, Westra HJ, et al. Large-scale cis- and trans-eQTL analyses identify thousands of genetic loci and polygenic scores that regulate blood gene expression. Nat Genet. 2021;53(9):1300–1310. doi:10.1038/s41588-021-00913-z
17. Wu Y, Zheng Z, Visscher PM, Yang J. Quantifying the mapping precision of genome-wide association studies using whole-genome sequencing data. Genome Biol. 2017;18(1):86. doi:10.1186/s13059-017-1216-0
18. Zhu Z, Zhang F, Hu H, et al. Integration of summary data from GWAS and eQTL studies predicts complex trait gene targets. Nat Genet. 2016;48(5):481–487. doi:10.1038/ng.3538
19. Hao Y, Hao S, Andersen-Nissen E, et al. Integrated analysis of multimodal single-cell data. Cell. 2021;184(13):3573–3587.e29. doi:10.1016/j.cell.2021.04.048
20. Stuart T, Butler A, Hoffman P, et al. Comprehensive integration of single-cell data. Cell. 2019;177(7):1888–1902.e21. doi:10.1016/j.cell.2019.05.031
21. Becht E, McInnes L, Healy J, et al. Dimensionality reduction for visualizing single-cell data using UMAP. Nat Biotechnol. 2018. doi:10.1038/nbt.4314
22. Yu G, Wang LG, Han Y, He QY. clusterProfiler: an R package for comparing biological themes among gene clusters. OMICS. 2012;16(5):284–287. doi:10.1089/omi.2011.0118
23. Kanehisa M, Goto S. KEGG: kyoto encyclopedia of genes and genomes. Nucleic Acids Res. 2000;28(1):27–30. doi:10.1093/nar/28.1.27
24. Subramanian A, Tamayo P, Mootha VK, et al. Gene set enrichment analysis: a knowledge-based approach for interpreting genome-wide expression profiles. Proc Natl Acad Sci U S A. 2005;102(43):15545–15550. doi:10.1073/pnas.0506580102
25. Liberzon A, Subramanian A, Pinchback R, Thorvaldsdóttir H, Tamayo P, Mesirov JP. Molecular signatures database (MSigDB) 3.0. Bioinformatics. 2011;27(12):1739–1740. doi:10.1093/bioinformatics/btr260
26. Warde-Farley D, Donaldson SL, Comes O, et al. The GeneMANIA prediction server: biological network integration for gene prioritization and predicting gene function. Nucleic Acids Res. 2010;38(suppl_2):W214–220. doi:10.1093/nar/gkq537
27. Wang J. TFTF: an R-Based integrative tool for decoding human transcription factor-target interactions. Biomolecules. 2024;14(7):749. doi:10.3390/biom14070749
28. Livak KJ, Schmittgen TD. Analysis of relative gene expression data using real-time quantitative PCR and the 2(-Delta delta C(T)) method. Methods. 2001;25(4):402–408. doi:10.1006/meth.2001.1262
29. Schneider CA, Rasband WS, Eliceiri KW. NIH Image to ImageJ: 25 years of image analysis. Nat Methods. 2012;9(7):671–675. doi:10.1038/nmeth.2089
30. Seipp RP, Hoeffel G, Moise AR, et al. A secreted Tapasin isoform impairs cytotoxic T lymphocyte recognition by disrupting exogenous MHC class I antigen presentation. Front Immunol. 2024;15:1525136. doi:10.3389/fimmu.2024.1525136
31. Inoue S, Hayashi K, Fujita K, et al. Drebrin-like (Dbnl) controls neuronal migration via regulating N-Cadherin expression in the developing cerebral cortex. J Neurosci. 2019;39(4):678–691. doi:10.1523/JNEUROSCI.1634-18.2018
32. Ochoa B, Chico Y, Martínez MJ. Insights into SND1 oncogene promoter regulation. Front Oncol. 2018;8:606. doi:10.3389/fonc.2018.00606
33. Du P, Tang K, Chen X, et al. Intercellular contractile force attenuates chemosensitivity through Notch-MVP-mediated nuclear drug export. Proc Natl Acad Sci U S A. 2025;122(19):e2417626122. doi:10.1073/pnas.2417626122
34. Rashighi M, Harris JE. Interfering with the IFN-γ/CXCL10 pathway to develop new targeted treatments for vitiligo. Ann Transl Med. 2015;3(21):343. doi:10.3978/j.issn.2305-5839.2015.11.36
35. Yee C, Thompson JA, Roche P, et al. Melanocyte destruction after antigen-specific immunotherapy of melanoma: direct evidence of t cell-mediated vitiligo. J Exp Med. 2000;192(11):1637–1644. doi:10.1084/jem.192.11.1637
36. Jin Y, Birlea SA, Fain PR, et al. Genome-wide association analyses identify 13 new susceptibility loci for generalized vitiligo. Nat Genet. 2012;44(6):676–680. doi:10.1038/ng.2272
37. Ferreira C, King B, Torres T. JAK inhibitors for the treatment of vitiligo: current evidence and emerging therapeutic potential. Drugs. 2025;85(12):1521–1534. doi:10.1007/s40265-025-02246-1
38. Canar J, Darling K, Dadey R, Gamero AM. The duality of STAT2 mediated type I interferon signaling in the tumor microenvironment and chemoresistance. Cytokine. 2023;161:156081. doi:10.1016/j.cyto.2022.156081
39. Boniface K. Aetiopathogenesis of Vitiligo. Dermatol Pract Concept. 2023;e2023314S. doi:10.5826/dpc.1304S2a314S
40. Fallahi P, Ferrari SM, Ragusa F, et al. Th1 chemokines in autoimmune endocrine disorders. J Clin Endocrinol Metabol. 2020;105(4):1046–1060. doi:10.1210/clinem/dgz289
41. Calderon B, Unanue ER. Antigen presentation events in autoimmune diabetes. Curr Opin Immunol. 2012;24(1):119–128. doi:10.1016/j.coi.2011.11.005
42. Seneschal J, Speeckaert R, Taïeb A, et al. Worldwide expert recommendations for the diagnosis and management of vitiligo: position statement from the international vitiligo task Force-Part 2: specific treatment recommendations. J Eur Acad Dermatol Venereol. 2023;37(11):2185–2195. doi:10.1111/jdv.19450
 © 2026 The Author(s). This work is published and licensed by Dove Medical Press Limited. The
full terms of this license are available at https://www.dovepress.com/terms
and incorporate the Creative Commons Attribution
- Non Commercial (unported, 4.0) License.
By accessing the work you hereby accept the Terms. Non-commercial uses of the work are permitted
without any further permission from Dove Medical Press Limited, provided the work is properly
attributed. For permission for commercial use of this work, please see paragraphs 4.2 and 5 of our Terms.
© 2026 The Author(s). This work is published and licensed by Dove Medical Press Limited. The
full terms of this license are available at https://www.dovepress.com/terms
and incorporate the Creative Commons Attribution
- Non Commercial (unported, 4.0) License.
By accessing the work you hereby accept the Terms. Non-commercial uses of the work are permitted
without any further permission from Dove Medical Press Limited, provided the work is properly
attributed. For permission for commercial use of this work, please see paragraphs 4.2 and 5 of our Terms.