
Back to Journals » Diabetes, Metabolic Syndrome and Obesity » Volume 18
Integrative Genetic Analysis of DPP4-Related Variants Reveals Risk Patterns for Type 2 Diabetes and Cardiometabolic Comorbidities
Authors Wu S, Zuo C, Bai C, Chen Q, Qiao Y  , Zhou N, Xiao Q
Received 11 November 2025
Accepted for publication 18 December 2025
Published 1 January 2026 Volume 2025:18 Pages 4843—4858
DOI https://doi.org/10.2147/DMSO.S577700
Checked for plagiarism Yes
Review by Single anonymous peer review
Peer reviewer comments 2
Editor who approved publication: Dr Rebecca Baqiyyah Conway
Shuangxin Wu,1,2,* Chao Zuo,3,4,* Chuan Bai,2 Qi Chen,1 Yongchao Qiao,3 Nan Zhou,4 Qiang Xiao5
1Medical Research Center, The Eighth Affiliated Hospital of Sun Yat-Sen University, Shenzhen, Guangdong, People’s Republic of China; 2Institute of Human Virology, Key Laboratory of Tropical Disease Control of Ministry of Education, Zhongshan School of Medicine, Sun Yat-sen University, Guangzhou, Guangdong, People’s Republic of China; 3Department of Clinical Laboratory, The First Affiliated Hospital of Guilin Medical University, Guilin, Guangxi, People’s Republic of China; 4Molecular Cancer Research Center, School of Medicine, Shenzhen Campus of Sun Yat-sen University, Sun Yat-sen University, Shenzhen, Guangdong, People’s Republic of China; 5Department of Clinical Laboratory, The Fifth Affiliated Hospital of Sun Yat-sen University, Zhuhai, Guangdong, People’s Republic of China
*These authors contributed equally to this work
Correspondence: Qiang Xiao, Email [email protected] Nan Zhou, Email [email protected]
Background: Hypertension (HTN) and dyslipidemia (DYS) frequently complicate type 2 diabetes mellitus (T2DM), increasing cardiovascular risk. Genetic variation within the DPP4–ABCC8–INSR–IGF1 axis may underlie this clustering.
Methods: A total of 444 T2DM patients were stratified into T2DM (n = 256), T2DM with HTN (T2MH, n = 134), and T2DM with HTN and DYS (T2MH-DYS, n = 54). Six single nucleotide polymorphisms (SNPs) were genotyped, and associations were assessed by logistic regression and haplotype analysis with Bonferroni correction.
Results: Clinical profiling showed higher C-reactive protein (CRP) and adrenocorticotropic hormone (ACTH) in T2MH and more severe metabolic derangements in T2MH-DYS. DPP4 rs3788979 was strongly linked to hypertension: CT (adjusted OR = 0.370, P = 0.001) and CC (adjusted OR = 0.424, P = 0.001) were protective versus TT, while in the T2MH vs T2MH-DYS comparison, the same CT and CC genotypes conferred increased dyslipidemia risk (adjusted OR = 5.418, P = 0.001; OR = 5.620, P = 0.002). In the comparison between T2DM and T2MH-DYS, the same genotypes also increase the susceptibility risk. IGF1 rs972936 TC genotype also reduced T2MH risk (adjusted OR = 0.460, P = 0.006). Haplotype analysis identified GAATGT as protective against hypertension (OR = 0.312, P = 0.0014) and GACCGT as a risk haplotype for dyslipidemia (OR = 4.113, P = 0.0021); both remained significant after Bonferroni correction.
Conclusion: Variants within the DPP4 axis influence susceptibility to HTN and DYS in T2DM, with GAATGT and GACCGT emerging as robust haplotype markers. Notably, the risk conferred by DPP4 rs3788979 genotypes was modulated by lipid status: CT/CC were protective against hypertension alone but became risk factors when dyslipidemia co-occurred.
Keywords: DPP4 axis, polymorphism, haplotype, type 2 diabetes, hypertension, dyslipidemia
Introduction
The global prevalence of type 2 diabetes mellitus (T2DM) has escalated dramatically over recent decades, and hypertension (HTN) and dyslipidemia (DYS) are among the most frequent cardiometabolic comorbidities in these patients. In large-scale cohorts, hypertension affects 45–60% of people with T2DM, while dyslipidemia (particularly hyperlipidemia or hypertriglyceridemia) is observed in 40–50% of such individuals.1–3 The coexistence of T2DM with HTN or DYS substantially increases cardiovascular disease risk. T2DM patients with hypertension have approximately 2- to 3-fold greater risk of cardiovascular events compared to T2DM alone.4,5 From a public health perspective, unraveling the genetic underpinnings of this cardiometabolic clustering is critical for enabling precision prevention and early intervention.
Insulin secretion and signaling constitute the central pathological axis of T2DM and its cardiometabolic complications.6 Dipeptidyl peptidase 4 (DPP4) regulates the availability of incretin hormones such as glucagon-likepeptide-1 (GLP-1) and gastric inhibitory polypeptide (GIP), thereby influencing postprandial insulin release.7,8 Downstream, ATP-binding cassette subfamily C member 8 (ABCC8), encoding the sulfonylurea receptor subunit of the β-cell KATP channel, serves as the molecular switch for glucose-stimulated depolarization and insulin exocytosis.9,10 Secreted insulin subsequently binds to its receptor encoded by insulin receptor (INSR), initiating the IRS1/PI3K/Akt cascade to promote glucose uptake and maintain metabolic balance.11,12 In parallel, insulin-like growth factor 1 (IGF1), which shares structural homology and receptor crosstalk with insulin, enhances insulin sensitivity and supports metabolic regulation.13 Collectively, these four genes form an “incretin–secretion–signaling–sensitivity” pathway. Genetic polymorphisms across this pathway may exert synergistic effects, producing a “double-hit” of impaired insulin secretion and signaling resistance, ultimately amplifying susceptibility to T2DM and its comorbid HTN and DYS. Identifying genetic markers along key physiological pathways could significantly impact clinical practice by improving early risk prediction, guiding individualized treatment decisions, and enabling monitoring of high-risk patients with T2DM.
Although numerous studies have reported associations between individual DPP4,14–16 ABCC8,17–24 INSR,25 and IGF126–30 polymorphisms and T2DM or complications, the combined effects of these genes along a unified biological axis have not been systematically investigated. Unlike the conventional genetic studies that focus on single variant or gene in isolation, this study employs an integrated pathway-based approach to examine synergistic effects across the incretin–secretion–signaling–sensitivity axis. In particular, the joint genetic contribution of DPP4 and its downstream secretion–signaling partners to the development of T2DM with HTN and DYS remains largely unexplored. Therefore, the present study aimed to comprehensively evaluate the associations of common polymorphisms in DPP4, ABCC8, INSR, and IGF1 with the risk of T2DM accompanied by HTN and/or DYS. We hypothesize that a combined genetic profile across this pathway will be more strongly associated with cardiometabolic comorbidity patterns than any single variant, and that gene–gene interactions within the axis may further modulate disease risk. We further sought to investigate potential gene–gene interactions within this pathway, in order to elucidate the genetic architecture underlying secretion–signaling defects and provide a theoretical basis for precision prevention of cardiometabolic comorbidities in T2DM populations.
Materials and Methods
Study Cohort and Eligibility
Between September 2021 and January 2022, a total of 650 patients with T2DM were initially enrolled from the Department of Endocrinology at the First Affiliated Hospital of Guilin Medical University. Strict exclusion criteria were applied to obtain a homogenous study cohort. Patients were excluded if they had any of the following: (1) severe comorbid conditions: this included recent acute cardiovascular events (within the past 6 months, eg myocardial infarction or valvular heart disease requiring surgery), advanced chronic kidney disease (stage 4–5 with eGFR < 30 mL/min/1.73 m2), or decompensated liver cirrhosis (Child-Pugh class B or C); (2) confounding diabetes classifications: patients with type 1 diabetes were excluded (confirmed by negative GAD65 autoantibodies and preserved C-peptide levels). Additionally, those with active severe microvascular complications, such as proliferative diabetic retinopathy or macroalbuminuric diabetic nephropathy, were not included; (3) other systemic conditions: patients were excluded if they had systemic autoimmune diseases (eg systemic lupus erythematosus), a recent history of malignancy (diagnosed within the last 5 years), any inherited metabolic disorder, pregnancy, or significant cognitive impairment.
T2DM diagnostic criteria: the diagnosis of type 2 diabetes was confirmed according to the 2021 American Diabetes Association (ADA) guidelines.31,32 Specifically, T2DM was defined by a fasting plasma glucose ≥ 7.0 mmol/L, a 2-hour oral glucose tolerance test (OGTT) plasma glucose ≥ 11.1 mmol/L, or a glycosylated hemoglobin (HbA1c) ≥ 6.5%.
HTN was defined and categorized based on the American Heart Association and Chinese hypertension management guidelines.33,34 Blood pressure was measured using a validated Omron HEM-7136 oscillometric device after the patient had been seated at rest for 5 minutes. Three measurements were taken at 1–2 minute intervals and averaged. DYS was diagnosed according to the Chinese guidelines for prevention of adult dyslipidemia.35 DYS was defined by the presence of any of the following criteria: total cholesterol ≥ 5.2 mmol/L, low-density lipoprotein cholesterol (LDL-C) ≥ 3.4 mmol/L, high-density lipoprotein cholesterol (HDL-C) < 1.0 mmol/L in men or < 1.3 mmol/L in women, or triglycerides ≥ 1.7 mmol/L.
After applying all exclusion criteria and ensuring completeness of key data, a final cohort of 444 T2DM patients remained. These patients were stratified into three study groups: a T2DM group (n = 256, T2DM without accompanying hypertension or dyslipidemia), a T2MH group (n = 134, T2DM with hypertension), and a T2MH-DYS group (n = 54, T2DM with both hypertension and dyslipidemia). The three groups were comparable in age and sex distribution (median age: 61.0 [53.0–66.0] vs 59.73 ± 7.41 vs 59.20 ± 8.21 years, P > 0.05 across all comparisons; male/female: 156/100 vs 78/56 vs 33/21, P > 0.05). This study was approved by the Institutional Review Board of Guilin Medical University and was conducted in accordance with the Declaration of Helsinki (Approval No. 2023QTLL-37). Written informed consent was obtained from all participants, and all subjects confirmed no biological kinship with one another to ensure the independence of samples.
Clinical and Biochemical Assessments
Baseline data collection encompassed a broad range of clinical and biochemical parameters for each patient. Demographic characteristics (age, sex, and weight) were recorded alongside key metabolic measures such as blood pressure (SBP/DBP), HbA1c, and fasting plasma glucose. Markers of renal function, including plasma urea and creatinine, were measured, as well as a full lipid profile (triglycerides, total cholesterol, HDL-C, and LDL-C) and an inflammatory marker (C-reactive protein). In addition, the presence of islet autoantibodies (anti-GAD65 and insulin autoantibodies) was assessed, and levels of selected neuroendocrine hormones were measured (adrenocorticotropic hormone [ACTH], angiotensin II, aldosterone, and renin).
All blood samples were analyzed in the ISO 15189-accredited clinical laboratory of Guilin Medical University (Certification No. ML00036). Key biochemical assays were performed using a Cobas e701 automatic analyzer. HbA1c was measured by high-performance liquid chromatography (Bio-Rad D-100 system; reference range 4.0–6.0%) with intra-assay and inter-assay coefficients of variation (CV) ≤ 1.8% and ≤ 2.3%, respectively. Fasting plasma glucose was determined by the enzymatic hexokinase method (CV < 2.1%). LDL-C values were calculated using the Friedewald equation (applicable only when triglycerides ≤ 4.5 mmol/L).36 Neuroendocrine hormone levels were measured with an AutoLumo A6000 chemiluminescent analyzer. The ACTH assay had a sensitivity of 1.0 pg/mL with a CV < 5.2%. Angiotensin II and aldosterone were quantified using a solid-phase extraction followed by chemiluminescent detection, with dynamic ranges of 5–2000 pg/mL for angiotensin II and 25–1600 pg/mL for aldosterone. Islet autoantibodies were measured by chemiluminescence immunoassay, using positivity cut-off values of ≥ 5 IU/mL for GAD65 antibodies and ≥ 0.4 nU/mL for insulin autoantibodies.
Genotyping of Candidate Polymorphisms
Genotyping of candidate polymorphisms was performed using a locus-specific, ligation-dependent PCR method. Genomic DNA was first prepared by thermal lysis at 98 °C for 5 minutes. Locus-specific probes targeting each single nucleotide polymorphism (SNP) were then hybridized to the DNA in the presence of a DNA ligase at 58 °C for 4 hours (with a ligase-to-probe volume ratio of 0.5 µL:1 µL). After this ligation step, a multiplex touchdown PCR was carried out, during which the annealing temperature was gradually lowered from 62 °C to 57 °C through successive cycles (using a primer mix ratio of 10:1). The PCR amplification products were diluted 1:10 (v/v) and analyzed by capillary electrophoresis on an ABI 3730XL DNA Analyzer, using a Liz600 size standard for allele sizing. The resulting electropherograms were interpreted with GeneMapper version 4.1 to discriminate alleles and assign genotypes (Supplementary Figure 1). The specific primer sequences used for PCR amplification are listed in Supplementary Table 1.
Candidate SNPs were selected through a two-step filtering strategy. First, a functional/regulatory prioritization was applied: we focused on non-synonymous variants predicted to be damaging, variants located in key regulatory regions (promoters or enhancers), and any SNPs with experimental evidence of affecting gene expression or protein function (for example, expression quantitative trait loci identified in GTEx or variants reported in functional studies). Second, a population-based filter was used: we included only variants with a minor allele frequency (MAF) > 5% in East Asian populations (based on NCBI dbSNP data), and we excluded variants that had not been previously associated with metabolic traits in the literature.
Statistical Analysis
Statistical analyses were performed using SPSS Statistics version 26.0 (IBM Corp., Armonk, NY, USA) and the SHEsis online platform for genetic data analysis. The Kolmogorov–Smirnov test was used to assess whether continuous variables followed a normal distribution. Continuous data that were approximately normally distributed are presented as mean ± standard deviation (SD) and were compared between groups using independent-samples t tests. Continuous data with a non-normal distribution are presented as median and interquartile range and were compared using the Mann–Whitney U-test. Categorical variables were summarized as counts (percentages) and compared using the chi-square (χ2) test. Genotype frequencies were tested for Hardy-Weinberg equilibrium using a χ2 goodness-of-fit test. Haplotype construction and analysis were performed using the SHEsis software (http://analysis.bio-x.cn).37 For comparisons involving more than two groups, one-way analysis of variance (ANOVA) was employed, followed by Tukey’s Honestly Significant Difference (HSD) post hoc test for pairwise comparisons. A P value < 0.05 was considered statistically significant.
Results
Hemodynamic, Metabolic, and Inflammatory Features in T2DM with Comorbidities
As expected, systolic blood pressure was significantly higher in both the T2MH and T2MH-DYS groups compared with T2DM patients (145.35 ± 22.97 vs 138.65 ± 20.82 vs.133.87 ± 19.36 mmHg, P4 < 0.001, Table 1), confirming HTN status. The T2MH-DYS subgroup exhibited the greatest metabolic disturbances, with significantly elevated fasting plasma glucose (10.81 [6.43–16.52] vs 7.87 [6.11–11.43] mmol/L, P = 0.017), triglycerides (2.38 [1.53–5.19] vs 1.68 [1.05–2.71] mmol/L, P < 0.001), total cholesterol (5.20 ± 1.71 vs 4.58 ± 1.30 mmol/L, P = 0.003), and LDL-C (3.17 [2.28–3.95] vs 2.87 ± 0.99 mmol/L, P = 0.009), indicating pronounced dyslipidaemia and poorer glycaemic control. Inflammatory and endocrine markers were also perturbed. CRP was elevated in the T2MH group compared with T2DM (2.85 vs 1.79 mg/L, P = 0.007), consistent with chronic low-grade inflammation, while ACTH levels were significantly higher in T2MH group (20.07 vs 13.24 pg/mL, P = 0.009), suggesting neuroendocrine activation. By contrast, GAD65 autoantibodies were reduced in the T2MH-DYS group (P < 0.001). Overall, HTN in T2DM was associated with inflammatory and endocrine dysregulation, whereas the coexistence of DYS further aggravated metabolic imbalance (Table 1).
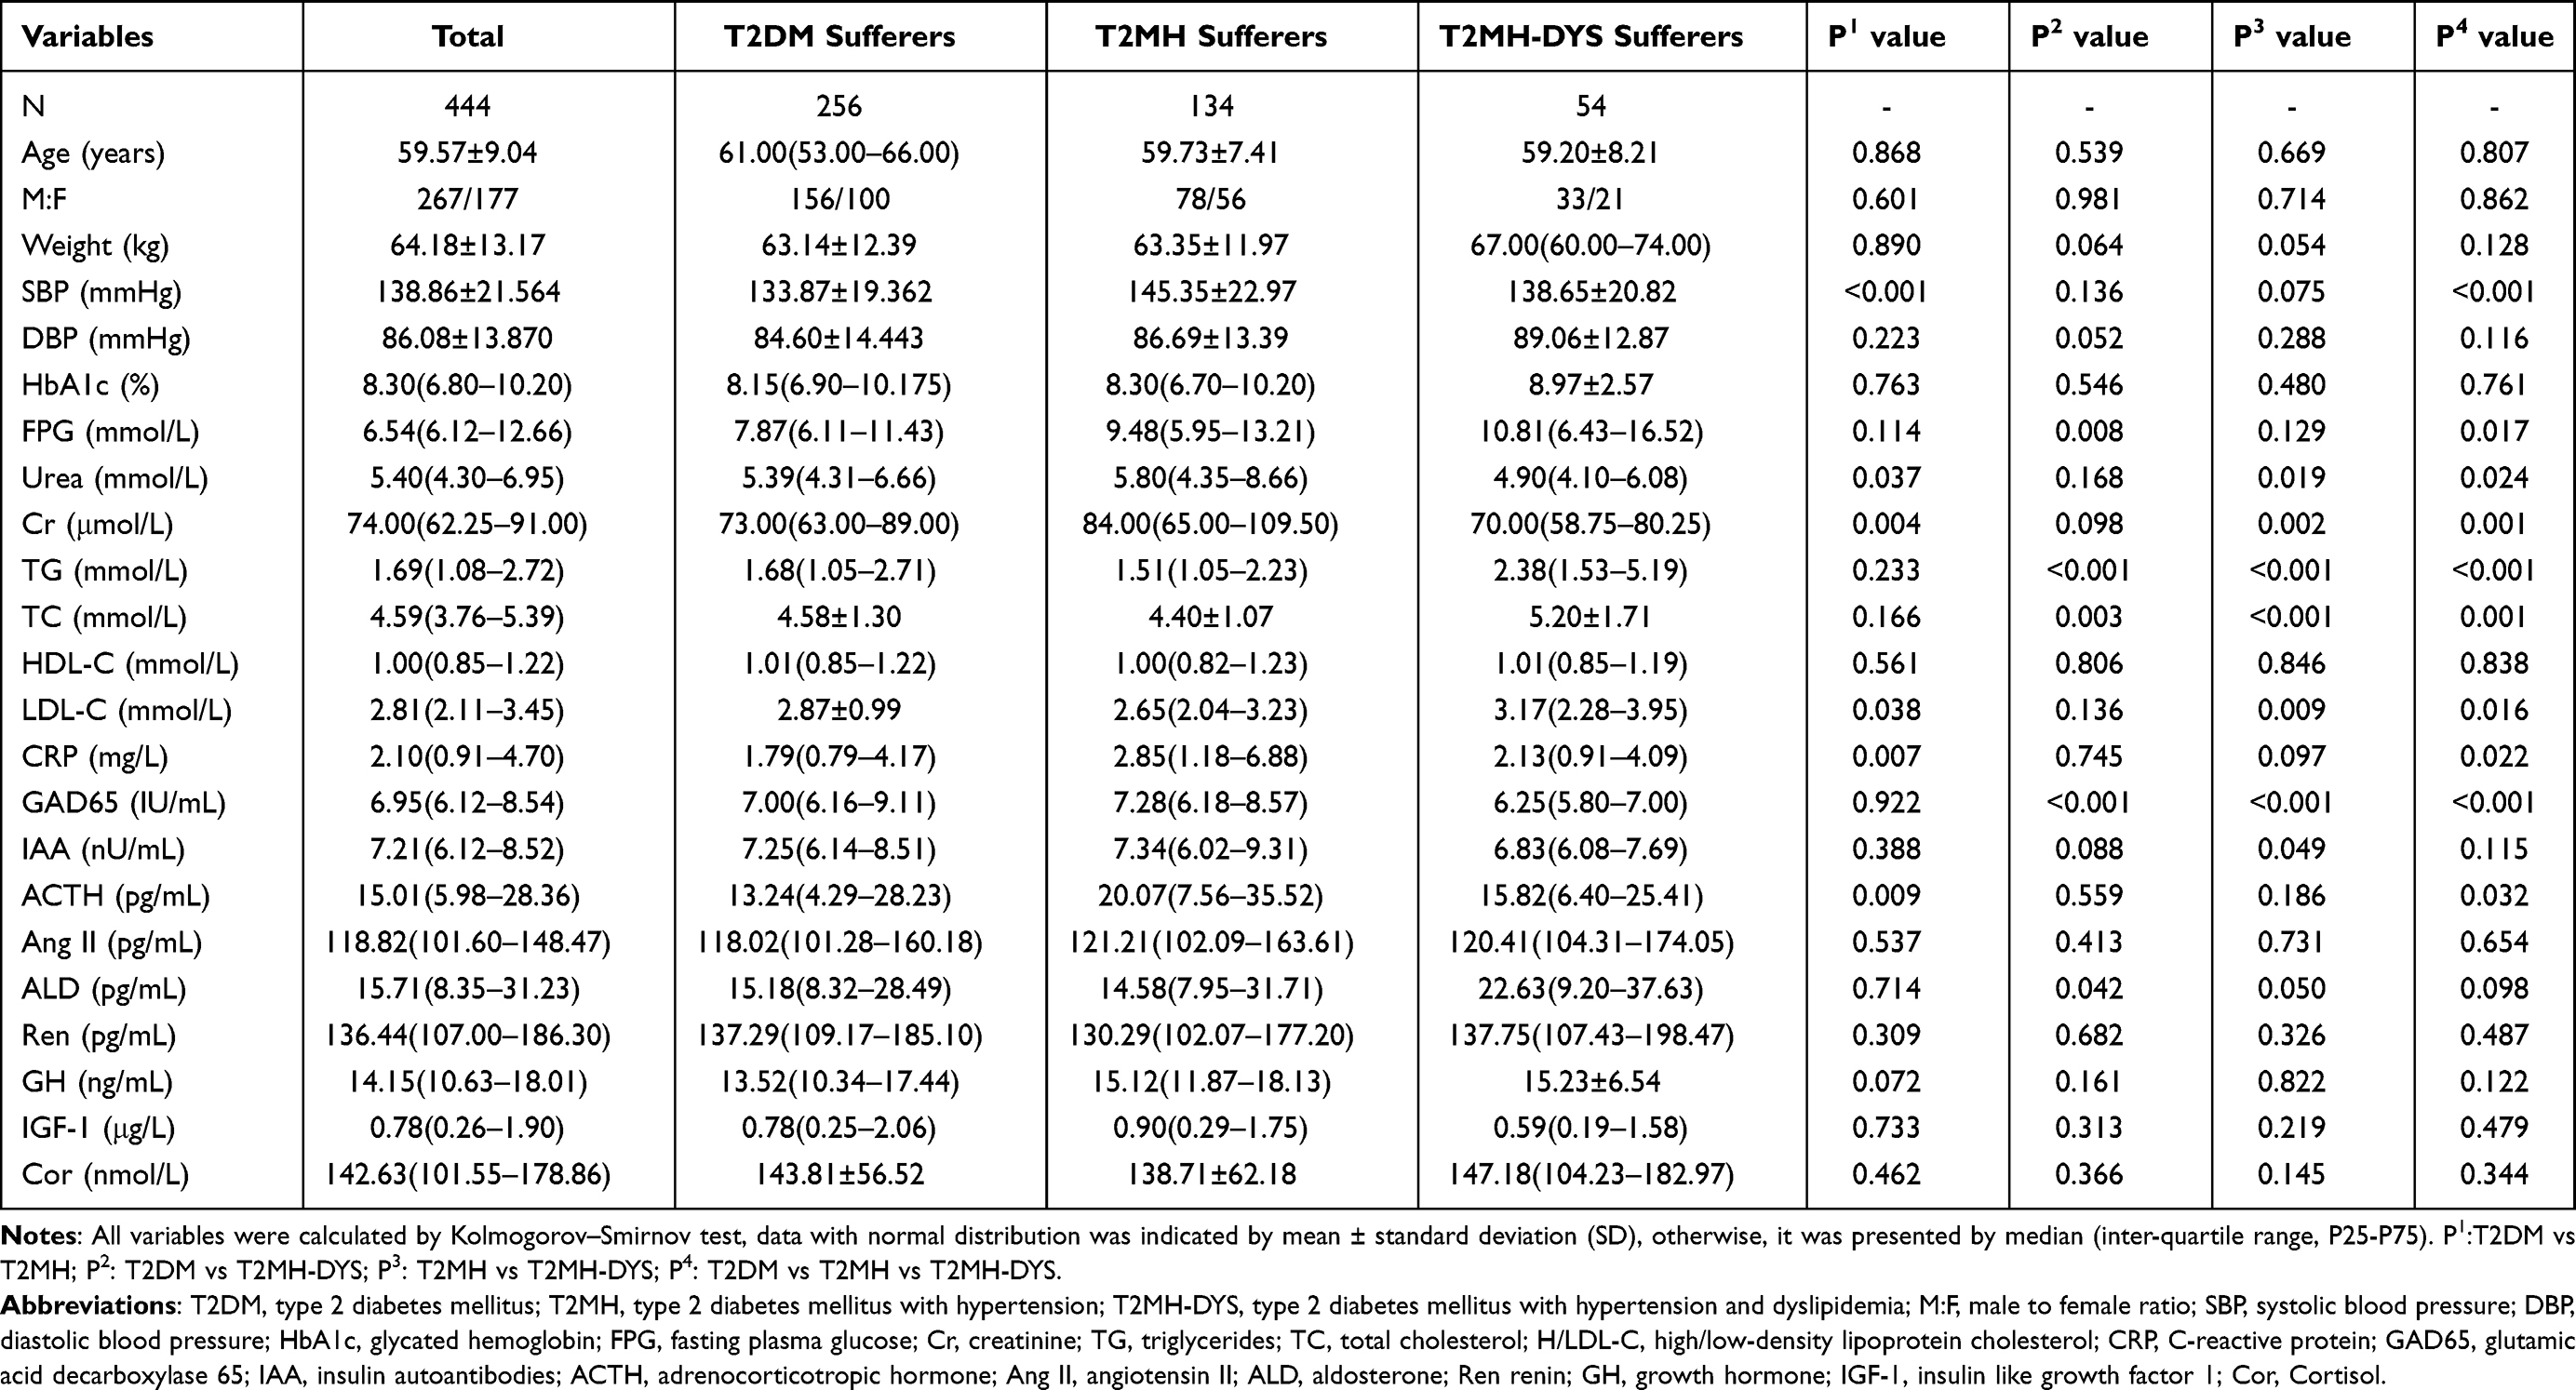 |
Table 1 Clinical Characteristics of the Study Subjects |
Genetic Variants in the DPP4 Axis Across Clinical Subgroups
All examined loci were in Hardy–Weinberg equilibrium (P > 0.05). In the three-group comparisons (T2DM, T2MH, and T2MH-DYS), significant distributional differences were identified within the DPP4 axis (Table 2). The most striking finding was for DPP4 rs3788979, where genotype frequencies varied significantly among the three groups (TT vs CT vs CC: χ2 = 21.193, P < 0.001). The recessive model further confirmed this association, with TT carriers showing divergent distributions across subgroups (TT vs CT+CC: χ2 = 20.831, P < 0.001). At the allelic level, the T versus C contrast also reached high significance (χ2 = 16.152, P < 0.001). For IGF1 rs5742632, overall genotype distributions differed (AA vs AG vs GG: χ2 = 9.820, P = 0.044), and a recessive comparison demonstrated that GG homozygotes were unevenly distributed (GG vs AA+AG: χ2 = 7.177, P = 0.028). Similarly, IGF1 rs972936 displayed significant variation across groups (TT vs TC vs CC: χ2 = 10.372, P = 0.035), with further evidence from dominant (TT vs TC+CC: χ2 = 6.137, P = 0.046) and heterozygote (TC vs TT+CC: χ2 = 7.205, P = 0.027) contrasts. In contrast, INSR rs1799817 and ABCC8 rs1799854/rs757110 did not show significant genotype or allele frequency differences (all P > 0.05).
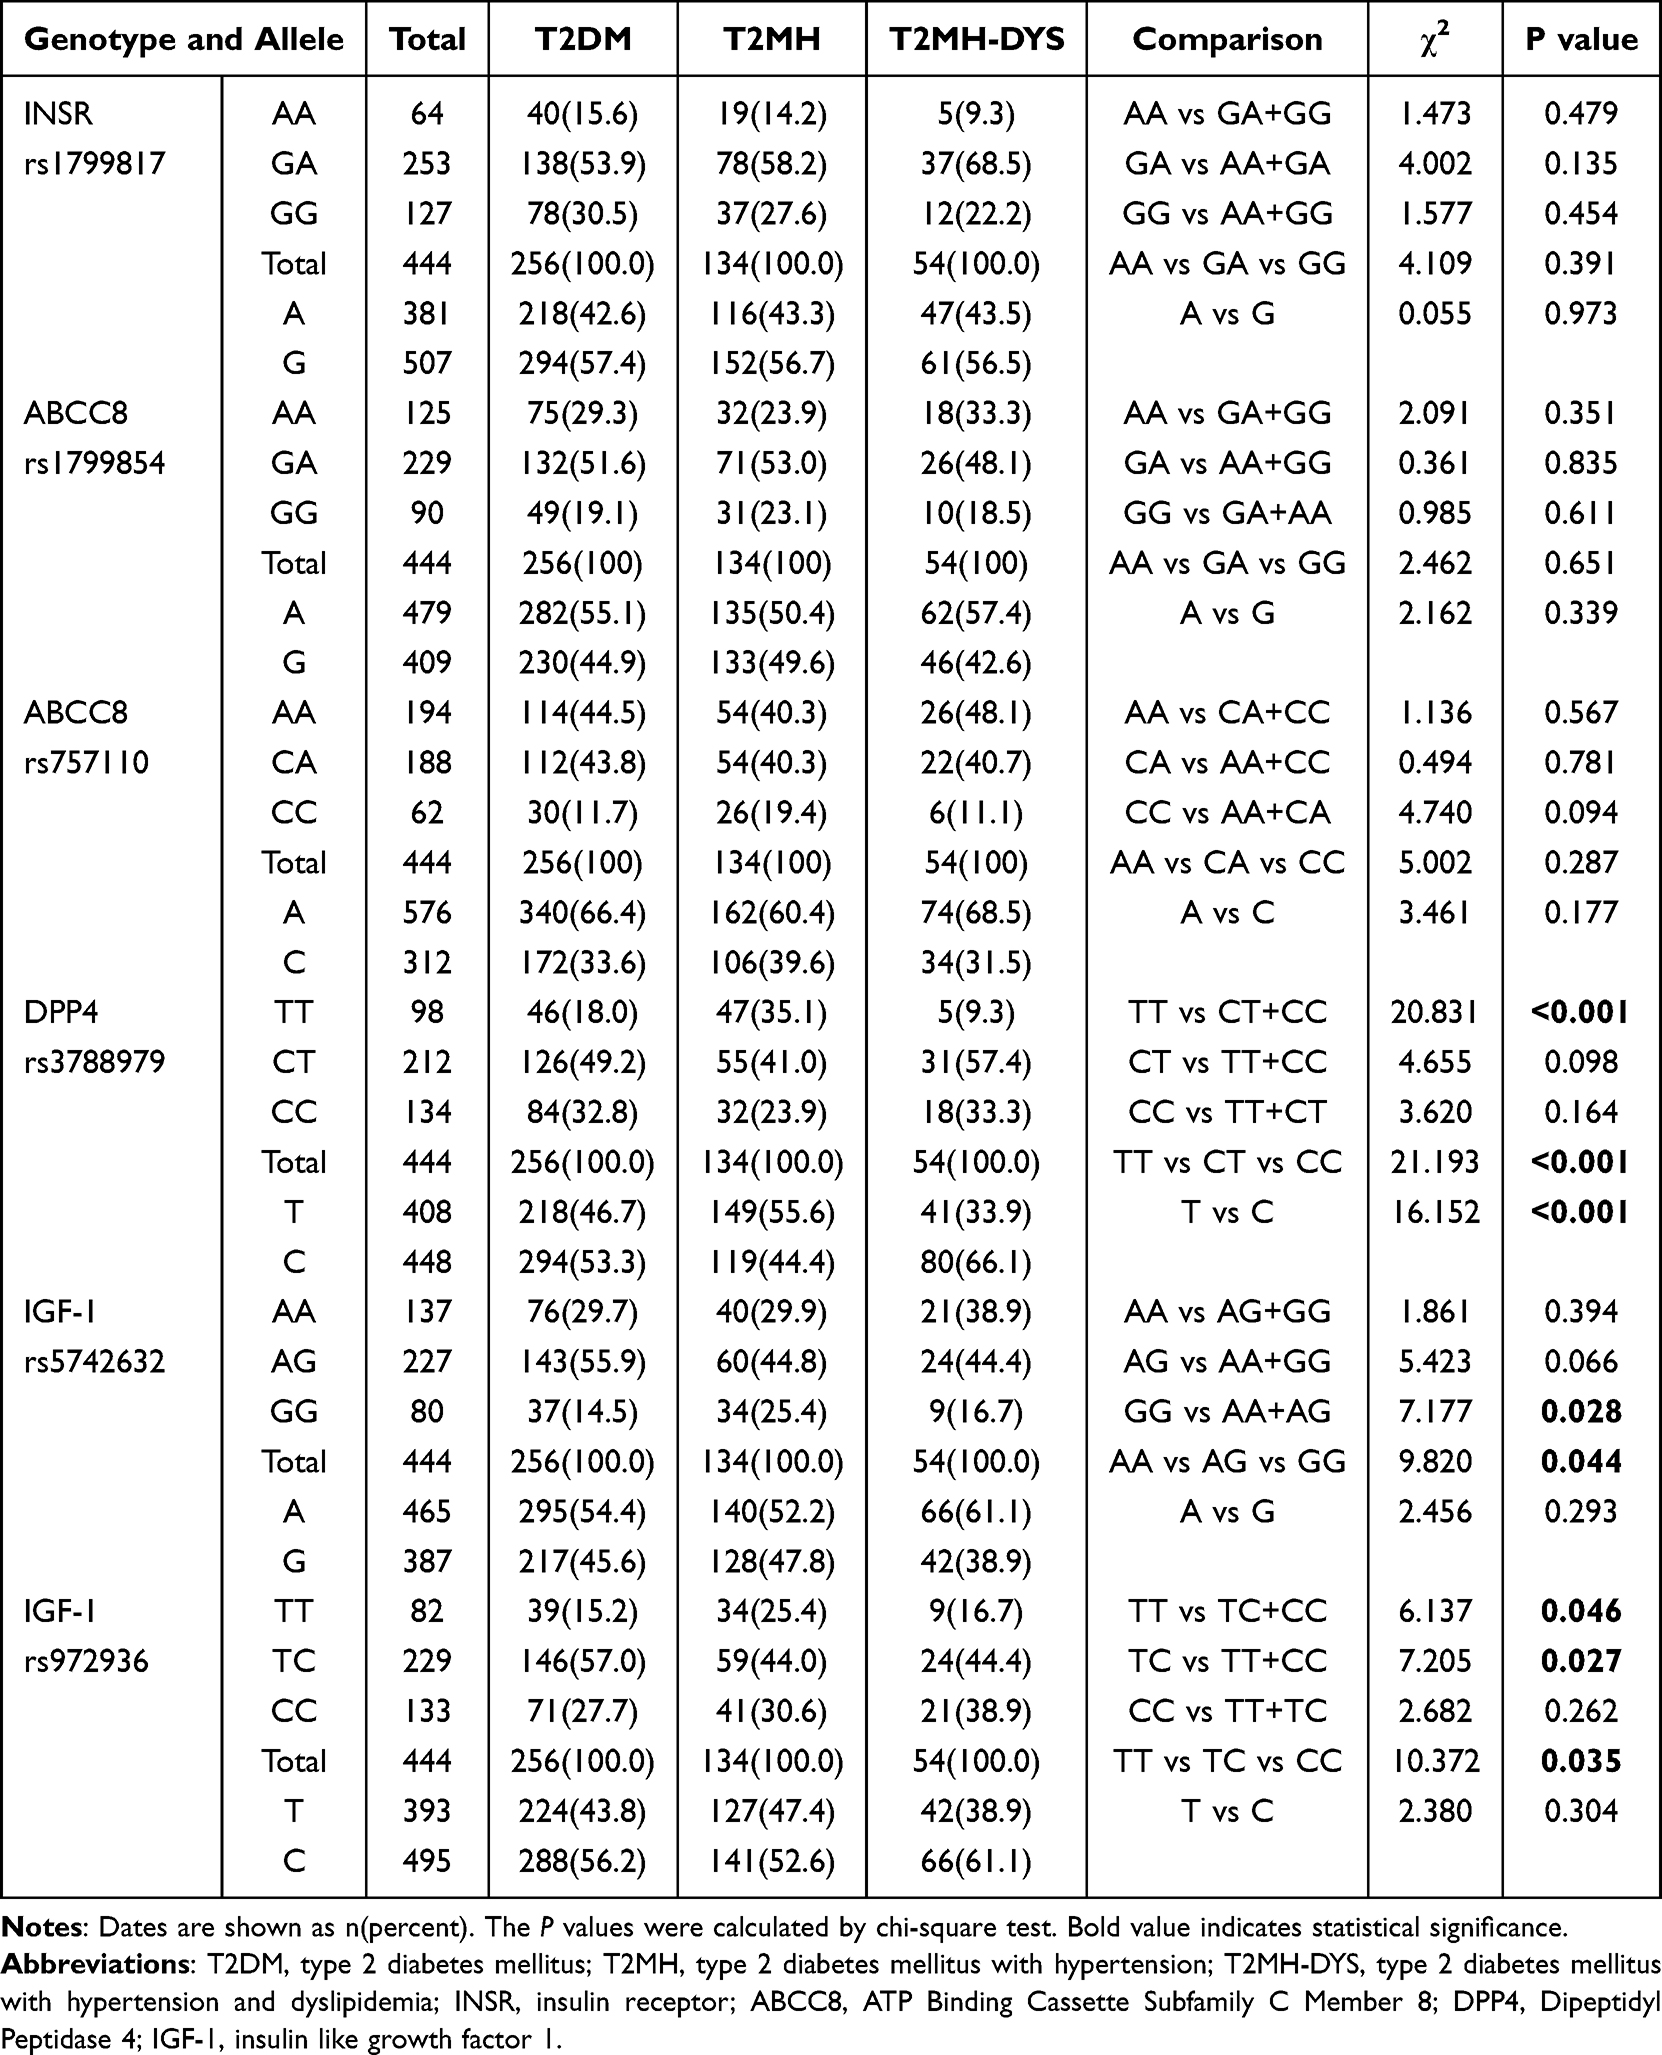 |
Table 2 Genotype Distributions of DPP4 Related Polymorphisms in T2DM, T2MH, and T2MH-DYS Groups |
T2DM vs T2MH: Hypertension-Linked Associations within the DPP4 Axis
Pairwise χ2 comparisons demonstrated significant differences in the DPP4 rs3788979 locus between T2DM and T2MH (TT vs CT vs CC: χ2 = 14.419, P = 0.001; T vs C: χ2 = 11.968, P = 0.001; Table 3). Logistic regression confirmed that, relative to TT homozygotes, both CT (OR = 0.373, 95% CI = 0.210–0.663, P = 0.001) and CC carriers (OR = 0.427, 95% CI = 0.255–0.715, P = 0.001) were associated with lower odds of hypertension, with results persisting after adjustment for age and gender (Figure 1). At the allele level, C allele carriers also had a reduced risk of T2MH (adj OR = 0.593, 95% CI = 0.440–0.799, P = 0.001). For IGF1 rs972936, χ2 testing revealed significant contrasts (TT vs TC+CC: χ2 = 5.943, P = 0.015; TC vs TT+CC: χ2 = 5.963, P = 0.015; TT vs TC vs CC: χ2 = 7.910, P = 0.019), and logistic regression indicated a protective effect of the TC genotype (OR = 0.464, 95% CI = 0.267–0.804, P = 0.006), stable after adjustment. For IGF1 rs5742632, although χ2 analyses suggested an excess of GG genotypes in T2MH (GG vs AA+AG: χ2 = 7.044, P = 0.008; overall χ2 = 7.838, P = 0.020), logistic regression only showed a non-significant trend toward increased risk (adjusted OR = 1.769, 95% CI = 0.966–3.240, P = 0.065). No significant associations were detected for INSR rs1799817 or ABCC8 rs1799854/rs757110.
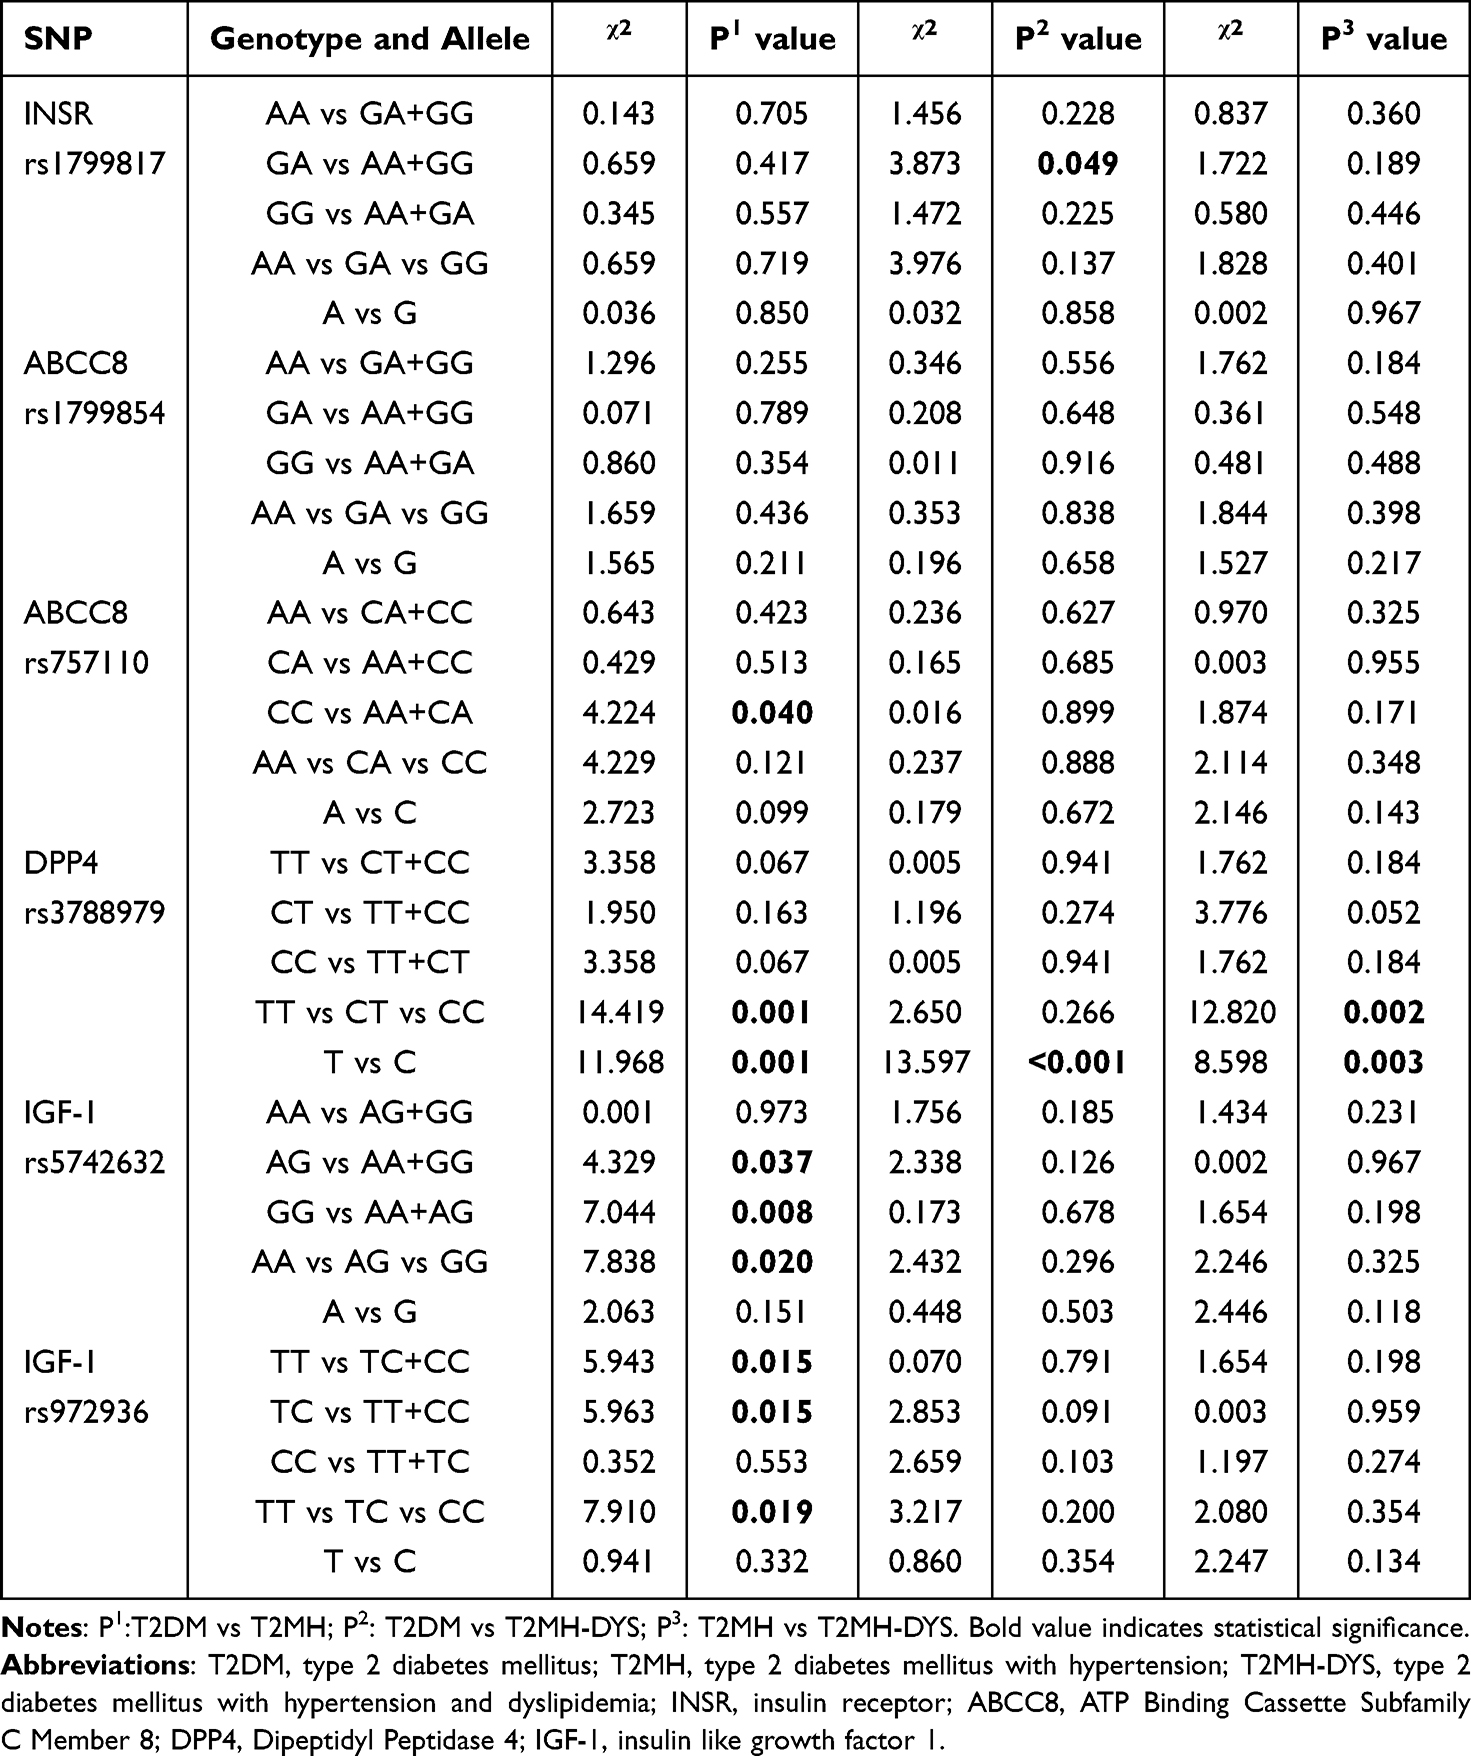 |
Table 3 Pairwise Comparisons of Significantly Associated DPP4–ABCC8–INSR–IGF1 Axis Gene Polymorphisms |
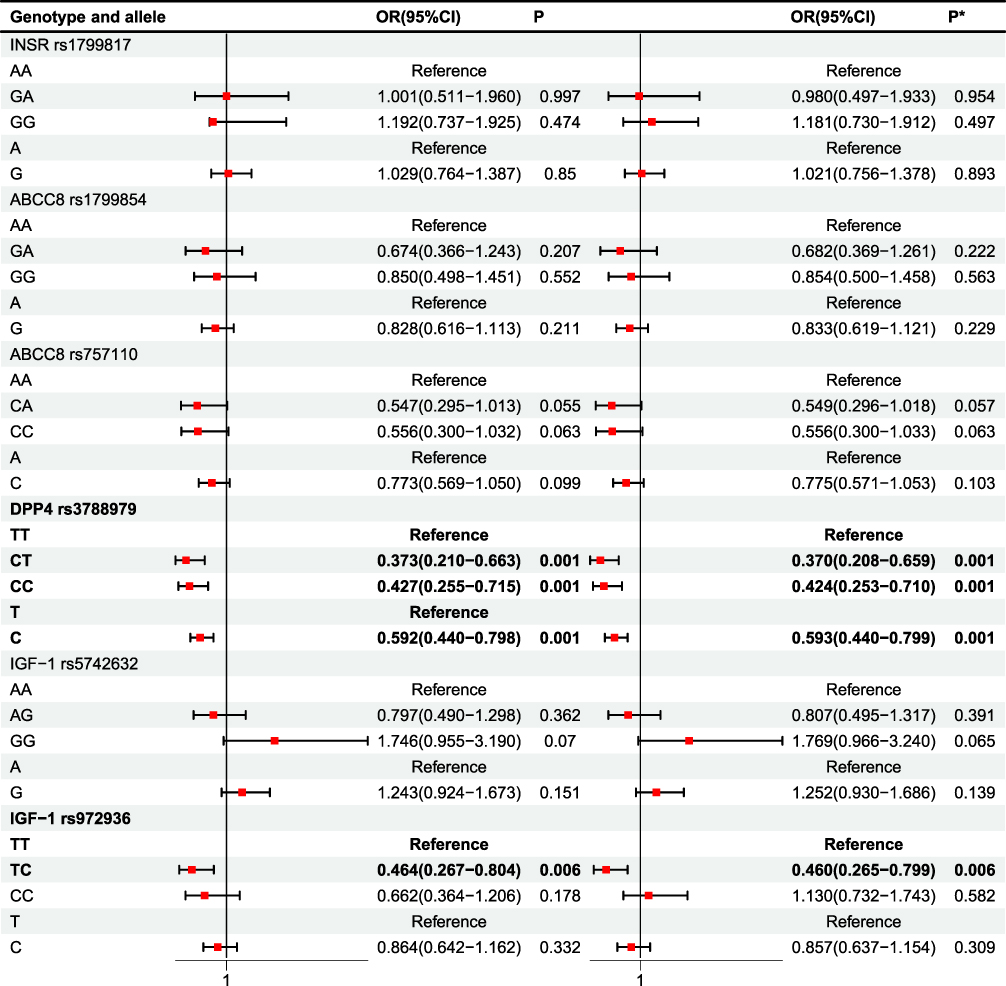 |
Figure 1 Analysis of regression (T2DM vs T2MH). P* value was adjusted by age, gender. Bold value indicates statistical significance. |
T2DM vs T2MH-DYS: Convergence of Hypertension and Dyslipidaemia within the DPP4 Axis
In the comparison between T2DM and T2MH-DYS, DPP4 rs3788979 showed robust allelic divergence (Table 3 and Figure 2). χ2 analysis confirmed significance (T vs C: χ2 = 13.597, P < 0.001), and logistic regression demonstrated that the C allele was overrepresented in T2MH-DYS, conferring higher odds relative to T2DM (OR = 2.204, 95% CI = 1.439–3.375, P < 0.001), consistent after adjustment. At the genotype level, no models retained significance in regression analysis despite nominal χ2 signals. For IGF1 rs5742632 and rs972936, χ2 analyses did not reveal strong differences (all P > 0.05), and regression models were similarly non-significant. INSR rs1799817 and ABCC8 rs1799854/rs757110 likewise showed no evidence of association.
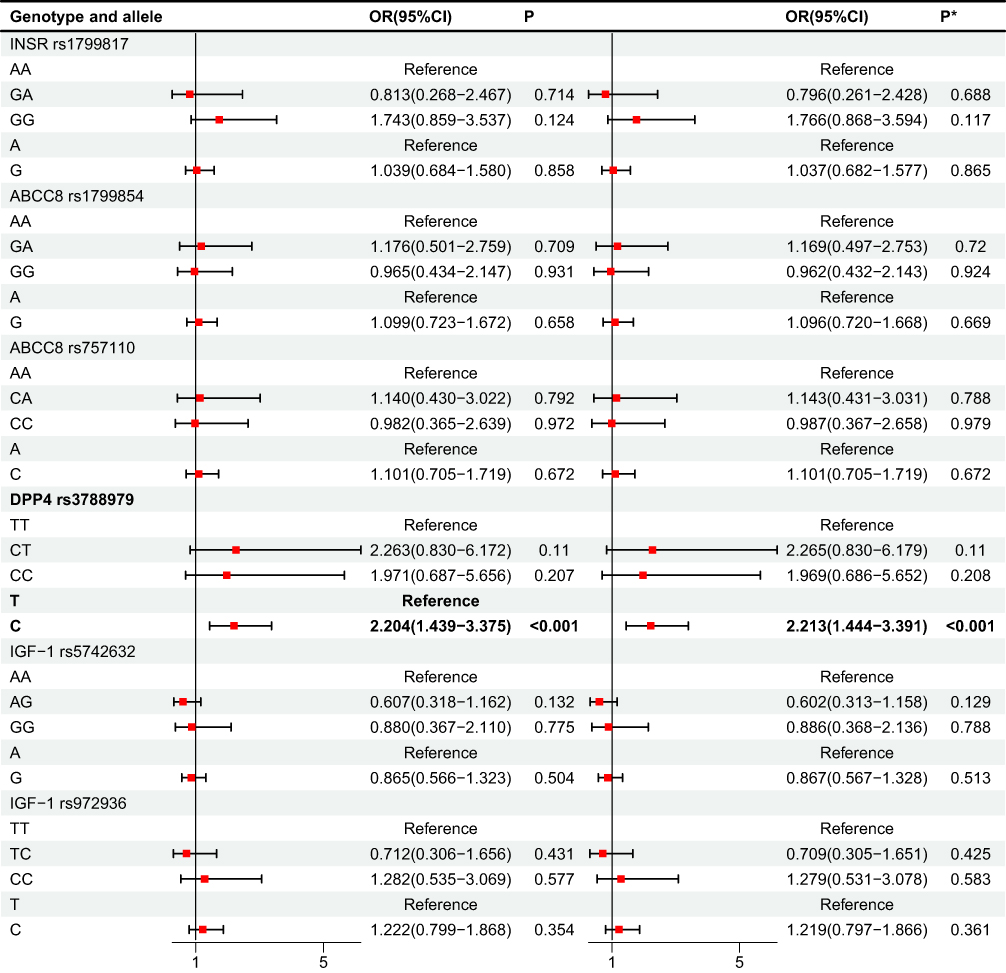 |
Figure 2 Analysis of regression (T2DM vs T2MH-DYS). P* value was adjusted by age, gender. Bold value indicates statistical significance. |
T2MH vs T2MH-DYS: Stratification within Hypertensive Diabetes
Among patients with hypertension, further stratification by dyslipidaemia status revealed striking genotype-specific differences at DPP4 rs3788979 (Table 3 and Figure 3). χ2 testing identified significant overall distributional shifts (TT vs CT vs CC: χ2 = 12.820, P = 0.002; T vs C: χ2 = 8.598, P = 0.003). Logistic regression indicated that, compared with TT homozygotes, both CT (OR = 5.289, 95% CI = 1.907–14.717, P = 0.001; adjusted OR = 5.418, P = 0.001) and CC carriers (OR = 5.287, 95% CI = 1.782–15.693, P = 0.003; adjusted OR = 5.620, P = 0.002) were associated with markedly increased odds of belonging to the T2MH subgroup rather than T2MH-DYS. Allele analysis confirmed that the C allele was also beneficial for the occurrence of T2MH-DYS (odds ratio = 1.968, 95% confidence interval = 1.247–3.104, P = 0.004; adjusted odds ratio = 1.967, 95% confidence interval = 1.246–3.104, P = 0.004), indicating that the C allele was relatively enriched in T2MH-DYS. No significant associations were detected for IGF1 rs5742632/rs972936, INSR rs1799817, or ABCC8 rs1799854/rs757110 in this within-hypertension comparison.
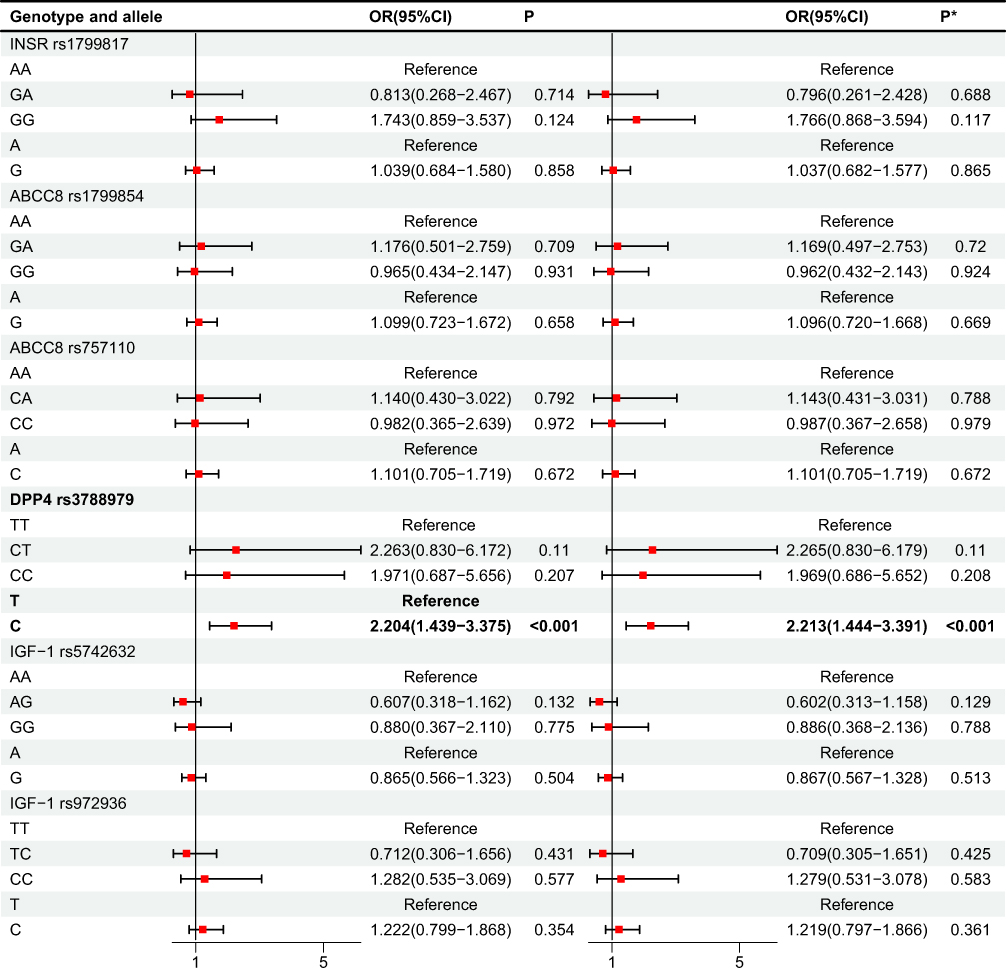 |
Figure 3 Analysis of regression (T2MH vs T2MH-DYS). P* value was adjusted by age, gender. Bold value indicates statistical significance. |
Lipid Profiles Stratified by DPP4 rs3788979 Genotype
To elucidate the metabolic phenotype associated with the DPP4 rs3788979 risk allele, we stratified the lipid profiles by genotype and clinical subgroup. The results demonstrated that serum triglyceride (TG) levels were significantly higher in the T2MH-DYS group than in both the T2DM and T2MH groups, regardless of whether individuals carried the CC, CT, or TT genotype (all P < 0.05, Figure 4A–C). However, no significant differences were observed for other lipid parameters across genotype subgroups. These findings indicate that the dyslipidemia risk conferred by the DPP4 rs3788979 C allele is manifested primarily as significantly elevated TG levels in the presence of concomitant hypertension, rather than a comprehensive alteration of the lipid profile.
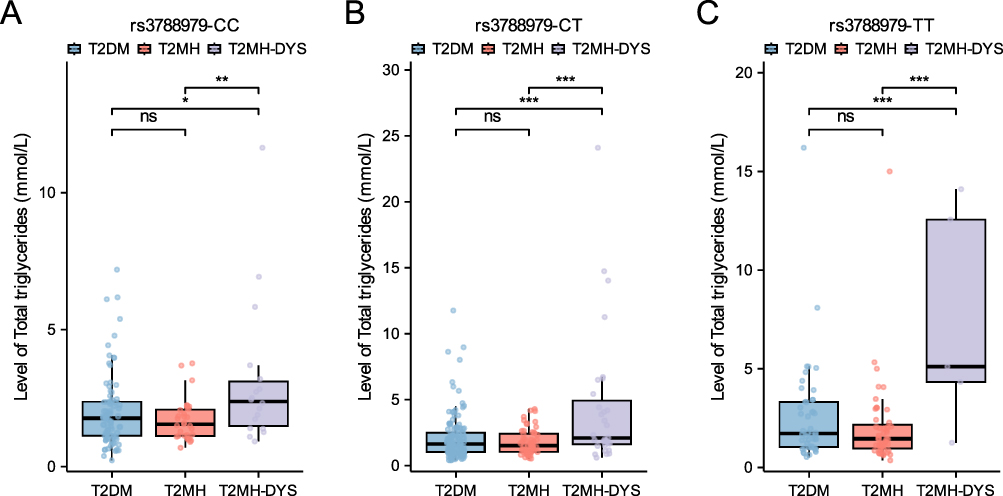 |
Figure 4 Serum triglyceride levels across clinical subgroups stratified by DPP4 rs3788979 genotype. (A) CC homozygotes, (B) CT heterozygotes, and (C) TT homozygotes. *P < 0.05, **P < 0.01, ***P < 0.001. |
Synergistic Haplotype Effects within the DPP4 Axis
Haplotype analysis of INSR, ABCC8, DPP4, and IGF1 variants was conducted to explore polygenic interactions underlying diabetic comorbidities (Table 4 and Table 5; Supplementary Table 2). In the T2DM vs T2MH comparison, multiple haplotypes showed significant associations with hypertension risk. The GAATGT haplotype was markedly underrepresented in T2MH (3.2% vs 8.8%), indicating a protective effect (OR = 0.312, 95% CI: 0.147–0.661, P = 0.0014). By contrast, AACTAC (OR = 5.925, 95% CI: 1.511–23.233, P = 0.0040) and GGACGT (OR = 4.205, 95% CI: 1.277–13.849, P = 0.0106) were enriched in T2MH. The global haplotype test was highly significant (χ2 = 71.803, P = 4.60 × 10⁻⁸). After Bonferroni correction (α = 0.0025), only GAATGT remained statistically significant, whereas AACTAC and GGACGT exhibited nominal associations. For T2DM vs T2MH-DYS, the haplotypes GACCGT (OR = 4.113, 95% CI: 1.563–10.826, P = 0.0021) and AGCTAC (OR = 4.298, 95% CI: 1.439–12.843, P = 0.0047) were more frequent in T2MH-DYS patients. The global haplotype distribution was significant (χ2 = 59.580, P = 2.39 × 10⁻⁶). Following Bonferroni correction (α = 0.0036), GACCGT retained significance, while AGCTAC did not withstand correction. In the T2MH vs T2MH-DYS contrast, AAACAC was enriched in T2MH-DYS (5.9% vs 0.9%; OR = 6.369, 95% CI: 1.401–28.960, P = 0.0065), whereas GAATGT was less frequent (3.2% vs 11.1%; OR = 0.361, 95% CI: 0.095–1.374, P = 0.0057). Although the global test was significant (χ2 = 73.730, P = 4.43 × 10⁻⁸), neither haplotype remained significant after Bonferroni correction (α = 0.0036), indicating only nominal evidence of association.
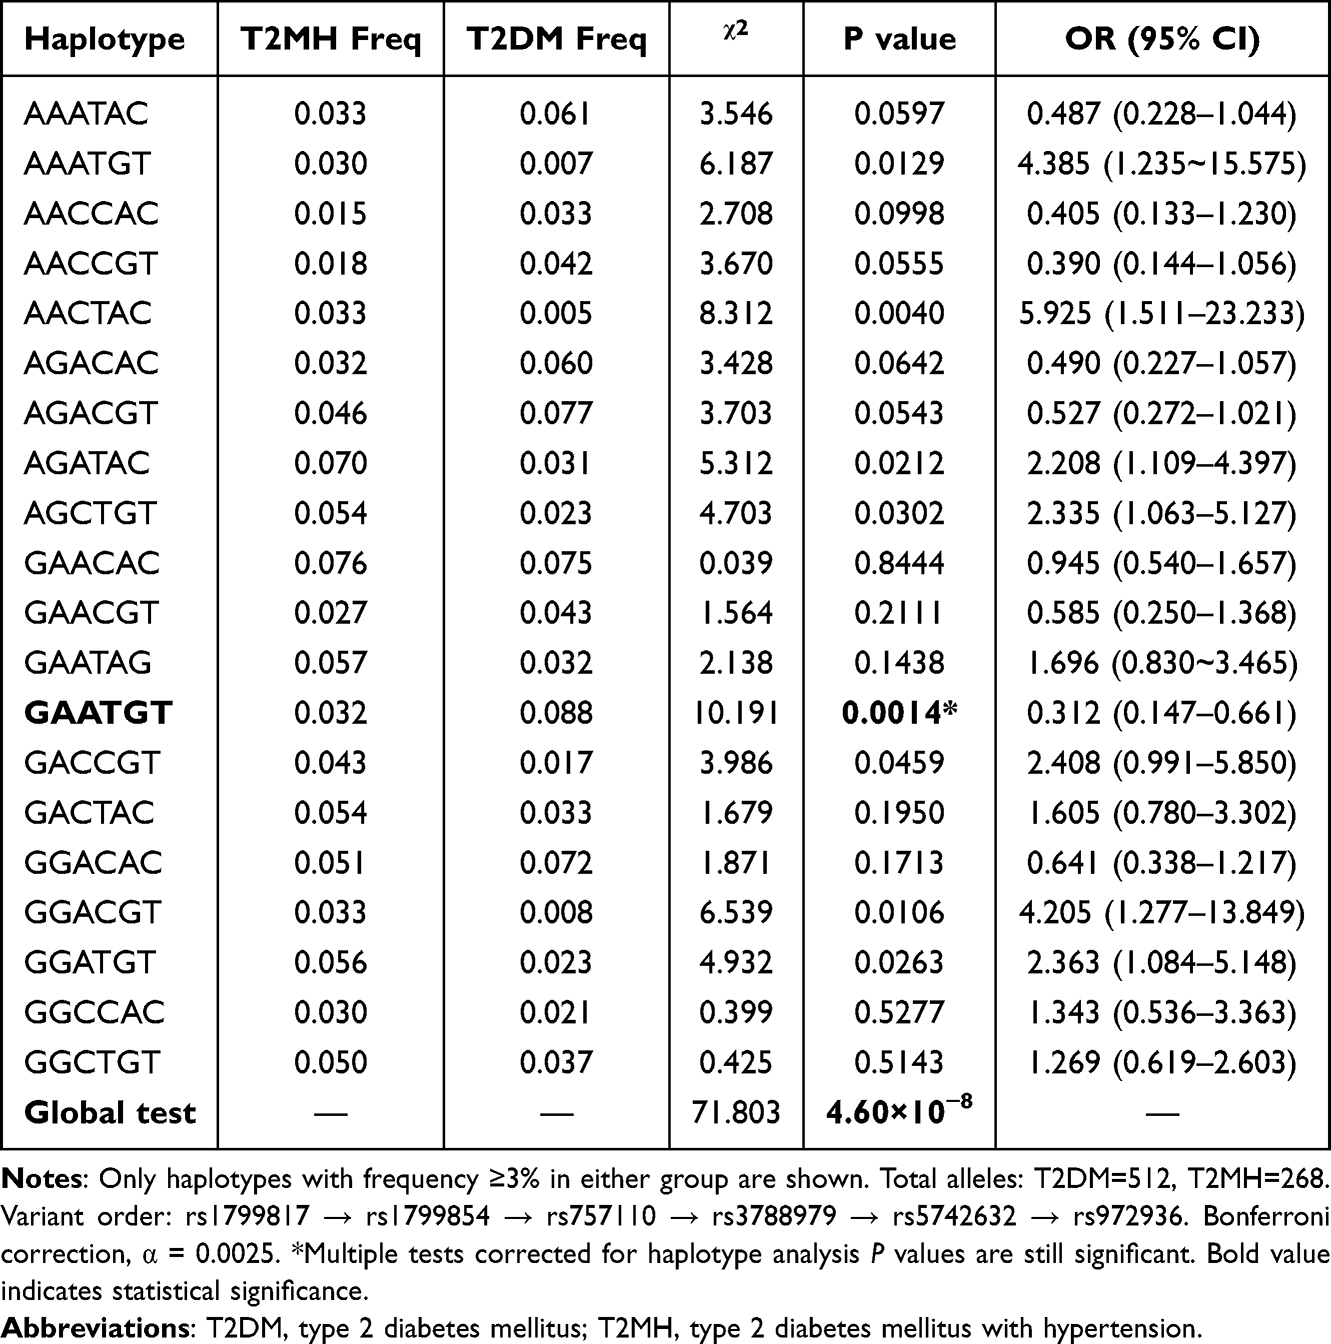 |
Table 4 Haplotype Association Analysis with Global Tests (T2DM vs T2MH) |
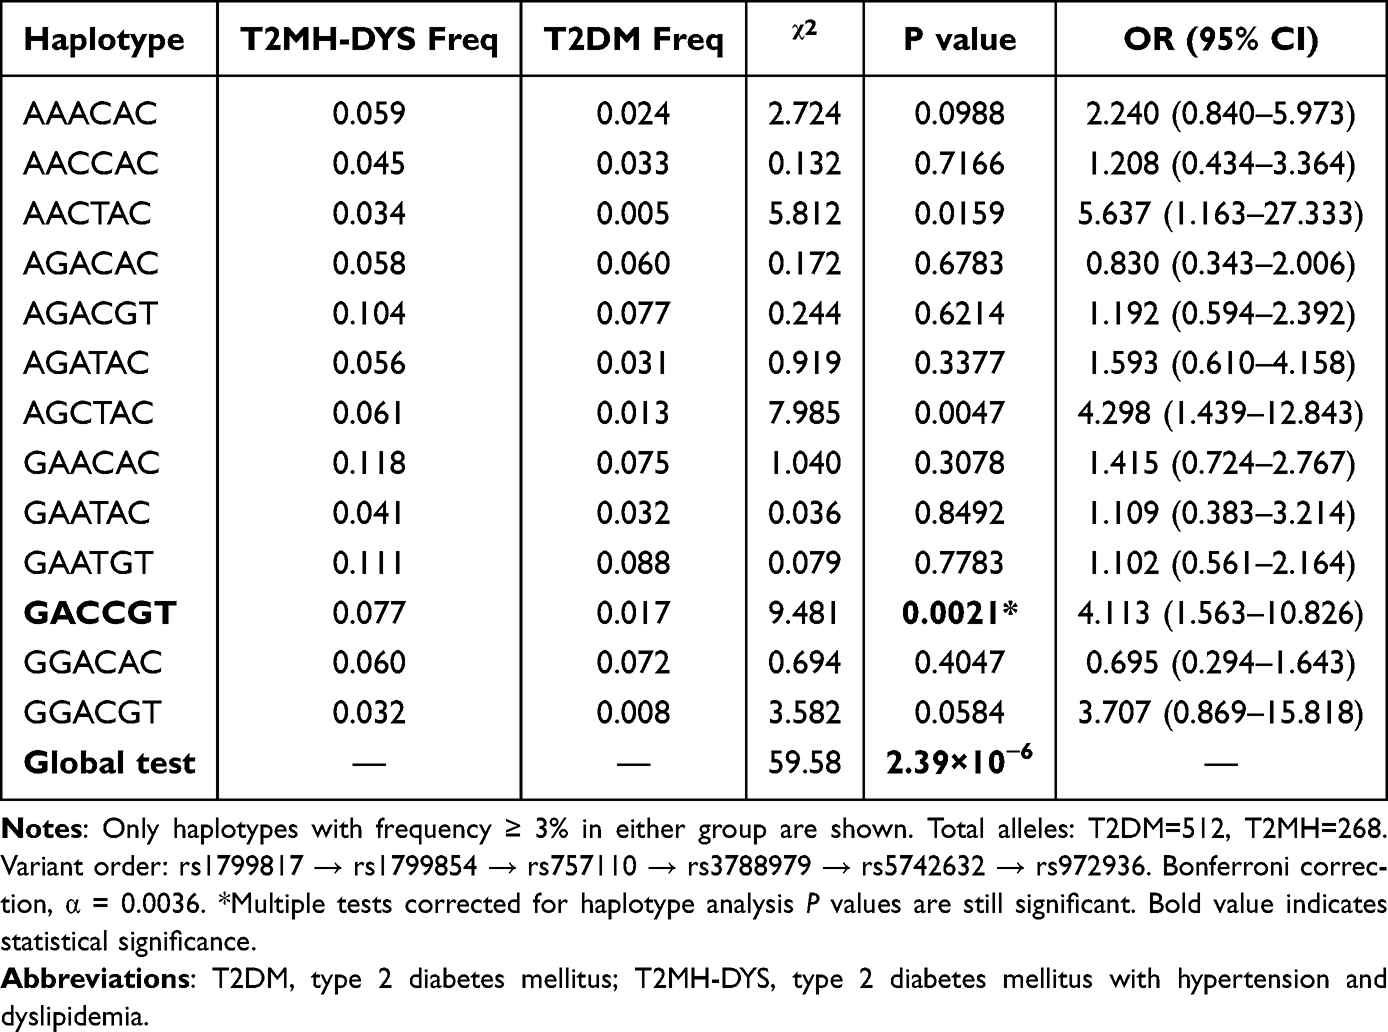 |
Table 5 Haplotype Association Analysis with Global Tests (T2DM vs T2MH-DYS) |
Discussion
In this study, we provide the first evidence that genetic polymorphisms within the DPP4–ABCC8–INSR–IGF1 axis are dynamically associated with the coexistence of HTN and/or DYS in patients with T2DM. Among these, DPP4 rs3788979 displayed a lipid-modulated effect: CT and CC genotypes were protective against hypertension when considered alone, yet shifted to risk alleles in the presence of dyslipidemia. Haplotype-based analysis further revealed distinct combinatorial effects: GAATGT exerted a strong protective influence against hypertension (OR = 0.312, P = 0.0014), whereas GACCGT synergistically increased dyslipidemia risk more than fourfold (OR = 4.113, P = 0.0021). These findings underscore a polygenic cooperative mechanism, where genetic effects are reshaped by metabolic context, transcending the limitations of conventional single-locus studies and establishing a novel composite panel of genetic markers with potential utility for precision prediction of cardiometabolic comorbidities in T2DM.
Beyond the established roles of insulin resistance and chronic low-grade inflammation in driving comorbid HTN and DYS in T2DM, increasing attention has turned to the genetic determinants of the insulin secretion–signaling cascade.18 The DPP4–ABCC8–INSR–IGF1 axis represents a critical pathway that links incretin degradation, β-cell excitability, insulin receptor activation, and insulin sensitivity.38,39 Dysregulation along this axis may therefore create a dual burden of impaired insulin release and attenuated signaling responsiveness, predisposing to cardiometabolic clustering.7,40,41 Systematic investigation of polymorphisms within this axis provides a rational framework for elucidating the molecular underpinnings of T2DM with comorbid HTN and DYS, and for identifying genetic signatures predictive of high-risk phenotypes.
The role of the DPP4 rs3788979 polymorphism in cardiovascular disease has been contentious, with studies reporting both protective14 and risk42,43 associations, underscoring the complexity of its function. To resolve these discrepancies, we investigated its role in the sequential development of cardiometabolic comorbidities within T2DM. Our analysis revealed a critical, context-dependent risk reversal: the CT/CC genotypes were protective against incident hypertension in normolipidemic individuals (T2DM vs T2MH) but became risk factors for dyslipidemia in T2MH patients, as triglyceride (TG) levels were highest in the T2MH-DYS group across all genotypes—a finding corroborated by Xing44—indicating that the risk conferred by the C allele is specifically manifested through elevated TG. We hypothesize that a plausible, though currently speculative, mechanism for this risk transition could involve tissue-specific DPP-4 activity,15,45 potentially amplified by the pro-inflammatory microenvironment of hypertension. We hypothesize that the C allele may promote heightened DPP-4 activity in key tissues like the vascular endothelium and adipose tissue, an effect not fully captured by systemic levels. In the setting of hypertension, this genetically primed, elevated local activity could be exacerbated, leading to intensified degradation of GLP-1, impaired clearance of TG-rich lipoproteins, and aggravated endothelial insulin resistance, thereby shifting the allele’s net effect from systemic protection to localized pro-dyslipidemic action.46,47 This proposed mechanism remains a hypothesis requiring direct experimental validation.
Similarly, while genetic investigations of IGF1 have predominantly focused on susceptibility to T2DM itself, evidence regarding its role in cardiometabolic complications is emerging yet less consolidated. For instance, the IGF1 rs5742632 polymorphism has been linked to an increased risk of retinopathy in Pakistani T2DM patients,26 whereas rs972936 was not associated with mild cognitive impairment in a Chinese cohort,48 highlighting the pleiotropic and context-dependent nature of this gene. Extending this narrative to cardiometabolic comorbidities, our analysis revealed that the TC genotype of IGF1 rs972936 exerted a significant protective effect against hypertension (adjusted OR = 0.464, P = 0.006). In contrast, the GG genotype of rs5742632 showed only a non-significant trend toward increased risk (adjusted OR = 1.769, P = 0.065). These findings suggest that IGF1 variants, particularly rs972936, contribute to the genetic architecture of hypertension risk in T2DM, possibly by modulating insulin-like growth factor signaling pathways that influence vascular function and metabolic homeostasis. The weaker association of rs5742632 underscores the complexity of these relationships. Collectively, the associations uncovered within both DPP4 and IGF1 reinforce the concept that the entire “incretin-secretion-signaling-sensitivity” axis represents a concerted genetic determinant shaping the clinical heterogeneity of T2DM. Haplotype analysis, which captures the combined effect of alleles co-inherited on the same chromosome, often provides greater power than single-locus analysis for detecting associations with complex diseases, as it more accurately reflects genomic architecture and linkage disequilibrium patterns.49,50 Our study identified several key haplotypes within the DPP4 axis that exert synergistic effects on cardiometabolic comorbidity risk. Most notably, the GAATGT haplotype demonstrated a potent protective effect against hypertension, reducing the odds by nearly 70% (OR = 0.312, P = 0.0014) in T2DM patients. Conversely, the GACCGT haplotype emerged as a major risk factor, increasing the susceptibility to dyslipidemia by over fourfold (OR = 4.113, P = 0.0021). The identification of these haplotypes, which remained significant after stringent Bonferroni correction, underscores a polygenic cooperative mechanism where the combined allelic status across the INSR-ABCC8-DPP4-IGF1 pathway dictates clinical outcomes. The effect sizes of these haplotype blocks exceeded those observed for individual SNPs, strongly supporting the cumulative genetic burden theory in complex trait etiology. This coordinated polygenic interaction not only reframes the genetic architecture of cardiometabolic clustering in T2DM but also mechanistically pinpoints these specific haplotype combinations as strategic nodes within the “incretin-secretion-signaling-sensitivity” axis. Precise targeting of these synergistic functional modules may pave the way for therapeutic breakthroughs in disrupting the progression cascade of diabetic complications. Such a tool may help stratify T2DM patients at diagnosis for more vigilant monitoring or early, targeted interventions to prevent hypertension and dyslipidemia.
Several limitations of this study warrant acknowledged. First, its single-center, cross-sectional design precludes causal inference. Second, the modest size of the T2MH-DYS subgroup may affect the precision and stability of some odds ratio estimates, necessitating caution in their interpretation. These results should be validated in larger, multi-center, prospective cohorts Third, the lack of comprehensive data on potential confounders such as body mass index, detailed medication history (especially DPP4 inhibitors), diabetes duration, and lifestyle factors limits our ability to fully adjust for residual confounding; these factors may interact with genetic susceptibility and should be prioritized in future prospective studies.
Conclusion
Variants within the DPP4 axis influence susceptibility to HTN and DYS in T2DM, with GAATGT and GACCGT emerging as robust haplotype markers. These findings highlight polygenic mechanisms underlying cardiometabolic clustering and may guide precision management.
Abbreviations
ABCC8, ATP Binding Cassette Subfamily C Member 8; ACTH, Adrenocorticotropic Hormone; ADA, American Diabetes Association; AHA, American Heart Association; ALD, Aldosterone; Ang II, Angiotensin II; Cr, Plasma creatinine; CRP, C-Reactive Protein; CV, Coefficients of variation; DPP4, Dipeptidyl Peptidase 4; DBP, Diastolic Blood Pressure; DYS, Dyslipidemia; FFAs, Free Fatty Acids; FPG, Fasting Plasma Glucose; GAD65, Glutamic Acid Decarboxylase 65; GSIS, Glucose-Stimulated Insulin Secretion; GLP-1, Glucagon-Likepeptide-1; GIP, Gastric Inhibitory Polypeptide; HbA1c, Glycated Hemoglobin; HDL-C, High-Density Lipoprotein Cholesterol; HTN, Hypertension; IAA, Insulin Autoantibodies; INSR, Insulin Receptor; IGF1, Insulin Like Growth Factor 1; LDL-C, Low-Density Lipoprotein Cholesterol; M:F, Male to Female Ratio; MAF, Minor Allele Frequency; Ren, Renin; SBP, Systolic Blood Pressure; SNPs, Single Nucleotide Polymorphisms; T1DM, Type 1 Diabetes Mellitus; T2DM, Type 2 Diabetes Mellitus; T2MH, Type 2 Diabetes Mellitus patients with Hypertension; T2MH-DYS, Type 2 Diabetes Mellitus patients with comorbid Hypertension and dyslipidemia; TC, Total Cholesterol; TG, Triglycerides; Urea, Plasma urea.
Data Sharing Statement
All data associated with this study are available in the main text or the supplementary materials. The original data analyzed in this study are available from the corresponding author upon reasonable request.
Ethics Approval and Consent to Participate
According to the relevant regulations in the field of biomedical research in China, all protocols of this study were approved by the Clinical Research Ethics Committee of the First Affiliated Hospital of Guilin Medical University (No. 2023QTLL-37). The study was conducted after the Declaration of Helsinki. Informed consent was obtained from all subjects involved in the study. Prior to signing the informed consent, all participants were informed of the procedure and purpose of the study. In addition, patient data confidentiality and privacy are protected in accordance with the provisions of the law.
Acknowledgments
The author of this article expresses gratitude for the collaborative efforts and contributions made by all members involved. This study was supported by Medical Science Public Platform of Shenzhen Campus, Sun Yat-sen University and Core Facilities for Medical Science, School of Medicine, Shenzhen Campus of Sun Yat-sen University.
Author Contributions
Q.X.: Conceptualization, Supervision, Writing – Review & Editing;
N.Z.: Conceptualization, Supervision, Writing – Review & Editing;
Y.Q.: Resources, Data curation, Writing – Review & Editing;
S.W.: Methodology, Investigation, Validation, Writing – Original Draft;
C.Z.: Methodology, Investigation, Visualization, Writing – Original Draft;
C.B.: Formal Analysis, Resources, Writing – original draft;
Q.C.: Formal Analysis, Resources, Writing – original draft.
All authors gave final approval of the version to be published; have agreed on the journal to which the article has been submitted; and agree to be accountable for all aspects of the work.
Funding
This work was supported by the general program of Guangdong Natural Science Foundation (Grant No. 2023A1515010191and 2025A1515012691), the general program of Guangxi Natural Science Foundation (Grant No. 2025GXNSFHA069198) and Guangxi medical and health appropriate technology development and application project (Grant No. S2024041), the Shenzhen Basic Research General Program (Grant No. JCYJ20230807111100001 and JCYJ20250604175600002).
Disclosure
The authors declare no conflict of interest.
References
1. Khan MAB, Hashim MJ, King JK, et al. Epidemiology of type 2 diabetes - global burden of disease and forecasted trends. J Epidemiol Glob Health. 2020;10(1):107–111. doi:10.2991/jegh.k.191028.001
2. Taheri A, Khezri R, Dehghan A, et al. Hypertension among persons with type 2 diabetes and its related demographic, socioeconomic and lifestyle factors in the Fasa cohort study. Sci Rep. 2024;14(1):18892. doi:10.1038/s41598-024-69062-7
3. Ji Q, Chai S, Zhang R, et al. Prevalence and co-prevalence of comorbidities among Chinese adult patients with type 2 diabetes mellitus: a cross-sectional, multicenter, retrospective, observational study based on 3B study database. Front Endocrinol. 2024;15:1362433. doi:10.3389/fendo.2024.1362433
4. Jia G, Sowers JR. Hypertension in diabetes: an update of basic mechanisms and clinical disease. Hypertension. 2021;78(5):1197–1205. doi:10.1161/HYPERTENSIONAHA.121.17981
5. Yen F-S, Wei J-C-C, Chiu L-T, et al. Diabetes, hypertension, and cardiovascular disease development. J Transl Med. 2022;20(1):9. doi:10.1186/s12967-021-03217-2
6. Galicia-Garcia U, Benito-Vicente A, Jebari S, et al. Pathophysiology of type 2 diabetes mellitus. Int J Mol Sci. 2020;21(17):6275. doi:10.3390/ijms21176275
7. Zhong J, Maiseyeu A, Davis SN, et al. DPP4 in cardiometabolic disease: recent insights from the laboratory and clinical trials of DPP4 inhibition. Circ Res. 2015;116(8):1491–1504. doi:10.1161/CIRCRESAHA.116.305665
8. Nauck MA, Meier JJ. Incretin hormones: their role in health and disease. Diabetes Obes Metab. 2018;20 Suppl 1(S1):5–21. doi:10.1111/dom.13129
9. De Franco E, Saint-Martin C, Brusgaard K, et al. Update of variants identified in the pancreatic β-cell KATP channel genes KCNJ11 and ABCC8 in individuals with congenital hyperinsulinism and diabetes. Hum Mutat. 2020;41(5):884–905. doi:10.1002/humu.23995
10. ElSheikh A, Shyng S-L. KATP channel mutations in congenital hyperinsulinism: progress and challenges towards mechanism-based therapies. Front Endocrinol. 2023;14:1161117. doi:10.3389/fendo.2023.1161117
11. Yunn N-O, Kim J, Ryu SH, et al. A stepwise activation model for the insulin receptor. Exp Mol Med. 2023;55(10):2147–2161. doi:10.1038/s12276-023-01101-1
12. Huang X, Liu G, Guo J, et al. The PI3K/AKT pathway in obesity and type 2 diabetes. Int J Biol Sci. 2018;14(11):1483–1496. doi:10.7150/ijbs.27173
13. Larsson SC, Michaëlsson K, Burgess S. IGF-1 and cardiometabolic diseases: a Mendelian randomisation study. Diabetologia. 2020;63(9):1775–1782. doi:10.1007/s00125-020-05190-9
14. Wang Z, Liu Y, Wang W, et al. Association of dipeptidyl peptidase IV polymorphism, serum lipid profile, and coronary artery stenosis in patients with coronary artery disease and type 2 diabetes. Medicine. 2021;100(13):e25209. doi:10.1097/MD.0000000000025209
15. Ahmed RH, Huri HZ, Al-Hamodi Z, et al. Association of DPP4 gene polymorphisms with type 2 diabetes mellitus in Malaysian subjects. PLoS One. 2016;11(4):e0154369. doi:10.1371/journal.pone.0154369
16. Vargas-Alarcón G, González-Salazar MDC, Hernández-Díaz Couder A, et al. Association of the rs17574 DPP4 polymorphism with premature coronary artery disease in diabetic patients: results from the cohort of the GEA Mexican study. Diagnostics. 2022;12(7). doi:10.3390/diagnostics12071716
17. Zhou X, Chen C, Yin D, et al. A variation in the ABCC8 gene is associated with type 2 diabetes mellitus and repaglinide efficacy in chinese type 2 diabetes mellitus patients. Intern Med. 2019;58(16):2341–2347. doi:10.2169/internalmedicine.2133-18
18. Haghvirdizadeh P, Sadat Haerian M, Haghvirdizadeh P, et al. ABCC8 genetic variants and risk of diabetes mellitus. Gene. 2014;545(2):198–204. doi:10.1016/j.gene.2014.04.040
19. Shaalan SH, Khudhair M, Mohammed NI, et al. ABCC8 polymorphisms rs757110 and rs1801261 association with sulfonylurea therapy of Iraqi type 2 diabetics. Wiad Lek. 2024;77(11):2317–2325. doi:10.36740/WLek/193434
20. Alp E, Doguizi S, Mutlu Icduygu F, et al. An analysis of the relationship between ABCC8 and KCNJ11 gene polymorphisms and diabetic retinopathy in Turkish population. Ophthalmic Genet. 2024;45(2):126–132. doi:10.1080/13816810.2024.2317279
21. Bakhtiyari A, Haghani K, Bakhtiyari S, et al. Association between ABCC8 Ala1369Ser polymorphism (rs757110 T/G) and type 2 diabetes risk in an Iranian population: a case-control study. Endocr Metab Immune Disord Drug Targets. 2021;21(3):441–447. doi:10.2174/1871530320666200713091827
22. Tran NQ, Truong SD, Ma PT, et al. Association of KCNJ11 and ABCC8 single-nucleotide polymorphisms with type 2 diabetes mellitus in a Kinh Vietnamese population. Medicine. 2022;101(46):e31653. doi:10.1097/MD.0000000000031653
23. Gonen MS, Arikoglu H, Erkoc Kaya D, et al. Effects of single nucleotide polymorphisms in K(ATP) channel genes on type 2 diabetes in a Turkish population. Arch Med Res. 2012;43(4):317–323. doi:10.1016/j.arcmed.2012.06.001
24. Sokolova EA, Bondar IA, Shabelnikova OY, et al. Replication of KCNJ11 (p.E23K) and ABCC8 (p.S1369A) association in Russian diabetes mellitus 2 type cohort and meta-analysis. PLoS One. 2015;10(5):e0124662. doi:10.1371/journal.pone.0124662
25. Ouederni TB, Fadiel A, Stambouli N, et al. Influence of socioeconomic lifestyle factors and genetic polymorphism on type 2 diabetes occurrences among Tunisian Arab and Berber groups of Djerba Island. Pharmgenomics Pers Med. 2009;2:49–57. doi:10.2147/pgpm.s5850
26. Khan N, Paterson AD, Roshandel D, et al. Association of IGF1 and VEGFA polymorphisms with diabetic retinopathy in Pakistani population. Acta Diabetol. 2020;57(2):237–245. doi:10.1007/s00592-019-01407-5
27. Zhang J, Chen X, Zhang L, et al. IGF1 gene polymorphisms associated with diabetic retinopathy risk in Chinese Han population. Oncotarget. 2017;8(50):88034–88042. doi:10.18632/oncotarget.21366
28. Wang R, Xu D, Liu R, et al. Microsatellite and single nucleotide polymorphisms in the insulin-like growth factor 1 promoter with insulin sensitivity and insulin secretion. Med Sci Monit. 2017;23:3722–3736. doi:10.12659/msm.902956
29. Wang T, Maimaitituersun G, Shi H, et al. The relationship between polymorphism of insulin-like growth factor I gene and susceptibility to type 2 diabetes in Uygur population, Xinjiang, China. Genes Genomics. 2022;44(4):499–508. doi:10.1007/s13258-021-01209-6
30. Song M, Zhao F, Ran L, et al. The Uyghur population and genetic susceptibility to type 2 diabetes: potential role for variants in CDKAL1, JAZF1, and IGF1 genes. OMICS. 2015;19(4):230–237. doi:10.1089/omi.2014.0162
31. ElSayed NA, Aleppo G, Aroda VR, et al. Addendum. 2. Classification and diagnosis of diabetes: standards of care in diabetes-2023. Diabetes Care 2023;46(Suppl. 1):S19-S40. Diabetes Care. 2023;46(9):1715. doi:10.2337/dc23-ad08
32. Sims EK, Bundy BN, Stier K. 2. classification and diagnosis of diabetes: standards of medical care in diabetes-2021. Diabetes Care 2021;44(Suppl. 1):S15-S33. Diabetes Care. 2021;44(9):2182. doi:10.2337/dc21-ad09
33. Lou Y, Ma WJ, Wang ZJ, et al. Writing protocols for the Chinese clinical practice guidelines of hypertension. Zhonghua Xin Xue Guan Bing Za Zhi. 2022;50(7):671–675. doi:10.3760/cma.j.cn112148-20211126-01021
34. James PA, Oparil S, Carter BL, et al. 2014 evidence-based guideline for the management of high blood pressure in adults: report from the panel members appointed to the Eighth Joint National Committee (JNC 8). JAMA. 2014;311(5):507–520. doi:10.1001/jama.2013.284427
35. Hu DY. New guidelines and evidence for the prevention and treatment of dyslipidemia and atherosclerotic cardiovascular disease in China. Zhonghua Xin Xue Guan Bing Za Zhi. 2016;44(10):826–827. doi:10.3760/cma.j.issn.0253-3758.2016.10.002
36. Wilson PW, Abbott RD, Garrison RJ, et al. Estimation of very-low-density lipoprotein cholesterol from data on triglyceride concentration in plasma. Clin Chem. 1981;27(12):2008–2010. doi:10.1093/clinchem/27.12.2008
37. Shi YY, He L. Publisher correction: sHEsis, a powerful software platform for analyses of linkage disequilibrium, haplotype construction, and genetic association at polymorphism loci. Cell Res. 2023. doi:10.1038/s41422-023-00805-3
38. Barchetta I, Cimini FA, Dule S, et al. Dipeptidyl peptidase 4 (DPP4) as A novel adipokine: role in metabolism and fat homeostasis. Biomedicines. 2022;10(9):2306. doi:10.3390/biomedicines10092306
39. Lin C-T, Tang H-Y, Han Y-S, et al. Downregulation of signaling-active IGF-1 by dipeptidyl peptidase IV (DPP-IV). Int J Biomed Sci. 2010;6(4):301–309. doi:10.59566/IJBS.2010.6301
40. Mulvihill EE, Drucker DJ. Pharmacology, physiology, and mechanisms of action of dipeptidyl peptidase-4 inhibitors. Endocr Rev. 2014;35(6):992–1019. doi:10.1210/er.2014-1035
41. Mulvihill EE. Dipeptidyl peptidase inhibitor therapy in type 2 diabetes: control of the incretin axis and regulation of postprandial glucose and lipid metabolism. Peptides. 2018;100:158–164. doi:10.1016/j.peptides.2017.11.023
42. Chiang S-M, Ueng K-C, Yang Y-S. Gender differences in variables associated with dipeptidyl peptidase 4 genetic polymorphisms in coronary artery disease. Adv Clin Exp Med. 2020;29(10):1181–1186. doi:10.17219/acem/126291
43. Aghili N, Devaney JM, Alderman LO, et al. Polymorphisms in dipeptidyl peptidase IV gene are associated with the risk of myocardial infarction in patients with atherosclerosis. Neuropeptides. 2012;46(6):367–371. doi:10.1016/j.npep.2012.10.001
44. Xing X, Han Y, Zhou X, et al. Association between DPP4 gene polymorphism and serum lipid levels in Chinese type 2 diabetes individuals. Neuropeptides. 2016;60:1–6. doi:10.1016/j.npep.2016.08.005
45. Vargas-Alarcón G, Reyes-Barrera J, Cardoso-Saldaña G, et al. DPP4 rs17574 polymorphism and elevated DPP4 levels linked to fatty liver in subclinical atherosclerosis: GEA study findings. Biomol Biomed. 2025;25(9):2139–2147. doi:10.17305/bb.2025.11950
46. Love KM, Liu Z. DPP4 activity, hyperinsulinemia, and atherosclerosis. J Clin Endocrinol Metab. 2021;106(6):1553–1565. doi:10.1210/clinem/dgab078
47. Nistala R, Savin V. Diabetes, hypertension, and chronic kidney disease progression: role of DPP4. Am J Physiol Renal Physiol. 2017;312(4):F661–F670. doi:10.1152/ajprenal.00316.2016
48. Huang R, Wang P, Han J, et al. Decreased serum IGF-1/IGFBP-3 molar ratio is associated with executive function behaviors in type 2 diabetic patients with mild cognitive impairment. J Alzheimers Dis. 2015;47(1):85–94. doi:10.3233/JAD-150071
49. Alves ES, Tonet-Furioso AC, Alves VP, et al. A haplotype in the dipeptidyl peptidase 4 gene impacts glycemic-related traits of Brazilian older adults. Braz J Med Biol Res. 2022;55:e12148. doi:10.1590/1414-431X2022e12148
50. Vargas-Alarcón G, Posadas-Sanchez R, Martínez-Ríos MA, et al. Association of the rs12617656 C/T genetic variant of the DPP4 gene with in-stent restenosis in Mexican population: a cohort study. Arch Cardiol Mex. 2024;95(1):34–41. doi:10.24875/ACM.24000065
 © 2026 The Author(s). This work is published and licensed by Dove Medical Press Limited. The
full terms of this license are available at https://www.dovepress.com/terms
and incorporate the Creative Commons Attribution
- Non Commercial (unported, 4.0) License.
By accessing the work you hereby accept the Terms. Non-commercial uses of the work are permitted
without any further permission from Dove Medical Press Limited, provided the work is properly
attributed. For permission for commercial use of this work, please see paragraphs 4.2 and 5 of our Terms.
© 2026 The Author(s). This work is published and licensed by Dove Medical Press Limited. The
full terms of this license are available at https://www.dovepress.com/terms
and incorporate the Creative Commons Attribution
- Non Commercial (unported, 4.0) License.
By accessing the work you hereby accept the Terms. Non-commercial uses of the work are permitted
without any further permission from Dove Medical Press Limited, provided the work is properly
attributed. For permission for commercial use of this work, please see paragraphs 4.2 and 5 of our Terms.