Back to Journals » Journal of Inflammation Research » Volume 18
Integrative Bulk and Single-Cell Transcriptome Analyses Reveal Mitochondrial Metabolism-Related Biomarkers in IgA Nephropathy with Experimental Validation
Authors Wajid I ![]() , Nie X
, Nie X ![]() , Liu H, Li D
, Liu H, Li D ![]() , Ren Y, Wang Q
, Ren Y, Wang Q
Received 17 September 2025
Accepted for publication 10 November 2025
Published 19 November 2025 Volume 2025:18 Pages 16209—16230
DOI https://doi.org/10.2147/JIR.S565202
Checked for plagiarism Yes
Review by Single anonymous peer review
Peer reviewer comments 4
Editor who approved publication: Dr Wenjian Li
Ibtasam Wajid,1,2,* Xuedan Nie,3,* Hao Liu,2 Dan Li,1 Yeping Ren,2 Qin Wang2
1School of Biomedical Engineering, Shenzhen University Medical School, Shenzhen University, Shenzhen, 518060, People’s Republic of China; 2Department of Nephrology, Shenzhen University General Hospital, Shenzhen University, Shenzhen, Guangdong, 518000, People’s Republic of China; 3Department of Neurology, South China Hospital, Medical School, Shenzhen University, Shenzhen, Guangdong, 518116, People’s Republic of China
*These authors contributed equally to this work
Correspondence: Qin Wang, Department of Nephrology, Shenzhen University General Hospital, Shenzhen University, Shenzhen, Guangdong, 518000, People’s Republic of China, Email [email protected]
Background: Abnormalities in mitochondrial metabolism have been linked to renal disease; however, the precise mechanism underlying its involvement in immunoglobulin A nephropathy (IgAN) remains incompletely elucidated. The objective of this study was to ascertain the impact of biomarkers associated with mitochondrial metabolism on IgAN.
Methods: The data related to IgAN were obtained from public databases. The mitochondrial metabolism-related biomarkers in IgAN were identified through various bioinformatics approaches, including machine learning algorithms and expression validation. Subsequently, enrichment analysis and immune microenvironment analysis were conducted to explore biomarkers’ potential mechanisms in IgAN. Additionally, single-cell RNA sequencing (scRNA-seq) analysis was performed to identify key cell types and clarify the expression dynamics of biomarkers. The expression levels of the biomarkers were validated via reverse transcription quantitative PCR (RT-qPCR).
Results: CYP27B1 and PCK1 were identified as biomarkers for IgAN. Notably, CYP27B1 and PCK1 were commonly enriched in the pathways of “fatty acid metabolism” and “oxidative phosphorylation”. Moreover, CYP27B1 displayed the highest positive correlation with neutrophils, whereas PCK1 exhibited the highest negative correlation with activated NK cells. Besides, scRNA-seq analysis identified proximal tubular cells (PTCs) as the key cell type. The expression of CYP27B1 remained unchanged throughout PTCs’ differentiation, while the expression of PCK1 gradually increased initially and then decreased in the middle to later stages. Moreover, RT-qPCR analysis revealed a significant reduction in the expression levels of CYP27B1 and PCK1 in the IgAN group (P < 0.001), aligning with the predictions obtained from the database.
Conclusion: This study integrated bulk and scRNA-seq analyses to pinpoint CYP27B1 and PCK1 as biomarkers, with PTCs identified as key cells, providing novel diagnostic approaches for IgAN.
Keywords: immunoglobulin A nephropathy, mitochondrial metabolism, biomarkers, single-cell sequencing analysis
Introduction
Immunoglobulin A nephropathy (IgAN), also called Berger’s disease, is recognized as the most common form of primary glomerulonephritis globally, leading to end-stage renal disease (ESRD).1,2 It is estimated that approximately 20% to 40% of patients with IgAN develop ESRD within a 10- to 20-year timeframe after diagnosis.3 The global prevalence of IgAN varies significantly, with relatively modest rates in the US (around 20%), higher in several European countries (20% to 30%), and highest in Asia, with around 40% and up to 54% in China.1 IgAN affects young and middle-aged adults and presents with a range of clinical symptoms, including hypertension, hematuria, proteinuria, and progressive decline in renal function.4
The clinical management of IgAN includes both immunosuppressive and supportive therapies. Glucocorticoids and certain immunosuppressive agents have exhibited efficacy in reducing proteinuria and slowing disease progression; however, their use is often limited by significant adverse effects. According to the 2021 Kidney Disease: Improving Global Outcomes (KDIGO) guidelines, supportive therapy, particularly blood pressure management and the use of angiotensin-converting enzyme inhibitors or angiotensin receptor blockers, remains a fundamental aspect of treatment.2,5 Conventional diagnostic approaches, such as renal biopsy, are considered as gold standard for identifying IgAN. However, renal biopsy, being an invasive method, poses potential risks and complications, limiting its applicability in elderly patients and children.6 These limitations highlight the urgent need for non-invasive biomarkers with high sensitivity and specificity for early diagnosis, monitoring disease progression, and evaluating therapeutic response in IgAN.
Recent studies have highlighted the significant role of mitochondrial metabolism in the pathogenesis of IgAN. Mitochondria are essential for maintaining renal cellular homeostasis, particularly in energy-demanding cells such as podocytes.7 Mitochondria are also responsible for adenosine triphosphate (ATP) production through oxidative phosphorylation, as well as for regulating the redox balance and levels of reactive oxygen species (ROS).8,9 Mitochondrial dysfunction, characterized by impaired electron transport chain (ETC) activity,10,11 cristae structural modifications,12 reduced mitochondrial biogenesis,13 and alteration in cellular metabolism,14 leads to increased oxidative stress in renal cells. Among these abnormalities, ROS leakage, a byproduct of disrupted ETC function, plays a central role in amplifying oxidative stress, leading to podocyte injury and glomerular damage.15 Given the pivotal role of mitochondrial dysfunction in a variety of kidney diseases, research has begun to explore its potential significance in IgAN. Preliminary evidence suggests that mitochondrial DNA copy number in peripheral blood of IgAN patients is associated with renal function and kidney pathology; higher mtDNA copy number corresponds to better renal function and lighter pathological damage, implying that mitochondrial dysfunction may contribute to IgAN progression.16 However, the precise role and mechanisms of dysfunctional mitochondrial metabolism in IgAN is not completely understood. Therefore, a deeper elucidation of the molecular mechanisms underlying mitochondrial metabolic abnormalities in IgAN and their cell-type specific expression patterns is of great importance for developing new diagnostic biomarkers and therapeutic targets.
Advancements in transcriptomic profiling have provided new avenues to explore the molecular basis of kidney diseases, including IgAN.17 Single-cell RNA sequencing (scRNA-seq), enables gene expression analysis at the resolution of individual cells, offering unprecedented insights into cellular heterogeneity, disease-specific pathways, and rare pathogenic cell populations.18,19 By integrating with bulk transcriptome data, scRNA-seq enables researchers to examine disease progression across key dimensions, including cellular composition, molecular characteristics, and functional states. This comprehensive approach supports the facilitation of disease-related cell subsets and their specific markers and facilitates the development of dynamic regulatory networks among different cell types involved in pathogenesis. Thus, such integrative analyses offer promising strategies for improving diagnostic precision and developing targeted therapies.4,20,21
In this study, we leverage transcriptomic data from publicly available IgAN datasets to identify mitochondrial metabolism-associated biomarkers using advanced bioinformatics techniques, such as machine learning algorithms. Additionally, we perform functional enrichment analyses, regulatory network construction, and immune microenvironment profiling to reveal potential molecular mechanisms of these biomarkers in IgAN. Furthermore, this research further identifies key cell types through single-cell analysis and reveals the specific expression of these biomarkers in critical cell types within IgAN, thereby providing a new theoretical basis for the treatment of IgAN.
Materials and Methods
Data Acquisition
The immunoglobulin A nephropathy (IgAN) related datasets utilized in the study, namely GSE93798 (platform: GPL22945), GSE37460 (platform: GPL14663), and GSE171314 (platform: GPL20795), were all acquired from Gene Expression Omnibus (GEO) database (https://www.ncbi.nlm.nih.gov/geo/). The GSE93798 dataset was designated as the training set, which included renal glomerular tissue samples from 20 IgAN patients and 22 healthy controls. To ensure data integrity and minimize heterogeneity, FPKM distribution plots were generated for each sample from the transcriptome data. The GSE37460 dataset served as the validation set, comprising renal glomerular tissue samples from 27 IgAN patients and 9 healthy controls. The single-cell RNA sequencing (scRNA-seq) dataset (GSE171314) encompassed kidney tissue samples from 4 IgAN patients and 1 healthy control. Additionally, 1234 mitochondrial metabolism-related genes (MM-RGs) (Table S1) were extracted from the literature.22
Differential Gene Expression Analysis
The identification of differentially Expressed Genes (DEGs) between IgAN and control groups in GSE93798 was carried out via the limma package (v 3.56.2)23 (|log2 fold change (FC)| > 1, adj.P < 0.05). Additionally, a volcano plot for DEGs was generated utilizing the ggpubr package (v 0.6.0),24 while a heatmap of DEGs was plotted utilizing the Complex Heatmap package (v 2.16.0).25
Identification and Functional Analysis of Candidate Genes
The overlap between DEGs and MM-RGs was analyzed utilizing the VennDiagram package (v 1.7.3)26 to identify genes associated with both IgAN and mitochondrial metabolism. These genes were then designated as candidate genes. Following this, the analysis of the candidate genes’ biological functions was employed utilizing the clusterProfiler package (v 4.10.1),27 which conducted Gene Ontology (GO) and Kyoto Encyclopedia of Genes and Genomes (KEGG) enrichment analyses (adj.P < 0.05). Furthermore, to investigate the interactions between candidate genes at the protein level, the Search Tool for the Retrieval of Interacting Genes (STRING) database (https://www.string-db.org) was performed to construct a protein-protein interaction (PPI) network (confidence = 0.40). The PPI network map was generated utilizing Cytoscape software (v 3.9.2).28
Discernment of Biomarkers Through Machine Learning, Expression Validation, and Receiver Operating Characteristic (ROC) Analysis
Based on candidate genes, 2 distinct machine learning approaches were applied to all samples in GSE93798 to pinpoint feature genes linked to mitochondrial metabolism in IgAN. The least absolute shrinkage and selection operator (LASSO) regression is a data mining method that uses the optimal lambda value to zero out the coefficients of less critical variables, enabling the identification of key variables and the development of an optimal classification model. We employed the glmnet package (v 4.1.8)29 to perform logistic Lasso regression modeling on candidate genes, with nfolds set to 10. When the λ value reached its optimum, the model achieved the lowest error rate, and genes with non-zero regression coefficients were identified as Lasso feature genes. Additionally, the LASSO model was replicated 100 times, and the accuracy was recorded for each simulation. The support vector machine-recursive feature elimination (SVM-RFE) algorithm is employed to iteratively eliminate the least significant features, thereby enhancing the model’s prediction accuracy. The SVM-RFE modeling for the candidate genes was implemented using the e1071 package (v 1.7.16),30 with nfolds similarly set to 10. Following this, the variables corresponding to the selection with the lowest error rate were designated as SVM-RFE feature genes. Thereafter, VennDiagram package (v 1.7.3) was employed to ascertain the overlap between LASSO and SVM-RFE feature genes, thereby facilitating the identification of common feature genes. Furthermore, the Wilcoxon test was employed to analyze the expression patterns of common feature genes between the IgAN and control groups in GSE93798 and GSE37460. The common feature genes with significant inter-group differences (P < 0.05) and consistent expression trends across both GSE93798 and GSE37460 were identified as candidate biomarkers. Moreover, ROC curves for GSE93798 and GSE37460 were generated via pROC package (v 1.18.0),31 and the diagnostic performance of candidate biomarkers for IgAN was assessed by determining the area under the curve (AUC) value. Particularly, candidate biomarkers with AUC values exceeding 0.8 in both GSE93798 and GSE37460 were identified as biomarkers.
Establishment and Assessment of the Nomogram
A nomogram was constructed via the rms package (v 6.8.0)32 to assess the predictive likelihood of biomarkers for the occurrence of IgAN in the GSE93798. In the nomogram, each biomarker was assigned a point value, and a higher cumulative sum indicated a greater risk of IgAN. The accuracy of the nomogram was evaluated by plotting a calibration curve using the rms package (v 6.8.0), and the calibration was evaluated using the Hosmer-Lemeshow (HL) goodness-of-fit test (P > 0.05). Additionally, the rmda software (v 1.6) was used to perform decision curve analysis (DCA) and clinical impact curve (CIC) analysis in order to assess the nomogram’s clinical applicability.33
Tissue/Organ-Specific Gene Expression
The tissue-specific expression profiles of the biomarkers were analyzed using the BioGPS database (http://biogps.org), a publicly accessible gene annotation platform offering extensive expression data spanning various human tissues and organs.
Gene Set Enrichment Analysis (GSEA)
We used gene set enrichment analysis (GSEA) to investigate the functional roles of the discovered biomarkers in the development of IgAN. Using the Hmisc program (v 5.1.3), the Spearman correlation coefficients between each biomarker and every other gene in GSE93798 were first determined. The genes were then ranked in descending order based on these correlations. The reference gene set was the curated KEGG pathway collection (“c2.cp.kegg.v7.0.symbols.gmt”) from the Molecular Signatures Database (MSigDB). After that, GSEA was carried out using the clusterProfiler program (version 4.10.1), and pathways were deemed highly enriched if their adjusted P-value was less than 0.05 and their absolute normalized enrichment score (|NES|) was more than 1.
Immune Microenvironment Analysis
The immune microenvironment in IgAN and control groups was evaluated by quantifying the abundance of 22 immune cell types34 across all samples in GSE93798 via the CIBERSORT algorithm. Additionally, pronounced disparities in the infiltration levels of 22 immune cell types between the IgAN and control groups were assessed via the Wilcoxon test (P < 0.05). Besides, Spearman correlation analysis was performed utilizing the corrplot package (v 0.95) (https://github.com/taiyun/corrplot) to assess associations between biomarkers and differential immune cells, as well as interrelationships among differential immune cells, across all samples in the GSE93798 (|cor| > 0.3, P < 0.05).
Molecular Regulatory Network Construction and Compounds Prediction
The analysis of molecular regulatory networks has advanced the understanding of gene regulatory mechanisms in disease pathogenesis. The miRWalk database (http://mirwalk.umm.uni-heidelberg.de/) as well as the miRDB database (https://mirdb.org/) were utilized to predict microRNAs (miRNAs) potentially involved in the regulation of biomarkers. Subsequently, key miRNAs were identified by intersecting the relationship pairs predicted by the 2 previously mentioned databases. Next, using the StarBase database (https://starbase.sysu.edu.cn/), the upstream long non-coding RNAs (lncRNAs) of important miRNAs had been identified. The lncRNAs-key miRNAs-biomarkers network was visualized using Cytoscape software (v 3.9.2), and the biological pathways of key miRNAs were analyzed using FunRich software (v 3.1.3) (http://funrich.org/index.html), a functional enrichment analysis tool specifically designed for miRNAs. Additionally, the Drug Gene Interaction Database (DGIdb) (https://dgidb.genome.wustl.edu/) was used to identify drugs that might target biomarkers. The network map of chemicals and biomarkers was created using the Cytoscape software (version 3.9.2).
Processing of scRNA-Seq Data and Identification of Key Cell Types
The Quality control (QC) was performed on GSE171314 via the Seurat package (v 4.4.0),35 and all subsequent analyses were conducted exclusively with functions from this package. At first, cells with fewer than 200 genes and genes contained by fewer than three cells were disqualified. Subsequently, cells with n-Feature RNA (the number of genes detected) less than 200 or greater than 5000 were filtered out, as well as cells with a percent.mt (percentage of mitochondrial gene expression) exceeding 50%. Thereafter, the FindVariableFeatures function was performed to select the top 2000 highly variable genes. The ideal amount of principle components (PCs) for additional analysis is then shown by the inflection points on the screen plot. Following data integration using the Harmony dimensionality reduction method in the Seurat package (v 4.4.0), an unsupervised clustering analysis was performed with a resolution of 0.5 to ascertain the number of cell clusters. The Uniform Manifold Approximation and Projection (UMAP) method was utilized for the visualization of cell clusters via the RunUMAP function. During this process, to confirm the absence of significant heterogeneity, a Principal Component Analysis (PCA) plot was generated using the DimPlot function for validation. Thereafter, cell clusters were annotated into different types by referencing marker genes from published literature36 and utilizing the SingleR package (v 2.2.0).37 The functional enrichment analysis of annotated cell types was performed utilizing the ReactomeGSA package (v 1.14.0).38 Moreover, ggplot2 package (v 3.5.1) was employed to generate a stacked plot, to illustrate the proportion of annotated cells across all samples from the GSE171314. In general, cells exhibiting the highest expression levels of primary biomarkers were identified as key cell types.
Cellular Communication and Pseudo-Temporal Trajectory Analyses
The CellChat package (v 1.6.1)39 was used to investigate the interaction dynamics among annotated cells, thereby uncovering the quantity and intensity of interactions involving key cell types and other annotated cell types. Following this, CellChat package (v 1.6.1) was conducted to analyze pairs of ligand-receptor interactions among annotated cell types (P < 0.05). Additionally, the monocle package (v 2.28.0)40 was utilized to predict the differentiation states of key cell types and to delineate their differentiational trajectories. Following that, the monocle package (v 2.28.0) was used to show the shifting trend of biomarker expression across the course of important cell types’ development.
Reverse Transcription-Quantitative PCR (RT-qPCR)
The RT-qPCR was conducted to further verify the expression levels of biomarkers in the IgAN and control groups. A total of 5 kidney tissue samples from patients with IgAN and 5 kidney tissue samples from controls (patients undergoing nephrectomy for kidney cancer in the urology department, with normal renal tissue taken as a control from 6 cm away from the kidney tumor in the urology department) were collected from Shenzhen General Hospital. This study was approved by the Shenzhen General Hospital Medical Ethics Committee (KYLLMS-2025-32), and all patients undergoing kidney biopsy and those undergoing nephrectomy for kidney cancer consented to the use of their renal tissue for scientific research and had signed an informed consent form. Total RNA of the frozen tissue samples was extracted by the TRizol kit (Vazyme Biotech Co., Ltd., Cat. R401-01, Nanjing, ChinaTo determine the amount of RNA needed for the next stages in reverse transcription, a volume of 1 μL of the extracted RNA was obtained for concentration detection using a NanoPhotometer N50. The Hifair® III 1st Strand cDNA Synthesis SuperMix for qPCR Kit (Yeasen Biotechnology, Cat. 11141ES60, Shanghai, China) was then used to reverse transcribe the RNA into cDNA in compliance with the guidelines. Next, the cDNA was diluted 5–20 times with ddH2O (without RNase/ARase), add 3 µL cDNA, 5 µL 2xUniversal Blue SYBR Green qPCR Master Mix, 1 µL forward primer (10 µM), and 1 µL reverse primer (10 µM). In addition, 40 cycles (exclusive of pre-denaturation) of reactions were performed utilizing the CFX Connect real-time quantitative PCR instrument (BIO-RAD, XLFZ006), and program information was provided in Table S2. Table S3 displayed the biomarker primer sequence details. The 2-ΔΔCT technique was used to determine relative gene expression levels, with GAPDH serving as the baseline gene. To show the differences in biomarker mRNA expression levels between the IgAN and control groups, histograms were created using the GraphPad Prism software 5.
Statistical Analysis
All statistical analyses were performed using R software (version 4.3.3). Specifically, differentially expressed genes (DEGs) between the IgAN and control groups were identified using the limma package (v3.56.2), and their overlap with mitochondrial metabolism-related genes (MM-RGs) was analyzed with the VennDiagram package (v1.7.3). Functional enrichment analysis of candidate genes was conducted using the clusterProfiler package (v4.10.1). Model construction included LASSO logistic regression implemented via the glmnet package (v4.1.8) and support vector machine–recursive feature elimination (SVM-RFE) performed with the e1071 package (v1.7.16). Model performance was evaluated by ROC curves generated with the pROC package (v1.18.0), and a nomogram was constructed using the rms package (v6.8.0). Spearman correlation analysis was carried out with the corrplot package (v0.95). For single-cell analyses, the Seurat package (v4.4.0) was applied for quality control and basic processing, cell type annotation was performed using the SingleR package (v2.2.0), and functional enrichment of annotated cell types was analyzed via the ReactomeGSA package (v1.14.0). Cell-cell communication and differentiation trajectories were investigated using the CellChat (v1.6.1) and monocle3 (v2.8.0) packages, respectively. Group differences were assessed with the Wilcoxon test, and in RT-qPCR studies, Ct values were calculated using GraphPad Prism 5, with statistical significance determined by unpaired two-tailed t-tests. A p-value less than 0.05 was considered statistically significant.
Results
Identification of 43 Candidate Genes and Investigation of Their Biological Roles
Initial examination of the FPKM values in the training set revealed similar distributions across all samples, indicating an absence of significant heterogeneity (Figure S1). Subsequent differential expression analysis identified 348 DEGs between the IgAN and control groups (Figure 1A and B). Subsequent intersection analysis was conducted between the 348 DEGs and 1234 MM-RGs, leading to the identification of 43 candidate genes (Figure 1C). Notably, extracellular matrix (ECM)-associated genes, including COL1A1, COL1A2, and COL5A1, were markedly upregulated, suggesting enhanced fibrotic signaling consistent with progressive renal injury in IgAN. Immediate early response genes such as FOS, FOSB, and EGR1 were also significantly elevated, indicating increased transcriptional activity potentially triggered by stress or inflammatory stimuli. Following this, enrichment analyses were performed to obtain initial insights into the signaling pathways associated with 43 candidate genes. Specifically, 43 candidate genes demonstrated significant enrichment in 472 GO terms (adj.P < 0.05), encompassing 400 biological processes (BPs), 25 cellular components (CCs), and 47 molecular functions (MFs) (Table S4).
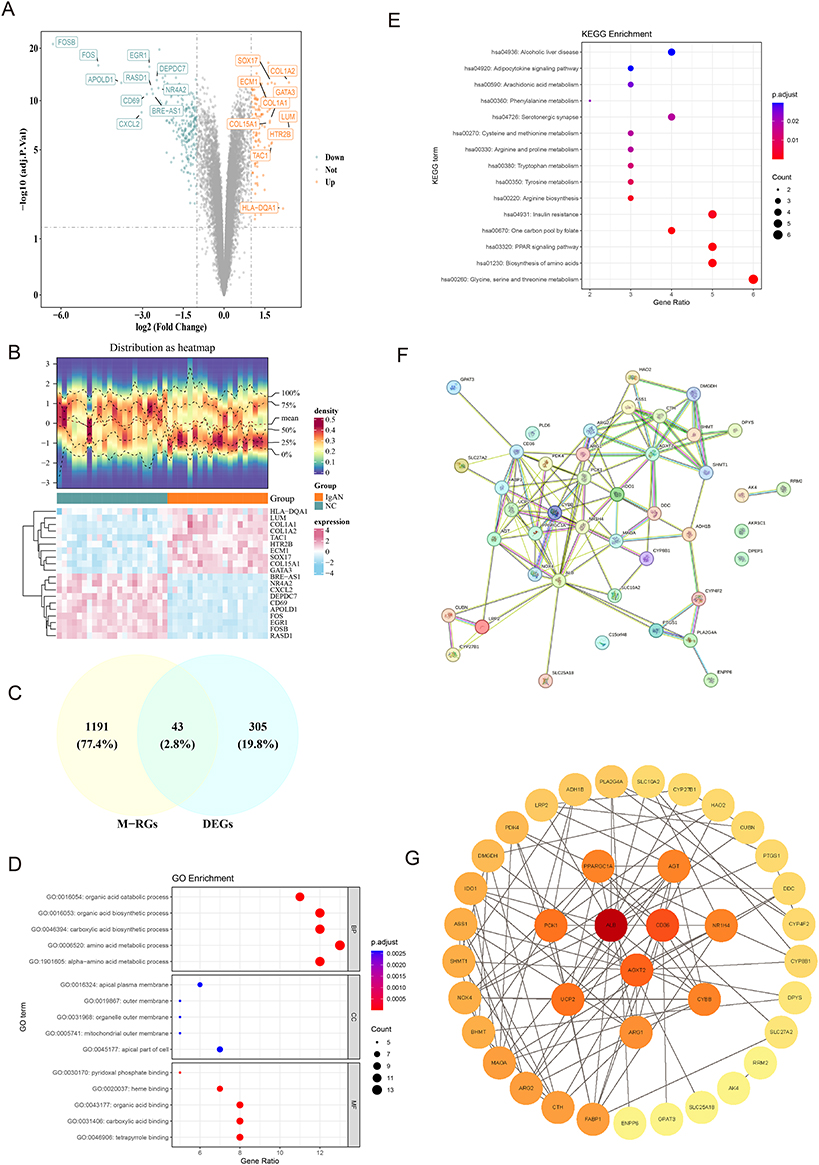 |
Figure 1 Identification and functional enrichment of candidate genes in IgA nephropathy (IgAN). (A) Volcano plot of 348 differentially expressed genes (Differentially Expressed Genes (DEGs); 107 up-regulated, 241 down-regulated) in IgAN versus controls. Genes with |log2FC| > 1.5 and adj. P < 0.05 are highlighted (red: up, blue: down). (B) Heatmap of DEG expression profiles across IgAN and normal control (NC) groups. extracellular matrix (ECM)-related genes (COL1A1, COL1A2, COL15A1) and early-response genes (FOSB, FOS, EGR1) are highlighted. (C) Intersection analysis identifying 43 candidate genes shared between DEGs and mitochondria-related genes (M-RGs). (D) Top enriched Gene Ontology (GO) terms for candidate genes, including organic acid metabolism (GO:0016054), mitochondrial outer membrane (GO:0005741), and metabolite binding (GO:0043177). Bar length reflects gene ratio; color indicates adjusted P-value. (E) Enriched Kyoto Encyclopedia of Genes and Genomes (KEGG) pathways for candidate genes, emphasizing amino acid metabolism (eg, hsa00260, hsa00330) and PPAR signaling (hsa03320). (F) Protein-protein interaction (PPI) network of 39 candidate genes (excluding 4 discrete proteins), highlighting hubs (PPARGC1A, CD40LG) integrating metabolic/immune responses. (G) Key PPI module showing co-localization of mitochondrial and inflammatory genes, implicating mitochondrial dysfunction in immune dysregulation. |
Among the top biological processes, the organic acid catabolic process (GO:0016054) and carboxylic acid biosynthetic process (GO:0046394) were enriched, indicating alterations in energy-yielding metabolic pathways. Cellular component enrichment highlighted the mitochondrial outer membrane (GO:0005741) and apical plasma membrane (GO:0016324), reinforcing the involvement of mitochondrial structure and epithelial cell polarity in IgAN. Molecular function terms such as organic acid binding (GO:0043177) and tetrapyrrole binding (GO:0046906) suggest a shift in metabolite handling, possibly reflecting adaptive responses to mitochondrial dysfunction. For BPs, CCs, and MFs, the pathways “amino acid metabolic process”, “apical plasma membrane”, and “organic acid binding” were highly enriched (P < 0.05) (Figure 1D). The metabolism of alanine, aspartate, and glutamate; arginine and proline; and glycine, serine, and threonine all essential for amino acid turnover and mitochondrial bioenergetics were among the 15 significantly enriched pathways identified by KEGG enrichment analysis. Additionally, pathways such as diabetic cardiomyopathy, AGE-RAGE signaling in diabetic complications, and PPAR signaling were notably enriched, suggesting shared metabolic and inflammatory mechanisms between IgAN and systemic metabolic disorders (Figure 1E and Table S5). Following the exclusion of the discrete proteins corresponding to the 4 candidate genes, the PPI network was constructed from the proteins corresponding to the remaining 39 candidate genes, such as CYP27B1 and PCK1 (Figure 1F and G). Topological analysis identified core regulatory hubs, including mitochondrial regulators (PPARGC1A, NDUFS1) and immune mediators (CD40LG, FASLG), suggesting their role as integrators of metabolic and inflammatory responses.
A prominent feature of the network was a tightly clustered module where mitochondrial and inflammatory genes co-localized, further implicating mitochondrial dysfunction as a potential amplifier of immune dysregulation in IgAN. This spatial association raises the possibility that metabolic perturbations in renal or immune cells may directly influence immunometabolic reprogramming, contributing to disease progression.
CYP27B1 and PCK1 Were Identified as Biomarkers for IgAN
The LASSO regression algorithm incorporated 43 candidate genes, achieving the minimum model error rate at a log(lambda.min) value of −5.4008 (Figure 2A). In this context, C15orf48, CYBB, DMGDH, MAOA, PCK1, PDK4, GPAT3, PLA2G4A, PTGS1, CYP27B1, NR1H4, PLD6, and RRM2, were identified with non-zero regression coefficients and designated as LASSO feature genes (Figure 2B). Furthermore, the LASSO model was simulated 100 times, and the results showed that the accuracy rate was above 98% each time. It indicates that LASSO has good statistical power (Figure S2). Moreover, the SVM-RFE model attained the lowest error rate utilizing 8 selected variables (Figure 2C), and it identified RRM2, PTGS1, CYP27B1, ARG1, PCK1, MAOA, PDK4, and UCP2 as the SVM-RFE feature genes. The intersection of LASSO and SVM-RFE feature genes resulted in 6 common feature genes: CYP27B1, MAOA, PCK1, PDK4, PTGS1 and RRM2 (Figure 2).
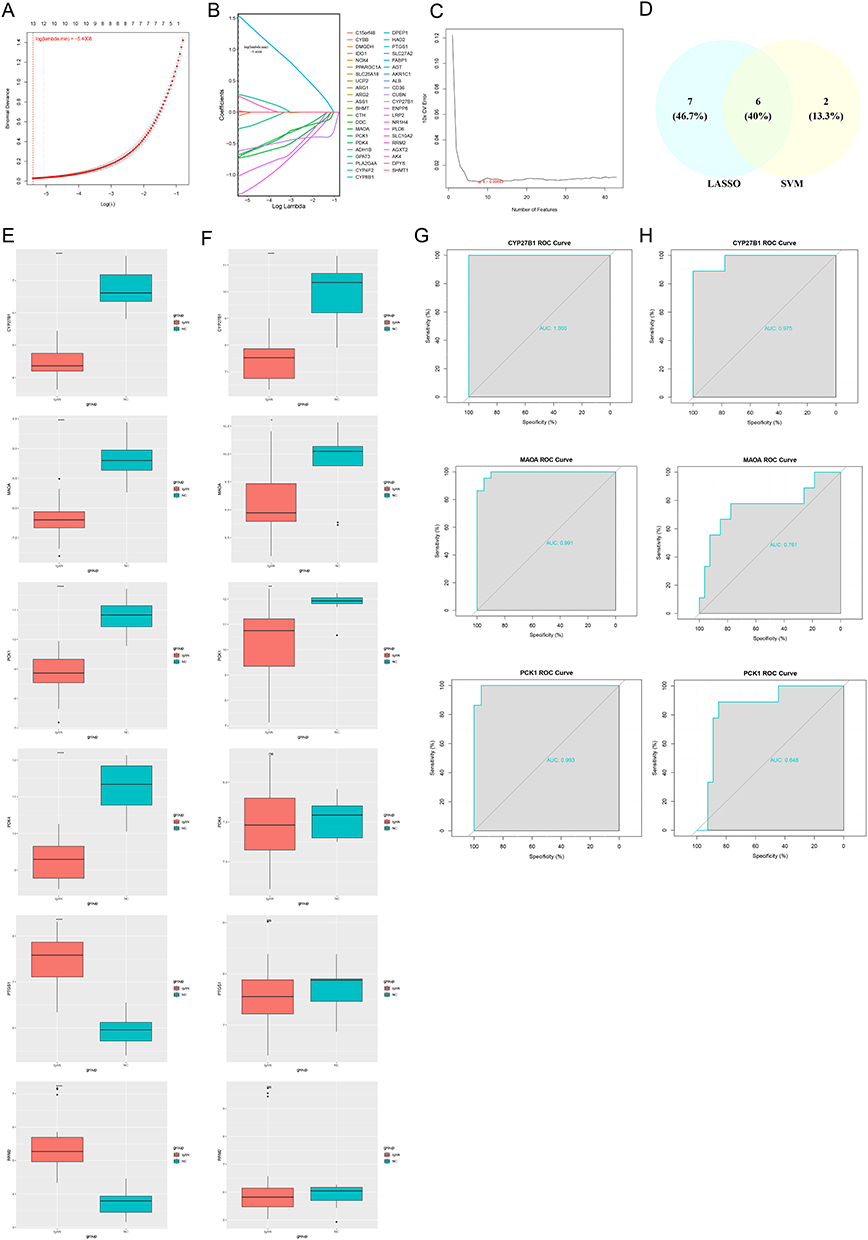 |
Figure 2 Biomarker identification and validation for IgA nephropathy (IgAN). (A) Least absolute shrinkage and selection operator (LASSO) coefficient profile: Minimum binomial deviance at log(λ) = −5.4008. (B) LASSO feature selection: 13 genes with non-zero coefficients (eg, CYP27B1, MAOA, PCK1). (C) The support vector machine-recursive feature elimination (SVM-RFE): Optimal 8-feature model with minimal cross-validation error. (D) Feature gene intersection: 6 consensus biomarkers from LASSO/SVM-RFE. (E) Training cohort (GSE93798): Differential expression of 6 biomarkers (Wilcoxon P < 10−7) ****, P < 0.0001. (F) Validation cohort (GSE37460): Consistent downregulation of CYP27B1, MAOA, and PCK1 (P < 0.05) *, P < 0.05, **, P < 0.01, ****, P < 0.0001, ns, No significance. (G) Training ROC: Diagnostic performance of CYP27B1 (AUC=1.00), PCK1 (0.99), MAOA (0.99). (H) Validation ROC: Robust AUCs (CYP27B1=0.98, PCK1=0.85, MAOA=0.76). |
In both GSE93798 and GSE37460, the expression of CYP27B1, MAOA, and PCK1 was notably decreased in the IgAN group (P < 0.05) (Figure 2E and F). All six genes showed significant differential expression (p < 0.001) in the training, which aligns with mitochondrial immune dysregulation. However, in the independent validation cohort, only PCK1, CYP27B1, and MAOA maintain consistent downregulation, confirming their robustness as cross-cohort biomarkers. The stability of PCK1, CYP27B1, and MAOA underscores their biological importance and links oxidative stress, vitamin D dysmetabolism, and gluconeogenic disruption as convergent events involved in the development of IgAN. To evaluate the diagnostic accuracy of the three promising feature genes, we performed ROC curve analysis on both training and validation datasets. In the training set, all three genes performed excellently in distinguishing IgAN patients from healthy controls. CYP27B1 achieved an AUC of 100% showing perfect classification capability. PCK1 and MAOA also demonstrate high performance with AUCs of 99.3% and 99.1% respectively. This shows their strong potential as candidates for a biomarker in the discovery phase. While in the validation cohort these genes maintained their robust performance with CYP27B1 of 97.5%, PCK1 84.8% and MAOA 76.1% as shown in (Figure 2G and H, Table S6). This pattern reflects the biological stability of vitamin D mediated by CYP27B1 in IgAN pathogenesis. The dysregulation of PCK1, the rate-limiting enzyme in gluconeogenesis, could be a result of both direct renal damage and compensatory metabolic response. Consequently, CYP27B1, MAOA, and PCK1 were identified as candidate biomarkers. Additionally, CYP27B1 and PCK1 demonstrated their capacity to effectively differentiate IgAN samples from control samples. These findings suggested that CYP27B1 and PCK1 could function as biomarkers for IgAN.
Nomogram Demonstrated Favorable Performance in Assessing the Diagnosis of IgAN
To translate our molecular findings into clinical practice, a nomogram was developed to evaluate the diagnostic value of CYP27B1 and PCK1 in the context of IgAN. This practical tool generates individualized risk scores by weighing each gene’s expression level, enabling straightforward estimation of IgAN probability. The nomogram model revealed that elevated total points for CYP27B1 and PCK1 were associated with an increased probability of developing IgAN (Figure 3A). Furthermore, the diagnostic error rate of this nomogram model was found to be low, as indicated by the calibration curve (P = 1.000) (Figure 3B). The model demonstrated exceptional calibration, with predicted probabilities precisely matching observed outcomes across the entire risk spectrum, supported by an optimal Hosmer-Lemeshow goodness-of-fit. The DCA results indicated that the nomogram model exhibited a superior net benefit in comparison to the individual biomarker (Figure 3C), thereby suggesting its potential to enhance the accuracy of early diagnosis of IgAN by clinicians. Decision curve analysis confirmed the model’s superior clinical utility, showing consistent net benefit over default strategies across all relevant decision thresholds.
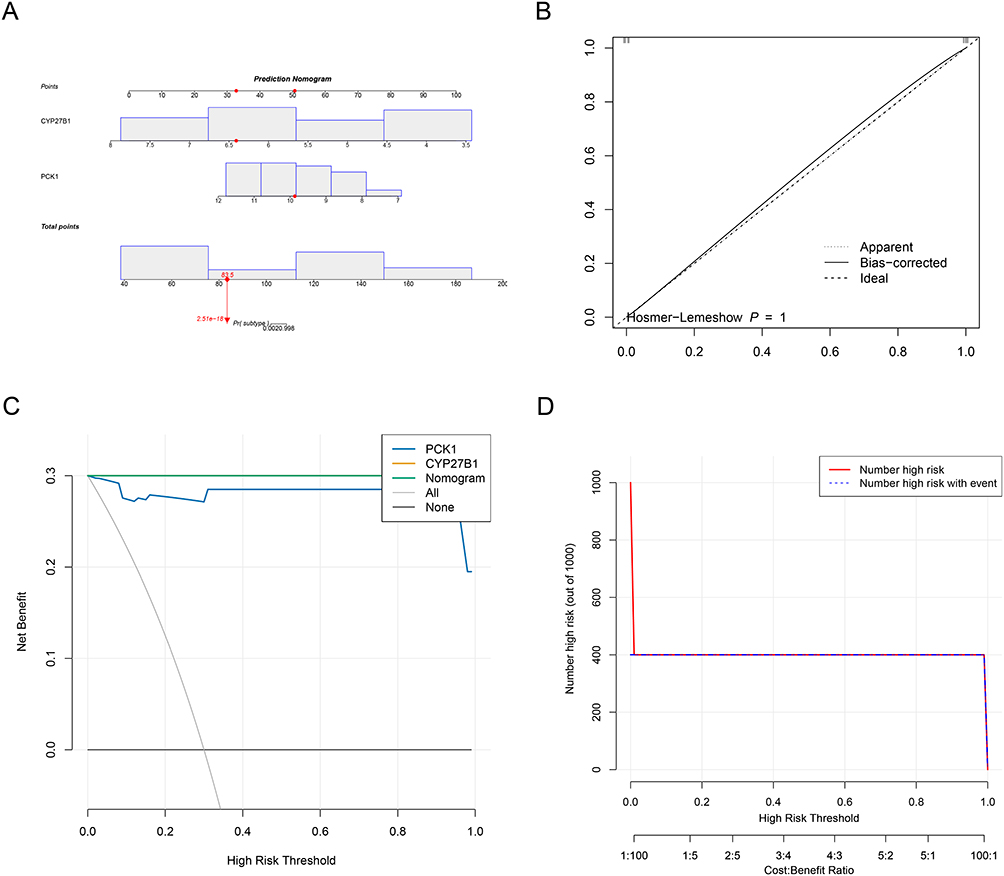 |
Figure 3 Clinical translation of IgA nephropathy (IgAN) biomarkers via diagnostic nomogram. (A) Nomogram: Converts expression of CYP27B1 and PCK1 to IgAN probability. Higher total points indicate increased disease risk. (B) Calibration curve: Perfect agreement between predicted and observed outcomes (Hosmer-Lemeshow P = 1.000, mean absolute error = 0). (C) Decision curve analysis: Superior net benefit of nomogram versus single biomarkers or default strategies across all risk thresholds. (D) Clinical impact curve: High concordance between predicted and actual positive cases (red vs blue) with minimized unnecessary interventions. |
Simultaneously, the CIC results demonstrated that as the risk threshold was elevated, the degree of consistency between the IgAN positive cases predicted by the nomogram and the actual positive cases was enhanced (Figure 3D). The clinical impact curve showed that actual positive cases were accurately identified while needless interventions were minimized, especially in the key low-to-moderate risk range where clinical ambiguity is highest. The fundamental pathophysiology of IgAN is captured while retaining practical simplicity by combining PCK1, which represents gluconeogenic dysregulation, with CYP27B1, which represents vitamin D metabolic failure. By giving the first gene expression-based clinical prediction model for IgAN, this validated tool fills a significant need in the field of nephrology. It provides a mechanistic understanding and instant application for risk stratification and individualized therapeutic choices.
Localization in Tissues/Organs and Functional Analysis of CYP27B1 and PCK1
Subsequent investigation was conducted into the tissue/organ localization and functions related to CYP27B1 and PCK1. The distribution of PCK1 was primarily observed in the liver, small intestine, and kidney, while CYP27B1 was predominantly found in bronchial epithelial cells, Burkitt’s lymphoma, and liver (Table 1).
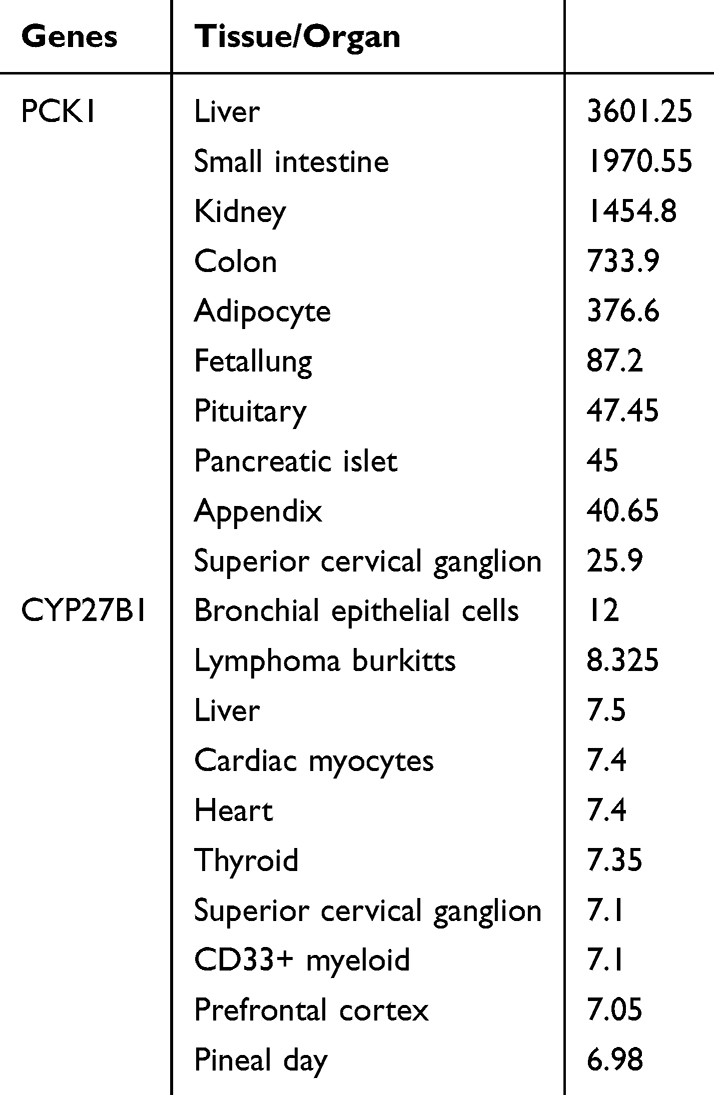 |
Table 1 Distribution of Tissue/Organ-Specific Expressed CYP27B1 and PCK1 |
Remarkably, CYP27B1 and PCK1 co-enriched in “oxidative phosphorylation” and “fatty acid metabolism” pathways (Figure 4A and B). GSEA analysis revealed distinct metabolic and immune-related pathway dysregulation in IgAN samples. These results imply that metabolic reprogramming and mitochondrial dysfunction are important aspects of IgAN pathogenesis. The results indicated that CYP27B1 and PCK1 were likely involved in the pathological mechanisms of IgAN by modulating fatty acid metabolism and oxidative phosphorylation processes, thereby affecting cellular energy metabolism and function.
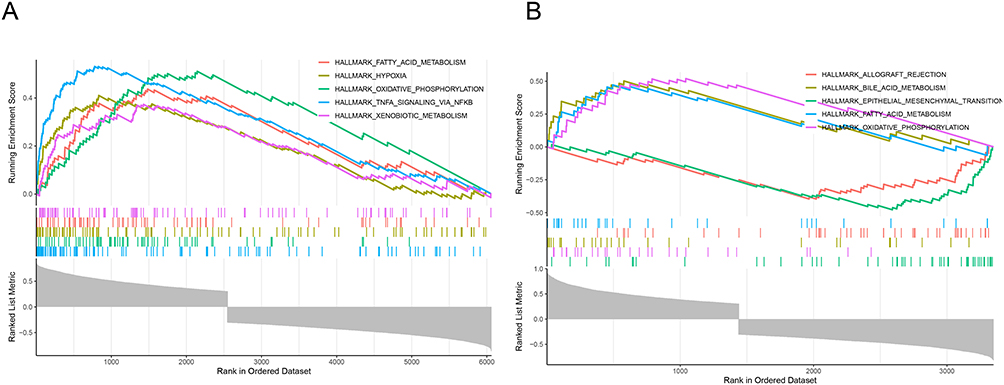 |
Figure 4 Co-enrichment of CYP27B1 and PCK1 in key mitochondrial metabolic pathways in IgA nephropathy (IgAN). (A) Gene set enrichment analysis (GSEA) analysis reveals significant enrichment of the oxidative phosphorylation pathway in IgAN samples. (B) GSEA analysis shows enrichment in the fatty acid metabolism pathway, indicating mitochondrial metabolic reprogramming in IgAN. |
Immune Cells Distribution and Correlation Analysis of CYP27B1 and PCK1
The IgAN and control groups were compared and the immunological microenvironment was examined more closely. Notably, considerable disparities (P < 0.05) in immune infiltration were identified between IgAN and control groups for 9 immune cell types, such as naive B cells (Figure 5A).
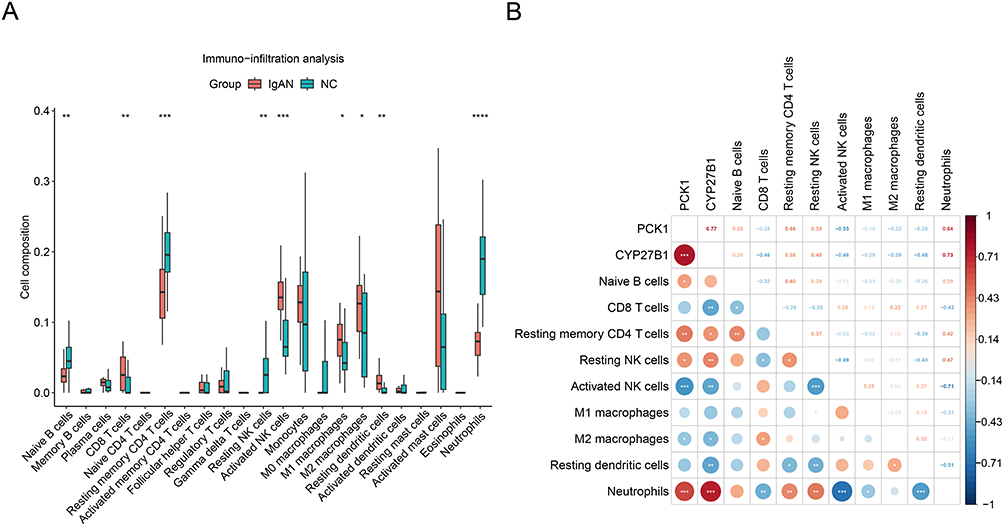 |
Figure 5 Altered immune cell infiltration and intercellular correlations reveal a pro-inflammatory immune landscape in IgA nephropathy (IgAN). (A) Bar graph showing significant differences in the proportions of 9 immune cell types between IgAN and control groups (P < 0.05), including increased M1 macrophages, CD8⁺ T cells, and resting dendritic cells, and decreased naive B cells and resting CD4⁺ T cells in IgAN tissues.*, P < 0.05, **, P < 0.01, ***, P < 0.001, ****, P < 0.0001, (B) Correlation network: CYP27B1 and PCK1 show strongest positive correlations with neutrophils (r=0.73/0.64; P<0.001). Negative associations include PCK1-activated NK cells (r=−0.55) and CYP27B1-resting dendritic cells (r=−0.48). Neutrophils coordinate NK cell dynamics (positive with resting, negative with activated).*, P < 0.05, **, P < 0.01, ***, P < 0.001. |
Compared to controls, IgAN tissues demonstrated a notable rise in resting dendritic cells (p < 0.01), CD8⁺ T cells (p < 0.001), and M1 macrophages (p < 0.001) infiltration. There is also a notable reduction in naive B cells and resting CD4⁺ T cells (both p < 0.01). These alterations reflect a shift toward a pro-inflammatory immune milieu, consistent with the progression of autoimmune and inflammatory renal injury in IgAN. Among these cell types, neutrophils exhibited the most significant positive correlation with resting natural killer (NK) cells (cor = 0.47, P < 0.01) and the most pronounced negative correlation with activated NK cells (cor = −0.71, P < 0.001) (Figure 5B). Furthermore, both CYP27B1 and PCK1 demonstrated the most robust positive correlations with neutrophils (P < 0.001), with correlation coefficients of 0.73 and 0.64, respectively. While CYP27B1 was positively connected with naive B cells, PCK1 expression was adversely connected with the quantity of M1 macrophages and activated NK cells. In addition, CYP27B1 exhibited the strongest negative correlation with resting dendritic cells (cor = −0.48, P < 0.01), while PCK1 demonstrated the strongest negative correlation with activated NK cells (cor = −0.55, P < 0.001). These findings suggest that these genes may play modulatory roles in shaping the renal immune microenvironment and may serve as potential biomarkers or therapeutic targets linked to immune-metabolic interplay in IgAN.
Molecular Regulatory Networks and Compound Interactions Involving CYP27B1 and PCK1
The regulatory factors affecting CYP27B1 and PCK1 were extensively highlighted by molecular regulatory networks. Among these, CYP27B1 and PCK1 emerged as prominent hub genes with high connectivity, suggesting a critical role in orchestrating downstream gene expression changes. Notably, both genes were significantly downregulated in injured podocytes and mesangial cells, two cell populations in which we previously identified pronounced mitochondrial dysfunction and oxidative stress. In particular, 36 and 28 miRNAs were anticipated to influence CYP27B1 and PCK1, accordingly (Figure 6A). A lncRNA-key miRNA-mRNA network comprising 140 lncRNAs, 64 key miRNAs, and two biomarkers (PCK1 and CYP27B1) was created (Figure 6B). The findings revealed that CYP27B1 and PCK1 were subject to the influence of numerous regulatory factors. For instance, GAS5 modulated CYP27B1 expression by regulating hsa-miR-188-5p. Functional enrichment analysis of the 64 key miRNAs using Funrich revealed significant enrichment in transcription factor activity, transferase activity, and kinase-mediated signaling for MFs (Figure 6C). These processes are known to regulate mitochondrial biogenesis and inflammatory responses. Additionally, BPs were predominantly associated with signal transduction, nucleoside metabolism, and cell cycle regulation (Figure 6D), aligning with the transcriptomic shifts we observed in glomerular cell populations undergoing fibrotic transformation. Integration of CYP27B1- and PCK1-centered subnetworks revealed shared downstream targets that converge on pathways governing mitochondrial energy production, redox homeostasis, and metabolic adaptation.
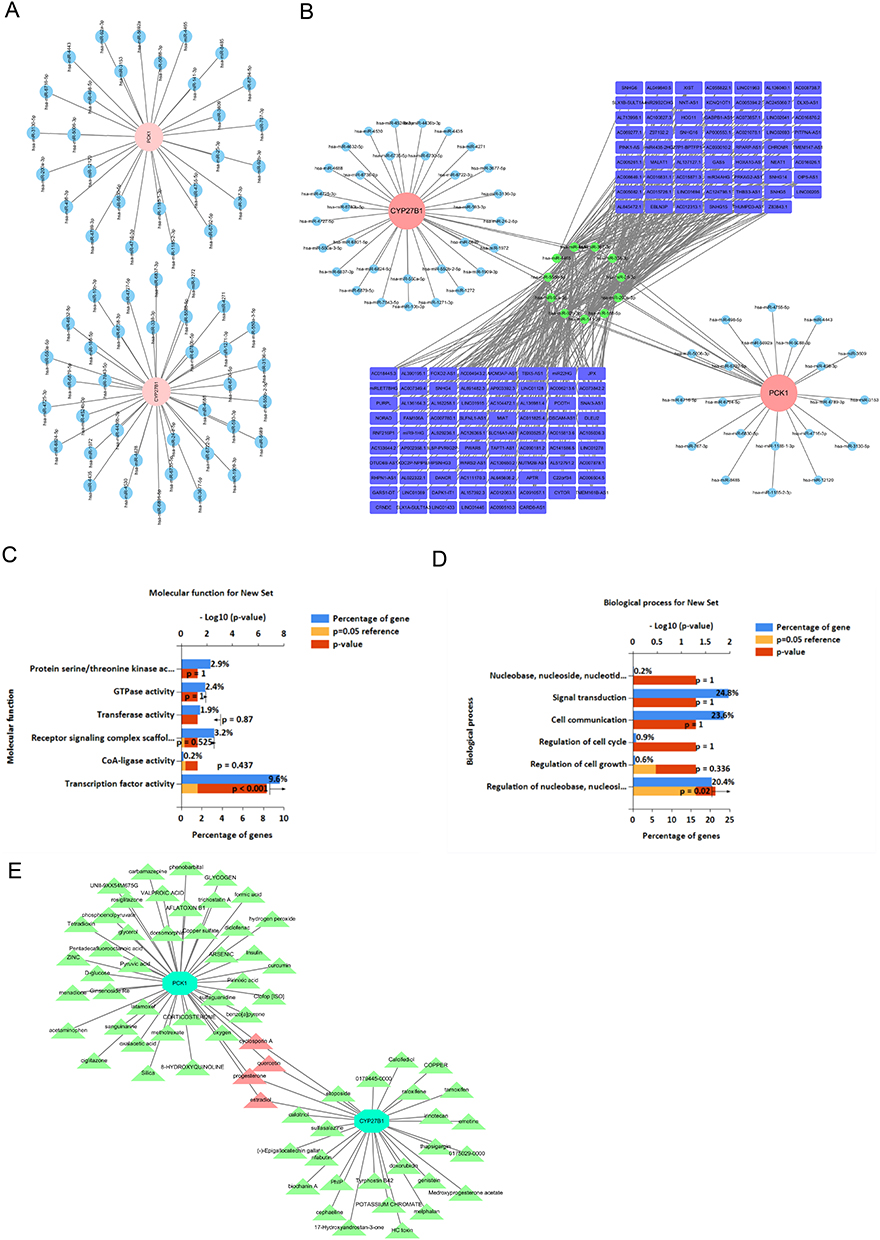 |
Figure 6 Integrated regulatory and drug-target networks highlight CYP27B1 and PCK1 as key mitochondrial modulators and therapeutic candidates in IgA nephropathy (IgAN). (A) Predicted miRNA–mRNA interaction network showing that 36 miRNAs regulate CYP27B1 and 28 miRNAs regulate PCK1. (B) lncRNA–miRNA–mRNA network incorporating 2 key biomarkers (CYP27B1 and PCK1), 64 miRNAs, and 140 lncRNAs, illustrating multi-layered gene regulation. (C) Functional enrichment analysis of the 64 key miRNAs (molecular function) reveals significant associations with transcription factor activity, transferase activity, and kinase signaling. (D) Biological process enrichment shows major involvement in signal transduction, nucleoside metabolism, and cell cycle regulation. (E) Predicted drug–target interaction network identifying 29 compounds for CYP27B1 and 43 for PCK1, with cyclosporin A, quercetin, progesterone, and estradiol co-targeting both genes. |
Furthermore, potential compounds targeting CYP27B1 and PCK1 were predicted. Specifically, 29 and 43 compounds were predicted to target CYP27B1 and PCK1, respectively (Figure 6E). Among these, cyclosporin A, quercetin, progesterone, and estradiol were found to co-target CYP27B1 and PCK1. These include known inhibitors of cytochrome P450 enzymes and gluconeogenic regulators. The bidirectional interaction of these compounds with key mitochondrial regulators positions them as plausible candidates for drug repurposing in IgAN, particularly for ameliorating mitochondrial dysfunction and metabolic inflexibility in glomerular cells. Collectively, these findings define CYP27B1 and PCK1 as central transcriptional regulators that integrate inflammatory, metabolic, and mitochondrial pathways in IgAN pathogenesis. Their connectivity within the regulatory network and drugability render them attractive targets for future experimental validation and therapeutic intervention.
Proximal Tubular Cells (PTCs) Were Identified as the Key Cell Type
After QC was applied to the GSE171314, the gene count stayed at 35,544 while the cell count decreased from 20,570 to 11,274 (Figure S3A and B). Following the completion of the typical data processing method, 2000 exceptionally distinct genes were found (Figure 7A). Highly variable gene analysis identified 2000 genes for dimensionality reduction, including stress-responsive genes such as JUN, COL1A1, and S100A (Figure 7B). Subsequently, Principal Component Analysis (PCA) identified 12 statistically significant components. Concurrently, the close clustering of all samples based on their FPKM values indicated an absence of significant heterogeneity.(p < 1×10⁻¹⁵; Figure 7B and C, Figure S3C), which were subsequently used for clustering and UMAP visualization. Subsequently, the 16 cell clusters were subjected to visualization through the utilization of the UMAP method (Figure 7C). The application of marker genes facilitated the recognition of 10 different cell types, namely principal cells (PCs), mesangial cells (MCs), endothelial cells (ECs), podocytes (PODs), PTCs, distal tubular cells (DTCs), loop of Henle cells (LOHs), intercalated cells (ICs), monocytes (MONs), and smooth muscle cells (SMCs) (Figure 7D).
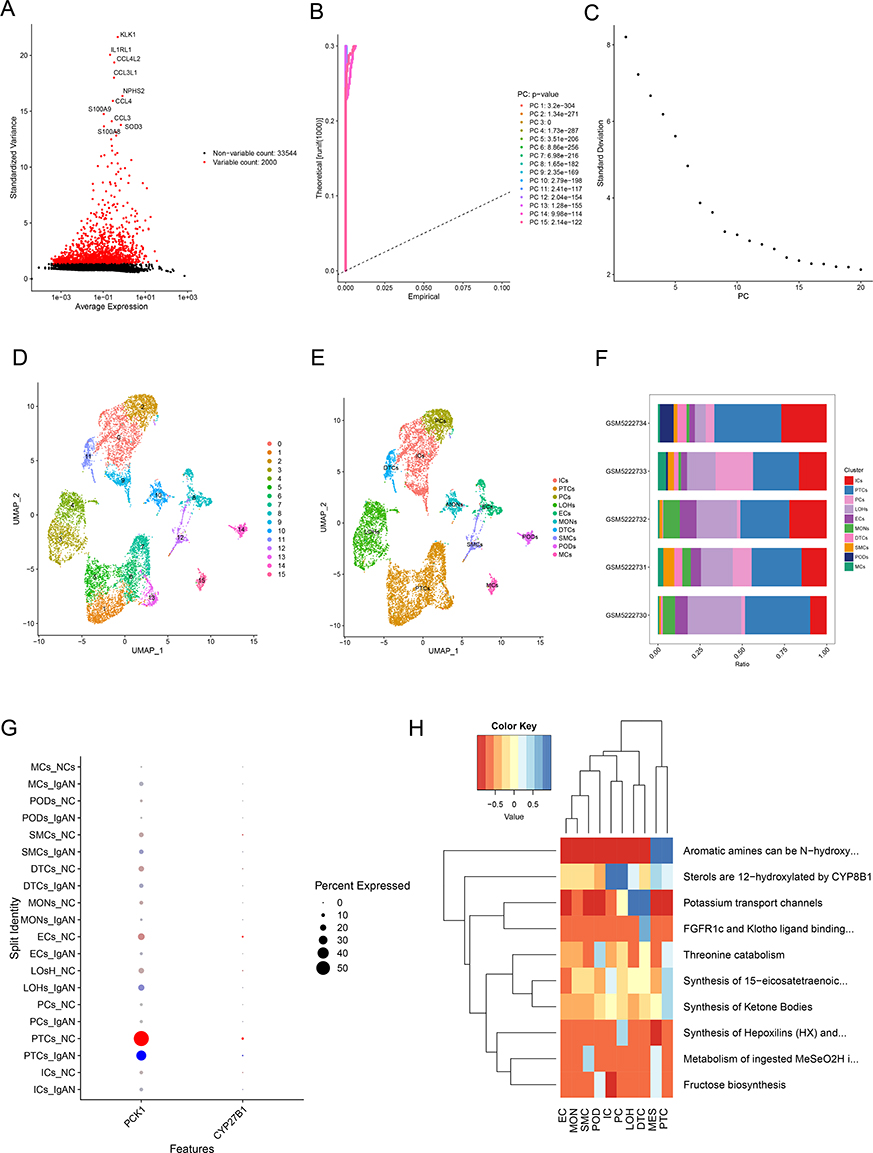 |
Figure 7 Cell types, compositional changes, and metabolic dysregulation in IgA Nephropathy (IgAN) are identified by single-cell RNA sequencing study. (A) Highly variable genes (n=2000) selected for dimensionality reduction, including stress-responsive genes (eg, JUN, COL1A1, S100A). (B and C) Principal component analysis (PCA) identified 12 statistically significant components (p < 1×10⁻¹⁵). (D) Uniform Manifold Approximation and Projection (UMAP) visualization of 16 unsupervised cell clusters. (E) Annotation of 10 major kidney cell types using marker genes. Disease stratification shows the relative expansion of mesangial cells (MCs) and podocytes (PODs) clusters in IgAN (vs normal controls (NCs)). (F) Quantitative analysis of cell-type proportions reveals altered composition in IgAN, including significant increases in MCS and podocytes (PODs) fractions. PODs represent the most abundant population across all samples. (G) Differential gene expression analysis showing disease-specific suppression of metabolic genes (eg, PCK1, CYP27B1), particularly in proximal tubular cells (PTCs) and ICs. PCK1 expression is primarily localized to PTCs. (H) Pathway enrichment analysis demonstrates widespread downregulation of oxidative phosphorylation, fatty acid metabolism, and amino acid catabolism in IgAN. |
Disease stratification revealed relative expansion of the MES and POD clusters in IgAN, consistent with mesangial hypercellularity and podocyte stress observed histologically (Figure 7E). Detailed information on the specific marker genes linked to each unique annotated cell type is provided in Table S7 and Figure S3D and E. Quantitative analysis of cell-type proportions revealed altered cellular composition in IgAN, most notably a significant increase in MES and POD fractions compared to controls (Figure 7F). Remarkably, the proportion of PTCs was the highest among all samples (Figure 7F), and PCK1 was primarily expressed in PTCs (Figure 7G, Figure S3F and G). Differential gene expression analysis highlighted disease-specific suppression of metabolic genes, including PCK1 and CYP27B1, particularly in PTC and IC clusters (Figure 7G). Therefore, it was inferred that PTCs were associated with IgAN, and PTCs were defined as the key cell type. Pathway enrichment analysis demonstrated widespread downregulation of oxidative phosphorylation, fatty acid metabolism, and amino acid catabolism in IgAN, suggesting mitochondrial dysfunction as a hallmark of the disease (Figure 7H).
Cellular Communication and Pseudo-Temporal Trajectory Analyses of PTCs
The analysis of cellular communication revealed the complex interrelationships among the PTCs and other annotated cell types. Intercellular communication networks revealed increased signaling intensity and complexity among MCs and PODs clusters in IgAN relative to controls (Figure 8A), with upregulation of ligand-receptor pairs involved in extracellular matrix remodeling and immune crosstalk. Specifically, the interactions between PTCs and PODs were characterized by a greater number and stronger weight (Figure 8A and B). Notably, the interaction pair of SPP1-(ITGAV+ITGB1) exhibited the highest probabilities in the PTCs-to-PODs pathway (P < 0.01) (Figure 8C).
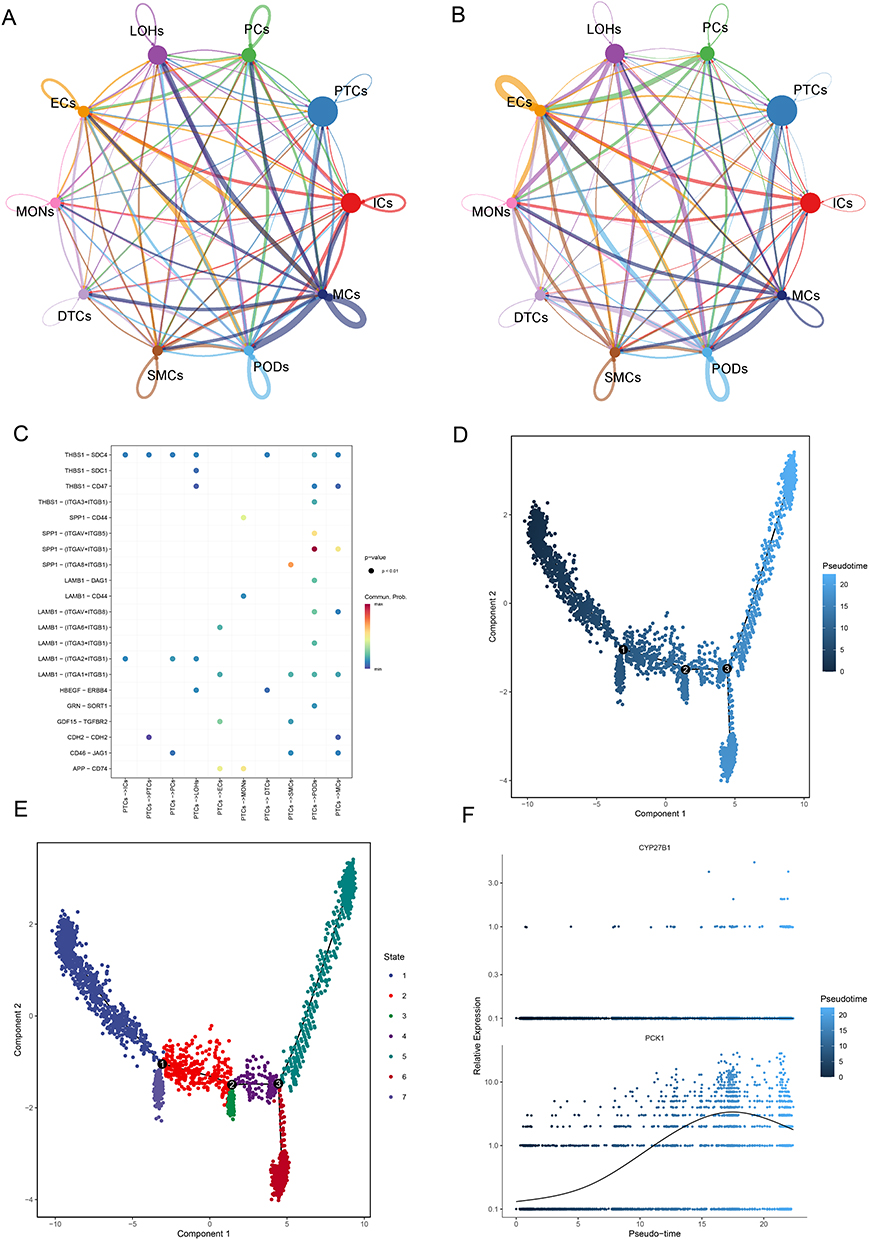 |
Figure 8 Cell-cell communication networks and pseudotemporal trajectory analysis of proximal tubular cells (PTCs) in IgA Nephropathy (IgAN). (A) CellChat analysis reveals increased signaling intensity (edge weight/thickness) and complexity between mesangial cells (MCs) and podocytes (PODs) in IgAN versus normal controls (NCs), with prominent PTCs-PODs interactions. (B) Specific interaction weights highlighting strengthened PTCs-PODs communication in IgAN. (C) Key upregulated ligand-receptor pairs in PTCs-to-PODs signaling, with SPP1-(ITGAV+ITGB1) showing the highest probability (P < 0.01). (D) Pseudotime trajectory of PTCs showing progression from early (dark blue) to late differentiation states (left to right). (E) Classification of PTCs into 7 distinct transcriptional states along pseudotime. (F) Dynamic expression of metabolic genes during PTC differentiation: PCK1 shows an early increase followed by a decline, while CYP27B1 remains stable. |
A thorough explanation of the pseudo-temporal trajectory analysis carried out on PTCs was then provided. Trajectory inference analyses uncovered distinct transcriptional paths in IgAN, with early divergence from the normal state. In detail, the differentiation trajectory of PTCs was visualized in Figure 8D, displaying a left-to-right temporal sequence, where the initial phases of differentiation are represented by the darkest blue coloration. As shown in Figure 8E, PTCs were classified into 7 different states over the course of time. Moreover, the expressions of CYP27B1 demonstrated no fluctuations during PTCs differentiation (Figure 8F). During the differentiation process of PTCs, PCK1 expression initially exhibited a slow increase, followed by a more gradual upward trend, before eventually beginning to decline in the middle and late stages.
RT-qPCR Analysis of CYP27B1 and PCK1 Expression
The RNA concentration assay findings showed that all samples fell within the normal range of RNA concentration after total RNA was extracted (Table S8).
The IgAN group exhibited a marked down-regulation in the expression levels of CYP27B1 and PCK1 mRNAs when compared to the control group (p < 0.001) (Figure 9A and B). The outcomes matched the expression pattern that GSE93798 and GSE37460 had expected.
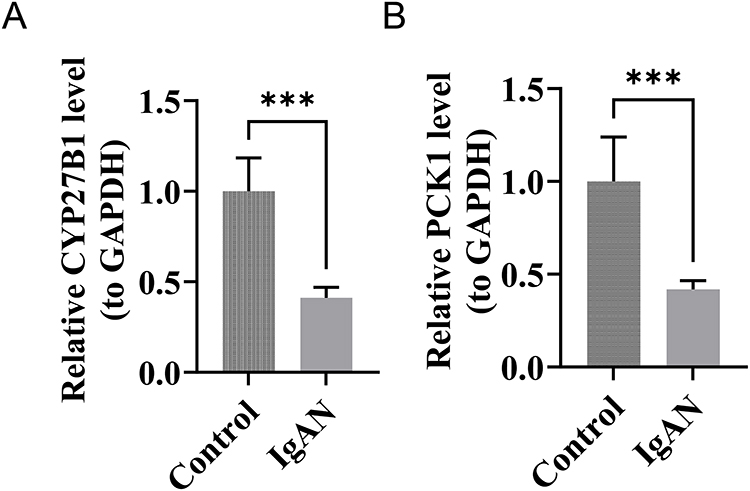 |
Figure 9 Significant downregulation of metabolic genes CYP27B1 and PCK1 in IgA Nephropathy (IgAN) confirmed by qRT-PCR. (A) Relative CYP27B1 mRNA expression (normalized to GAPDH) is significantly reduced in IgAN versus controls (***, P < 0.001). (B) Relative PCK1 mRNA expression (normalized to GAPDH) is significantly reduced in IgAN versus controls (***, P < 0.001). |
Discussion
IgAN is a primary glomerular disease characterized by the deposition of IgA in the mesangial area of the kidneys. Despite the high prevalence of IgAN, the precise pathogenesis and etiology remain incompletely understood. Although kidney biopsy is the current gold standard method for diagnosis, non-invasive and reliable diagnostic markers are still lacking. Recent studies have highlighted the role of mitochondrial dysfunction and metabolic reprogramming in the pathophysiology of IgAN, particularly through increased oxidative stress, inflammation, and renal cellular injury.10,11,14
Kim et al (2025) demonstrated that SBP1 drives mesangial cell proliferation and inflammation by up-regulating pro-inflammatory cytokines and chemokines. Notably, SBP1 knockdown and inhibition of mitochondrial respiration lead towards decreased cellular proliferation and increased mitochondrial oxidative stress.41 These findings highlight correlation between mitochondrial dysfunction and disease progression in IgAN. The dysregulated mitochondrial activity leads towards excessive ROS production, impaired mitophagy and altered energy homeostasis, which collectively contributes to renal inflammation and fibrosis.42,43 Despite these advances, there are limited studies available that correlate IgAN to mitochondrial dysfunction, particularly regarding diagnostic biomarkers. Based on this, we identified two mitochondrial metabolism-related biomarkers, CYP27B1 and PCK1, using machine learning algorithms, expression analysis, and ROC curve validation. Furthermore, single-cell analysis revealed ten distinct cell types in the kidney, with proximal tubular cells (PTCs) identified as most significantly affected in IgAN, highlighting their important role in disease progression.
CYP27B1 encodes 1α-hydroxylase, a key enzyme that converts 25(OH)D3 to 1α,25(OH)2D3 and plays a significant role in numerous pathophysiological processes, including vitamin D metabolism.44 This endocrine 1α,25(OH)2D3, which is produced in the kidneys, activates the vitamin D receptor in target tissues, regulating various biological pathways including calcium and phosphate homeostasis, immune regulation, and regulation of inflammatory cytokines.45 Currently, research on CYP27B1 as a mitochondria-metabolism–related biomarker in IgAN is limited. Therefore, this study, for the first time, combined transcriptomic analysis with experimental validation to systematically investigate the expression changes of CYP27B1 in IgAN and its diagnostic value. This study found that CYP27B1 expressions are significantly downregulated in IgAN samples. Given CYP27B1’s key role in vitamin D activation and calcium-phosphate metabolism, this expression change may be related to renal vitamin D metabolic abnormalities and requires further functional studies to validate its specific role in the pathogenesis of IgAN. This reduction may contribute to tubular injury, dysregulated immune responses, and overall metabolic dysfunction in IgAN.
Phosphoenolpyruvate carboxykinase 1 (PCK1) is a key rate-limiting enzyme in gluconeogenesis, that also participates in various metabolic and biologic pathways, including metabolism of lipid and glucose, inflammation, aging, and fibrosis. Predominantly expressed in kidneys, PCK1 plays significant role in maintaining cellular energy balance and acid-base homeostasis in renal tubular cells, particularly during metabolic stress.46,47 Furthermore, PCK1 deficiency leads to reduced ATP production and increases susceptibility to renal tubular injury.48 PCK1 protects mitochondrial functions and reduces renal fibrosis by inhibiting HK2-mediated glycolysis.49 In present study, the significant downregulation of PCK1 in IgAN samples supports its potential role in disease progression through mitochondrial impairment and alteration in energy metabolism.
The expression patterns of both CYP27B1 and PCK1 were further validated by RT-qPCR, confirming their significant downregulation in IgAN samples (P < 0.001). These results were consistent with predictions based on transcriptomic databases, increasing credibility to our bioinformatic approach. Additionally, ROC curve analysis demonstrated high diagnostic performance of both biomarkers, suggesting their potential use in future translational applications.50–52
Immune cell infiltration plays a critical role in the onset and progression of kidney diseases. Therefore, we analyzed differences in immune cell infiltration between IgAN and control groups. The immune infiltration results showed that neutrophils and resting natural killer (NK) cells exhibited the strongest positive correlation, and neutrophils were positively correlated with our study biomarkers CYP27B1 and PCK1. Some studies have shown that the neutrophil-to-lymphocyte ratio (NLR) can serve as an effective predictor of corticosteroid response in IgAN patients.53 Periodic neutropenia patients are more prone to recurrent viral infections due to neutropenia, and viral infections can trigger IgAN flares; granulocyte colony-stimulating factor (G-CSF) can stabilize neutrophil counts, helping to alleviate severe neutropenic flares, viral infections, and associated acute kidney injury, thereby improving IgAN prognosis.54 In addition, IgA can activate neutrophils via the IgA Fc receptor, inducing neutrophil migration and activation, production of reactive oxygen species, and release of neutrophil extracellular traps, leading to vascular endothelial injury and contributing to the pathogenesis of IgA vasculitis, a mechanism that may also be relevant to the pathophysiology of IgAN.55 Furthermore, studies indicate that in patients with IgA vasculitis nephritis, resting NK cells predominantly show functional impairment, with significantly reduced levels of interferon-γand macrophage inflammatory protein-1βin NK cell culture supernatants.56 Based on the strong positive correlation between neutrophils and resting NK cells observed in this study, as well as the positive relationships between neutrophils and the mitochondrial metabolism related genes CYP27B1 and PCK1, it is hypothesized that these immune cells may regulate the expression of mitochondrial metabolism related genes, thereby affect renal energy metabolism and inflammatory responses and collectively participating in the pathological progression of IgAN.
Our findings confirm, at the tissue level, the value of CYP27B1 and PCK1 as potential biomarkers for IgAN. Our ROC curve also demonstrates good diagnostic accuracy (AUC > 0.8), with diagnostic value higher than that reported in existing studies (AUC > 0.6),57,58 highlighting the potential of CYP27B1 and PCK1 as biomarkers, though the clinical translational feasibility requires further exploration. Regarding CYP27B1, although it is expressed in kidney tissue, its catalytic product 1α,25(OH)2D3 exhibits good stability in blood, and there are studies reporting successful detection in blood samples.59 Therefore, we hypothesize that detecting 1α,25(OH)2D3 levels in blood using ELISA or similar techniques may indirectly reflect renal CYP27B1 functional status, offering a feasible path for noninvasive assessment. For PCK1, it is widely expressed in renal tubular cells. Studies indicate that when tubular cells are damaged, PCK1 may be shed into urine. Given that shed urinary cells have been regarded as potential carriers for noninvasive diagnosis of kidney diseases,60 detecting PCK1 expression in urine could serve as an indirect measure of tubular metabolic status. These studies illustrate the detectability of CYP27B1 and PCK1 in body fluids, while tissue-validation results preliminarily confirm a potential association of both genes with IgAN. Future work could leverage this system to evaluate the detectability and stability of these two biomarkers in easily accessible samples such as blood and urine. Specifically, exploring the measurement of PCK1 and CYP27B1 mRNA in plasma cell-free RNA or in urinary exosomes could establish a noninvasive IgAN diagnostic and monitoring framework, accelerating translation from tissue biomarkers to clinically useful tools.
This study has several limitations. First, since the initial findings rely on public databases, the racial composition of the cohorts, disease stages, and heterogeneity may not have been fully controlled. Additionally, the single-cell data used have a relatively small sample size, which may affect the robustness of inferred cell subpopulations. Second, the observed associations between neutrophils and NK cells are correlational and lack functional experimental evidence to support their mechanistic roles. Furthermore, the RT-qPCR validation cohort has an insufficient sample size, limiting statistical power. Because kidney biopsy tissue samples are extremely precious, most of them have already been used for light microscopy, fluorescence, and electron microscopy examinations in renal pathology. As a result, the number of samples available for scientific research is relatively limited, leading to a small amount of tissue we could analyze. Some analyses could not be adjusted, and the study did not extend to proteomics validation. Therefore, the direct associations of transcriptomic biomarkers such as CYP27B1 and PCK1 with the disease require further confirmation. In the future, we plan to increase sample size and perform multi-center collaborations to include diverse ethnic groups and samples from different disease stages, conduct functional experiments and proteomics validation, and integrate multi-omics data to explore the potential value of these candidate biomarkers in disease monitoring and therapy more deeply.
Conclusion
This study highlights the results obtained through bioinformatics methods and identifying CYP27B1 and PCK1 as mitochondrial metabolism-related biomarkers in IgAN. Furthermore, single cell sequencing analysis has revealed the critical role of proximal tubular cells in disease pathogenesis. While this study provides new bioinformatics insights and foundations for IgAN research, further validation of these biomarkers is necessary through follow-up studies involving a broader range of clinical samples. Additionally, in vivo and in vitro functional studies are necessary to confirm the mechanistic roles of both biomarkers in IgAN. Future studies may also explore their prognostic and therapeutic potential in IgAN.
Data Sharing Statement
The data are provided within the paper or supplementary material. The raw data on patients will only be available from the corresponding author on reasonable request.
Ethical Statement
This study adheres to the principles of the Declaration of Helsinki to ensure that all research activities comply with ethical standards. This study was approved by the Shenzhen General Hospital Medical Ethics Committee (KYLLMS-2025-32), and all patients undergoing kidney biopsy and those undergoing nephrectomy for kidney cancer consented to the use of their renal tissue for scientific research and had signed an informed consent form.
Acknowledgments
We would like to thank the nephropathology department and urology physicians for their assistance with the handling and preservation of kidney tissues.
Author Contributions
Ibtasam Wajid and Xuedan Nie: Writing – review & editing, Writing – original draft, Methodology, Analysis, Data Curation, Conceptualization. Hao Liu: Validation, Formal analysis, Writing – review & editing. Dan Li: Validation, Writing – review & editing, Methodology, Investigation, Formal analysis. Yeping Ren: Visualization, Validation, Writing – review & editing, Software, Methodology, Formal analysis, Conceptualization. Qin Wang: Writing – review & editing, Writing – original draft, Visualization, Validation, Supervision, Methodology, Investigation, Conceptualization.
All authors gave final approval of the version to be published; have agreed on the journal to which the article has been submitted; and agree to be accountable for all aspects of the work.
Funding
This study was supported by the Shenzhen Medical Research Fund (A2403010), and the National Natural Science Foundation of China (82270774).
Disclosure
The authors report no conflicts of interest in this work.
References
1. Stamellou E, Seikrit C, Tang SCW, et al. IgA nephropathy. Nat Rev Dis Primers. 2023;9(1):67. doi:10.1038/s41572-023-00476-9
2. Pattrapornpisut P, Avila-Casado C, Reich HN. IgA nephropathy: core curriculum 2021. Am J Kidney Dis. 2021;78(3):429–441. doi:10.1053/j.ajkd.2021.01.024
3. Ma S, Wang C, Liu J, et al. To establish and validate autophagy related biomarkers for the diagnosis of IgA nephropathy. Sci Rep. 2025;15(1):13944. doi:10.1038/s41598-025-98591-y
4. Xia M, Li Y, Liu Y, Dong Z, Liu H. Single-cell RNA-sequencing analysis provides insights into IgA nephropathy. Biomolecules. 2025;15(2):191. doi:10.3390/biom15020191
5. Rovin BH, Adler SG, Barratt J, et al. Executive summary of the KDIGO 2021 guideline for the management of glomerular diseases. Kidney Int. 2021;100(4):753–779. doi:10.1016/j.kint.2021.05.015
6. Moresco RN, Speeckaert MM, Delanghe JR. Diagnosis and monitoring of IgA nephropathy: the role of biomarkers as an alternative to renal biopsy. Autoimmun Rev. 2015;14(10):847–853. doi:10.1016/j.autrev.2015.05.009
7. Yapa NM, Lisnyak V, Reljic B, Ryan MT. Mitochondrial dynamics in health and disease. FEBS Lett. 2021;595(8):1184–1204. doi:10.1002/1873-3468.14077
8. Palma FR, Gantner BN, Sakiyama MJ, et al. ROS production by mitochondria: function or dysfunction? Oncogene. 2024;43(5):295–303. doi:10.1038/s41388-023-02907-z
9. Kuznetsov AV, Margreiter R, Ausserlechner MJ, Hagenbuchner J. The complex interplay between mitochondria, ROS and entire cellular metabolism. Antioxidants. 2022;11(10). doi:10.3390/antiox11101995
10. Li T, Bao Y, Xia Y, et al. Loss of MTX2 causes mitochondrial dysfunction, podocyte injury, nephrotic proteinuria and glomerulopathy in mice and patients. Int J Bio Sci. 2024;20(3):937. doi:10.7150/ijbs.89916
11. Vercellino I, Sazanov LA. The assembly, regulation and function of the mitochondrial respiratory chain. Nat Rev Mol Cell Biol. 2022;23(2):141–161. doi:10.1038/s41580-021-00415-0
12. Mise K, Long J, Galvan DL, et al. NDUFS4 regulates cristae remodeling in diabetic kidney disease. Nat Commun. 2024;15(1):1965. doi:10.1038/s41467-024-46366-w
13. Geldon S, Fernández-Vizarra E, Tokatlidis K. Redox-mediated regulation of mitochondrial biogenesis, dynamics, and respiratory chain assembly in yeast and human cells. Front Cell Develop Biol. 2021;9:720656. doi:10.3389/fcell.2021.720656
14. Han X, Wang J, Li R, et al. Placental mesenchymal stem cells alleviate podocyte injury in diabetic kidney disease by modulating mitophagy via the SIRT1-PGC-1alpha-TFAM pathway. Int J Mol Sci. 2023;24(5):4696. doi:10.3390/ijms24054696
15. Huang F, Huang S, Sun K, et al. Protective effect of compound K against podocyte injury in chronic kidney disease by maintaining mitochondrial homeostasis. Sci Rep. 2025;15(1):435. doi:10.1038/s41598-024-84704-6
16. Liu J, Wang R, Luo N, Li Z, Mao H, Zhou Y. Mitochondrial DNA copy number in peripheral blood of IgA nephropathy: a cross-sectional study. Ren Fail. 2023;45(1):2182133. doi:10.1080/0886022x.2023.2182133
17. Hasegawa K, Kawashima N, Kawabata A, et al. Inflammation-associated molecules in the glomerular-endothelium in mild IgA-nephropathy patients identified by single-cell and spatial transcriptome. Commun Biol. 2025;8(1):915. doi:10.1038/s42003-025-08325-z
18. Slovin S, Carissimo A, Panariello F, et al. Single-cell RNA sequencing analysis: a step-by-step overview. Methods Mol Biol. 2021;2284:343–365. doi:10.1007/978-1-0716-1307-8_19
19. Jovic D, Liang X, Zeng H, Lin L, Xu F, Luo Y. Single-cell RNA sequencing technologies and applications: a brief overview. Clin Transl Med. 2022;12(3):e694. doi:10.1002/ctm2.694
20. Cheng C, Chen W, Jin H, Chen X. A review of single-Cell RNA-Seq annotation, integration, and cell-cell communication. Cells. 2023;12(15):1970. doi:10.3390/cells12151970
21. Zambrano S, He L, Kano T, et al. Molecular insights into the early stage of glomerular injury in IgA nephropathy using single-cell RNA sequencing. Kidney Int. 2022;101(4):752–765. doi:10.1016/j.kint.2021.12.011
22. Liu Y, Lin H, Liu M, Lin L, Wen Y. Establishment of a mitochondrial metabolism-related diagnostic model in schizophrenia based on LASSO algorithm. Psychiatry Invest. 2024;21(6):618–628. doi:10.30773/pi.2024.0011
23. Ritchie ME, Phipson B, Wu D, et al. limma powers differential expression analyses for RNA-sequencing and microarray studies. Nucleic Acids Res. 2015;43(7):e47. doi:10.1093/nar/gkv007
24. Gan J, Zhang Y, Lei D, Zhou Y, Zhao H, Wang L. Exploring the role of inflammatory genes and immune infiltration in vestibular schwannomas pathogenesis. J Inflamm Res. 2024;17:8335–8353. doi:10.2147/jir.S476745
25. Gu Z, Eils R, Schlesner M. Complex heatmaps reveal patterns and correlations in multidimensional genomic data. Bioinformatics. 2016;32(18):2847–2849. doi:10.1093/bioinformatics/btw313
26. Liu Y, Yan Y, Fu L, Li X. Metagenomic insights into the response of rhizosphere microbial to precipitation changes in the alpine grasslands of northern Tibet. Sci Total Environ. 2023;892:164212. doi:10.1016/j.scitotenv.2023.164212
27. Wu T, Hu E, Xu S, et al. clusterProfiler 4.0: a universal enrichment tool for interpreting omics data. Innovation. 2021;2(3):100141. doi:10.1016/j.xinn.2021.100141
28. Smoot ME, Ono K, Ruscheinski J, Wang PL, Ideker T. Cytoscape 2.8: new features for data integration and network visualization. Bioinformatics. 2011;27(3):431–432. doi:10.1093/bioinformatics/btq675
29. Friedman J, Hastie T, Tibshirani R. Regularization paths for generalized linear models via coordinate descent. J Stat Softw. 2010;33(1):1–22. doi:10.18637/jss.v033.i01
30. Shi H, Yuan X, Liu G, Fan W. Identifying and validating GSTM5 as an immunogenic gene in diabetic foot ulcer using bioinformatics and machine learning. J Inflamm Res. 2023;16:6241–6256. doi:10.2147/jir.S442388
31. Robin X, Turck N, Hainard A, et al. pROC: an open-source package for R and S+ to analyze and compare ROC curves. BMC Bioinf. 2011;12(1):77. doi:10.1186/1471-2105-12-77
32. Wu ZF, Tao SX, Su WT, et al. Development and validation of a novel coronary artery disease risk prediction model. J Transl Med. 2025;23(1):41. doi:10.1186/s12967-024-05789-1
33. Tang XL, Xu ZY, Guan J, et al. Establishment of a neutrophil extracellular trap-related prognostic signature for colorectal cancer liver metastasis and expression validation of CYP4F3. Clin Exp Med. 2024;24(1):112. doi:10.1007/s10238-024-01378-0
34. Chen HX, Sharon E. IGF-1R as an anti-cancer target--trials and tribulations. Chin J Cancer. 2013;32(5):242–252. doi:10.5732/cjc.012.10263
35. Hao Y, Stuart T, Kowalski MH, et al. Dictionary learning for integrative, multimodal and scalable single-cell analysis. Nat Biotechnol. 2024;42(2):293–304. doi:10.1038/s41587-023-01767-y
36. Tang R, Meng T, Lin W, et al. A partial picture of the single-cell transcriptomics of human IgA nephropathy. Front Immunol. 2021;12:645988. doi:10.3389/fimmu.2021.645988
37. Aran D, Looney AP, Liu L, et al. Reference-based analysis of lung single-cell sequencing reveals a transitional profibrotic macrophage. Nat Immunol. 2019;20(2):163–172. doi:10.1038/s41590-018-0276-y
38. Griss J, Viteri G, Sidiropoulos K, Nguyen V, Fabregat A, Hermjakob H. ReactomeGSA - efficient multi-omics comparative pathway analysis. Mol Cell Proteomics. 2020;19(12):2115–2125. doi:10.1074/mcp.TIR120.002155
39. Jin S, Guerrero-Juarez CF, Zhang L, et al. Inference and analysis of cell-cell communication using CellChat. Nat Commun. 2021;12(1):1088. doi:10.1038/s41467-021-21246-9
40. Trapnell C, Cacchiarelli D, Grimsby J, et al. The dynamics and regulators of cell fate decisions are revealed by pseudotemporal ordering of single cells. Nat Biotechnol. 2014;32(4):381–386. doi:10.1038/nbt.2859
41. Kim J, Lee J-H, Jang S-H, et al. SBP1 contributes to mesangial proliferation and inflammation through mitochondrial respiration in glomerulus during IgA nephropathy. Free Radic Biol Med. 2024;225:711–725. doi:10.1016/j.freeradbiomed.2024.10.313
42. Ho HJ, Shirakawa H. Oxidative stress and mitochondrial dysfunction in chronic kidney disease. Cells. 2022;12(1):88. doi:10.3390/cells12010088
43. Ahmad AA, Draves SO, Rosca M. Mitochondria in diabetic kidney disease. Cells. 2021;10(11):2945. doi:10.3390/cells10112945
44. Abouzid M, Kruszyna Ł, Kaczmarek D, et al. Genetic polymorphism of CYP2R1, CYP27A1, CYP27B1, and vitamin D metabolites plasma levels in patients with cardiovascular disease: a pilot study. Biomolecules. 2025;15(5):699. doi:10.3390/biom15050699
45. Lee SM, Cichanski SR, Pintozzi NG, Kaufmann M, Jones G, Meyer MB. Kidney deletions of Cyp27b1 fail to reduce serum 1, 25 (OH) 2D3. J Steroid Biochem Mol Biol. 2025;250:106734. doi:10.1016/j.jsbmb.2025.106734
46. Xu D, Wang Z, Xia Y, et al. The gluconeogenic enzyme PCK1 phosphorylates INSIG1/2 for lipogenesis. Nature. 2020;580(7804):530–535. doi:10.1038/s41586-020-2183-2
47. Tan -Y-Y, Wang Y-K, Luo X-M, et al. Protective effect of phosphoenolpyruvate carboxykinase 1 on inflammation and fibrotic progression of IgA nephropathy. Ren Fail. 2025;47(1):2508297. doi:10.1080/0886022X.2025.2508297
48. Verissimo T, Dalga D, Arnoux G, et al. PCK1 is a key regulator of metabolic and mitochondrial functions in renal tubular cells. Am J Physiol Renal Physiol. 2023;324(6):F532–f543. doi:10.1152/ajprenal.00038.2023
49. Hasegawa K, Sakamaki Y, Tamaki M, Wakino S. PCK1 protects against mitoribosomal defects in diabetic nephropathy in mouse models. J Am Soc Nephrol. 2023;34(8):1343–1365. doi:10.1681/asn.0000000000000156
50. Liu T, Yang M, Xia Y, et al. Microarray-based analysis of renal complement components reveals a therapeutic target for lupus nephritis. Arthritis Res Ther. 2021;23(1):223. doi:10.1186/s13075-021-02605-9
51. Deng Y, Zhang S, Luo Z, et al. VCAM1: an effective diagnostic marker related to immune cell infiltration in diabetic nephropathy. Front Endocrinol. 2024;15:1426913. doi:10.3389/fendo.2024.1426913
52. Liu H, Mei M, Zhong H, et al. Identification of anoikis-related genes in chronic kidney disease based on bioinformatics analysis combined with experimental validation. J Inflamm Res. 2025;18:973–994. doi:10.2147/jir.S498820
53. Chen Z, Saffitz JE, Latour MA, Schonfeld G. Truncated apo B-70.5-containing lipoproteins bind to megalin but not the LDL receptor. J Clin Invest. 1999;103(10):1419–1430. doi:10.1172/jci4921
54. Kapogiannis C, Zaggogianni T, Stergiou N, et al. Cyclic neutropenia and concomitant IgA nephropathy: a case report. BMC Nephrol. 2023;24(1):124. doi:10.1186/s12882-023-03179-1
55. Heineke MH, Ballering AV, Jamin A, Ben Mkaddem S, Monteiro RC, Van Egmond M. New insights in the pathogenesis of immunoglobulin A vasculitis (Henoch-Schönlein purpura). Autoimmun Rev. 2017;16(12):1246–1253. doi:10.1016/j.autrev.2017.10.009
56. Bajželj M, Senjor E, Boštic N, et al. Exhausted natural killer cells in adult IgA vasculitis. Arthritis Res Ther. 2025;27(1):95. doi:10.1186/s13075-025-03559-y
57. Wu J, Wei X, Li J, et al. Plasma exosomal IRAK1 can be a potential biomarker for predicting the treatment response to renin-angiotensin system inhibitors in patients with IgA nephropathy. Front Immunol. 2022;13:978315. doi:10.3389/fimmu.2022.978315
58. Seibert FS, Heringhaus A, Pagonas N, et al. Biomarkers in the prediction of contrast media induced nephropathy–the BITCOIN study. PLoS One. 2020;15(7):e0234921. doi:10.1371/journal.pone.0234921
59. Xu S, Ni R, Lv L, et al. Simultaneous determination of vitamin D metabolites 25 (OH) D3 and 1α, 25 (OH) 2D3 in human plasma using liquid chromatography tandem mass spectrometry. J Mass Spectrometry Adv Clin Lab. 2022;24:65–79. doi:10.1016/j.jmsacl.2022.04.001
60. Mahbub SB, Nguyen LT, Habibalahi A, et al. Non-invasive assessment of exfoliated kidney cells extracted from urine using multispectral autofluorescence features. Sci Rep. 2021;11(1):10655. doi:10.1038/s41598-021-89758-4
 © 2025 The Author(s). This work is published and licensed by Dove Medical Press Limited. The
full terms of this license are available at https://www.dovepress.com/terms
and incorporate the Creative Commons Attribution
- Non Commercial (unported, 4.0) License.
By accessing the work you hereby accept the Terms. Non-commercial uses of the work are permitted
without any further permission from Dove Medical Press Limited, provided the work is properly
attributed. For permission for commercial use of this work, please see paragraphs 4.2 and 5 of our Terms.
© 2025 The Author(s). This work is published and licensed by Dove Medical Press Limited. The
full terms of this license are available at https://www.dovepress.com/terms
and incorporate the Creative Commons Attribution
- Non Commercial (unported, 4.0) License.
By accessing the work you hereby accept the Terms. Non-commercial uses of the work are permitted
without any further permission from Dove Medical Press Limited, provided the work is properly
attributed. For permission for commercial use of this work, please see paragraphs 4.2 and 5 of our Terms.