Back to Journals » Cancer Management and Research » Volume 11
Integrative analysis of the lncRNA-associated ceRNA network reveals lncRNAs as potential prognostic biomarkers in human muscle-invasive bladder cancer
Authors Lyu L ![]() , Xiang W, Zhu JY, Huang T, Yuan JD, Zhang CH
, Xiang W, Zhu JY, Huang T, Yuan JD, Zhang CH
Received 2 March 2019
Accepted for publication 4 June 2019
Published 4 July 2019 Volume 2019:11 Pages 6061—6077
DOI https://doi.org/10.2147/CMAR.S207336
Checked for plagiarism Yes
Review by Single anonymous peer review
Peer reviewer comments 3
Editor who approved publication: Dr Antonella D'Anneo
Lei Lyu, Wei Xiang, Jin-Yan Zhu, Tao Huang, Jing-Dong Yuan, Chuan-Hua Zhang
Department of Urology, Wuhan No. 1 Hospital, Tongji Medical College, Huazhong University of Science and Technology, Wuhan 430030, Hubei Province, People’s Republic of China
Background: Long noncoding RNAs (lncRNAs) play important roles in competing endogenous RNA (ceRNA) networks involved in the development and progression of various cancers, including muscle-invasive bladder cancer (MIBC).
Purpose: This study aims to construct the lncRNA-associated ceRNA network and identify lncRNA signatures correlated with the clinical features of MIBC tissue samples from The Cancer Genome Atlas (TGCA) database.
Methods: The differential expression profiles of MIBC associated lncRNAs, miRNAs and mRNAs were obtained from TCGA. Gene Ontology (GO) and Kyoto Encyclopedia of Genes and Genomes (KEGG) pathway enrichment analyses were performed to determine the principal functions of significantly dysregulated mRNAs. The dysregulated lncRNA-associated ceRNA network of MIBC was constructed based on the bioinformatics data, and the correlations between lncRNA expression and clinical features were analyzed using a weighted gene coexpression network analysis (WGCNA). Six cancer specific lncRNAs from the ceRNA network were randomly selected to detect their expression in 32 paired MIBC tissue samples and 5 bladder cancer cell lines using quantitative real-time polymerase chain reaction (qRT-PCR).
Results: The ceRNA network was constructed with 30 lncRNAs, 13 miRNAs and 32 mRNAs. Seventeen lncRNAs in the ceRNA network correlated with certain clinical features, and only 1 lncRNA (MIR137HG) correlated with the overall survival (OS) of patients with MIBC (log-rank test P<0.05). GO and KEGG analyses revealed roles for the potential mRNA targets of MIR137HG in epithelial cell differentiation and the peroxisome proliferator-activated receptor (PPAR) and tumor necrosis factor (TNF) signaling pathways. The expression data from TCGA were highly consistent with the verification results of the MIBC tissue samples and bladder cancer cell lines.
Conclusion: These findings improve our understanding of the regulatory mechanism of the lncRNA-miRNA-mRNA ceRNA network and reveal potential lncRNAs as prognostic biomarkers of MIBC.
Keywords: muscle-invasive bladder cancer (MIBC), long noncoding RNA (lncRNA), competing endogenous RNA (ceRNA), bioinformatics analysis
Introduction
Bladder cancer is the most common urological malignancy and a major cause of mortality in the elderly population in China.1 Although the mortality rate of bladder cancer has decreased, approximately 30% of patients have muscle-invasive bladder cancer (MIBC, pathologically classified as ≥T2 using the American Joint Committee on Cancer TNM staging system) at the time of the initial diagnosis, and the tumor may rapidly progress and metastasize, resulting in a poor prognosis.2 Currently, radical cystectomy (RC) and chemoradiotherapy are considered the main treatments for MIBC.3 However, many patients with MIBC develop a metastatic disease within 2 years of diagnosis and usually succumb to their disease.4 Therefore, investigations of the mechanism that promotes MIBC progression and the identification of new molecular prognostic biomarkers are crucial.
With the development of high-throughput sequencing technology, numerous studies have reported key genes associated with cancer progression. However, the identification of genes associated with the progression of MIBC remains challenging. Interest in the biological roles of long noncoding RNAs (lncRNAs) in cancer progression and development has increased.5 The lncRNAs, ranging from 200 nucleotides to 100 kb in length, can regulate gene expression at the transcriptional, posttranscriptional and epigenetic levels.6 Aberrantly expressed lncRNAs are associated with various human tumors, such as squamous cell lung carcinoma, renal cell carcinoma, breast cancer and glioblastoma.7–10 In bladder cancer, lncRNAs may function as oncogenes or tumor suppressors and potentially affect the prognosis of patients. For example, upregulated expression of the lncRNA UCA1 promotes the proliferation and invasion of bladder cancer, and lncRNA MALAT-1 might contribute to the epithelial to mesenchymal transition (EMT) and metastasis of bladder cancer in vitro by activating the Wnt/β-catenin signaling pathway.11,12 However, the molecular mechanisms by which lncRNAs regulate the progression and development of MIBC remain largely unknown.
The formation and development of tumors are complex processes regulated by gene networks, and lncRNAs may interact with miRNAs, mRNAs or other molecules with regulatory capacities. The competing endogenous RNA (ceRNA) hypothesis was proposed as a novel regulatory mechanism between noncoding RNAs and coding RNAs.13 Notably, lncRNAs may act as ceRNAs to interact with miRNAs through miRNA response elements (MREs) and thereby regulate mRNA expression. Accumulating data have confirmed this complex crosstalk of the ceRNA network in many diseases, particularly in cancer. According to Zheng et al14, the lncRNA HOTAIR promotes cell migration and invasion by regulating MKL1 expression through the inhibition of miR206 expression in HeLa cells. Wu et al15 showed that the lncRNA MEG3 inhibited the progression of prostate cancer by modulating miR-9-5p expression. However, studies employing large samples to investigate the ceRNA mechanisms of lncRNAs in MIBC are still rare, and the relationships between lncRNAs and the clinical features of MIBC are unclear.
In this study, we obtained RNA sequencing data from 373 MIBC tissue samples and 19 adjacent nontumor bladder tissue samples from The Cancer Genome Atlas (TCGA) database. Subsequently, we constructed an lncRNA-miRNA-mRNA ceRNA regulatory network and discovered specific lncRNA markers in the MIBC tissue samples. Moreover, we analyzed the correlations between these specific lncRNAs and clinical features of MIBC. More importantly, we used tissue samples from our patients and bladder cancer cells to verify the bioinformatics analysis results using quantitative real-time polymerase chain reaction (qRT-PCR). The findings from the present study not only improve our understanding of the function of lncRNAs in the ceRNA network but also provide potential diagnostic biomarkers for MIBC.
Methods
Patients and samples
Information from 430 patients was obtained from TCGA (https://portal.gdc.cancer.gov/). Additionally, RNA expression profiles and clinical data (age, gender, neoplasm histologic grade, tumor stage and pathologic TNM stage information) were also extracted from TCGA. The exclusion criteria were: (1) a pathologic diagnosis (Tis and T1) of a condition other than MIBC, (2) preoperative radiochemotherapy, (3) a lack of complete data for analysis, and (4) the presence of other malignancies. As a result, 373 tumor tissue samples and 19 adjacent nontumor bladder tissue samples were obtained for further analysis (Table 1). The study followed the publication guidelines provided by TCGA (http://cancergenome.nih.gov/publications/publicationguidelines). In addition, 32 pairs of MIBC and paracarcinoma tissue samples were collected from patients without other malignancies who did not receive preoperative radiotherapy or chemotherapy at the Wuhan No. 1 Hospital, Tongji Medical College, Huazhong University of Science and Technology. The tissues were quickly frozen in liquid nitrogen immediately after surgery and stored until RNA extraction. Written informed consent was obtained from all patients, and was in accordance with the Declaration of Helsinki. This study protocol was approved by the institutional ethics committee of Wuhan No. 1 Hospital, Tongji Medical College, Huazhong University of Science and Technology.
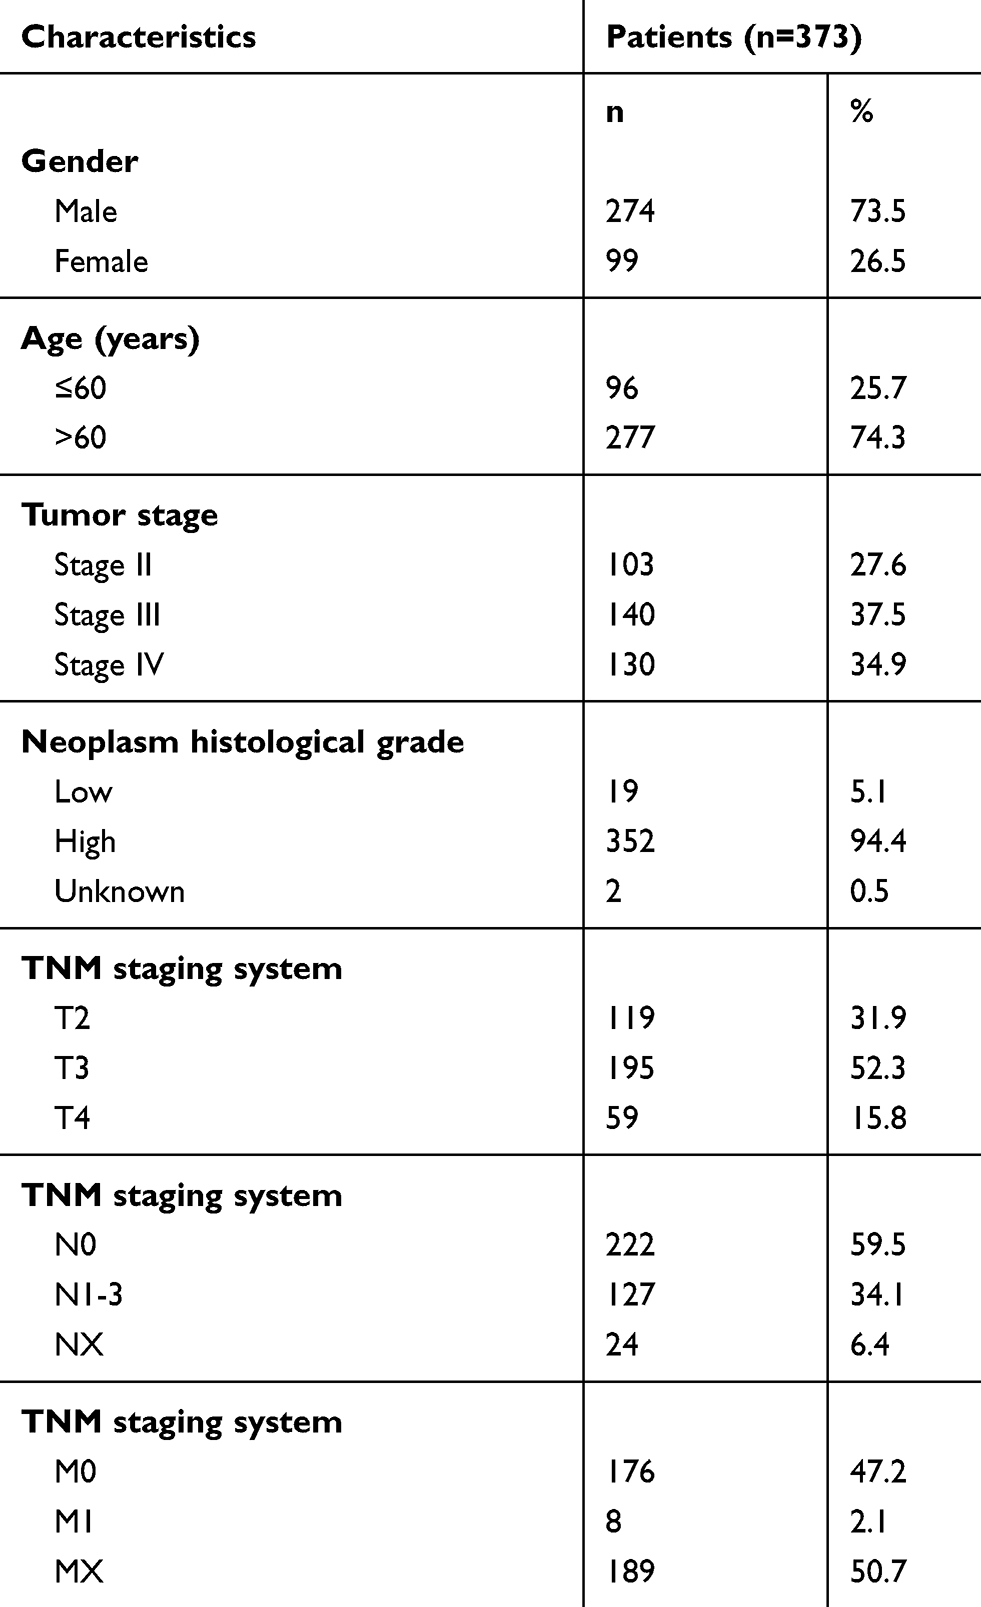 |
Table 1 Clinical features of the patients with MIBC from TCGA |
Acquisition and analysis of RNA (lncRNA, miRNA and mRNA) expression profiles
RNA sequencing data (RNA-Seq2 level 3 data) from human MIBC (pathologic stage T2~T4) samples were collected from the TCGA data portal (https://portal.gdc.cancer.gov/, platform: Illumina HiSeq 2,000 RNA Sequencing, through Dec, 2018). In addition, the level 3 miRNA sequencing data, which were downloaded from TCGA, were obtained from Illumina HiSeq 2,000 miRNAseq platforms. No further normalization was needed, as TCGA had already normalized the RNA (lncRNA, mRNA and miRNA) sequencing expression profile data. Then, we divided the samples into 4 groups (adjacent nontumor; and tumor stages Ⅱ, Ⅲ and Ⅳ) and used Empirical Analysis of Digital Gene Expression Data in R (edgeR) to compare differences in the expression levels of RNAs between stage II tumor tissues and adjacent nontumor bladder tissues, between stage III tumor tissues and adjacent nontumor bladder tissues, between stage IV tumor tissues and adjacent nontumor bladder tissues and between all tumor tissues and adjacent nontumor bladder tissues (P≤0.05, log2 fold change (logFC)>2.0, false discovery rate (FDR)<0.01). Next, we identified intersections of differentially expressed lncRNAs, miRNAs and mRNAs from the 4 comparison groups for hierarchical clustering and further bioinformatics analyses. The flow chart below shows the framework used in this study (Figure 1).
 |
Figure 1 The flow chart of ceRNA network construction and analysis. Abbreviations: ceRNA, competing endogenous RNA; GO, Gene Ontology; KEGG, Kyoto Encyclopedia of Genes and Genomes; WGCNA, weighted gene coexpression network analysis. |
Functional enrichment analysis
A Gene Ontology (GO) analysis contains three domains: molecular functions (MFs), cellular components (CCs) and biological processes (BPs). The GO database (http://www.geneontology.org) was used to analyze differentially expressed intersecting mRNAs. The MFs, CCs and BPs of up- and downregulated mRNAs were identified. The potential functions of the aberrantly expressed intersecting mRNAs involved in signaling pathways were analyzed using the Kyoto Encyclopedia of Genes and Genomes (KEGG) (http://www.kegg.jp). In addition, the relationships among the enriched clusters from the GO and KEGG pathway analyses were visualized using Metascape (http://www.metascape.org/).
Construction of the lncRNA-miRNA-mRNA ceRNA network
The lncRNA-miRNA-mRNA ceRNA network was constructed based on the ceRNA hypothesis that lncRNAs regulate the activity of mRNAs by sequestering and binding miRNAs, thereby acting as miRNA sponges. The lncRNA-miRNA interactions were predicted by miRcode databases (http://www.mircode.org/), and the Starbase (http://starbase.sysu.edu.cn/), miRDB (http://mirdb.org/) and TargetScan (http://www.targetscan.org/vert_72/) databases were used to identify the target mRNAs to establish the ceRNA network. Then, the differentially expressed intersecting lncRNAs, miRNAs and mRNAs were retained to construct a ceRNA network. The ceRNA network was visualized using Cytoscape v3.6.
Weighted gene coexpression network analysis (WGCNA)
The scale-free coexpression network was constructed using the “WGCNA”16 package in R to reveal the correlated gene modules and clinical features. First, aberrantly expressed lncRNA matrices from 373 MIBC samples and complete clinical data were evaluated to determine whether the samples and genes were of sufficient quality. Outlier samples were removed to ensure that the results of the constructed coexpression network were reliable. Next, the coexpression similarity matrix was transformed into an adjacency matrix by choosing an appropriate soft-thresholding power β value. Then, a topological matrix was established using the topological overlap measures (TOM), and average linkage hierarchical clustering was performed according to the TOM-based dissimilarity measure. Finally, the coexpression gene modules and module-trait relationships were identified using the dynamic hybrid cut method (a bottom-up algorithm). Moreover, gene significance (GS) was calculated to measure the correlation between gene expression and sample traits (age, gender, neoplasm histologic grade, tumor stage and pathologic TNM stage), and module significance (MS) was calculated to identify the correlations between modules and sample traits. Statistically significant modules were identified with P<0.05.
Survival analysis
Kaplan-Meier survival curves were generated to evaluate the prognostic value of the lncRNAs in the ceRNA network using the R package “survival” (https://CRAN.R-project.org/package=survival). For the overall survival (OS) analysis, the 373 patients were divided into 2 groups according to median expression of the lncRNAs (high vs low). The survival curves of samples with low expression of the lncRNAs and high expression of the lncRNAs were compared using the log-rank test. P<0.05 indicated statistically significant differences.
Cell culture
Five human bladder cancer cell lines (T24, J82, UM-UC-3, TCCSUP and SW780) and a human immortalized uroepithelial cell line (SV-HUC-1) were obtained from the American Type Culture Collection (ATCC, Manassas, VA, US). Cells were cultured in RPMI-1640 medium supplemented with 10% fetal bovine serum (Thermo Scientific HyClone, Logan, UT, USA), 100 U/ml penicillin and 100 μg/ml streptomycin at 37 °C and 5% CO2.
qRT-PCR
Total RNA was extracted using the Trizol Reagent kit (Invitrogen, Carlsbad, CA, USA) and was reverse transcribed into cDNAs by using PrimeScript RT-polymerase (Takara, Dalian, China). Real-time PCR was performed on the cDNA templates using specific primers (Sangon, Shanghai, China) and the SYBR master mix (Takara, Dalian, China). The relative expression levels of the lncRNAs were calculated as a ratio normalized to GAPDH expression. Comparative quantification was performed using the 2−∆∆Ct method. The sequences of the specific primers used in the present study are listed below. LINC00518 (ENSG00000183674): F, 5ʹ-GCTGTATAGAAGG TGCTAATG-3ʹ; and R, 5ʹ-AGTAGAGGCTAGAACTGGA A-3ʹ. ADAMTS9-AS1 (ENSG00000241158): F, 5ʹ-ACTTCTTGCCATTCCTCTG-3ʹ; and R, 5ʹ-CTGTCTT CTTAGTGCTCTGT-3ʹ. MIR137HG (ENSG00000225206): F, 5ʹ-GGTGGATAATAC GGATTACG-3ʹ; and R, 5ʹ-GCTGTGGTGAGTCAAGAT-3ʹ. LINC00525 (ENSG00000146666): F, 5ʹ-TACATCCACGAAGCAGATT-3ʹ; and R, 5ʹ-CAACGCA AGAGTTAGTCAG-3ʹ. AC110491.1 (ENSG00000261292): F, 5ʹ-ACATACAAGGC TATCAGACA-3ʹ; and R, 5ʹ-TGAGACA GAGGACAGAAGA-3. GAPDH (ENSG00000111640): F, 5ʹ-TGAAGGTCGGAGT CAACGG-3ʹ; and R, 5ʹ-CCTGGA AGATGGTGATGGG-3ʹ.
Statistical analysis
Statistical analyses were performed by R Studio (R version 3.5.1) and SPSS 19.0 (SPSS Inc., Chicago, IL, USA). Differentially expressed RNAs were identified using edgeR from R Studio. Two-tailed unpaired Student’s t-test was used to compare the differences between two groups. Differences were considered statistically significant when P<0.05.
Results
Differentially expressed mRNAs and their functions in MIBC
A total of 1,683 mRNAs (logFC >2, FDR<0.01) were differentially expressed between MIBC tissue samples and adjacent nontumor bladder tissue samples from the TCGA database. Notably, 1,746 mRNAs were differentially expressed between stage II MIBC samples and adjacent nontumor bladder tissues, 1,645 mRNAs were differentially expressed between stage III MIBC samples and adjacent nontumor bladder tissues, and 1,678 mRNAs were differentially expressed between stage IV MIBC samples and adjacent nontumor bladder tissues. Next, we identified 1,136 intersecting mRNAs (Figure 2A) from these mRNAs (493 upregulated and 643 downregulated). We performed GO and KEGG pathway enrichment analyses using Metascape to determine the potential functions of these dysregulated mRNAs. The GO terms of in which the upregulated genes were enriched were mainly DNA packaging complexes, mitotic nuclear division and transcription regulation in the mitotic cell cycle (Figure 3A), while the main functions of the downregulated mRNAs involved muscle system processes, the regulation of membrane potential and the extracellular matrix (Figure 3B). The significant KEGG pathways in which the upregulated genes were enriched mainly included the cell cycle, transcriptional misregulation in cancer, the IL-17 signaling pathway and the peroxisome proliferator-activated receptor (PPAR) signaling pathway (Figure 4A). The pathways associated with the downregulated mRNAs included pathways associated with cancer, the MAPK signaling pathway, proteoglycans in cancer and cell adhesion molecules (Figure 4B). Based on the results of the functional enrichment analyses, these dysregulated mRNAs participated in carcinogenesis and the development of MIBC by regulating related BPs and key pathways.
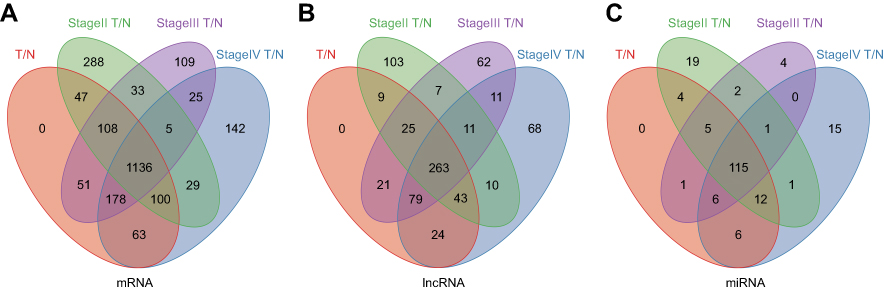 |
Figure 2 Venn diagram analysis of aberrantly expressed (A) mRNAs, (B) lncRNAs and (C) miRNAs between all MIBC tissue samples, 3 tumor stages (stage Ⅱ, Ⅲ and Ⅳ) and nontumor tissues. Abbreviations: MIBC, Muscle-invasive bladder cancer; T, tumor tissues; N, adjacent nontumor tissues. |
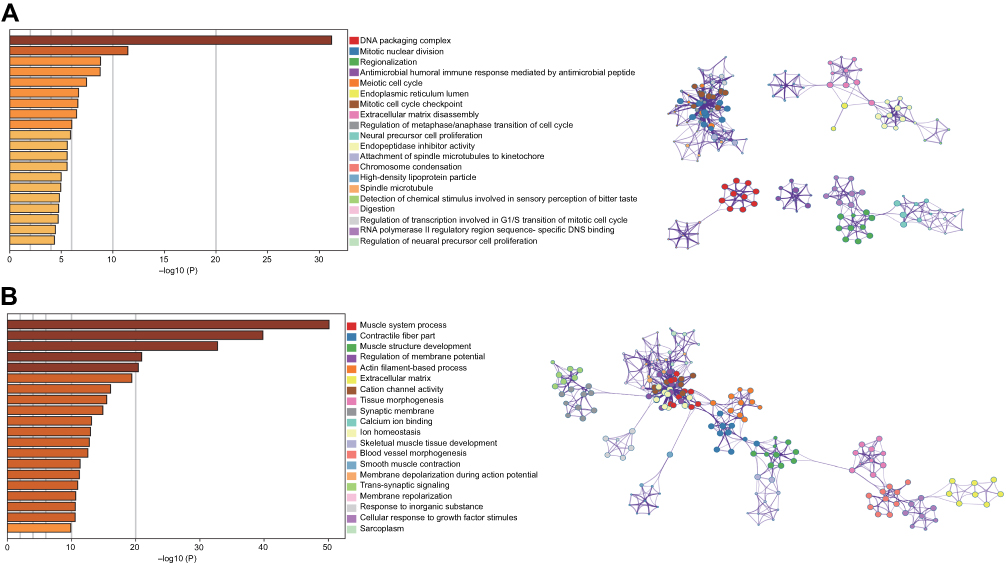 |
Figure 3 GO results of the intersecting upregulated (A) and downregulated (B) mRNAs. The relationships among the enriched clusters from the GO analysis were visualized using Metascape. Abbreviation: GO, Gene Ontology. |
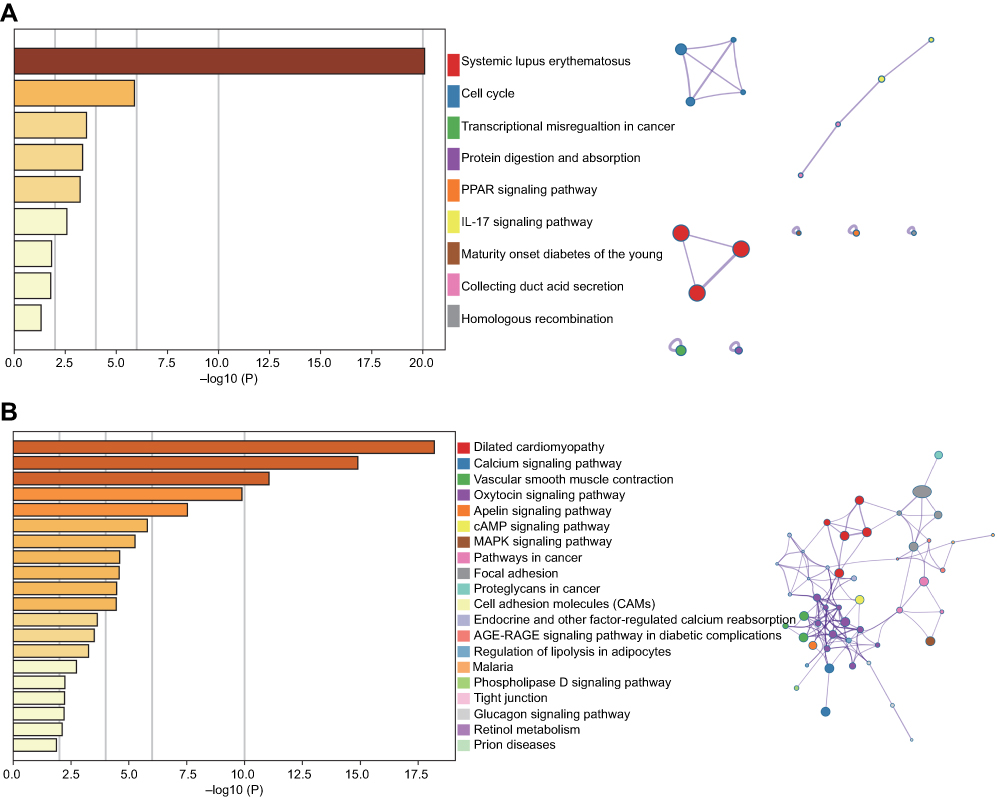 |
Figure 4 KEGG results of the intersecting upregulated (A) and downregulated (B) mRNAs. The relationships among the enriched clusters from the KEGG analysis were visualized using Metascape. Abbreviations: KEGG, Kyoto Encyclopedia of Genes and Genomes. |
Prediction of miRNA targets and construction of the ceRNA network
A total of 263 differentially expressed lncRNAs (181 upregulated and 82 downregulated) were identified between MIBC tissues and adjacent nontumor tissues, and the tumor tissues from patients with stage II, III and IV MIBC were compared to adjacent nontumor tissues (Figure 2B). Subsequently, we identified 115 aberrantly expressed miRNAs (96 upregulated and 19 downregulated) by selecting the intersections of specific miRNAs across the 4 comparison groups (Figure 2C). Then, we focused on the target relationships between these 115 miRNAs and 263 specific lncRNAs identified above. Finally, 13 specific miRNAs were predicted to target 30 specific lncRNAs (Tables 2 and 3), based on the analysis using miRcode.
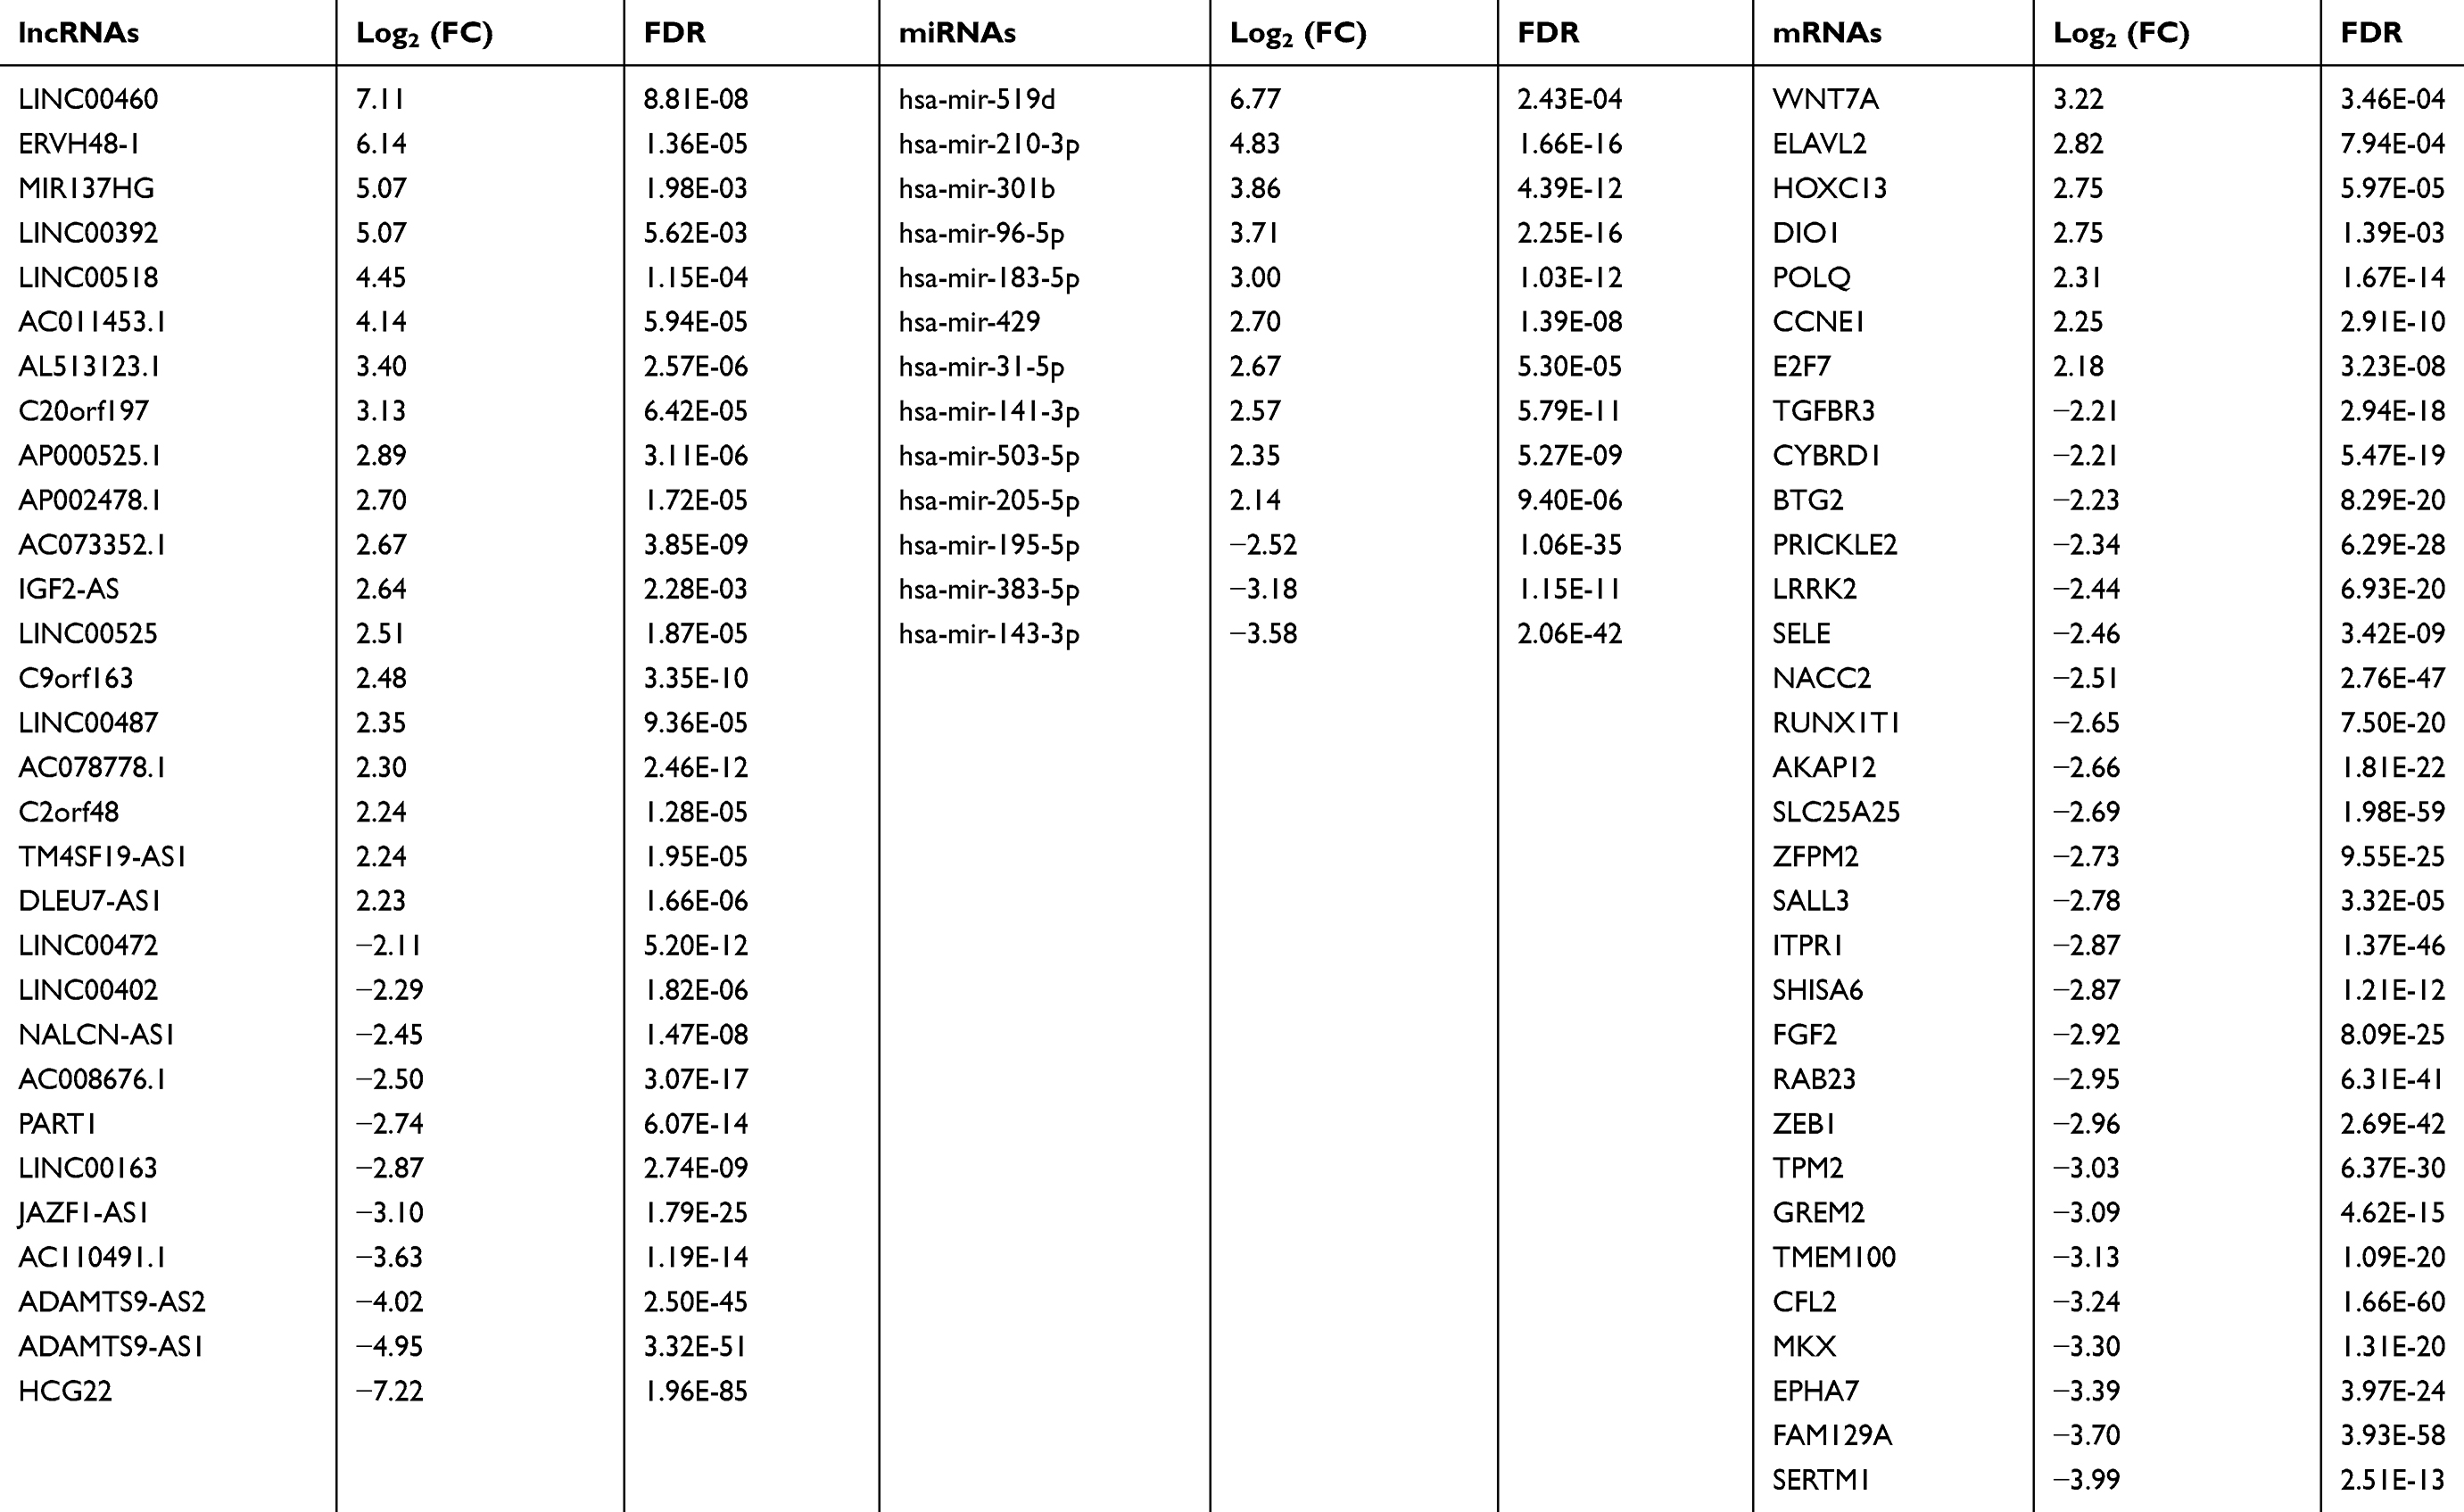 |
Table 2 Key lncRNAs, miRNAs and mRNAs involved in the ceRNA network |
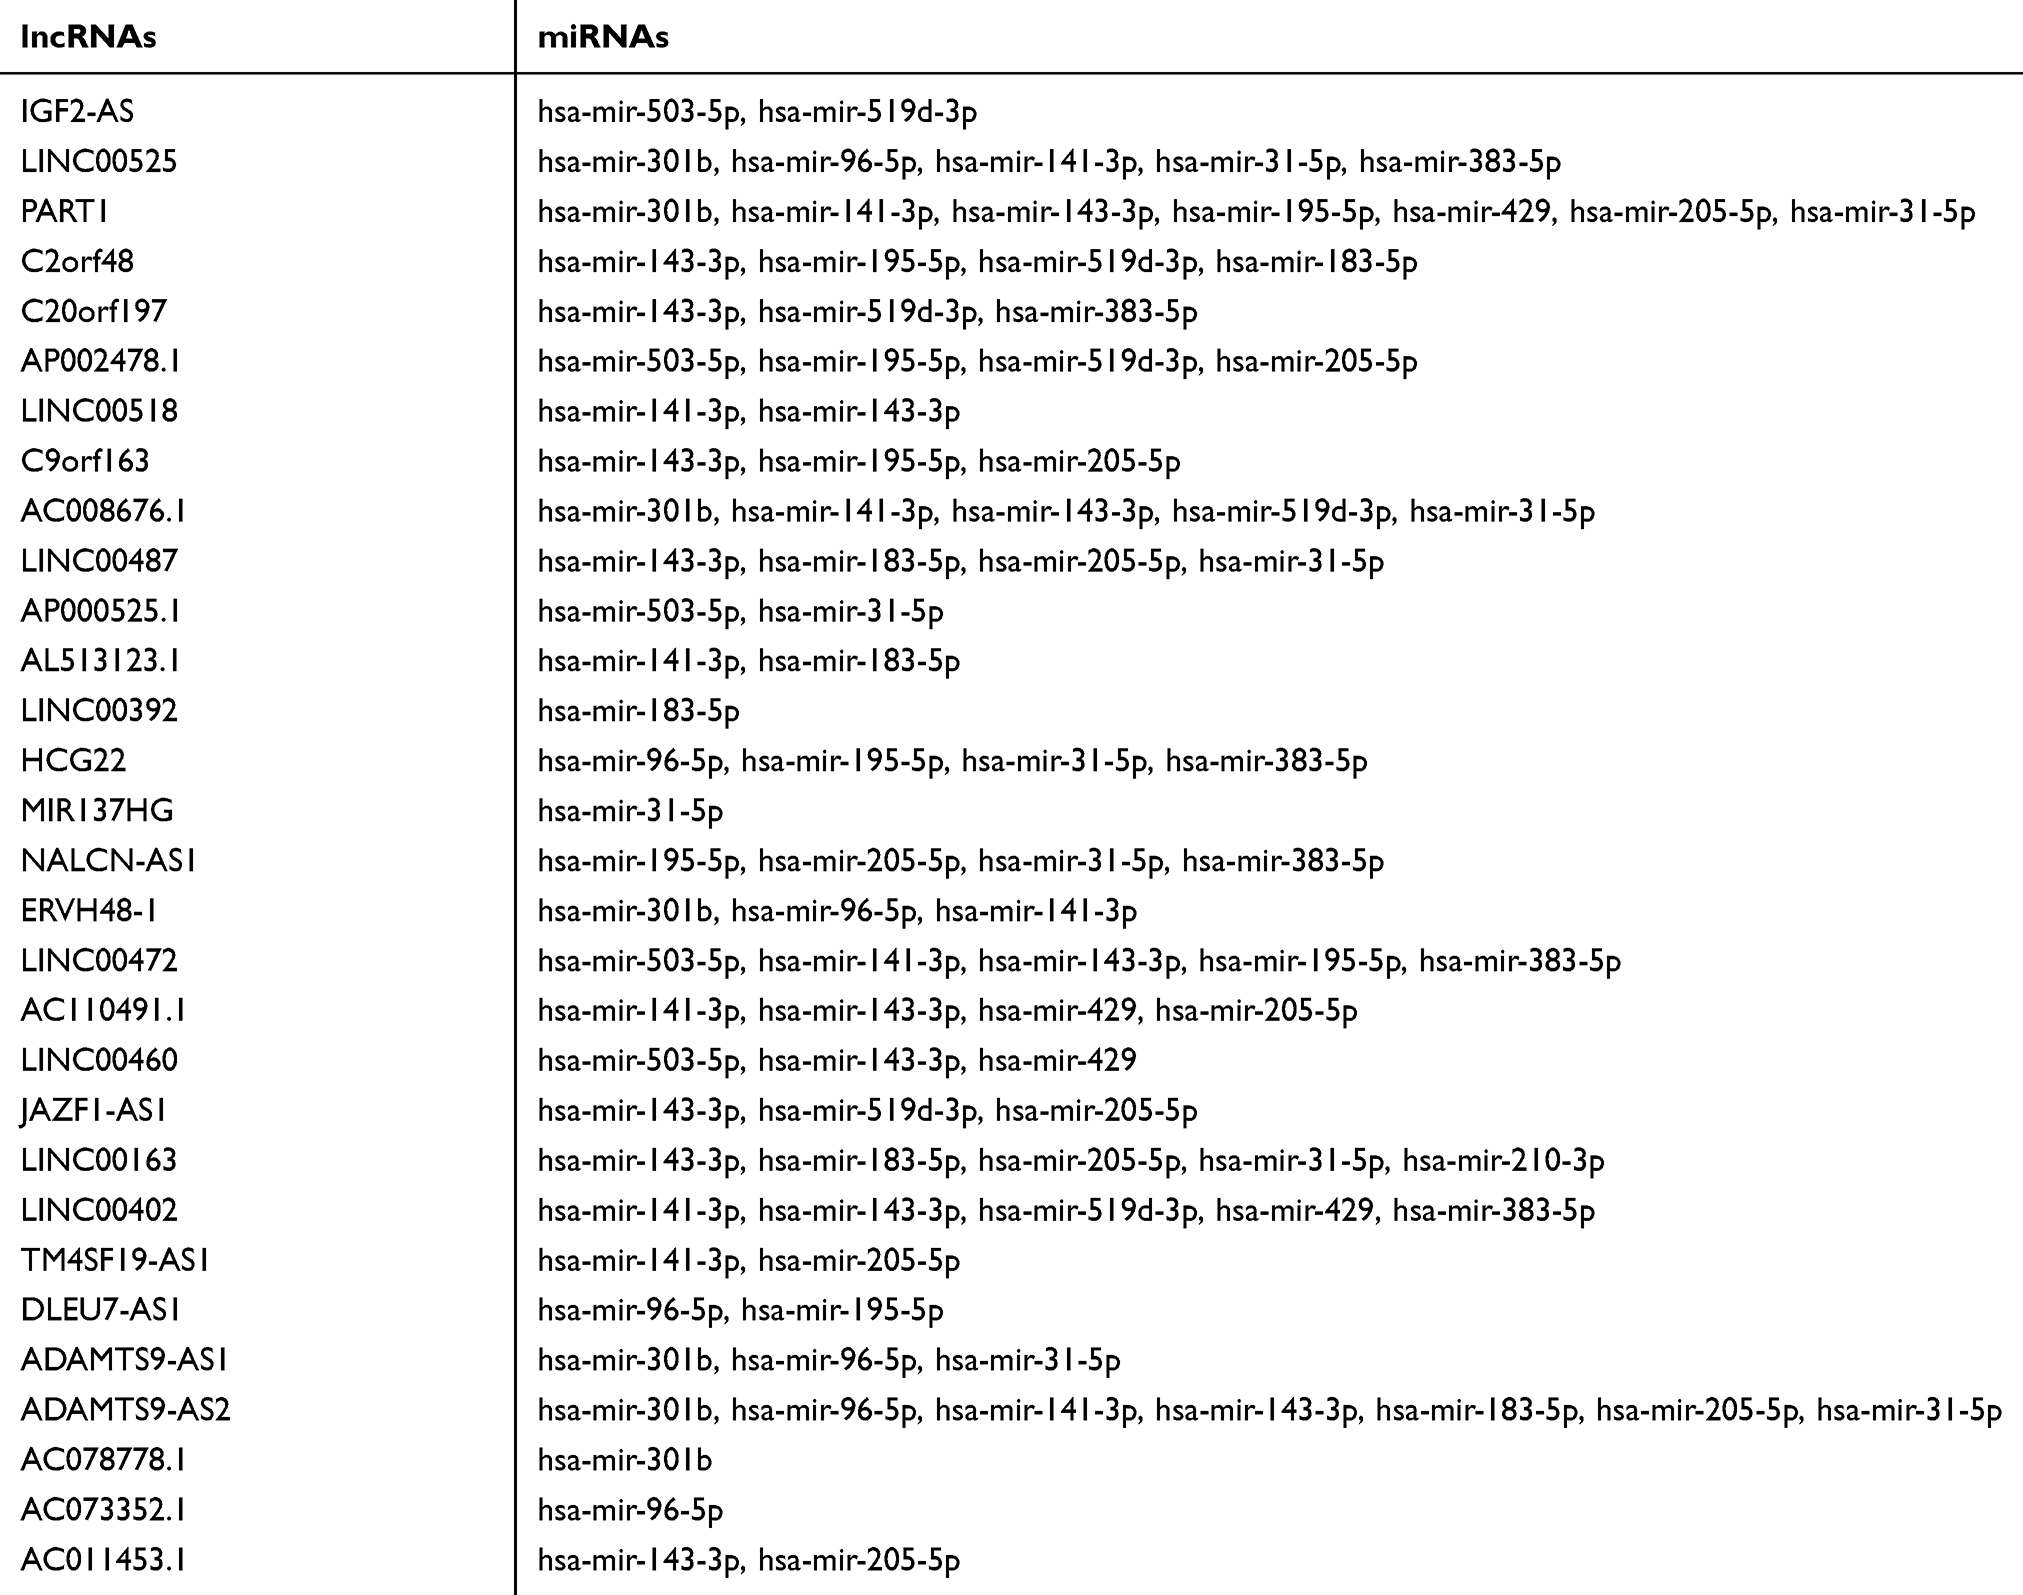 |
Table 3 Specific miRNAs that target specific lncRNAs |
In the next step, we chose the 13 miRNAs mentioned above to predict targeted mRNAs using the TargetScan, Starbase and miRDB databases. We then compared the predicted mRNAs to the 1136 intersecting specific mRNAs and obtained the mRNAs present in both databases. Finally, 11 specific miRNAs (hsa-mir-301b and hsa-mir-143 did not target mRNAs from the intersecting specific mRNAs) were identified to interact with the 32 intersecting mRNAs (Table 4). Some of these targeted mRNAs are cancer-associated genes, such as AKAP12, EPHA7, ZEB1, TMEM100, FGF2, E2F7 and BTG2. Based on the aforementioned data, the lncRNA-miRNA-mRNA ceRNA network was established and visualized using Cytoscape 3.6. As shown in Figure 5A, 30 lncRNAs, 13 miRNAs and 32 mRNAs were involved in the proposed network. Regression analyses were performed between the expression levels of the key lncRNAs and mRNAs in the ceRNA network to further validate the prediction. The expression levels of the lncRNAs AC110491.1 and ADAMTS9-AS1 were also positively correlated with the mRNAs AKAP12, EPHA7 or TMEM100, suggesting that AC110491.1 and ADAMTS9-AS1 competitively bound to MREs in hsa-mir-141-3p, hsa-mir-183-5p or hsa-mir-195-5p to prevent the miRNA-mediated inhibition of target gene expression (Figure 5B).
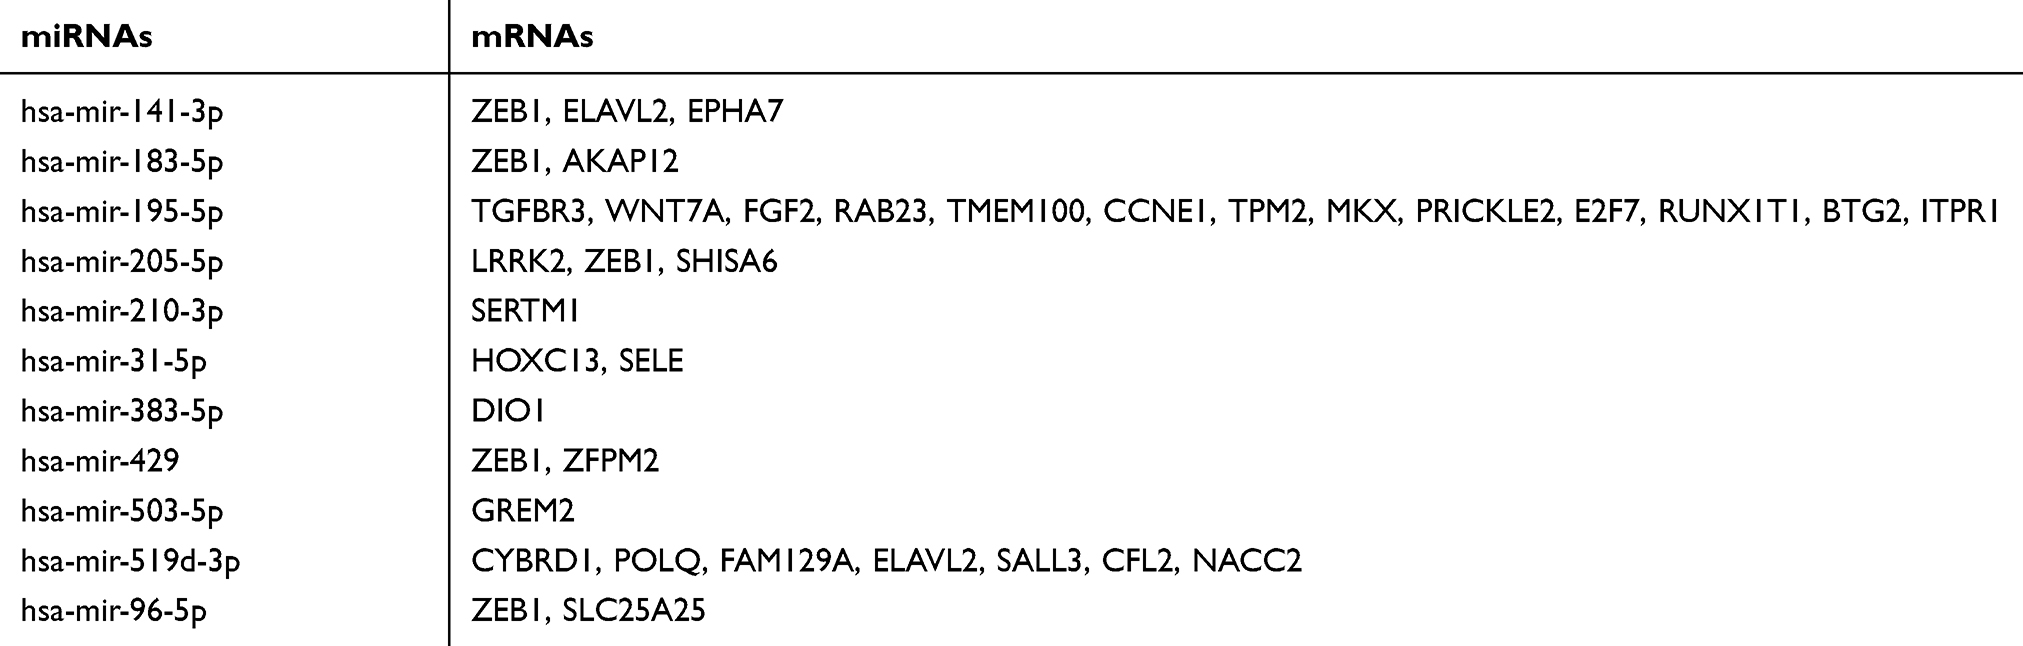 |
Table 4 Specific mRNAs that target specific miRNAs |
 |
Figure 5 ceRNA network construction. (A) The lncRNA-miRNA-mRNA ceRNA network. Orange triangles, lncRNAs; Yellow diamonds, miRNAs; Green circles, mRNAs; Blue border, downregulated genes; Red border, upregulated genes. (B) AC110491.1 and ADAMTS9-AS1 coexpression correlations with mRNAs in the ceRNA network. Abbreviation: ceRNA, competing endogenous RNA. |
The correlations between MIBC-specific lncRNAs and clinical features
We performed a WGCNA to construct a gene coexpression network, identify the correlations between the specific lncRNAs and clinical features, including age, gender, neoplasm histologic grade, tumor stage and pathologic TNM stage, and further study the 30 key lncRNAs in the ceRNA network. Finally, 9 gene modules were identified using the dynamic tree cutting method. We then analyzed the relationship between the gene modules and the clinical features of the sample (Figure 6). The lncRNAs from the modules with the highest positive or negative scores that correlated with clinical features were selected to intersect with lncRNAs from the ceRNA network. As shown in Table 5, the aberrant expression of 3 lncRNAs (MIR137HG, LINC00460 and TM4SF19-AS1) significantly correlated with the tumor stage and pathologic T stage, 9 lncRNAs (C2orf48, C20orf197, AP002478.1, LINC00518, AC073352.1, C9orf163, IGF2-AS, DLEU7-AS1 and AC078778.1) significantly correlated with the neoplasm histologic grade, the expression of 3 lncRNAs (LINC00525, LINC00392 and AC011453.1) was dysregulated in tumors with the pathologic N stage, and 2 lncRNAs (ERVH48-1 and NALCN-AS1) were markedly differentially expressed in tumors with the pathologic M stage. More importantly, the results of the Kaplan-Meier survival curves revealed a significant negative correlation between MIR137HG and OS (log-rank test, P<0.05) (Figure 7A). We constructed a coexpression network based on the Pearson correlation coefficient (|cor|>0.4, P<0.01) between MIR137HG and the mRNAs to predict the potential targets of MIR137HG. Three hundred mRNAs potentially targeted MIR137HG, and the expression levels of the top 20 mRNAs that were potentially positively or negatively correlated with MIR137HG are shown as a heatmap in Figure 7B. Subsequently, enrichment analyses based on GO and KEGG pathways were performed to predict the potential functions of all mRNAs targeted by MIR137HG. The results from the GO and KEGG analyses showed that MIR137HG may be involved in epithelial cell differentiation and the PPAR signaling pathway (Table 6).
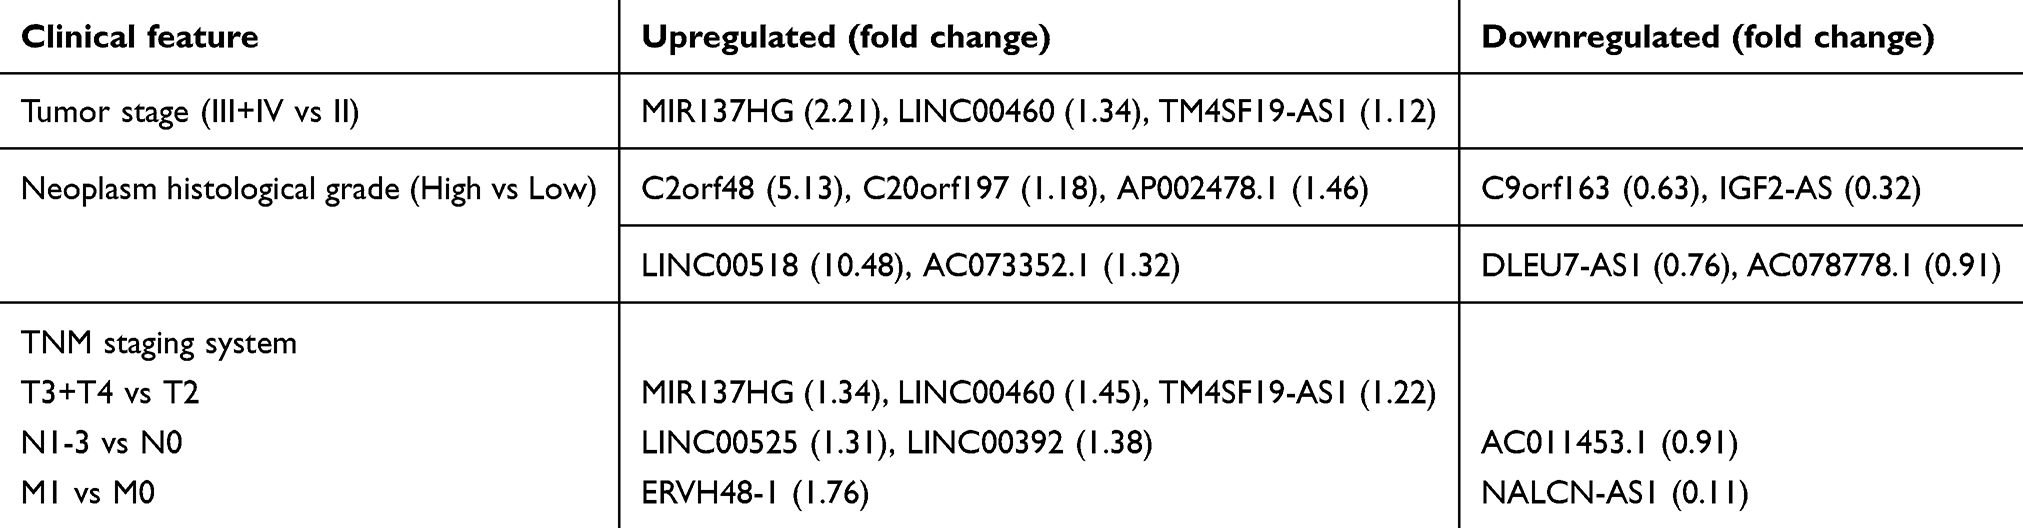 |
Table 5 The correlations between key lncRNAs from the ceRNA network and clinical features of MIBC |
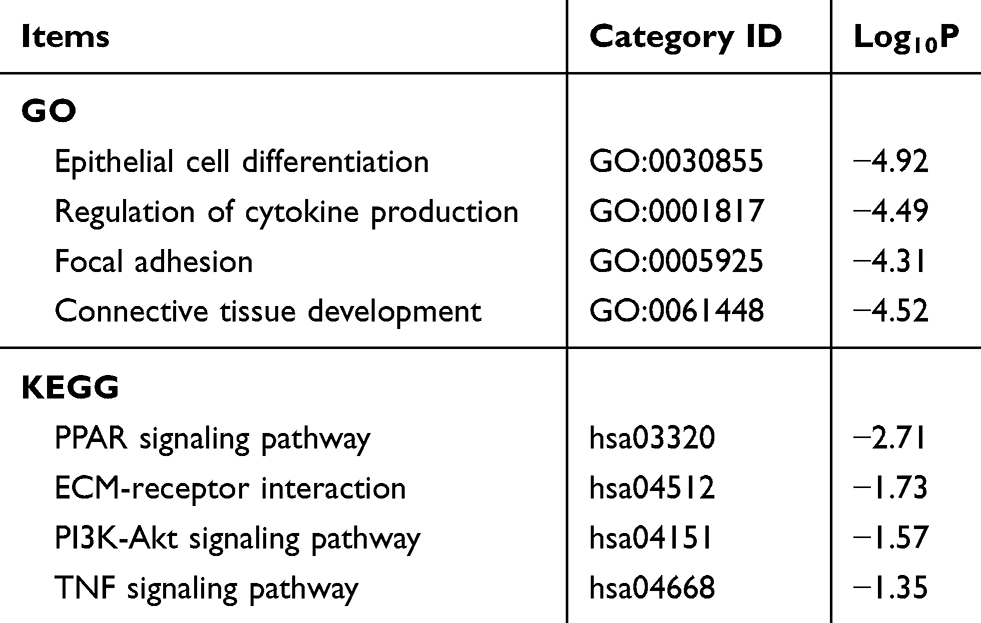 |
Table 6 GO and KEGG analyses of the mRNA targets of MIR137HG |
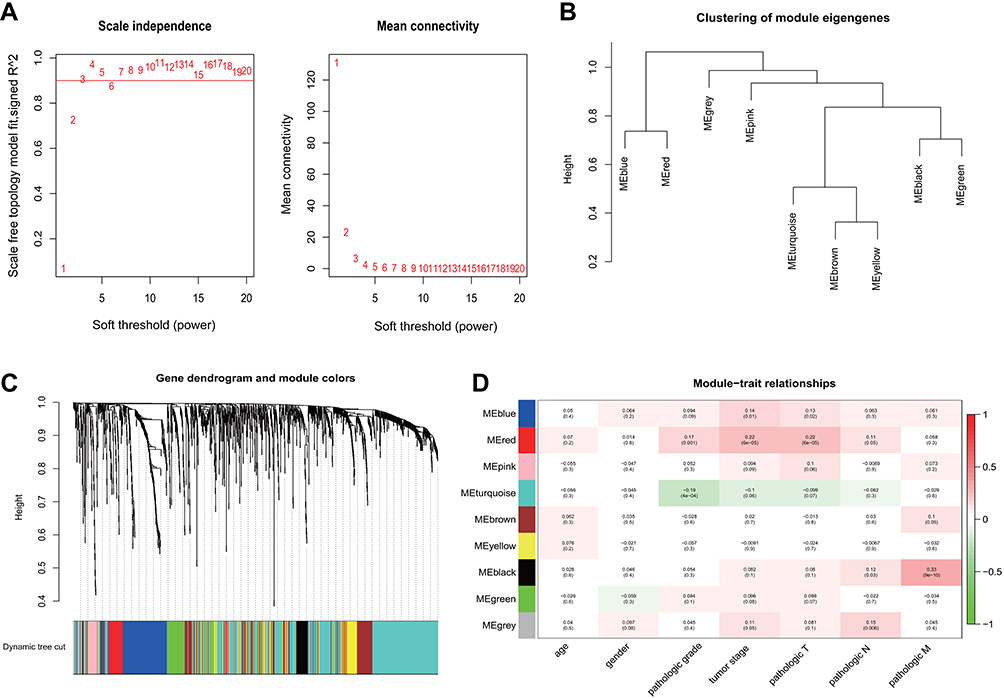 |
Figure 6 WGCNA construction of MIBC. (A) Identification of the soft threshold according to the standard of the scale-free network; (B) Dendrogram of consensus module eigengenes; (C) Identification of coexpression modules in MIBC. The branches of the dendrogram correspond to the 9 different gene modules. Dendrogram of all aberrantly expressed lncRNAs clustered based on a dissimilarity measure (1-TOM); (D) Correlation between gene modules and clinical traits. The correlation coefficient (upper number) and corresponding P-value (lower number) in each cell resulted in the correlation between the gene module and the clinical trait. Abbreviations: WGCNA, Weighted gene coexpression network; MIBC, Muscle-invasive bladder cancer; TOM, Topological overlap measures. |
 |
Figure 7 Analysis of survival and coexpression of MIR137HG in MIBC. (A) Kaplan-Meier analysis displaying the correlation of MIR137HG with overall survival outcomes for patients with MIBC; (B) The expression levels of the top 20 mRNAs that are potentially positively or negatively correlated with MIR137HG are shown as a heatmap. Abbreviation: MIBC, Muscle-invasive bladder cancer. |
qRT-PCR verification of representative lncRNAs in MIBC tissue samples and bladder cancer cell lines
We randomly chose 6 lncRNAs (MIR137HG, LINC00525, AC110491.1, ERVH48-1, LINC00518 and ADAMTS9-AS1) from the ceRNA network to investigate their expression patterns in 32 paired samples from patients with MIBC and 5 bladder cancer cell lines (T24, J82, UM-UC-3,TCCSUP and SW780) using qRT-PCR to verify the reliability and validity of the above bioinformatics analysis results. As shown in Figure 8A and B, the expression of 4 lncRNAs (MIR137HG, LINC00525, ERVH48-1 and LINC00518) was upregulated, while the expression of AC110491.1 and ADAMTS9-AS1 was downregulated in MIBC tissues and bladder cancer cells (T24, J82, UM-UC-3, TCCSUP and SW780) compared with the expression in adjacent nontumor bladder tissues and the immortalized SV-HUC-1 uroepithelial cells, respectively. The results were consistent with the results of the bioinformatics analysis described above. A subsequent analysis was performed to correlate the expression of these 6 lncRNAs with clinical features. As shown in Figure 8C–E, LINC00518 significantly correlated with the neoplasm histologic grade, MIR137HG significantly correlated with the pathologic T stage, LINC00525 significantly correlated with the pathologic N stage and ERVH48-1 significantly correlated with the pathologic M stage. Thus, bioinformatics analysis described above was reliable and valid.
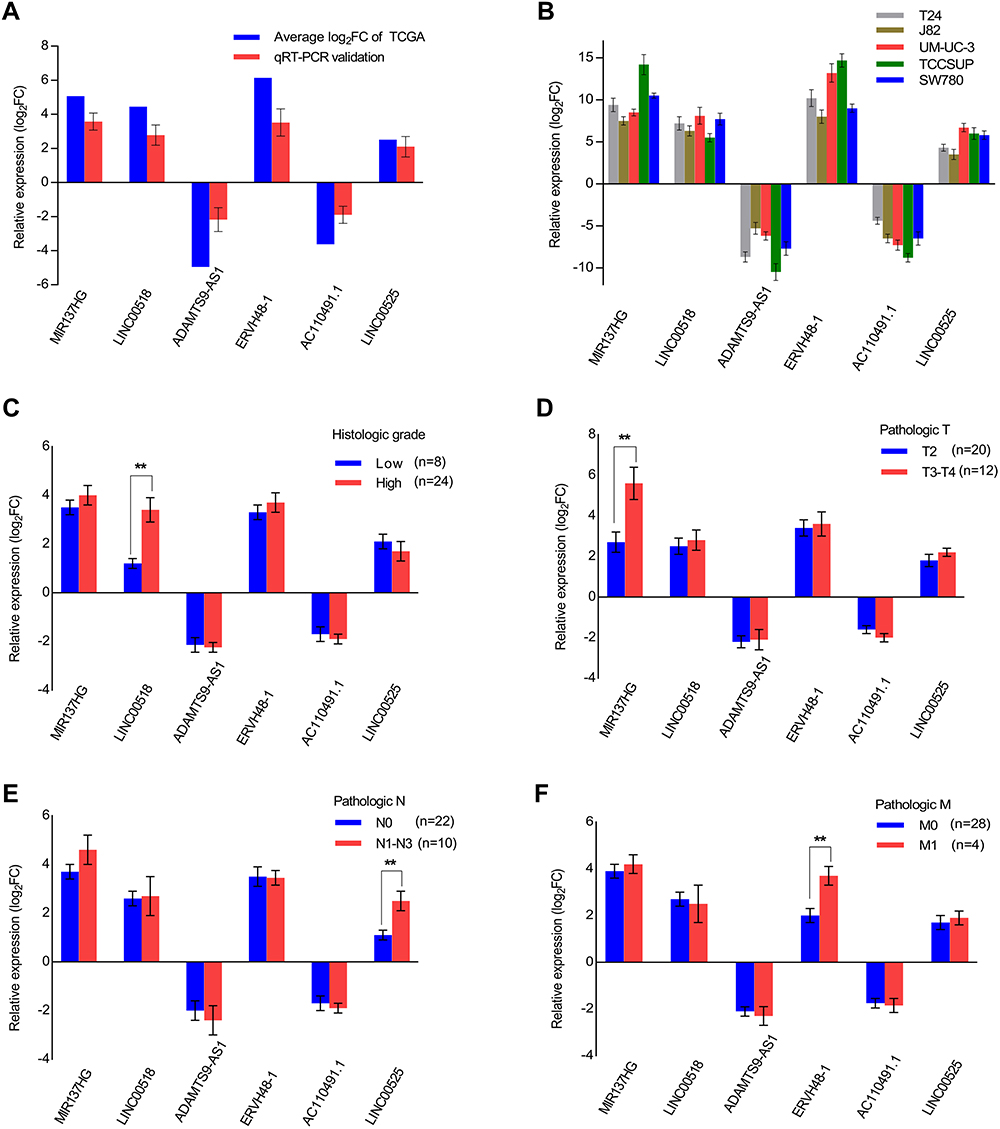 |
Figure 8 Expression of 6 lncRNAs in relation to clinical features. (A) Comparison of the expression levels of 6 lncRNAs (MIR137HG, LINC00518, ADAMTS9-AS1, ERVH48-1, AC110491.1 and LINC00525) between the TCGA and qRT-PCR results from 32 MIBC samples; (B) Detection of the expression levels of the 6 lncRNAs using qRT-PCR in 5 bladder cancer cell lines (T24, J82, UM-UC-3, TCCSUP and SW780); (C–F) Association between the expression of the 6 lncRNAs and clinical features in 32 MIBC samples. Data are expressed as the means ± SDs of triplicate measurements, **P<0.01. Abbreviations: MIBC, Muscle-invasive bladder cancer; qRT-PCR, Quantitative real-time polymerase chain reaction. |
Discussion
Based on accumulating evidence, lncRNAs play central roles in cancer development and progression. Notably, lncRNAs can regulate various BPs, including cell proliferation, apoptosis, invasion, immune response and development.17–20 Although the exact mechanism is unclear, an increasing number of researchers have focused on ceRNA coexpression networks in which lncRNAs may affect the expression of protein-coding genes by interacting with miRNAs. Recent studies have confirmed several potential ceRNAs in various human tumors, such as renal cell carcinoma, lung adenocarcinoma, hepatocellular carcinoma and gastric cancer.21–24 Zhang et al25 revealed significant correlations between the expression of 3 key lncRNAs (LINC00355, HULC and IGF2-AS) and clinical features of human colon adenocarcinoma. Sui et al26 revealed correlations between the expression of 5 cancer-specific lncRNAs (BCRP3, LINC00472, CHIAP2, BMS1P20 and UNQ6494) and OS in patients with lung adenocarcinoma and confirmed that the 5 lncRNAs were independent predictors of prognosis using a univariate Cox regression analysis. However, the potential function of the ceRNA network in MIBC is still poorly understood.
In the present study, we first identified 263 lncRNAs, 115 miRNAs and 1,136 mRNAs that were aberrantly expressed in tumor stages II~IV of MIBC according to data from TCGA. Using GO and KEGG analyses, we determined the functions and signaling pathways in which these aberrantly expressed mRNAs were involved. Subsequently, we used bioinformatics tools to establish a ceRNA coexpression network with 30 lncRNAs, 13 miRNAs and 32 mRNAs. We further analyzed the correlations between lncRNAs and mRNAs in the ceRNA network. We also investigated the relationships between the lncRNAs that were involved in the ceRNA network and clinical features and identified 1 key lncRNA from the ceRNA network that was related to OS. These results were verified in MIBC tissue samples from 32 patients and 5 bladder cancer cell lines (T24, J82, UM-UC-3,TCCSUP and SW780) using qRT-PCR.
The GO and KEGG pathway analyses of the 1,136 intersecting mRNAs identified the important BPs and pathways in MIBC, most of which were classic pathways and BPs that play critical roles in bladder cancer, such as transcriptional misregulation in cancer, the MAPK signaling pathway, and the cell cycle. Interestingly, some of the other novel BPs and pathways involved in MIBC progression and development, such as muscle system processes, DNA packaging complexes, calcium signaling pathways and protein digestion, supplemented the findings of previous studies.
Based on the ceRNA hypothesis, we selected the lncRNAs, miRNAs and mRNAs that were aberrantly expressed in MIBC to construct a MIBC ceRNA network using bioinformatics tools (miRcode, TargetScan, Starbase and miRDB). This ceRNA network provided considerable information to improve our understanding of the key role of lncRNA-mediated gene regulatory networks in MIBC development. From the ceRNA network, we ultimately identified 30 lncRNAs, 13 miRNAs and 32 mRNAs that formed a complex network. For example, mRNAs such as ZEB1, TGFBR3, E2F7 and HOXC13 were regulated by multiple lncRNAs (LINC00525, MIR137HG and HCG22) through a pathway mediated by miRNAs (miR-141-3p, miR-31-5p and miR-195-5p). These results were consistent with the GO and KEGG enrichment analyses, suggesting that transcriptional misregulation in cancer is involved in MIBC progression. Moreover, the results from the ceRNA network also revealed that 2 downregulated lncRNAs (AC110491.1 and ADAMTS9-AS1) were positively correlated with the expression of 3 tumor suppressor protein-coding genes (AKAP12, EPHA7 and TMEM100). A-kinase anchoring protein 12 (AKAP12) is a kinase scaffold protein with known tumor suppressor activity that is involved in the development and progression of a variety of tumors.27 AKAP12 expression is downregulated in prostate cancer, colon cancer and hepatocellular carcinoma (HCC), and the downregulated expression of AKAP12 is associated with a poor prognosis and high recurrence rates after treatment.28 EPHA7 is a member of the tyrosine kinase receptor family that exerts negative effects on cancer cell proliferation, migration, and adhesion, depending on the presence of membrane-bound ephrin ligands and coreceptors.29 According to Li et al30, the downregulation of EPHA7 suppresses prostate cancer malignancy by targeting the PI3K/Akt signaling pathway. TMEM100 is a novel gene that was first identified as a transcript from the mouse genome in 2001.31 TMEM100 was recently shown to inhibit the proliferation of lung cancer cells, and TMEM100 may function as a novel tumor suppressor gene in HCC proliferation and metastasis.32,33 According to the aforementioned conclusion, we speculated that AC110491.1 and ADAMTS9-AS1 might function as tumor suppressors in MIBC, as AKAP12, EPHA7 and TMEM100 were coexpressed with AC110491.1 and ADAMTS9-AS1, and this coexpression was mediated by miRNAs.
We then used a recently developed methodology to construct a weighted gene coexpression network and analyze the correlations between the expression of specific lncRNAs from the ceRNA network and several clinical features, such as age, gender, neoplasm histologic grade, tumor stage and pathologic TNM stage. Seventeen of 30 lncRNAs from the ceRNA network were significantly associated with clinical features. Twelve of these 17 lncRNAs were reported to be associated with cancer. For example, LINC00460, which is upregulated by CBP/P300, promotes carcinogenesis in esophageal squamous cell carcinoma.34 LINC00518 contributes to multidrug resistance in breast cancer.35 However, no report has described the correlation between MIBC and the expression of the aforementioned lncRNAs. Therefore, we analyzed the association between the expression of 17 clinical cancer feature-specific lncRNAs and OS, and we found that only MIR137HG was significantly associated with the OS of patients with MIBC. MIR137HG has been reported to be associated with the genetic basis of schizophrenia.36 Since previous studies have rarely reported the biological functions of MIR137HG in cancer, we further performed GO and KEGG enrichment analyses of the mRNAs that were coexpressed with MIR137HG to explore the functions of MIR137HG. MIR137HG may function as an oncogene in MIBC by regulating epithelial cell differentiation, cytokine production, the PPAR signaling pathway and TNF signaling pathway. In our study, we predicted that miR-31-5p was targeted by MIR137HG based on the analysis using miRcode. Meanwhile, the results from the TargetScan, Starbase and miRDB databases further revealed that miR-31-5p targeted the 3ʹ untranslated regions (3ʹUTR) of HOXC13 (Figure 5). Based on this findings, MIR137HG/miR-31-5p/HOXC13 may represent a ceRNA network that is involved in the tumorigenesis of MIBC. Recently, miR-31 was shown to play dual roles in tumor development. Lv et al37 reported that miR-31 functions as a oncomiR to promote breast cancer formation by regulating the TGFβ and Wnt/β-catenin signaling pathways. However, Creighton et al38 observed anti-proliferative and pro-apoptosis effects of miR-31 on prostate cancer, osteosarcoma and ovarian cancer. Thus, miR-31 might regulate different biological processes in different cancers, depending on the cellular origin of the tumor. HOXC13, a member of the homeobox HOXC gene family, has been reported to correlate with the development of cancers such as colon cancer,39 esophageal squamous cell carcinoma40 and skin tumors.41 HOXC13 promotes proliferation and inhibits apoptosis in cancers by regulating numerous biological processes and signaling pathways, including the EMT42 and TNF signaling pathway.43 Based on this indirect evidence, MIR137HG functions as an lncRNA-associated ceRNA to promote the progression of MIBC by regulating the expression of miR-31-5p and HOXC13. Because the development of cancer is a complex biological process correlated with multiple genes, the functions of MIR137HG will be further verified in vivo and in vitro in our future research.
Finally, we randomly selected 6 lncRNAs from the ceRNA network (MIR137HG, LINC00525, AC110491.1, ERVH48-1, LINC00518 and ADAMTS9-AS1) and detected their expression in 32 paired MIBC tissue samples and 5 bladder cancer cell lines using qRT-PCR to validate the findings from our bioinformatics analysis. We also analyzed the correlations between the expression of the 6 lncRNAs and clinical features. The expression data from TCGA were highly consistent with the results of the verification experiment using separate MIBC tissue samples and bladder cancer cell lines. These results further support the conclusions based on our bioinformatics analysis.
Conclusions
In the present study, we successfully identified numerous potential prognostic genes and determined their functions and the signaling pathways in which they participate in MIBC. Moreover, we constructed an lncRNA-miRNA-mRNA ceRNA regulatory network to explore the potential roles of lncRNAs in MIBC. Importantly, we further studied the correlation between these key lncRNAs and clinical features, which might serve as a reference for future research. Our findings provide novel insights into and a better understanding of the lncRNA-associated ceRNA network in MIBC. Further studies are needed to completely elucidate the effects of these genes on the development of bladder cancer.
Acknowledgments
This study was supported by grants from the National Natural Science Foundation of China (81502204), the Hubei Province Nature Science Foundation of China (2014CFB399) and Wuhan Clinical Medical Research of China (WX14A01).
Disclosure
The authors report no conflicts of interest in this work.
References
1. Chen W, Zheng R, Baade PD, et al. Cancer statistics in China, 2015. CA Cancer J Clin. 2016;66(2):115–132. doi:10.3322/caac.21338
2. Kaufman DS, Shipley WU, Feldman AS. Bladder cancer. Lancet. 2009;374(9685):239–249. doi:10.1016/S0140-6736(09)60491-8
3. Chou R, Selph SS, Buckley DI, et al. Treatment of muscle-invasive bladder cancer: a systematic review. Cancer. 2016;122(6):842–851. doi:10.1002/cncr.29843
4. Seiler R, Ashab HAD, Erho N, et al. Impact of molecular subtypes in muscle-invasive bladder cancer on predictingresponse and survival after neoadjuvant chemotherapy. Eur Urol. 2017;72(4):544–554. doi:10.1016/j.eururo.2017.03.030
5. Bartonicek N, Maag JL, Dinger ME. Long noncoding RNAs in cancer: mechanisms of action and technological advancements. Mol Cancer. 2016;15(1):43. doi:10.1186/s12943-016-0530-6
6. Dykes IM, Emanueli C. Transcriptional and post-transcriptional gene regulation by long non-coding RNA. Genomics Proteomics Bioinformatics. 2017;15(3):177–186. doi:10.1016/j.gpb.2016.12.005
7. Nie FQ, Sun M, Yang JS, et al. Long noncoding RNA ANRIL promotes non-small cell lung cancer cell proliferation and inhibits apoptosis by silencing KLF2 and P21 expression. Mol Cancer Ther. 2015;14(1):268–277. doi:10.1158/1535-7163.MCT-14-0492
8. Peng F, Shi X, Meng Y, et al. Long non-coding RNA HOTTIP is upregulated in renal cell carcinoma and regulates cell growth and apoptosis by epigenetically silencing of LATS2. Biomed Pharmacother. 2018;105:1133–1140. doi:10.1016/j.biopha.2018.06.081
9. Han YJ, Boatman SM, Zhang J, et al. LncRNA BLAT1 is upregulated in basal-like breast cancer through epigenetic modifications. Sci Rep. 2018;8(1):15572. doi:10.1038/s41598-018-33629-y
10. Pastori C, Kapranov P, Penas C, et al. The bromodomain protein BRD4 controls HOTAIR, a long noncoding RNA essential for glioblastoma proliferation. Proc Natl Acad Sci USA. 2015;112(27):8326–8331. doi:10.1073/pnas.1424220112
11. Pan J, Li X, Wu W, et al. Long non-coding RNA UCA1 promotes cisplatin/gemcitabine resistance through CREB modulating miR-196a-5p in bladder cancer cells. Cancer Lett. 2016;382(1):64–76. doi:10.1016/j.canlet.2016.08.015
12. Hu XY, Hou PF, Li TT, et al. The roles of Wnt/beta-catenin signaling pathway related lncRNAs in cancer. Int J Biol Sci. 2018;14(14):2003–2011. doi:10.7150/ijbs.27977
13. Salmena L, Poliseno L, Tay Y, Kats L, Pandolfi PP. A ceRNA hypothesis: the Rosetta Stone of a hidden RNA language? Cell. 2011;146(3):353–358. doi:10.1016/j.cell.2011.07.014
14. Zheng P, Yin Z, Wu Y, Xu Y, Luo Y, Zhang TC. LncRNA HOTAIR promotes cell migration and invasion by regulating MKL1 via inhibition miR206 expression in HeLa cells. Cell Commun Signal. 2018;16(1):5. doi:10.1186/s12964-018-0216-3
15. Wu M, Huang Y, Chen T, et al. LncRNA MEG3 inhibits the progression of prostate cancer by modulating miR-9-5p/QKI-5 axis. J Cell Mol Med. 2019;23(1):29–38. doi:10.1111/jcmm.13658
16. Langfelder P, Horvath S. WGCNA: an R package for weighted correlation network analysis. BMC Bioinformatics. 2008;9:559. doi:10.1186/1471-2105-9-559
17. Sun M, Nie F, Wang Y, et al. LncRNA HOXA11-AS promotes proliferation and invasion of gastric cancer by scaffolding the chromatin modification factors PRC2, LSD1, and DNMT1. Cancer Res. 2016;76(21):6299–6310. doi:10.1158/0008-5472.CAN-16-0356
18. Misawa A, Takayama KI, Fujimura T, Homma Y, Suzuki Y, Inoue S. Androgen-induced lncRNA POTEF-AS1 regulates apoptosis-related pathway to facilitate cell survival in prostate cancer cells. Cancer Sci. 2017;108(3):373–379. doi:10.1111/cas.13151
19. Battistelli C, Cicchini C, Santangelo L, et al. The Snail repressor recruits EZH2 to specific genomic sites through the enrollment of the lncRNA HOTAIR in epithelial-to-mesenchymal transition. Oncogene. 2017;36(7):942–955. doi:10.1038/onc.2016.260
20. Imamura K, Akimitsu N. Long non-coding RNAs involved in immune responses. Front Immunol. 2014;5:573. doi:10.3389/fimmu.2014.00573
21. Liu G, Ye Z, Zhao X, Ji Z. SP1-induced up-regulation of lncRNA SNHG14 as a ceRNA promotes migration and invasion of clear cell renal cell carcinoma by regulating N-WASP. Am J Cancer Res. 2017;7(12):2515–2525. PMID: 29312804. Available from: https://www.ncbi.nlm.nih.gov/pubmed/29312804
22. Tang RX, Chen WJ, He RQ, et al. Identification of a RNA-Seq based prognostic signature with five lncRNAs for lung squamous cell carcinoma. Oncotarget. 2017;8(31):50761–50773. doi:10.18632/oncotarget.17098
23. Yue C, Ren Y, Ge H, et al. Comprehensive analysis of potential prognostic genes for the construction of a competing endogenous RNA regulatory network in hepatocellular carcinoma. Onco Targets Ther. 2019;12:561–576. doi:10.2147/OTT.S188913
24. Huang B, Song JH, Cheng Y, et al. Long non-coding antisense RNA KRT7-AS is activated in gastric cancers and supports cancer cell progression by increasing KRT7 expression. Oncogene. 2016;35(37):4927–4936. doi:10.1038/onc.2016.25
25. Zhang Z, Qian W, Wang S, et al. Analysis of lncRNA-associated ceRNA network reveals potential lncRNA biomarkers in human colon adenocarcinoma. Cell Physiol Biochem. 2018;49(5):1778–1791. doi:10.1159/000493623
26. Sui J, Li YH, Zhang YQ, et al. Integrated analysis of long non-coding RNAassociated ceRNA network reveals potential lncRNA biomarkers in human lung adenocarcinoma. Int J Oncol. 2016;49(5):2023–2036. doi:10.3892/ijo.2016.3716
27. Jin Z, Hamilton JP, Yang J, et al. Hypermethylation of the AKAP12 promoter is a biomarker of Barrett’s-associated esophageal neoplastic progression. Cancer Epidemiol Biomarkers Prev. 2008;17(1):111–117. doi:10.1158/1055-9965.EPI-07-0407
28. Wu X, Wu T, Li K, et al. The mechanism and influence of AKAP12 in different cancers. Biomed Environ Sci. 2018;31(12):927–932. doi:10.3967/bes2018.127
29. Prost G, Braun S, Hertwig F, et al. The putative tumor suppressor gene EphA7 is a novel BMI-1 target. Oncotarget. 2016;7(36):58203–58217. doi:10.18632/oncotarget.11279
30. Li S, Wu Z, Ma P, et al. Ligand-dependent EphA7 signaling inhibits prostate tumor growth and progression. Cell Death Dis. 2017;8(10):e3122. doi:10.1038/cddis.2017.507
31. Moon EH, Kim MJ, Ko KS, et al. Generation of mice with a conditional and reporter allele for Tmem100. Genesis. 2010;48(11):673–678. doi:10.1002/dvg.20674
32. Ou D, Yang H, Hua D, Xiao S, Yang L. Novel roles of TMEM100: inhibition metastasis and proliferation of hepatocellular carcinoma. Oncotarget. 2015;6(19):17379–17390. doi:10.18632/oncotarget.3954
33. Han Z, Wang T, Han S, et al. Low-expression of TMEM100 is associated with poor prognosis in non-small-cell lung cancer. Am J Transl Res. 2017;9(5):2567–2578. PMID:28560005.
34. Wang F, Liang S, Liu X, Han L, Wang J, Du Q. LINC00460 modulates KDM2A to promote cell proliferation and migration by targeting miR-342-3p in gastric cancer. Onco Targets Ther. 2018;11:6383–6394. doi:10.2147/OTT.S169307
35. Chang L, Hu Z, Zhou Z, Zhang H. Linc00518 contributes to multidrug resistance through regulating the MiR-199a/MRP1 axis in breast cancer. Cell Physiol Biochem. 2018;48(1):16–28. doi:10.1159/000491659
36. Wright C, Gupta CN, Chen J, et al. Polymorphisms in MIR137HG and microRNA-137-regulated genes influence gray matter structure in schizophrenia. Transl Psychiatry. 2016;6:e724. doi:10.1038/tp.2015.211
37. Lv C, Li F, Li X, et al. MiR-31 promotes mammary stem cell expansion and breast tumorigenesis by suppressing Wnt signaling antagonists. Nat Commun. 2017;8(1):1036. doi:10.1038/s41467-017-01059-5
38. Creighton CJ, Fountain MD, Yu Z, et al. Molecular profiling uncovers a p53-associated role for microRNA-31 in inhibiting the proliferation of serous ovarian carcinomas and other cancers. Cancer Res. 2010;70(5):1906–1915. doi:10.1158/0008-5472.CAN-09-3875
39. Kasiri S, Ansari KI, Hussain I, Bhan A, Mandal SS. Antisense oligonucleotide mediated knockdown of HOXC13 affects cell growth and induces apoptosis in tumor cells and over expression of HOXC13 induces 3D-colony formation. RSC Adv. 2013;3(10):3260–3269. doi:10.1039/C2RA22006G
40. Luo J, Wang Z, Huang J, et al. HOXC13 promotes proliferation of esophageal squamous cell carcinoma via repressing transcription of CASP3. Cancer Sci. 2018;109(2):317–329. doi:10.1111/cas.13453
41. Battistella M, Carlson JA, Osio A, Langbein L, Cribier B. Skin tumors with matrical differentiation: lessons from hair keratins, beta-catenin and PHLDA-1 expression. J Cutan Pathol. 2014;41(5):427–436. doi:10.1111/cup.12313
42. Saha SS, Chowdhury RR, Mondal NR, Roy S, Sengupta S. Expression signatures of HOX cluster genes in cervical cancer pathogenesis: impact of human papillomavirus type 16 oncoprotein E7. Oncotarget. 2017;8(22):36591–36602. doi:10.18632/oncotarget.16619
43. Molino Y, Jabès F, Bonnet A, et al. Gene expression comparison reveals distinct basal expression of HOX members and differential TNF-induced response between brain- and spinal cord-derived microvascular endothelial cells. J Neuroinflammation. 2016;13(1):290. doi:10.1186/s12974-016-0749-6
 © 2019 The Author(s). This work is published and licensed by Dove Medical Press Limited. The
full terms of this license are available at https://www.dovepress.com/terms
and incorporate the Creative Commons Attribution
- Non Commercial (unported, 3.0) License.
By accessing the work you hereby accept the Terms. Non-commercial uses of the work are permitted
without any further permission from Dove Medical Press Limited, provided the work is properly
attributed. For permission for commercial use of this work, please see paragraphs 4.2 and 5 of our Terms.
© 2019 The Author(s). This work is published and licensed by Dove Medical Press Limited. The
full terms of this license are available at https://www.dovepress.com/terms
and incorporate the Creative Commons Attribution
- Non Commercial (unported, 3.0) License.
By accessing the work you hereby accept the Terms. Non-commercial uses of the work are permitted
without any further permission from Dove Medical Press Limited, provided the work is properly
attributed. For permission for commercial use of this work, please see paragraphs 4.2 and 5 of our Terms.