Back to Journals » Journal of Inflammation Research » Volume 19
Integrating Single-Cell and Microarray Data to Explore the Role of Autophagy-Related Gene Atg7 in Osteoporosis
Authors Lin Z, Cheng Y ![]() , Tang Q, Zheng H, Li H, Lian Y
, Tang Q, Zheng H, Li H, Lian Y ![]()
Received 10 December 2025
Accepted for publication 15 March 2026
Published 20 March 2026 Volume 2026:19 579167
DOI https://doi.org/10.2147/JIR.S579167
Checked for plagiarism Yes
Review by Single anonymous peer review
Peer reviewer comments 2
Editor who approved publication: Dr Ujjwol Risal
Zhiyong Lin,1,* Yue Cheng,2,* Qianwen Tang,1 Hao Zheng,1 Huanji Li,1 Yongyun Lian1
1Department of Orthopedics, Fourth Affiliated Hospital of Harbin Medical University, Harbin, People’s Republic of China; 2Department of Cardiovascular Surgery, Fourth Affiliated Hospital of Harbin Medical University, Harbin, People’s Republic of China
*These authors contributed equally to this work
Correspondence: Yongyun Lian, Department of Orthopedics, Fourth Affiliated Hospital of Harbin Medical University, Harbin, People’s Republic of China, Email [email protected]
Purpose: Osteoporosis is a metabolic bone disorder characterized by reduced bone mass, impaired microarchitecture, and diminished bone strength, resulting in a significantly elevated risk of fractures. It is especially prevalent among older adults, particularly postmenopausal females, and profoundly impacts quality of life. In this study, we integrated osteoporosis-related single-cell RNA sequencing (scRNA-seq) and microarray datasets, to identify the autophagy-related gene ATG7, which is associated with osteoporosis.
Methods: By integrating single-cell transcriptomics with chip data, autophagy-related genes associated with osteoporosis were screened, and cell-cell interactions and developmental trajectories were explored using cell communication and pseudotime analysis. An ovariectomized (OVX) mouse model was established, and verification was performed using micro-CT and immunohistochemistry techniques. Dual-labeled three-color fluorescence technology was employed to further validate the pseudotime analysis results. Additionally, qRT-PCR, Western blot, and other experiments were conducted to assess the expression levels of related genes. Further, ATG7 was overexpressed in OVX mouse BMSCs to investigate its impact on the autophagy process and osteogenic marker proteins.
Results: Pseudotime trajectory analysis revealed a strong link between ATG7 expression and the EYA1 mesenchymal stem cell (MSC) subpopulation. The proportion of EYA1-positive cells and ATG7 expression decreased as osteoporosis progressed.MSCs isolated from OVX mice exhibited diminished expression of autophagy- and osteogenesis-related marker proteins compared to those from normal mice. ATG7 overexpression effectively restored the expression levels of these markers, suggesting its functional role in promoting autophagy and osteogenesis under OP conditions.
Conclusion: These findings highlight ATG7 as a critical regulator of MSC differentiation, suggesting that it may serve as a promising therapeutic target for osteoporosis. Modulation of autophagy pathways through ATG7 holds potential for future clinical applications in osteoporosis prevention and treatment.
Keywords: osteoporosis, autophagy, single-cell analysis, microarray data, pseudotime trajectory
A Letter to the Editor has been published for this article.
Introduction
Osteoporosis (OP) is the most common metabolic bone disease;1,2 it predominantly affects postmenopausal females,3 with an estimated global prevalence of 200 million individuals. It accounts for up to 8.9 million fractures annually,4 imposing a substantial economic burden worldwide.5 Characterized by reduced bone density and increased bone fragility,6,7 OP is projected to become increasingly prevalent owing to global population aging,8 escalating its societal impact. Although significant progress has been made in OP research, many aspects of its pathogenesis remain unclear and require further investigation. Among the various proposed mechanisms, estrogen deficiency is widely recognized as a central pathological factor underlying postmenopausal OP.9–11 Current clinical management strategies, such as bisphosphonates, estrogen replacement therapy, and calcitonin, are commonly used to prevent and treat OP.12–15 However, they often exhibit limited efficacy and are associated with adverse effects,16–18 raising concerns regarding their long-term safety.19 No definitive or curative treatments have yet been established.20,21 Investigating the molecular and regulatory mechanisms underlying OP is critical for optimizing existing treatments and developing safer and more effective therapeutic approaches.
Autophagy plays an essential role in bone metabolism. Previous studies have demonstrated that autophagy is crucial for maintaining homeostasis in bone MSC-derived lineages, including adipocytes, chondrocytes, osteoblasts, and osteocytes.22,23 Certain therapeutic agents have shown anti-OP effects by modulating autophagic activity.24,25 The protective effect of Gubi decoction on chondrocytes may involve inhibition of METTL3-dependent m6A methylation of ATG7, enhancing autophagy.26 Additionally, autophagy promotes the differentiation of human bone marrow mesenchymal stem cells (BMSCs) derived from OP vertebrae into osteoblasts,27 underscoring its emerging significance in OP research. As a key cellular mechanism for self-degradation and recycling, autophagy maintains intracellular homeostasis by removing damaged organelles, misfolded proteins, and metabolic waste products.28 In OP, autophagy is indispensable for the functional regulation of osteoblasts and osteoclasts, shaping the balance between bone formation and resorption.29
scRNA-seq provides unbiased, high-throughput, and high-resolution transcriptomic profiles at the individual cell level.30 It enables the identification of rare and complex cell populations, reveals regulatory gene networks, and maps the developmental trajectories of distinct lineages.31 With its exceptional resolution, scRNA-seq provides insights into dynamic cellular states and transitions,32 facilitating the discovery of previously overlooked cell subtypes and gene expression variations. This technology is particularly powerful for uncovering the cellular heterogeneity underlying OP pathogenesis and progression, offering a novel framework for advancing therapeutic strategies.
Although research on OP has advanced substantially in recent years, studies on autophagy hub genes remain limited. ATG7 is a core E1 enzyme involved in autophagy; its deficiency leads to impaired autophagic function in osteoblasts.33 Autophagy is essential for osteoblast differentiation, bone matrix synthesis, and bone mineralization. Impaired autophagic function directly affects bone formation and homeostasis, ultimately leading to decreased bone mass.34 ATG7 expression in bone marrow MSCs is significantly reduced in OP, and autophagic function is weakened compared to normal cells, hindering bone formation and mineralization. The core features of OP include weakened bone formation and enhanced bone resorption.35 When ATG7 expression is chronically low, bone formation is impaired, ultimately leading to OP. By leveraging scRNA-seq and microarray data, this study aimed to further characterize the OP-associated autophagy gene ATG7 and explore its potential role in OP.
Materials and Methods
Data Sources
The GSE169396, GSE253355, GSE35956, and GSE35958 datasets were obtained from the Gene Expression Omnibus (GEO) database. The GSE169396 cohort consisted of scRNA-seq data from three OP specimens, whereas the GSE253355 cohort included scRNA-seq data from one OP specimen and four normal control (NC) specimens. The GSE35956 dataset comprised bulk RNA-seq data from five OP and five NC specimens, whereas the GSE35958 dataset contained RNA-seq data from five OP and four NC specimens. For model development, GSE35956 was used as the training set, and GSE35958 served as the validation set. Thirty core autophagy-related genes were retrieved from the PathCard database. These data were anonymized and de-identified secondary data and did not contain any patient-identifiable information. According to Article 32, Paragraphs 1 and 2 of the “Regulations on Ethical Review of Human Life Science and Medical Research,”36 issued on February 18, 2023, by the National Health Commission of the People’s Republic of China, the Ministry of Education, the Ministry of Science and Technology, and the National Administration of Traditional Chinese Medicine, research using publicly available data obtained legally, or data generated through observation that does not interfere with public behavior, and research using anonymized information can be exempted from ethical review. Accordingly, this study did not require ethical approval. This study follows the Declaration of Helsinki.
scRNA-Seq Data Processing
scRNA-seq data were processed using the Seurat package (v5.1.0). Initial filtering was performed with minimum cells = 3 and minimum features = 200. Quality control criteria were applied to retain cells with 400 < nFeature_RNA < 6,000, mitochondrial gene expression < 20%, and ribosomal gene expression (ribo.mt) > 5%. Data normalization was conducted using the NormalizeData function, followed by the identification of 2,000 highly variable genes using the FindVariableFeatures function. The dataset was then scaled using ScaleData, principal component analysis was performed using RunPCA, and dimensionality reduction was carried out using both t-distributed stochastic neighbor embedding and uniform manifold approximation and projection (UMAP). Unsupervised clustering was subsequently conducted using the FindNeighbors and FindClusters functions, with the resolution parameter set to 0.5. Differentially expressed genes (DEGs) for each cluster were identified using the FindAllMarkers function, and the top ten marker genes per cluster were extracted. Cell type annotation was performed using the CellMarker 2.0 database (available at http://bio-bigdata.hrbmu.edu.cn/CellMarker or http://117.50.127.228/CellMarker/).
Differential Expression Analysis and Key Gene Screening
MSC subsets were isolated using the subset function. DEGs between OP and NC samples in the single-cell dataset were identified using the FindMarkers function in the Seurat package. In parallel, DEGs between the OP and NC samples in the bulk RNA-seq dataset GSE35956 were identified using the limma package. Subsequently, the DEGs of MSC populations from OP and NC specimens were obtained by integrating the scRNA-seq datasets GSE169396 and GSE253355, with significance thresholds set at adjusted p < 0.01. These DEGs were then intersected with those from the GSE35956 dataset, filtered using p < 0.05 and |log2FC| > 1. The overlapping genes were further compared with a set of 30 autophagy-related core genes to identify the key gene, ATG7. Finally, the expression level of ATG7 was validated using the GSE35958 dataset as an independent validation cohort, and a Venn diagram was generated using the VennDiagram package.
Functional Enrichment Analysis
Gene Ontology (GO, https://geneontology.org/) and Kyoto Encyclopedia of Genes and Genomes (KEGG, https://www.genome.jp/kegg/) databases37,38 were used. Gene set enrichment analysis (GSEA), along with KEGG and GO enrichment analyses, was performed using the clusterProfiler package, with the entire gene pool as the background.
Correlation Analysis
Gene expression matrices of MSC subpopulations were extracted from the Seurat object and aggregated to generate pseudo-bulk expression profiles. Given that pseudo-bulk data derived from single-cell transcriptomics typically do not follow a normal distribution, we performed a correlation analysis using the non-parametric Spearman rank correlation coefficient implemented via the cor function in R.
Cell Communication
Intercellular communication analysis was conducted using the R package CellChat. The annotated Seurat objects were first converted into CellChat objects and grouped accordingly. The identifyOverExpressed Genes function was used to identify the ligands and receptors with elevated expression levels in each cell type. Subsequently, the identifyOverExpressedInteractions function was used to detect signaling pathways with high expression levels across cell types. To assess the centrality and significance of these interactions, the netAnalysis_computeCentrality function was applied. Comparative analyses were performed between different groups, and the results were visualized using CellChat and ggplot2.
Pseudo-Temporal Analysis
To investigate the developmental transitions within specific cell subpopulations, we utilized the Monocle 2 package to reconstruct single-cell trajectories in a pseudo-temporal order. The Monocle object was initialized using the newCellDataSet function. Dimensionality reduction was performed using the reduceDimension function, followed by cell ordering along the pseudo-time axis using the OrderCell function. To identify highly variable genes, a differential expression analysis was conducted using the differentialGeneTest function. Subsequently, trajectory-based visualization and gene expression pattern analysis were performed using functions including plot_cell_trajectory, plot_genes_in_pseudotime, plot_genes_jitter, plot_genes_violin, and plot_genes_branched_heatmap.
Animal and Cell Experiments
Establishment of Mouse OP Model
Forty C57BL/6 mice (6–8 weeks old) were obtained from Liaoning Changsheng Biotechnology Co., Ltd., China. After 1 week of adaptive feeding in the animal facility of the Key Laboratory of Molecular Imaging at the Fourth Affiliated Hospital of Harbin Medical University, the mice were randomly assigned to the sham surgery (Sham) or ovariectomy (OVX) groups using a random number table, with 20 mice in each group. To avoid positional effects, mouse cages were randomly repositioned. Mice were anesthetized by intraperitoneal injection of 300 μL of tribromoethanol solution (Nanjing Aibei Biotechnology Co., Ltd.) before surgery. Once adequately anesthetized, a 0.5 cm bilateral incision was made approximately 1 cm below the top of the curved back and 0.6 cm lateral to the spine. In the OVX group, bilateral ovaries were removed after ligating the fallopian tubes under a microscope; the ovaries were exposed but not removed in the Sham group. The incisions were closed in layers using 4–0 absorbable sutures.
Mouse Femur Decalcification
Mouse femurs were harvested and fixed in 4% paraformaldehyde at room temperature for 24 h. Decalcification was performed using Sevier’s EDTA decalcification solution (0.5 M, pH 7.2) at room temperature, with the solution replaced daily. Decalcification was confirmed by probing the bone tissue with a fine needle; complete penetration indicated sufficient decalcification. After thorough rinsing with distilled water, the samples were subjected to graded ethanol dehydration, embedded in paraffin, and sectioned at a thickness of 3 μm for subsequent histological and immunohistochemical analyses.
Hematoxylin and Eosin (H&E) Staining
Paraffin-embedded sections were dewaxed and rehydrated using a graded series of ethanol. Nuclei were stained with hematoxylin and differentiated using 1% acid alcohol. Blueing was performed using a saturated lithium carbonate solution. Cytoplasmic staining was performed using eosin. The sections were then dehydrated using a graded ethanol series, cleared with xylene, and mounted using a neutral balsam mounting medium.
Masson’s Trichrome Staining
Paraffin sections were dewaxed and rehydrated as described above. Nuclei were stained with Weigert’s iron hematoxylin for 5 min (freshly prepared by mixing solutions A and B at a 1:1 ratio) and then rinsed under running water for 2 min. The sections were differentiated in 1% acidic alcohol for 3 s and blued in a lithium carbonate solution for 2 min, followed by a brief rinse. The cytoplasm and muscle fibers were stained with Ponceau fuchsin for 2 min and rinsed under running water for 15 min. Collagen fibers were differentiated with phosphomolybdic acid for 3 min, stained with aniline blue for 2 min, and briefly differentiated with 1% acetic acid. The slides were dehydrated in graded ethanol, cleared in xylene, and mounted using neutral balsam.
Immunohistochemistry
Paraffin-embedded sections were deparaffinized in xylene and rehydrated using graded ethanol, followed by antigen retrieval for ATG7 and heat-induced epitope retrieval for OPN (Proteintech, 30200-1-AP), Beclin 1 (Proteintech, 11306-1-AP), and Sp7/Osterix (Abcam, ab209484). After phosphate-buffered saline washes, sections were blocked at room temperature and washed again. Primary antibodies were applied according to the manufacturer’s datasheets (ATG7: Proteintech, 67341-1-Ig; others as indicated) and incubated under the recommended conditions, followed by PBS washes and incubation with the appropriate secondary antibodies Signals were developed with DAB, nuclei were counterstained with hematoxylin, briefly differentiated in 1% acid alcohol, and blued in lithium carbonate. The slides were dehydrated using graded ethanol, cleared in xylene, and mounted with neutral resin.
Micro-Computed Tomography (Micro-CT)
Micro-CT analysis of mouse femurs was performed using a VivaCT80 scanner (SCANCO Medical, Switzerland). Scanning parameters were set at a voltage of 55 kVp, current of 72 μA, power of 8 W, slice thickness of 9 μm, resolution set to native, continuous ROT scanning mode, exposure time of 500 ms, field of view radius of 31.0 mm, and bone mineral density calibration based on 1,200 mgHA/cm3 standard. A region of approximately 3 mm at the distal femur was selected as the region of interest for trabecular bone analysis. A threshold of 90–255 was applied to obtain the bone parameter indices, and 3D reconstruction was performed.
Acquisition and Culture of Primary BMSCs
Mice were euthanized by cervical dislocation under deep anesthesia. After euthanasia, the femurs and tibias were aseptically harvested and briefly immersed in 75% ethanol for surface sterilization, followed by rinsing with PBS. The epiphyses were removed, and the bone marrow was flushed into a 50 mL centrifuge tube using complete medium. The resulting suspension was filtered through a 70 μm cell strainer and centrifuged. After red blood cell lysis using RBC lysis buffer (Solabia), the cells were resuspended in complete culture medium consisting of α-MEM (Gibco) supplemented with 10% fetal bovine serum (Gibco) and 1% penicillin-streptomycin (Beyotime). Cells were seeded in T25 culture flasks and incubated at 37 °C in a humidified atmosphere containing 5% CO2. The first medium was replaced at 72 h after seeding. Once the cells reached approximately 80% confluence, they were subcultured in a 1:3 ratio.
Immunofluorescence Staining with Double-Labeled Antibodies
BMSCs were seeded onto gelatin-coated 24-well slides at a density of 8×10⁵ cells/mL and cultured at 37 °C until approximately 80% confluence was reached. The cells were fixed with 4% paraformaldehyde (Biosharp) for 15 min, permeabilized with Triton X-100 (Solabao) for 30 min, and blocked with 5% goat serum (Solabao). Primary antibodies against ATG7 (Proteintech, 67341-LG, 1:200) and EYA1 (Proteintech, 22658-1-AP, 1:100) were applied and incubated overnight at 4 °C. After washing with PBST, the cells were incubated with fluorescent secondary antibodies (Abclone; FITC-conjugated anti-mouse IgG and Cy3-conjugated anti-rabbit IgG, 1:500) for 1 h at room temperature in the dark. Nuclei were counterstained with DAPI (Solabao), and the slides were sealed. Imaging was performed using a confocal laser-scanning microscope. The laser excitation settings for confocal fluorescence imaging were 543 nm (red channel) at 6.0% laser power, 488 nm (green channel) at 6.0% laser power, and 405 nm (blue channel) at 2.6% laser power.
Transfection with Autophagy Double-Labeled Adenovirus (HBAD-mCherry-EGFP-LC3)
BMSCs were seeded into gelatin-coated 24-well plates at a density of 5×10⁵ cells/mL. When cells reached 30%–50% confluence, they were transduced with HBAD-mCherry-EGFP-LC3 adenovirus (Han Heng Biology) at a multiplicity of infection of 300 in the presence of polybrene (8 μg/mL). Cells were incubated at 37 °C for 4 h, after which the transduction medium was replaced with complete culture medium. After an additional 16 h of incubation, the medium was refreshed, and the cells were cultured for a further 36–48 h. The cells were fixed with 4% paraformaldehyde, mounted with an anti-fade sealing reagent, and imaged using a confocal laser scanning microscope. Autophagic flux was evaluated by quantifying the mCherry-EGFP-LC3 puncta.
Sample Preparation for Transmission Electron Microscopy
The cell pellets were fixed overnight at 4 °C in 2.5% glutaraldehyde, followed by post-fixation with 1% osmium tetroxide for 2 h at room temperature. Samples were then rinsed with 0.1 M PBS (pH 7.2) and dehydrated through a graded ethanol series (50%–100%), followed by acetone treatment. Subsequently, samples underwent infiltration with epoxy resin in two steps (acetone:embedding solution at ratios of 1:1 and then 1:3), and polymerization was carried out at 60 °C for 72 h. Ultrathin sections (50–60 nm) were prepared, stained with uranyl acetate and lead citrate, and examined under a transmission electron microscope.
Osteogenic Induction Culture
Bone marrow mesenchymal stem cells at passages three and four were cultured in osteogenic induction medium (OriCell, MUXMX-90021). The medium was refreshed every 2 days, and the cells were maintained for a total of 7 days. At the end of the induction period, the culture was terminated, and cellular proteins were extracted for subsequent analysis.
Protein Extraction and Western Blot Analysis
Total cellular proteins were extracted using RIPA lysis buffer (Solabao), and protein concentrations were determined using the BCA assay (Beyotime). Equal amounts of protein (30 μg) were separated by SDS-PAGE on a 10% gel and transferred onto PVDF membranes (Millipore). Membranes were blocked with 5% skimmed milk (Biofroxx) for 1 h at room temperature, followed by overnight incubation at 4 °C with primary antibodies, including anti-β-actin (Proteintech, 20536-1-AP, 1:200,000) and anti-ATG7 (Proteintech, 67341-1-Lg, 1:10,000). After washing, membranes were incubated with horseradish peroxidase-conjugated secondary antibodies (Proteintech) for 1 hour at room temperature. Protein bands were visualized using an enhanced chemiluminescence reagent (Biosharp) and captured using a chemiluminescence imaging system.
Quantitative Reverse-Transcription PCR
Total RNA was extracted from cells using TRIzol (Invitrogen), and reverse transcription was performed using a complementary DNA synthesis kit (TaKaRa, FSQ-101) following the manufacturer’s instructions. Quantitative reverse-transcription PCR was performed using a SYBR Green PCR kit (Xinbei) on a real-time PCR detection system. Primer sequences were verified for specificity by alignment using the NCBI database and were synthesized by Beijing Ruibo Xingke Biotechnology Co., Ltd., China. Relative gene expression levels were calculated using the 2^−ΔΔCt method. The primers used were Mouse Atg7-F (TCCTGAGAGCATCCCTCTAAT), Mouse Atg7-R (GGCTCGACACAGATCATCATAG), Mouse b-actinF (GGACCTGACAGACTACCTCAT), and Mouse b-actinR (GCTCGAAGTCTAGAGCAACATAG).
Statistical Analysis
Data analysts were blinded to the experimental groups to ensure objectivity and result reliability. Each experiment was independently repeated thrice, with three technical replicates per group. Normality tests were first conducted to compare the two sets of data. If the data were normally distributed, a two-tailed unpaired Student’s t-test was used; if they were not, a nonparametric test was employed. To compare three or more groups, normality tests were first conducted; if the data were normally distributed, one-way analysis of variance (ANOVA) was used, while two-way ANOVA was employed if multiple factors were involved. Non-parametric tests were used when the data were not normally distributed. Statistical analysis was performed using GraphPad Prism (version 9.0), with statistical significance set at P-value < 0.05.
Results
Comprehensive Analysis of scRNA-Seq Data
We performed a systematic analysis of scRNA-seq datasets downloaded from GEO to explore the potential role of autophagy-related genes in OP. The datasets used included GSE169396 and GSE253355, which collectively consisted of four OP samples and four NC samples. Figure 1A shows the UMAP clustering plot of single cells after uniform processing. Ten distinct cell populations were identified: plasma cells, B cells, MSCs, endothelial cells, monocytes, hematopoietic stem (HSC) and progenitor cells, vascular smooth muscle cells, T cells, macrophages, and myeloid cells. MSCs were further subdivided into five subgroups: EYA1, chondrogenic, CXCL12, PLA2G2A, and osteoblast cells. Figure 1B illustrates the spatial distribution differences of cells between the OP and NC groups in the UMAP projection.
 |
Figure 1 Comprehensive analysis of scRNA-seq data. (A) UMAP clustering plot depicting ten distinct cell populations identified from single-cell data, including subpopulations within the MSC cluster. (B) UMAP GroupPlot illustrating the spatial distribution of cells in the osteoporotic and NC groups. (C) Density distribution plot of global autophagy levels at the single-cell level. (D) UMAP-based visualization of ATG7 gene expression, with color gradients representing expression levels in individual cells. (E) Violin plot showing differential expression of the ATG7 gene across various cell types. (F) Violin plot comparing autophagy-related expression levels between MSCs and the other nine cell populations. (G) Violin plot (replicated) displaying ATG7 gene expression differences among different cell populations. (H) Gene Ontology (GO) analysis results highlighting functional enrichment differences among the ten single-cell populations. (I) Cell proportion plots showing the distribution of the ten cell populations across eight single-cell samples. (J) Bar plots comparing the proportions of each cell type between the NC and OP groups. (K) Heatmap of marker gene expression across the ten identified cell populations. **p < 0.01, ***p < 0.001, ****p < 0.0001. Abbreviation: ns, no significant difference. |
A density distribution map of autophagy at the single-cell level was used to assess global autophagy levels (Figure 1C). ATG7 expression was also visualized based on UMAP (Figure 1D), as well as across different cell types (Figure 1E). Figure 1F displays a violin plot comparing the expression levels of autophagy-related genes between MSCs and other cell populations. ATG7 expression was significantly lower in the OP group than in the NC group (Figure 1G). GO functional enrichment analysis for each of the ten cell populations showed that each population was enriched in its characteristic biological pathways. MSCs (Figure 1H) were primarily enriched in key biological processes such as extracellular matrix (ECM) synthesis and remodeling, cell adhesion, migration, secretion function, and tissue repair, all of which are closely related to OP pathological progression.
Figure 1I shows the relative proportion of the ten cell populations in all eight single-cell samples, while Figure 1J compares the proportions of these cell populations between the OP and NC groups. The overall proportion of MSCs in the OP group was significantly lower than that in the NC group. Additionally, the proportion of MSCs in most OP samples was lower than that in the corresponding NC samples, which aligns with the known reduction in MSCs in OP. This suggests that the samples included in our study demonstrated strong biological consistency and reliability. Figure 1K presents the expression of marker genes for the ten identified cell populations.
Identification of Key Autophagy-Related Genes
In the GSE35956 dataset, 2,112 DEGs were identified by comparing OP and NC samples, comprising 1,836 upregulated and 276 downregulated genes. The corresponding volcano plots and heat maps visualizing these DEGs are shown in Figure 2A and D, respectively. Further single-cell transcriptomic analysis of MSC subsets revealed 2,149 DEGs, including 1,971 downregulated and 178 upregulated genes (Figure 2C). Intersection analysis was subsequently performed between 30 autophagy-related core genes and DEGs derived from both the GSE35956 dataset and single-cell MSC data (Figure 2B), resulting in the identification of ATG7 as a key candidate gene. Figure 2E shows the results of GO functional enrichment analysis for the GSE35956 dataset, while Figure 2F shows the GSEA plot.
 |
Figure 2 Identification of key autophagy-related genes. (A) Volcano plot of differentially expressed genes (DEGs). (B) Venn diagram showing the intersection of DEGs from the GSE35956 dataset, autophagy-related genes, and DEGs from the single-cell MSC population. (C) Volcano plot of DEGs identified in the MSC population from single-cell analysis. (D) Heatmap illustrating the expression patterns of selected DEGs. (E) GO enrichment analysis of DEGs. (F) Gene set enrichment analysis (GSEA) highlighting key biological pathways enriched in the MSC population. |
DEG Validation Set
The GSE35958 dataset was used as an independent validation cohort. A volcano plot and heat map illustrating the DEGs in this dataset are shown in Figure 3B and D, respectively. GO enrichment (Figure 3A), KEGG pathway enrichment (Figure 3C), and GSEA (Figure 3E) further supported the observations in the primary analysis. ATG7 expression was assessed in the validation cohort (Figure 3F), revealing significant downregulation in the OP group compared to the NC group. This consistent downregulation of ATG7 across the GSE35956, GSE35958, and single-cell MSC datasets underscores its potential relevance to OP pathogenesis.
 |
Figure 3 DEG validation set. (A) GO enrichment analysis of DEGs. (B) Volcano plot displaying significantly upregulated and downregulated genes. (C) Kyoto Encyclopedia of Genes and Genomes (KEGG) pathway enrichment analysis of DEGs. (D) Heatmap illustrating the expression patterns of selected DEGs. (E) GSEA plot showing key enriched pathways. (F) Violin plot depicting the expression differences of the ATG7 gene in the GSE35958 dataset. *p < 0.05. |
MSC Subgroup Analysis
The spatial distribution of the five MSC subpopulations is illustrated in Figure 4A, and the proportional composition of each subpopulation in the NC and OP groups is shown in Figure 4E. Figure 4B highlights the relative distributional differences of MSCs between the OP and NC groups. The spatial patterns of overall autophagy activity and ATG7 gene expression across MSCs, visualized using t-SNE dimensionality reduction,were presented in Figure 4C and D, respectively. Figure 4F and G further compare autophagy levels and ATG7 expression between the OP and NC groups within each of the five MSC subpopulations. Both autophagy activity and ATG7 expression were significantly reduced in the EYA1 subpopulation of the OP group compared to the NC group.
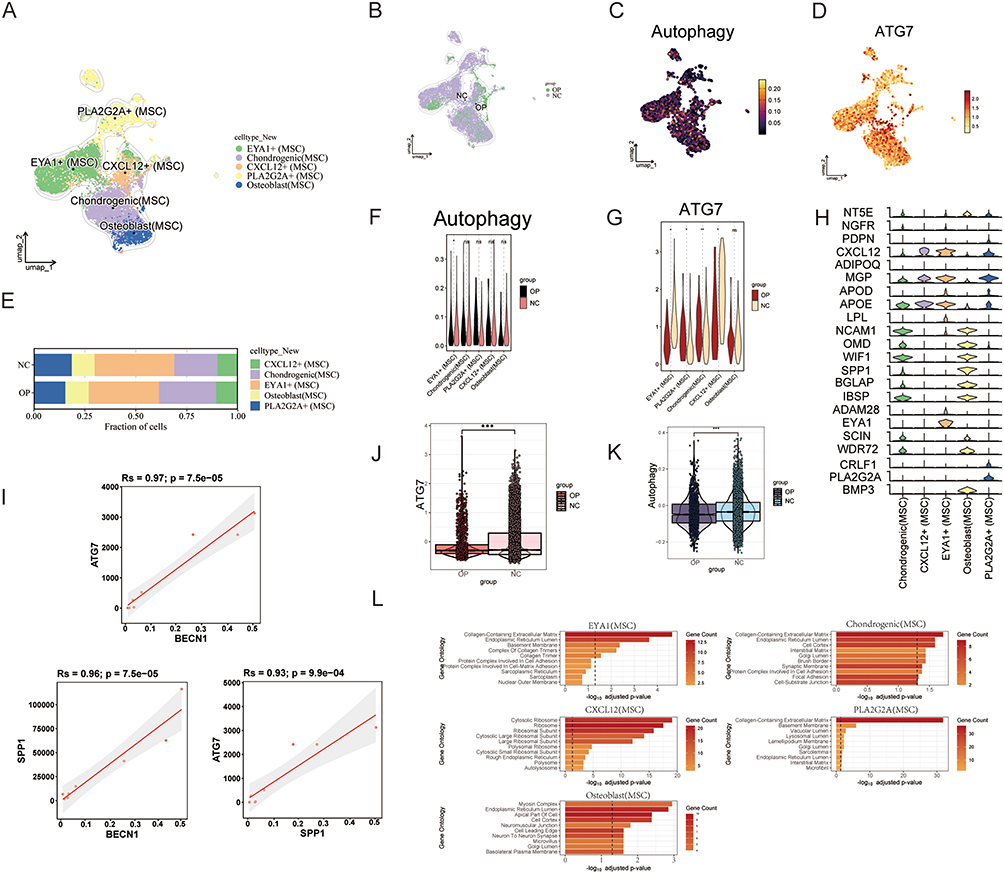 |
Figure 4 Analysis of MSC subgroups. (A) UMAP plot illustrating the spatial distribution characteristics of five MSC subsets. (B) UMAP comparison showing the distribution differences of MSCs between the osteoporosis group and the NC group. (C) t-SNE-based expression density plot displaying the spatial distribution of autophagy levels within the MSC population. (D) t-SNE-based expression density plot showing the spatial expression pattern of the ATG7 gene in the MSC population. (E) Bar plot depicting the proportion of each MSC subset in the OP and NC groups. (F) Violin plots comparing autophagy level expression between the OP and NC groups across five MSC subsets. (G) Violin plots comparing ATG7 gene expression between the OP and NC groups across five MSC subsets. (H) Heatmap showing the expression profiles of representative marker genes across the five MSC subsets. (I) Correlation plot illustrating the expression relationships among ATG7, BECN1, and SPP1 (OPN) in MSCs. (J) Violin plot displaying the overall expression differences of the ATG7 gene between the OP and NC groups. (K) Violin plot showing overall changes in autophagy levels in MSCs between the OP and NC groups. (L) GO enrichment analysis revealing biological process differences among the five MSC subsets. *p < 0.05,**p < 0.01, ***p < 0.001. Abbreviation: ns, no significant difference. |
Figure 4H displays the expression profiles of representative marker genes across the five MSC subpopulations, helping to define the phenotypic characteristics of each group. There was a positive correlation between the expression levels of ATG7, BECN1, and SPP1 (OPN) in MSCs (Figure 4I). BECN1 and SPP1 are key markers involved in autophagy and osteogenesis, respectively, suggesting that ATG7 may act as a regulatory link bridging autophagic activity and osteogenic differentiation in MSCs. At the population level, both ATG7 expression (Figure 4J) and overall autophagy activity (Figure 4K) were significantly reduced in the OP group relative to the NC group. GO functional enrichment analysis (Figure 4L) revealed distinct biological processes in the five MSC subpopulations; EYA1⁺ MSCs were significantly enriched in pathways related to collagen biosynthesis and ECM organization, indicating that this subpopulation may play a critical role in ECM production.
Cell-Cell Communication and Signaling Pathway Changes
Comparison of the cell–cell communication networks between the OP and NC groups (Figure 5A) showed that VISFATIN, MIF, and CXCL signaling dominated overall intercellular signaling, with information flow strengths significantly higher than those of the other pathways. Only VISFATIN was significantly downregulated in the disease group compared to the healthy group. We subsequently constructed cell–cell interaction networks among the single-cell subsets (Figure 5B), revealing intricate and robust communication networks among the various cell populations. Comparison of interaction frequency (Figure 5C) revealed that MSC subpopulations were identified as the primary signal recipients, whereas myeloid cells emerged as the dominant signal transmitters. Analysis of interaction intensity (Figure 5G) further confirmed that macrophages, mesenchymal cells, and myeloid cells acted as key signal receivers, with myeloid cells consistently serving as the principal transmitters.
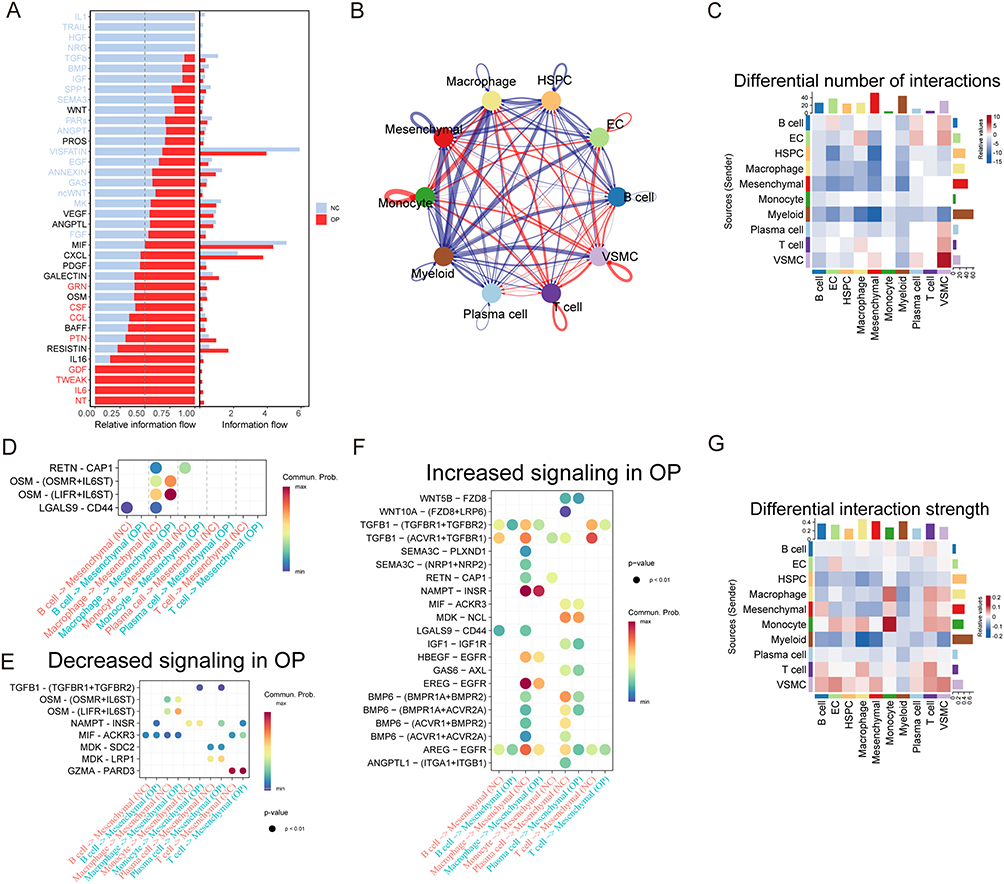 |
Figure 5 Analysis of cell-cell communication and signaling pathway changes. (A) Identification and visualization of signaling pathways in the NC and osteoporosis groups. (B) Cell–cell interaction network diagrams among ten single-cell populations. (C) Heatmap showing differences in the number of interactions among the ten cell populations. (D) Bubble plot illustrating ligand–receptor interaction pathways that are altered in the OP group compared with the NC group. (E) Bubble plot showing ligand–receptor interaction pathways significantly weakened in the OP group. (F) Bubble plot showing ligand–receptor interaction pathways significantly enhanced in the OP group. (G) Heatmap presenting differences in interaction intensities among the ten cell populations. |
Comparison of interactions between the five types of immune cells and MSCs across the NC and OP groups (Figure 5D) indicated that the most prominent alterations were observed in macrophage-MSC communication, particularly within OSM signaling. This involved ligand–receptor pairs such as OSM–OSMR+IL6ST and OSM–LIFR+IL6ST, both of which exhibited significant differences between the two groups. Among the downregulated ligand–receptor interactions in the OP group (Figure 5E), the most pronounced reductions were observed in the interactions between macrophages, plasma cells, and T cells with MSCs. In contrast, upregulated pathways (Figure 5F) were primarily characterized by enhanced interactions between macrophages and MSCs, and between plasma cells and MSCs.
MSC Subset Cell Communication
Examining interaction networks among the five MSC subpopulations revealed that the interaction between the EYA1 and osteoblast subsets was the most prominent outgoing signaling (Figure 6A). The EYA1 subset was further divided into high- and low-ATG7 expression groups, and separate cell–cell communication analyses were performed for the NC and OP groups. In the NC group, heatmap analysis (Figure 6B) showed that the osteoblast subset was the primary recipient of ligand–receptor signaling, and the high ATG7-expressing EYA1 subgroup received stronger incoming signals than the low expression group. In the OP group (Figure 6C), both the osteoblast and PLA2G2A subsets were identified as major signal recipients, while the high ATG7-expressing EYA1 subgroup exhibited greater signal reception compared to its low-expression counterpart. ANGPTL activity was predominant in the NC group, whereas the midkine (Mdk) pathway was dominant in the OP group. Ligand–receptor interaction analysis (Figure 6D and E) demonstrated that the FGF7–FGFR1 and CXCL12–ACKR3 pathways were key differential signaling routes between high ATG7-expressing EYA1 cells and low-expression osteoblasts in the NC group. In contrast, the CXCL12–ACKR3 pathway was the primary differential interaction in the OP group.
 |
Figure 6 Cell communication in MSC subsets. (A) Heatmap showing the intensity of cell–cell interactions among the five MSC subsets. (B) In the NC group, heatmaps of signaling intensity received by EYA1 cell subsets with high and low ATG7 expression, along with the remaining four MSC subsets. (C) In the osteoporosis group, heatmaps of signaling intensity received by EYA1 cell subsets with high and low ATG7 expression, along with the remaining four MSC subsets. (D) In the NC group, ligand–receptor interaction pathway changes between EYA1 subsets with high ATG7 expression and osteoblast subsets with low ATG7 expression. (E) In the OP group, ligand–receptor pathway changes between EYA1 subsets with high ATG7 expression and osteoblast subsets with low expression. (F) Cell–cell interaction network among the five MSC subpopulations. (G) Interaction network between the EYA1 subset and the other four MSC subsets. (H) In the NC group, interaction patterns between EYA1 subsets (with high and low ATG7 expression) and the other four MSC subsets. (I) In the NC group, interaction signal intensity between EYA1 subsets with high and low ATG7 expression. (J) In the OP group, interaction patterns between EYA1 subsets (with high and low ATG7 expression) and the other four MSC subsets. (K) In the OP group, interaction signal intensity between EYA1 subsets with high and low ATG7 expression. |
The comprehensive interaction network among MSC subpopulations (Figure 6F) and the focused interaction map centered on the EYA1 subset (Figure 6G) further highlighted the central role of EYA1 in MSC communication. High ATG7-expressing EYA1 cells exhibited significantly enhanced interactions with the other four MSC subtypes in the NC group (Figure 6H), particularly osteoblasts, compared to their low-expression counterparts (Figure 6I). A similar trend was observed in the OP group (Figure 6J and K), where high-expression EYA1 cells showed intensified interactions with osteoblasts and chondrogenic cells.
Pseudotemporal Trajectory Analysis
Based on the scRNA-seq data, we reconstructed the developmental trajectory of MSCs using a pseudo-temporal analysis (Figure 7A). Five key nodes representing potential pathways for MSC differentiation into distinct lineages were identified. We further categorized all MSCs into 11 developmental states (Figure 7B), outlining the sequential transitions that occurred during MSC development. Analysis of the distribution of the five MSC subpopulations along the trajectory (Figure 7C) showed that the EYA1 subset was predominantly enriched in the early stages, with its proportion gradually declining as pseudo-time progressed. ATG7 expression dynamics mirrored those of the EYA1 subset (Figure 7D), displaying high expression at early stages followed by a gradual decrease, suggesting a potential role of ATG7 in regulating the function of the EYA1 subpopulation and revealing distinct differences in MSC distribution patterns between the OP and NC groups (Figure 7E).
 |
Figure 7 Pseudotemporal trajectory analysis. (A) Pseudo-temporal trajectory of MSCs, illustrating a branched developmental structure with five key nodes; node 1 serves as the major bifurcation point leading toward osteogenic, chondrogenic, or adipogenic lineages. (B) Pseudo-temporal trajectory colored by different cellular states, reflecting dynamic transitions during MSC development. (C) Spatial distribution and evolutionary trajectories of the five MSC subpopulations along the pseudo-time axis. (D) Dynamic changes in ATG7 gene expression across the pseudo-temporal trajectory, indicating its potential involvement in lineage differentiation. (E) Comparative distribution of MSCs along the pseudo-time trajectory between the osteoporosis group and the NC group. (F) GO and KEGG functional enrichment analyses of the major differentiation branch represented by node 1, highlighting the predominant biological processes and signaling pathways. (G) Pseudo-temporal feature gene identification plot, used to screen representative dynamic genes that significantly change along the developmental trajectory. (H) Expression patterns of ATG7 across the pseudo-temporal trajectories of the five MSC subpopulations. |
Node 1 emerged as a critical branching point for differentiation into osteogenic, chondrogenic, or adipogenic lineages. We performed pseudotemporal heatmap clustering of the key genes expressed in node 1 (Figure 7F) and classified them into three gene clusters based on similarities in expression dynamics. GO and KEGG pathway enrichment analyses were subsequently conducted for each cluster, revealing that they were associated with distinct biological functions. The screened pseudo-temporal signature genes are presented in Figure 7G, further highlighting the involvement of dynamic regulatory genes in MSC development. Finally, we examined the pseudotemporal expression patterns of ATG7 across different MSC subpopulations (Figure 7H), revealing subgroup-specific differences in expression trends along the developmental timeline.
Histological, Masson’s Trichrome, Immunohistochemical, and Micro-CT Analyses of Femurs from Sham and OVX Mice
Micro-CT analysis (Figure 8A–D) revealed a significant reduction in trabecular bone volume and severe disruption of trabecular microarchitecture in the OVX group. Quantitative assessment (Figure 8E–G) further confirmed the successful establishment of the OP mouse model. To evaluate the model, femurs from the Sham and OVX groups were subjected to decalcification, histological staining, and imaging analysis. H&E (Figure 9A and D) and Masson’s trichrome staining (Figure 9B and E) showed reduced collagen fiber content and a disorganized trabecular structure in the OVX group, indicating impaired bone matrix integrity. Immunohistochemical analysis (Figure 9C,F,G–L) demonstrated that the expression levels of ATG7, Beclin1, OPN, and Sp7 were significantly decreased in femoral sections from OVX mice compared to those in the Sham group.
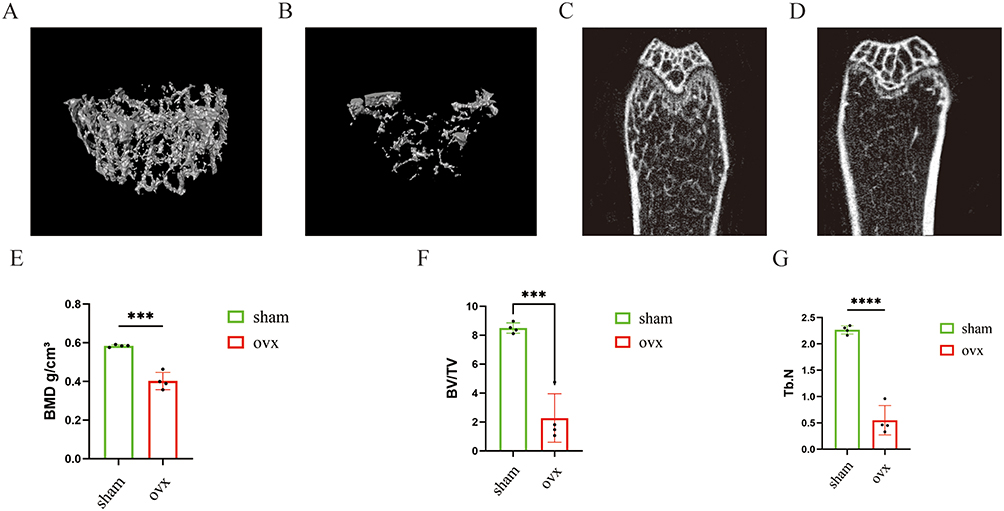 |
Figure 8 Micro-CT analysis of femurs from Sham and OVX mice. (A and B) Three-dimensional micro-CT reconstructions of trabecular bone. (C and D) Coronal micro-CT images of the femur. (E–G) Quantitative analyses of bone mineral density (BMD), bone volume fraction (BV/TV), and trabecular number (Tb.N). ***p < 0.001, ****p < 0.0001. |
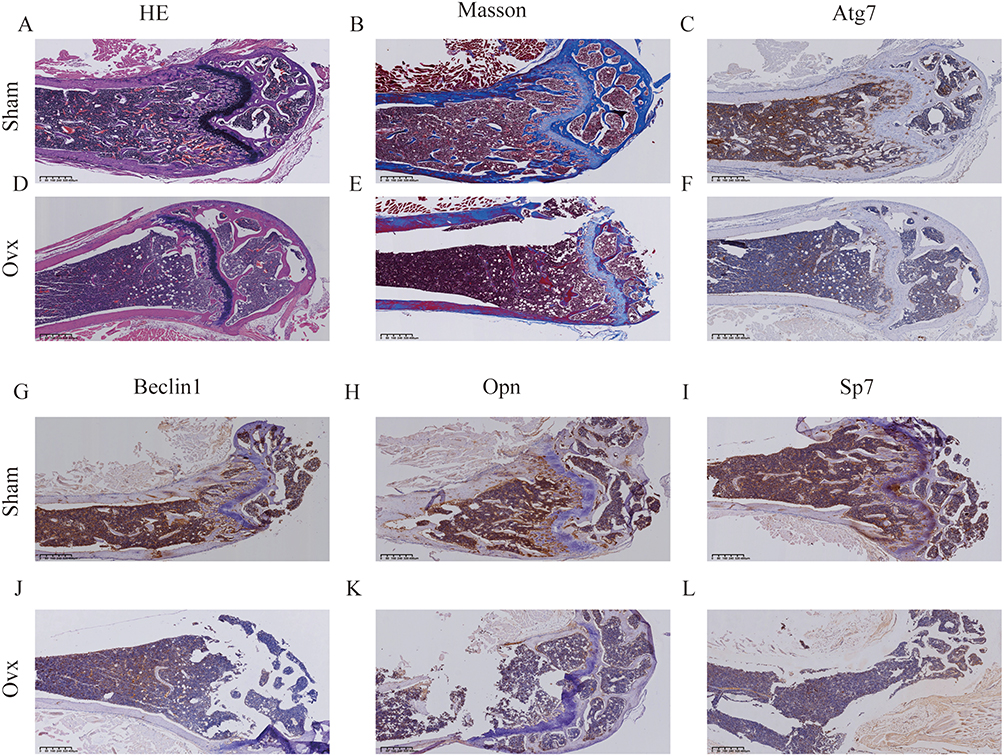 |
Figure 9 Histological, Masson’s trichrome, and immunohistochemical analyses of femurs from Sham and OVX mice. (A and D) Hematoxylin and eosin (H&E) staining of the femoral sections. (B and E) Masson’s trichrome staining of femoral sections. (C and F) Immunohistochemical staining of Atg7 in the femoral sections. (G and J) Immunohistochemical staining of Beclin1 in femoral sections. (H and K) Immunohistochemical staining of OPN in femoral sections. (I and L) Immunohistochemical staining of Sp7 in the femoral sections. |
Verification of Pseudo-Temporal Trajectories and Autophagy
We used a double-label, three-color immunofluorescence staining technique to analyze MSCs from mice in the Sham and OVX groups. Compared to the Sham group, the OVX group exhibited reduced fluorescence signals for both EYA1 and ATG7. Merged images revealed a clear overlap between the two signals, suggesting potential colocalization of EYA1 and ATG7 (Figure 10A). Quantitative analysis of fluorescence intensity further confirmed that the average signal levels of both markers were significantly decreased in the OVX group (Figure 10B).
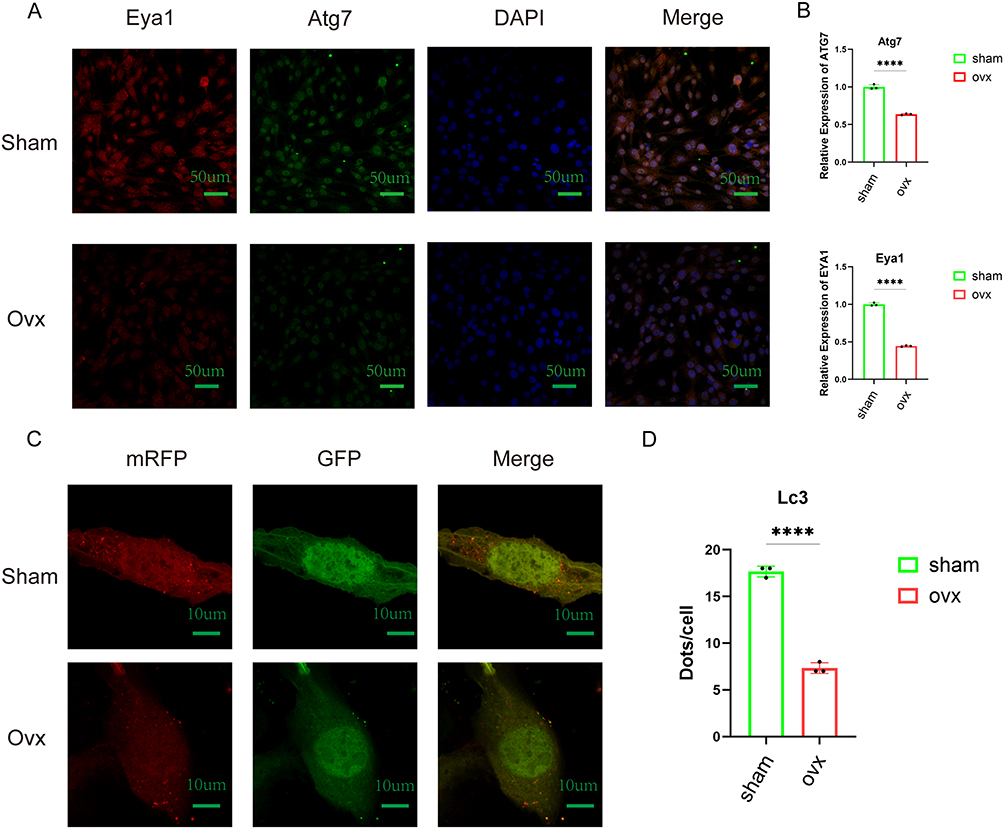 |
Figure 10 Verification of pseudo-temporal trajectories and autophagy. (A) The triple immunofluorescence staining of EYA1, ATG7, and DAPI was performed on MSCs from normal mice and OVX mice, showing the co-localization of EYA1 and ATG7. (B) Quantitative comparison of fluorescence signal intensities for EYA1 and ATG7. (C) Fluorescence imaging of LC3 autophagy dual-labeled adenoviral infection in MSCs derived from Sham and OVX mice. (D) Quantification of red fluorescent puncta (autophagosomes) in merged images and comparison of autophagy levels across different groups. ****p < 0.0001. |
To further investigate autophagic activity, MSCs from both groups were transfected with LC3 autophagy dual-labeled adenovirus. Fluorescence microscopy revealed a substantial reduction in the number of red fluorescent puncta in the merged images of the OVX group compared to the Sham group, indicative of reduced autophagosomes formation (Figure 10C). Quantitative analysis of the red puncta counts corroborated this finding, showing a significantly lower number of autophagosomes in the OVX group (Figure 10D).
Validation of Key Autophagy-Related Genes
Western blot analysis of MSCs from both groups of mice revealed that the protein expression levels of ATG7, Beclin1, and Opn were significantly reduced in the OVX group compared with those in the Sham group; quantitative grayscale analysis further confirmed the statistical significance of these differences (Figure 11A–E). In MSCs derived from the Sham group, OVX group, and OVX mice overexpressing ATG7, ATG7 overexpression significantly upregulated the expression of autophagy-related and osteogenic marker proteins (Figure 11F–J). Consistent with these findings, transmission electron microscopy revealed a substantial decrease in the number of autophagosomes and autolysosomes in cells from the OVX group compared to those from the Sham group (Figure 11K and L). mRNA expression analysis showed that the relative expression of ATG7 in OVX mice was significantly lower than that in Sham mice (Figure 11M).
 |
Figure 11 Validation of key autophagy-related genes. (A and B) Western blot analysis of MSCs from Sham and OVX mice. (C–E) Quantification of grayscale values for Atg7, Beclin1, and Runx2 proteins. (F and G) Western blot analysis of MSCs from the Sham group, OVX group, and OVX mice overexpressing ATG7. (H–J) Quantification of grayscale values for Atg7, Beclin1, and Runx2 proteins. (K and L) Transmission electron microscopy (TEM) images of MSCs from the Sham and OVX groups, with arrows indicating potential autophagosomes or autolysosomes. (M) Relative mRNA expression levels of the ATG7 gene in MSCs from the Sham and OVX mice. *p < 0.05,**p < 0.01, ***p <0.001, ****p < 0.0001. Abbreviations: ns, no significant difference. |
Discussion
Autophagy is a highly conserved, lysosome-dependent degradation pathway responsible for clearing damaged organelles and misfolded proteins, and plays a pivotal role in maintaining bone homeostasis. Recent studies have established a close link between autophagy dysfunction and OP onset and progression, primarily through its interference with osteoblast-mediated bone formation, osteoclast-mediated bone resorption, and overall regulation of bone homeostasis by osteoblasts.23 Several anti-OP agents, such as anagaponin BII, timosaponin BII, and TBII, exert therapeutic effects by modulating autophagic activity.39 TBII, a steroidal saponin extracted from the rhizome of the traditional Chinese medicinal herb Anemarrhena asphodeloides, enhances autophagy by regulating the mTOR/NF-κB signaling axis, mitigating high-glucose-induced osteoblast injury, and promoting bone formation. Despite substantial advances in OP research, the role of key regulatory genes in autophagy remains insufficiently explored.
In this study, scRNA-seq and microarray analyses were integrated to identify ATG7 as a core autophagy gene, suggesting its potential as both a biomarker and therapeutic target for OP. ATG7 encodes an E1-like ubiquitin-activating enzyme that is critical for autophagosome formation, LC3 lipidation (LC3-II conversion), and autophagosome membrane elongation.40 ATG7 expression is significantly reduced in the bone tissues of patients with primary OP compared to non-OP controls,41 a finding corroborated by both the scRNA-seq and microarray data in this study. Further validation using PCR and Western blot assays on MSCs from Sham and OVX mice confirmed decreased ATG7 expression in OP.
Autophagy-related proteins, such as BECN1, ATG5, and ATG7, are essential for osteoblast mineralization.23 In mice with conditional Atg7 deletion, primary osteoblasts exhibit mineralization defects;34,42,43 Atg7 overexpression can rescue this phenotype.33 ATG7 overexpression inhibits endoplasmic reticulum stress and apoptosis in chondrocytes, promoting their proliferation.44 The absence of Atg7 leads to acute bone loss and disruption of osteoblast homeostasis in HSCs, potentially due to a reduction in H-type vessels that connect osteocytes with HSCs.45 Correlation analysis at the single-cell level revealed that ATG7 expression in MSCs positively correlates with both the autophagy marker gene BECN1 and the osteogenesis-related gene SPP1 (OPN), implying that ATG7 may facilitate osteogenic differentiation through autophagy regulation. Among the 30 core autophagy genes analyzed, a general decline in autophagy activity was observed in the MSCs of patients with OP.
Comparing the intercellular communication patterns, the VISFATIN, MIF, and CXCL pathways dominated overall signal transduction. Compared with the healthy group, the expression of VISFATIN in the disease group was significantly reduced. However, the signal strength of these three pathways was higher than that of the other pathways, suggesting that they may play key regulatory roles in maintaining bone metabolism and immune homeostasis. Visfatin not only promotes osteoblast differentiation and metabolic activity46 but is also highly expressed in the human bone marrow,47 indicating its important role in regulating bone homeostasis. Specific genetic variations in visfatin expression are closely associated with changes in skeletal growth.48 Visfatin inhibitors can induce senescence in young rat bone marrow MSCs, whereas visfatin overexpression helps alleviate the senescence phenotype of aged rat bone marrow MSCs,49 highlighting its key role in bone metabolism and further indicating its potential impact on OP.
Inhibiting macrophage autophagy significantly enhances MIF secretion;50 research using demineralized bone matrix-ECM scaffolds has revealed that the lack of MIF significantly affects osteogenesis both in vitro and in vivo.51 These results suggest that MIF signaling may play a complex role in the pathological progression of OP through modulation of autophagy.
The CXCL chemokine family plays an important role in both autophagy and OP pathogenesis. CXCL1 promotes osteoblast differentiation and activity by inhibiting ferroptosis and enhancing autophagy through transforming growth factor (TGF)-β/SMAD signaling.52 CXCL10 is highly secreted by osteocytes in the inflammatory microenvironment53 and promotes the migration and maturation of osteoclast precursors, enhancing bone resorption. Additionally, the CX3CL1/CX3CR1 axis plays a significant role in osteoclast maturation and activity;54 its overactivation is closely associated with decreased bone density and OP progression. CXCL12 signaling recruits multipotent MSCs to the target site, promotes local angiogenesis, and stimulates osteogenic differentiation. When combined with alginate–BMP-2 plasmid DNA constructs for cell transplantation, CXCL12 demonstrated a synergistic effect on bone regeneration,55 making it a promising candidate for bone tissue engineering applications and further confirming its significant role in OP pathogenesis.
Cellular communication analysis revealed a significant enhancement in signaling interactions between macrophages, plasma cells, and MSCs, suggesting that the interaction between immune cells and MSCs may play a key regulatory role in OP development. Anti-inflammatory M2 macrophages secrete interleukin-10, which significantly promotes the osteogenic differentiation of MSCs,56 while pro-inflammatory M1 macrophages influence the osteogenic potential of MSCs through the cyclooxygenase-2-mediated prostaglandin E2 (PGE2) pathway.57 MSCs can also secrete PGE2 and TGF-β, inducing M2 macrophage polarization, forming a bidirectional feedback loop that maintains homeostasis in the bone marrow microenvironment.58 Plasma cells are the terminal differentiation products of B cells; although direct interactions between plasma cells and MSCs are limited, they may influence MSC differentiation through immunoglobulin and cytokine secretion, which is an area for future research. In our cellular communication heatmap, MSCs and myeloid cell populations emerged as key participants in OP pathogenesis. They were the main recipients of ligand-receptor interactions and are also involved in signal transduction, suggesting that MSCs may promote osteogenesis and bone repair by responding to external signals, while myeloid cells, particularly immune subtypes, may regulate the local immune-bone axis through signal transmission. These findings highlight the complexity of intercellular communication in the OP microenvironment and emphasize the central role of mesenchymal and myeloid cells in immune regulation and bone metabolism.
In the heat map generated from the cellular communication analysis, the signals received by the osteoblast subpopulation were significantly stronger than those received by the PLA2G2A subpopulation in the NC group. However, the signals received by these two subpopulations tended to converge in the OP group, indicating that the PLA2G2A subpopulation received more signal input under OP conditions. This finding supports the phenotypic changes observed in OP (enhanced adipogenesis and reduced osteogenesis)59,60 and suggests a role for PLA2G2A in OP pathogenesis.
The activation of ANGPTL signaling was highest in the NC group. ANGPTL4 plays a cytoprotective role in maintaining bone marrow MSC homeostasis.61 In contrast, the most significantly activated pathway in the OP group was Mdk signaling. Mdk knockout mice exhibit a high bone mass phenotype,62 and Mdk inhibitors can enhance bone formation in fracture healing areas,63 indicating that Mdk inhibition may be a therapeutic approach for low bone mass diseases such as OP.64 ANGPTL4 and Mdk exhibit different signaling dynamics under varying bone metabolic states; the former potentially contributes to bone homeostasis, whereas the latter is activated under OP conditions and may exacerbate bone loss, highlighting their complementary regulatory roles in bone metabolism.
Further analysis of cellular subpopulation interactions revealed that the EYA1 subpopulation had the strongest signaling effect on osteoblasts, a pattern consistently observed in both the NC and OP groups. EYA1 cells with high ATG7 expression exhibited stronger interactions with osteoblasts than those with low ATG7 expression, suggesting that ATG7 may enhance functional cross-talk between EYA1 cells and osteoblasts. Fibroblast growth factor 7 promotes dendritic extension and gap junction formation in osteoblasts by activating the FGFR1 receptor, contributing to bone formation.65
Overall, the communication pathways between EYA1 cells with high ATG7 expression and osteoblasts showed a close relationship with osteogenic signaling in both the NC and OP groups, further emphasizing the potential regulatory role of ATG7 in osteogenesis and its value as a candidate therapeutic target. Pseudo-time trajectory analysis revealed a positive correlation between the EYA1 subpopulation and ATG7 expression in the MSC differentiation pathway. As OP progressed, the proportion of EYA1 cells and ATG7 expression decreased. In the NC group, high ATG7 expression was particularly prominent in EYA1 cells. These results suggest that ATG7 expression is crucial for guiding MSC differentiation toward the osteogenic or chondrogenic lineage.
To further validate these findings, we established a mouse model of oophorectomy-induced OP and performed double-label three-color fluorescence staining to assess the expression levels of EYA1 and ATG7 in MSCs. Compared with the NC group, the fluorescence signals of EYA1 and ATG7 were markedly reduced in OVX mice. This observation was highly consistent with the results obtained from scRNA-seq, providing additional in vivo evidence for the regulatory roles of EYA1 and ATG7 in MSC differentiation and OP pathogenesis. MSCs isolated from OVX mice exhibited diminished expression of autophagy- and osteogenesis-related marker proteins compared to those from normal mice. ATG7 overexpression effectively restored the expression levels of these markers, suggesting its functional role in promoting autophagy and osteogenesis under OP conditions.
By integrating high-throughput sequencing data related to OP, this study identified ATG7 as a pivotal regulatory factor in autophagy. As a critical molecular bridge linking autophagy and bone metabolism, ATG7 plays a significant role in OP onset and progression; alterations in its expression may reflect pathological changes within the bone microenvironment, underscoring its potential utility as both a biomarker and a therapeutic target. This study employed a comprehensive analytical strategy that combined scRNA-seq with microarray data to validate and reinforce the mechanistic role of ATG7 in OP. This multi-omics integration approach effectively elucidates complex disease mechanisms. Future studies should investigate additional gene networks intricately associated with autophagy and bone metabolism. By incorporating functional validation and clinical sample analyses, such studies may enhance the theoretical framework and translational potential of precise diagnostic and therapeutic strategies for OP.
Conclusion
This study integrated OP-related single-cell and microarray data and successfully identified an autophagy-related genes associated with OP. ATG7 may contribute to OP onset and progression by modulating autophagic activity, highlighting its potential as both a biomarker and therapeutic target. By combining large-scale clinical data analyses with validation in animal models, future research may help establish a solid theoretical framework and generate compelling clinical evidence to support the development of precise OP therapies.
Data Sharing Statement
In this study, we analyzed publicly accessible datasets. All datasets were obtained from the GEO database (http://www.ncbi.nlm.nih.gov/geo).
Ethics Approval and Consent to Participate
All animal experiments were conducted in accordance with the ARRIVE guidelines (https://arriveguidelines.org/) and approved by the Animal Experimentation Ethics Committee of Harbin Medical University (Approval No. 2025-DWSYLLCZ-18). This study complied with all the relevant institutional and national regulations on the care and use of laboratory animals.
Acknowledgments
Our gratitude extends to all the researchers who contributed their data to the GEO database and facilitated this study.
Author Contributions
ZYL designed the study; ZYL, QWT, and YYL developed the methodology; ZYL, HZ, and HJL analyzed the data; YC and ZYL performed the experiments and wrote the manuscript; ZYL, QWT, and YYL revised the manuscript. All authors made a significant contribution to the work reported, whether that is in the conception, study design, execution, acquisition of data,analysis and interpretation, or in all these areas; took part in drafting, revising or critically reviewing the article; gave final approval of the version to be published; have agreed on the journal to which the article has been submitted; and agree to be accountable for all aspects of the work.
Funding
Financial support for this study was provided by the Special Research Project of the Fourth Affiliated Hospital of Harbin Medical University under grant number 202200086.
Disclosure
The authors declare that this research was conducted with no commercial or financial affiliations that might be interpreted as potential conflicts of interest.
References
1. Lin JT, Lane JM. Osteoporosis: a review. Clin Orthopaedics Related Res. 2004;425:126–22. doi:10.1097/01.blo.0000132404.30139.f2
2. Sözen T, Özışık L, Başaran N. An overview and management of osteoporosis. Eur J Rheumatol. 2017;4(1):46–56. doi:10.5152/eurjrheum.2016.048
3. Zhang X, Wang Z, Zhang D, et al. The prevalence and treatment rate trends of osteoporosis in postmenopausal women. PLoS One. 2023;18(9):e0290289. doi:10.1371/journal.pone.0290289
4. Pisani P, Renna MD, Conversano F, et al. Major osteoporotic fragility fractures: risk factor updates and societal impact. World J Orthopedics. 2016;7(3):171–181. doi:10.5312/wjo.v7.i3.171
5. Burge R, Dawson-Hughes B, Solomon DH, Wong JB, King A, Tosteson A. Incidence and economic burden of osteoporosis-related fractures in the United States, 2005-2025. J Bone Miner Res. 2007;22(3):465–475. doi:10.1359/jbmr.061113
6. Wu D, Li L, Wen Z, Wang G. Romosozumab in osteoporosis: yesterday, today and tomorrow. J Transl Med. 2023;21(1):668. doi:10.1186/s12967-023-04563-z
7. Compston JE, McClung MR, Leslie WD. Osteoporosis. Lancet. 2019;393(10169):364–376. doi:10.1016/s0140-6736(18)32112-3
8. Rachner TD, Khosla S, Hofbauer LC. Osteoporosis: now and the future. Lancet. 2011;377(9773):1276–1287. doi:10.1016/s0140-6736(10)62349-5
9. Crandall CJ, Larson J, Wright NC, et al. Serial bone density measurement and incident fracture risk discrimination in postmenopausal women. JAMA Intern Med. 2020;180(9):1232–1240. doi:10.1001/jamainternmed.2020.2986
10. Shih YV, Liu M, Kwon SK, et al. Dysregulation of ectonucleotidase-mediated extracellular adenosine during postmenopausal bone loss. Sci Adv. 2019;5(8):eaax1387. doi:10.1126/sciadv.aax1387
11. Tella SH, Gallagher JC. Prevention and treatment of postmenopausal osteoporosis. J Steroid Biochem Mol Biol. 2014;142:155–170. doi:10.1016/j.jsbmb.2013.09.008
12. Liu Y, Yu P, Peng X, et al. Hexapeptide-conjugated calcitonin for targeted therapy of osteoporosis. J Control Release. 2019;304:39–50. doi:10.1016/j.jconrel.2019.04.042
13. Lee S, Kim GJ, Kwon H, et al. Estrogenic effects of extracts and isolated compounds from belowground and aerial parts of Spartina anglica. Mar Drugs. 2021;19(4):210. doi:10.3390/md19040210
14. Hagino H, Sugimoto T, Tanaka S, et al. A randomized, controlled trial of once-weekly teriparatide injection versus alendronate in patients at high risk of osteoporotic fracture: primary results of the Japanese Osteoporosis Intervention Trial-05. Osteoporosis Int. 2021;32(11):2301–2311. doi:10.1007/s00198-021-05996-2
15. Shoback D, Rosen CJ, Black DM, Cheung AM, Murad MH, Eastell R. Pharmacological management of osteoporosis in postmenopausal women: an endocrine society guideline update. J Clin Endocrinol Metab. 2020;105(3):587–594. doi:10.1210/clinem/dgaa048
16. Choi D, Choi S, Chang J, Park SM. Exposure to oral bisphosphonates and risk of gastrointestinal cancer. Osteoporosis Int. 2020;31(4):775–782. doi:10.1007/s00198-020-05327-x
17. Zeytinoglu M, Naaman SC, Dickens LT. Denosumab discontinuation in patients treated for low bone density and osteoporosis. Endocrinol Metab Clin North Am. 2021;50(2):205–222. doi:10.1016/j.ecl.2021.03.004
18. Goldshtein I, Rouach V, Shamir-Stein N, Yu J, Chodick G. Role of side effects, physician involvement, and patient perception in non-adherence with oral bisphosphonates. Adv Ther. 2016;33(8):1374–1384. doi:10.1007/s12325-016-0360-3
19. Srinivasan A, Wong FK, Karponis D. Calcitonin: a useful old friend. J Musculoskelet Neuronal Interact. 2020;20(4):600–609.
20. Dimitriou R, Jones E, McGonagle D, Giannoudis PV. Bone regeneration: current concepts and future directions. BMC Med. 2011;9:66. doi:10.1186/1741-7015-9-66
21. Ensrud KE. Bisphosphonates for postmenopausal osteoporosis. JAMA. 2021;325(1):96. doi:10.1001/jama.2020.2923
22. Wang J, Zhang Y, Cao J, et al. The role of autophagy in bone metabolism and clinical significance. Autophagy. 2023;19(9):2409–2427. doi:10.1080/15548627.2023.2186112
23. Yin X, Zhou C, Li J, et al. Autophagy in bone homeostasis and the onset of osteoporosis. Bone Res. 2019;7:28. doi:10.1038/s41413-019-0058-7
24. Xue H, Feng Z, Yuan P, et al. Restrained Mitf-associated autophagy by Mulberroside A ameliorates osteoclastogenesis and counteracts OVX-Induced osteoporosis in mice. Cell Death Discovery. 2024;10(1):80. doi:10.1038/s41420-024-01847-1
25. Ji L, Gao J, Kong R, Gao Y, Ji X, Zhao D. Autophagy exerts pivotal roles in regulatory effects of 1α,25-(OH)(2)D(3) on the osteoclastogenesis. Biochem Biophys Res Commun. 2019;511(4):869–874. doi:10.1016/j.bbrc.2019.02.114
26. Cui L, Shen G, Yu Y, et al. Gubi decoction mitigates knee osteoarthritis via promoting chondrocyte autophagy through METTL3-mediated ATG7 m(6)A methylation. J Cell Mol Med. 2024;28(16):e70019. doi:10.1111/jcmm.70019
27. Wan Y, Zhuo N, Li Y, Zhao W, Jiang D. Autophagy promotes osteogenic differentiation of human bone marrow mesenchymal stem cell derived from osteoporotic vertebrae. Biochem Biophys Res Commun. 2017;488(1):46–52. doi:10.1016/j.bbrc.2017.05.004
28. Li W, He P, Huang Y, et al. Selective autophagy of intracellular organelles: recent research advances. Theranostics. 2021;11(1):222–256. doi:10.7150/thno.49860
29. Guo YF, Su T, Yang M, et al. The role of autophagy in bone homeostasis. J Cell Physiol. 2021;236(6):4152–4173. doi:10.1002/jcp.30111
30. Kolodziejczyk AA, Kim JK, Svensson V, Marioni JC, Teichmann SA. The technology and biology of single-cell RNA sequencing. Molecular Cell. 2015;58(4):610–620. doi:10.1016/j.molcel.2015.04.005
31. Hwang B, Lee JH, Bang D. Single-cell RNA sequencing technologies and bioinformatics pipelines. Exp Mol Med. 2018;50(8):1–14. doi:10.1038/s12276-018-0071-8
32. Molla Desta G, Birhanu AG. Advancements in single-cell RNA sequencing and spatial transcriptomics: transforming biomedical research. Acta Biochim Pol. 2025;72:13922. doi:10.3389/abp.2025.13922
33. Li H, Li D, Ma Z, et al. Defective autophagy in osteoblasts induces endoplasmic reticulum stress and causes remarkable bone loss. Autophagy. 2018;14(10):1726–1741. doi:10.1080/15548627.2018.1483807
34. Piemontese M, Onal M, Xiong J, et al. Low bone mass and changes in the osteocyte network in mice lacking autophagy in the osteoblast lineage. Sci Rep. 2016;6:24262. doi:10.1038/srep24262
35. Föger-Samwald U, Dovjak P, Azizi-Semrad U, Kerschan-Schindl K, Pietschmann P. Osteoporosis: pathophysiology and therapeutic options. Excli J. 2020;19:1017–1037. doi:10.17179/excli2020-2591
36. National Health Commission of the People’s Republic of China. Measures for the ethical review of life science and medical research involving humans; 2023. Available from: https://research.bjmu.edu.cn/llwyh/llwyh_fgwj/98685712020c4ae1a670bfe0adbfa905.htm.
37. Ogata H, Goto S, Sato K, Fujibuchi W, Bono H, Kanehisa M. KEGG: Kyoto encyclopedia of genes and genomes. Nucleic Acids Res. 1999;27(1):29–34. doi:10.1093/nar/27.1.29
38. Kanehisa M, Sato Y, Kawashima M, Furumichi M, Tanabe M. KEGG as a reference resource for gene and protein annotation. Nucleic Acids Res. 2016;44(D1):D457–62. doi:10.1093/nar/gkv1070
39. Wang N, Xu P, Wu R, et al. Timosaponin BII improved osteoporosis caused by hyperglycemia through promoting autophagy of osteoblasts via suppressing the mTOR/NFκB signaling pathway. Free Radic Biol Med. 2021;171:112–123. doi:10.1016/j.freeradbiomed.2021.05.014
40. Collier JJ, Suomi F, Oláhová M, McWilliams TG, Taylor RW. Emerging roles of ATG7 in human health and disease. EMBO Mol Med. 2021;13(12):e14824. doi:10.15252/emmm.202114824
41. Ezzat S, Louka ML, Zakaria ZM, Nagaty MM, Metwaly RG. Autophagy in osteoporosis: relation to oxidative stress. J Cell Biochem. 2019;120(2):2560–2568. doi:10.1002/jcb.27552
42. Onal M, Piemontese M, Xiong J, et al. Suppression of autophagy in osteocytes mimics skeletal aging. J Biol Chem. 2013;288(24):17432–17440. doi:10.1074/jbc.M112.444190
43. Piemontese M, Onal M, Xiong J, et al. Suppression of autophagy in osteocytes does not modify the adverse effects of glucocorticoids on cortical bone. Bone. 2015;75:18–26. doi:10.1016/j.bone.2015.02.005
44. Zheng W, Xie W, Yin D, Luo R, Liu M, Guo F. ATG5 and ATG7 induced autophagy interplays with UPR via PERK signaling. Cell Commun Signal. 2019;17(1):42. doi:10.1186/s12964-019-0353-3
45. Yuan Y, Fang Y, Zhu L, et al. Deterioration of hematopoietic autophagy is linked to osteoporosis. Aging Cell. 2020;19(5):e13114. doi:10.1111/acel.13114
46. Franco-Trepat E, Guillán-Fresco M, Alonso-Pérez A, et al. Visfatin connection: present and future in osteoarthritis and osteoporosis. J Clin Med. 2019;8(8):1178. doi:10.3390/jcm8081178
47. Samal B, Sun Y, Stearns G, Xie C, Suggs S, McNiece I. Cloning and characterization of the cDNA encoding a novel human pre-B-cell colony-enhancing factor. Mol Cell Biol. 1994;14(2):1431–1437. doi:10.1128/mcb.14.2.1431-1437.1994
48. Han RL, Li ZJ, Li MJ, et al. Novel 9-bp indel in visfatin gene and its associations with chicken growth. British Poul Sci. 2011;52(1):52–57. doi:10.1080/00071668.2010.537310
49. Ma C, Pi C, Yang Y, et al. Nampt expression decreases age-related senescence in rat bone marrow mesenchymal stem cells by targeting Sirt1. PLoS One. 2017;12(1):e0170930. doi:10.1371/journal.pone.0170930
50. Lee JP, Foote A, Fan H, et al. Loss of autophagy enhances MIF/macrophage migration inhibitory factor release by macrophages. Autophagy. 2016;12(6):907–916. doi:10.1080/15548627.2016.1164358
51. Deng M, Tan J, Dai Q, Luo F, Xu J. Macrophage-mediated bone formation in scaffolds modified with MSC-derived extracellular matrix is dependent on the migration inhibitory factor signaling pathway. Front Cell Develop Biol. 2021;9:714011. doi:10.3389/fcell.2021.714011
52. Zhou Z, Wang Y, Gao Z, et al. CXCL1 promotes osteoblast autophagy and inhibits ferroptosis through the activation of the TGF-β/Smad signalling pathway. J Cell Mol Med. 2025;29(21):e70883. doi:10.1111/jcmm.70883
53. Miura M, Kitaura H, Ohori F, et al. Role of CXCL10 released from osteocytes in response to TNF-α stimulation on osteoclasts. Sci Rep. 2025;15(1):3040. doi:10.1038/s41598-025-87092-7
54. Wojdasiewicz P, Turczyn P, Dobies-Krzesniak B, Frasunska J, Tarnacka B. Role of CX3CL1/CX3CR1 signaling axis activity in osteoporosis. Mediators Inflamm. 2019;2019:7570452. doi:10.1155/2019/7570452
55. Wegman F, Poldervaart MT, van der Helm YJ, Oner FC, Dhert WJ, Alblas J. Combination of bone morphogenetic protein-2 plasmid DNA with chemokine CXCL12 creates an additive effect on bone formation onset and volume. Eur Cells Mater. 2015;30:1–10;discussion10–1. doi:10.22203/ecm.v030a01
56. Vallés G, Bensiamar F, Maestro-Paramio L, García-Rey E, Vilaboa N, Saldaña L. Influence of inflammatory conditions provided by macrophages on osteogenic ability of mesenchymal stem cells. Stem Cell Res Ther. 2020;11(1):57. doi:10.1186/s13287-020-1578-1
57. Lu D, Xu Y, Liu Q, Zhang Q. Mesenchymal stem cell-macrophage crosstalk and maintenance of inflammatory microenvironment homeostasis. Front Cell Develop Biol. 2021;9:681171. doi:10.3389/fcell.2021.681171
58. Luque-Campos N, Bustamante-Barrientos FA, Pradenas C, et al. The macrophage response is driven by mesenchymal stem cell-mediated metabolic reprogramming. Front Immunol. 2021;12:624746. doi:10.3389/fimmu.2021.624746
59. Chen Q, Shou P, Zheng C, et al. Fate decision of mesenchymal stem cells: adipocytes or osteoblasts? Cell Death Differ. 2016;23(7):1128–1139. doi:10.1038/cdd.2015.168
60. Astudillo P, Ríos S, Pastenes L, Pino AM, Rodríguez JP. Increased adipogenesis of osteoporotic human-mesenchymal stem cells (MSCs) characterizes by impaired leptin action. J Cell Biochem. 2008;103(4):1054–1065. doi:10.1002/jcb.21516
61. Zhang F, Wu J, Li X, Ying X, Fang W, Dong Y. Angiopoietin-like protein 4 treated bone marrow-derived mesenchymal stem cells alleviate myocardial injury of patients with myocardial infarction. Nurs Health Sci. 2022;24(1):312–321. doi:10.1111/nhs.12927
62. Neunaber C, Catala-Lehnen P, Beil FT, et al. Increased trabecular bone formation in mice lacking the growth factor midkine. J Bone Miner Res. 2010;25(8):1724–1735. doi:10.1002/jbmr.75
63. Haffner-Luntzer M, Heilmann A, Rapp AE, et al. Antagonizing midkine accelerates fracture healing in mice by enhanced bone formation in the fracture callus. Br J Pharmacol. 2016;173(14):2237–2249. doi:10.1111/bph.13503
64. Liedert A, Schinke T, Ignatius A, Amling M. The role of midkine in skeletal remodelling. Br J Pharmacol. 2014;171(4):870–878. doi:10.1111/bph.12412
65. Liu X, Bai M, Sun Y, et al. FGF7-induced E11 facilitates cell-cell communication through connexin43. Int J Bio Sci. 2021;17(14):3862–3874. doi:10.7150/ijbs.65240
 © 2026 The Author(s). This work is published and licensed by Dove Medical Press Limited. The
full terms of this license are available at https://www.dovepress.com/terms
and incorporate the Creative Commons Attribution
- Non Commercial (unported, 4.0) License.
By accessing the work you hereby accept the Terms. Non-commercial uses of the work are permitted
without any further permission from Dove Medical Press Limited, provided the work is properly
attributed. For permission for commercial use of this work, please see paragraphs 4.2 and 5 of our Terms.
© 2026 The Author(s). This work is published and licensed by Dove Medical Press Limited. The
full terms of this license are available at https://www.dovepress.com/terms
and incorporate the Creative Commons Attribution
- Non Commercial (unported, 4.0) License.
By accessing the work you hereby accept the Terms. Non-commercial uses of the work are permitted
without any further permission from Dove Medical Press Limited, provided the work is properly
attributed. For permission for commercial use of this work, please see paragraphs 4.2 and 5 of our Terms.
Recommended articles
The Critical Role of Autophagy in the Pathogenesis of Diabetic Osteoporosis: Mechanisms and Therapeutic Measures
Hou K, Shi W, Xu K, Wang T, Zhang Y
Drug Design, Development and Therapy 2025, 19:9913-9942
Published Date: 6 November 2025