Back to Journals » Journal of Hepatocellular Carcinoma » Volume 12
Integrated Transcriptomic Analysis Leveraging Single-Cell and Bulk RNA Sequencing Data to Uncover Pyroptosis-Related Prognostic Signatures in HCC
Authors Li J, Di Y, Kang X, Song Z, Sun Z ![]()
Received 29 July 2025
Accepted for publication 16 December 2025
Published 24 December 2025 Volume 2025:12 Pages 2971—2988
DOI https://doi.org/10.2147/JHC.S557035
Checked for plagiarism Yes
Review by Single anonymous peer review
Peer reviewer comments 3
Editor who approved publication: Dr David Gerber
Jiangbo Li,1,* Yupeng Di,2,* Xiaoli Kang,2,* Zhuo Song,2 Zhijia Sun2
1Bioinformatics Center of AMMS, Beijing, People’s Republic of China; 2Department of Radiation Oncology, Air Force Characteristic Medical Center, Air Force Medical University, Beijing, People’s Republic of China
*These authors contributed equally to this work
Correspondence: Zhijia Sun, Department of Radiation Oncology, Air Force Characteristic Medical Center, Air Force Medical University, Beijing, 100142, People’s Republic of China, Email [email protected]
Background: The influence of pyroptosis on tumors is complex and diverse. However, its specific impact on hepatocellular carcinoma (HCC) is still not well understood. Therefore, the objective of this study was to develop a prognostic signature for HCC based on pyroptosis-related genes.
Methods: The single-cell RNA sequencing (scRNA-seq) data, mRNA expression files and corresponding clinical information of HCC were obtained from the The Cancer Genome Atlas and Gene Expression Omnibus databases. Python was used to process scRNA-seq data and calculated the enrichment score of pyroptosis-related genes (PRGs). Weight Co-Expression Network Analysis was used to identify pyroptosis-related hub genes. By overlapping the PRGs from scRNA-seq analysis and bulk RNA-seq analysis, respectively. Then, Univariate cox and LASSO regression were used to construct the pyroptosis prognostic model. Multivariate cox was used to identify independent factors for HCC and then developed a nomogram. The biological functions, survival analysis, immune characteristics, therapy response, and m6A modification status were analyzed.
Results: Based on the scRNA-seq analysis and bulk RNA-seq analysis, hub PRGs were identified in HCC. Of those genes, five PRGs (ADGRE2, FCER1G, SLC9A9, CYBB, SLAMF6) were selected as a prognostic signature. The risk score established from the prognostic signature was an independent prognostic factor for HCC. The high-risk score group is associated with a poor prognosis, characterized by immunosuppressive features.
Conclusion: This study uniquely integrates single-cell and bulk transcriptomic data to systematically identify pyroptosis-related prognostic biomarkers, pinpointing their cellular origin within the tumor microenvironment.
Keywords: hepatocellular carcinoma, single-cell RNA sequencing, pyroptosis, prognosis, HNRNPA2B1
Introduction
The incidence and mortality of hepatocellular carcinoma (HCC) remain high.1 Despite effective therapies for certain patient groups, the 5-year overall survival (OS) rate for HCC is distressingly low, at just 18%.2 Multiple genes contribute to the progression of HCC and are associated with poor prognosis.3,4 Consequently, there is a pressing need for innovative therapeutic strategies and targets to address the challenges in HCC treatment.
Pyroptosis, a programmed cell death induced by inflammation and characterized by gasdermin (GSDM)-mediated membrane pore formation, elicits a potent inflammatory response.5 Its role in HCC is ambiguous. While pyroptosis can inhibit tumorigenesis and progression, benefiting anticancer therapy,6 it also promotes tumor cell proliferation, invasion, metastasis, and drug resistance by releasing inflammatory molecules.7,8 Additionally, key pyroptosis regulators contribute to an immunosuppressive microenvironment and are associated with poor prognosis.9 Given these conflicting effects, elucidating pyroptosis’s impact on HCC prognosis is essential for identifying novel biomarkers and therapeutic targets. While prior studies have constructed pyroptosis-related prognostic models for HCC using bulk RNA-seq data, their major limitation is an inability to resolve the cellular origins of pyroptotic activity within the heterogeneous tumor microenvironment (TME).10,11 To overcome this, we employed an integrated analysis of single-cell and bulk RNA-seq. This approach allows us to first identify biologically relevant candidate genes in specific cell subpopulations via scRNA-seq, and then construct a statistically robust prognostic model using large-scale bulk data. By grounding our signature in specific cellular contexts, we enhance its biological credibility and translational potential.
Therefore, this study aims to develop and validate a biologically-grounded, pyroptosis-related prognostic signature for HCC. We leveraged integrated scRNA-seq and bulk RNA-seq data from The Cancer Genome Atlas (TCGA) and Gene Expression Omnibus (GEO) to explore the relationship between our model and the tumor immune microenvironment, aiming to provide a more precise and mechanistically informed tool for HCC prognosis.
Methods
Retrieval of Datasets
The download of transcriptome files, containing data from 368 HCC samples and their associated clinical information, was performed from TCGA (https://portal.gdc.cancer.gov/). In addition, the retrieval of bulk RNA-seq and scRNA-seq data from the GEO (https://www.ncbi.nlm.nih.gov/geo/) was achieved by utilizing the getGEO function of the GEOquery package in R (Inclusion Criteria: For the bulk RNA-seq cohorts, the primary inclusion criterion was that a sample must have both available gene expression data and complete corresponding clinical follow-up information, especially overall survival (OS) time and vital status. Exclusion Criteria: Samples lacking any of the critical clinical information (such as OS time, survival status, or other key clinicopathological features used in the multivariate analysis) were excluded from our analysis). The acquisition of gene expression profiles from two distinct cohorts, namely the GSE144269 cohort with 68 HCC samples and the GSE116174 cohort with 64 HCC samples, was accomplished by extracting the data from the GEO database. GSE144269 and GSE116174 datasets were generated based on the GPL24676 and GPL13158 platforms, respectively. Additionally, scRNA-seq data of HCC samples from four datasets (GSE146115, GSE162616, GSE149614, GSE125449) were downloaded from GEO datasets. 4 HCC patients of GSE146115 dataset, 4 HCC patients of GSE162616 dataset, 10 HCC patients of GSE149614 dataset, and 19 HCC patients of GSE125449 dataset were selected for subsequent analysis. A total of 429 pyroptosis-related genes (PRGs) were retrieved from the GeneCards database (https://www.genecards.org/) on Sep 26, 2024. The search term was “pyroptosis”, and genes with a Relevance Score greater than 0.1 were included in the final list (Supplemental Table S1).
scRNA Sequencing Processing and PRGs Score
The scRNA-seq data from datasets GSE146115, GSE162616, GSE149614, and GSE125449 were integrated and assessed for quality using Python.12 Quality control criteria excluded cells with <20% mitochondrial genes, >200 genes, or >3 genes. Remaining cells’ gene expression was normalized. Highly variable genes (HVGs) were identified using the pp. highly_variable_genes function in Scanpy (v1.9.1) with the following parameters: flavor=“seurat_v3”, n_top_genes=3000. Principal component analysis (PCA) reduced dimensionality, identifying 30 significant PCs at 0.5 resolution. These PCs served as input for non-linear dimension reduction using Uniform Manifold Approximation and Projection (UMAP). Cell annotation was automated using Python and manually refined with the CellMarker2 database (http://xteam.xbio.top/CellMarker/) and literature-based marker genes.13 The Python was used to assess pyroptosis enrichment in individual samples. Differentially expressed genes (DEGs) between high and low PRG score groups were identified from the analysis. DEGs were selected based on |log2(FC)| > 0.585 and an adjusted P-value < 0.05.
Weighted Gene Co-Expression Network Analysis (WGCNA)
The quantitative method single-sample Gene Set Enrichment Analysis (ssGSEA) was performed to compute the enrichment fraction of a gene set associated with pyroptosis in a specific sample, which reflected the degree of enrichment of the gene set. Subsequently, the TCGA-LIHC cohort samples were subjected to further analysis utilizing the R package WGCNA.14 Pearson’s correlation analysis was performed to cluster all samples and eliminate any outliers. Following this, the community dissimilarity, reflecting similarities among samples, was examined, enabling the removal of outliers. To further understand the gene interrelations, the adjacency matrix underwent a transformation into a topological overlap matrix (TOM). Consequently, genes were allocated into distinct gene modules through the application of a dissimilarity measure associated with TOM and a soft-thresholding setting. The quantification of gene modules was achieved by examining dissimilarity measurements using the dynamic tree cutting criterion, which enforced a minimum module size of 30 genes. Subsequently, the establishment of WGCNA was carried out using the ssGSEA enrichment scores of each sample. For inclusion in the analysis, the samples were required to have a median absolute deviation value lower than 25% across all the samples in the TCGA-LIHC cohort. Identification of modules most associated with pyroptosis was accomplished through the utilization of two criteria: gene significance (GS) threshold of greater than 0.5 and module membership (MM) threshold of greater than 0.8.
Developing and Validating the Pyroptosis-Related Prognostic Model
The identification of significant PRGs involved the intersection of DEGs obtained from scRNA-seq data and hub genes obtained from WGCNA. Afterward, prognostic PRGs were identified in the TCGA-LIHC cohort by performing univariate Cox analysis using the lifelines package in R, with a significance threshold of P-value < 0.05. To further refine the prognostic PRGs, a least absolute shrinkage and selection operator (LASSO) regression, along with ten-fold cross-validation, was conducted using the scikit-survival package in R. This process effectively shrunk the set of prognostic PRGs. Finally, risk model was developed based on prognostic PRGs and their coefficients, and risk score was calculated based on a formula,  . During the LASSO regression analysis, the regression coefficient (Coef) and expression levels (expr) of each gene were determined. Afterward, the individuals in the TCGA-LIHC cohort were categorized into the high-risk group (HRG) and low-risk group (LRG) based on the median value of their risk scores (1.218797). Moreover, a multivariate Cox regression analysis was conducted, integrating clinicopathological features and risk scores, with the aim of identifying independent factors. The variables with a P-value below 0.05 were selected to develop a nomogram using the rms package in R for the purpose of prognostic prediction. Furthermore, a calibration curve was generated to assess the calibration and agreement between predicted and observed outcomes. Additionally, a decision curve analysis (DCA) curve was drawn to assess the reliability of the prognostic model. The receiver operating characteristic (ROC) curve was generated to assess the accuracy of the prognostic model.
External Validation of the Pyroptosis-Related Risk Model
The GSE144269 and GSE116174 cohorts were used to evaluate and validate the effectiveness of the model. The patients in these cohorts were partitioned into HRG and LRG based on the median values of their risk scores. To assess the accuracy of the risk model, survival analysis was conducted using the Survminer package, and the accuracy was further evaluated by drawing ROC curves using the survival ROC package in R. Additionally, a multivariate Cox regression analysis was carried out to establish the potential of the risk score as an independent factor in HCC.
Gene Set Enrichment Analysis (GSEA)
GSEA was adopted to delve into the pertinent biological processes and signaling pathways between HRG and LRG. The R package limma was utilized to effectively rank all the genes in the populations of the HRG and LRG. Subsequently, the R package clusterProfiler was leveraged to enrich and identify the significant pathways by utilizing the GO, KEGG, and Hallmark gene sets.
Immune Cell Infiltration Analysis
The ssGSEA was adopted for the quantification of the enrichment fraction of an immune-related gene (IRG) set in a given sample. The IRG set, comprising 28 types of immune cells, was acquired from prior research.15 The distinction of the fraction of immune cells between HRG and LRG was determined using the Wilcox test.
Identification of m6A Regulators and Targets
The Wilcoxon test with a significance threshold of P-value less than 0.05 enabled the identification of m6A regulators exhibiting differential expression between HRG and LRG. Then, the predicted targets of these differentially expressed m6A regulators were determined using the M6A2Target database (http://rm2target.canceromics.org). The interaction between differentially expressed m6A regulators and corresponding targets was visualized using Cytoscape software. Finally, the candidate drugs for differentially expressed m6A regulators and their targets were predicted based on the Connectivity Map (CMap).
Evaluation of the Therapy Responses
The involvement of human leukocyte antigen (HLA) in influencing immune responses in tumors has been widely recognized.16,17 In this particular investigation, the expression of HLA class I, HLA class II, and immune checkpoint-related genes was assessed in HRG and LRG using the Wilcoxon test. Furthermore, the tumor immune dysfunction and exclusion (TIDE) dysfunction score and the immunephenoscore (IPS) were respectively applied for the prediction of immune checkpoint blockade response and immunogenicity.18,19 TIDE and IPS scores were calculated using the tidepy package in Python and the IOBR package in R, respectively. The potential response to immunotherapy was predicted through the application of the Submap method available on the GenePattern platform (https://cloud.genepattern.org/gp/pages/ index.jsf). The significant differences between the HRG and LRG were determined utilizing the Wilcoxon test, with the significance threshold set at a P-value below 0.05.
Cell Culture and Reagents
Human liver cancer cell lines (HepG2, Hep3B, PLC/PRF/5, and Huh7) were bought from ATCC (Manassas, VA, USA). These cell lines were cultured in DMEM (Dulbecco’s Modified Eagle’s Medium) supplemented with 10% FBS (fetal bovine serum). The QSG-7701 cells were purchased from Chinese Beyotime Biotechnology. These cells were cultured in RPMI-1640 medium supplemented with 10% FBS. The cells were incubated at 37°C with 5% CO2. DMSO (HY-Y0320C) and Nigericin (HY-127019) were purchased from MedChemExpress (China). The HNRNPA2B1 antibody (Catalog No.: 67445-1-Ig) and the β-Tubulin antibody (Catalog No.: 10094-1-AP) were purchased from Wuhan Proteintech Company.
Adenovirus Vector Plasmid For transfection of Hep3B Cells
Adenovirus expressing HNRNPA2B1-shRNAs were purchased from Hanheng Bioscience (China). Hep3B cells in logarithmic growth phase were infected with Ad-eGFP or Ad-HNRNPA2B1 for 4 hours. The cells were then washed with culture medium and incubated at 37 °C for 2 days. Once stable cell lines were established, qRT-PCR and Western blot analyses were performed to screen for HNRNPA2B1-knockout Hep3B cells. The shRNA sequences are provided in the Supplemental Table S2.
RNA Isolation and Quantitative Real-Time PCR (qRT-PCR)
Total RNA from the transfected cells was extracted using the TRIzol RNA Isolation Reagent (Invitrogen, USA) according to the manufacturer’s instructions. The isolated RNA was reverse-transcribed into complementary DNA (cDNA) using a Universal RT-PCR Kit (Solarbio, Beijing, China). Gene expression was quantified using the CFX96 Touch Real-Time PCR System (Bio-Rad). The q-RT PCR reaction was set up following the protocol provided in the kit’s instructions. β-Tubulin (Bio-Rad) was used as the internal reference gene, with each sample processed in triplicate. The relative expression quantification values for different specimens were calculated using the 2−ΔΔCt method. Primer sequences are listed in Supplemental Table S2.
Western Blot
The experimental procedure was conducted in accordance with previously established protocols.20 Briefly, the collected cells were washed with PBS and then lysed using RIPA lysis buffer containing protease inhibitors. Subsequently, an equal volume of 2×SDS loading buffer was added. After boiling and centrifugation, the protein supernatant was separated using a 10% SDS-PAGE gel and transferred to a nitrocellulose filter membrane. Following blocking, the membrane was sequentially incubated with primary and secondary antibodies. Target protein bands were visualized using ECL luminescent liquid (microporous) and imaged with the LabTM software (Bio-Rad).
Statistical Analysis
Software tools such as SPSS 22.0 and GraphPad Prism 7.0 were employed to perform statistical analyses, and measurement data were expressed as the mean ± SD. The appropriateness of using parametric tests was confirmed by assessing normality with the Shapiro–Wilk test and homogeneity of variances with the Levene test. Accordingly, the t-test was employed to compare the mean differences between two independent samples, and Analysis of Variance (ANOVA) was utilized to assess the mean differences among multiple independent samples. Qualitative data were analyzed using the nonparametric χ2 test. The Cox proportional hazard regression model was utilized for both univariate and multivariate analysis, aiming to identify independent prognostic factors. For the assessment of overall or disease-free survival, the Kaplan–Meier method was applied, and the Log- rank test was utilized to identify any significant differences. The pertinent p-values were depicted on the figures, with a predetermined level of statistical significance set at P < 0.05.
Results
Identification of the PRG Score-Related Cell Clusters in HCC
ScRNA-seq data were gathered from four datasets: GSE146115, GSE162616, GSE149614, and GSE125449. Using these data, a series of steps, including combination, quality control, and normalization, were conducted using the “scanpy” library in Python to eliminate low-quality cells (Figure 1A and Supplemental Figure S1). Following the merging and normalization of scRNA-seq data, dimensionality reduction was performed and visualized through PCA and uniform manifold approximation and projection, respectively (Figure 1B and C). Subsequently, 10 cell clusters were identified (Figure 1D). Next, the PRG score for each cell was computed using “scanpy” in Python (Figure 1E). Patients with HCC were then categorized into groups with high-PRG and low-PRG scores in adherence to the median PRG score (Figure 1F). Our observations indicated that endothelial cells, NK cells, macrophage cells, and mast cells were associated with a high PRG score. The application of the specified criteria of |log2 FC| greater than 0.585 and an adjusted P-value below 0.05 led to the identification of a substantial set of 3796 DEGs between the groups distinguished by high-PRG scores and low-PRG scores (Figure 1G and Supplemental Table S3).
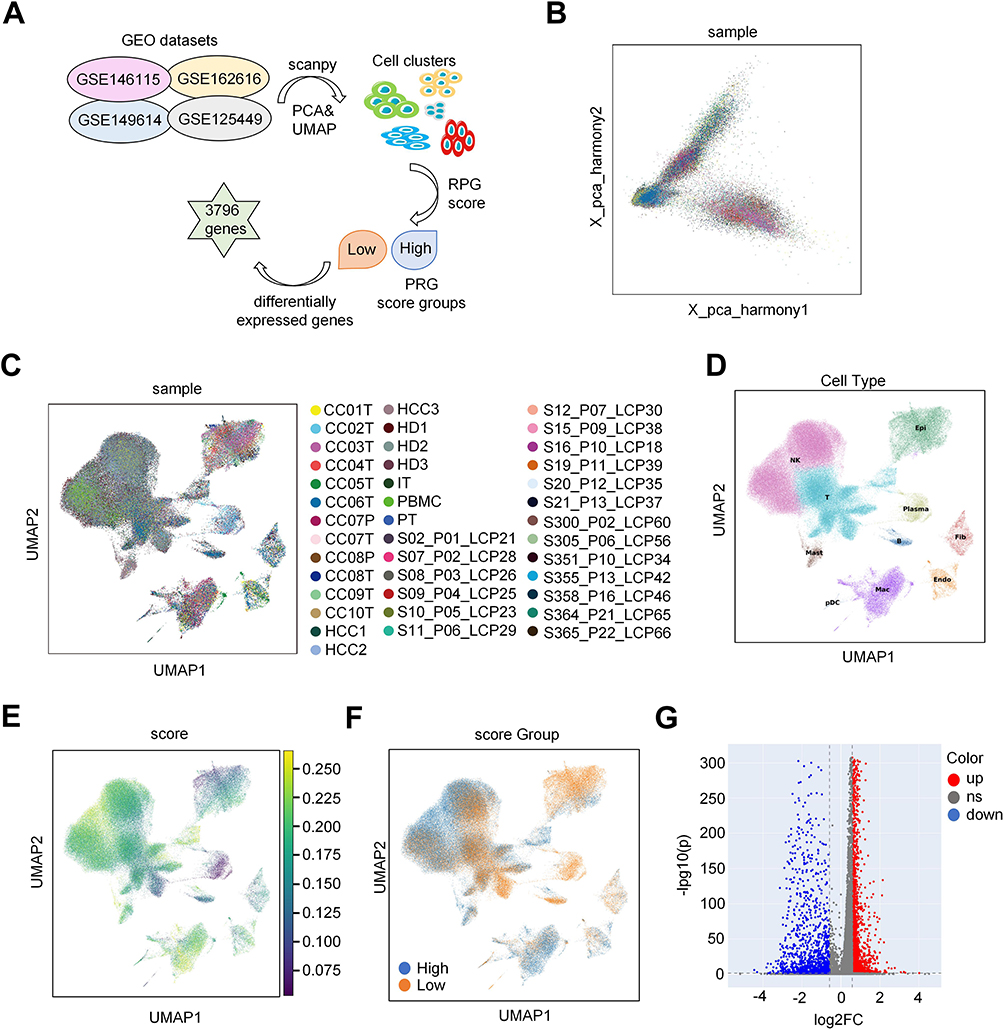 |
Figure 1 Identification of the PRG score-related cell clusters in HCC. (A) The scRNA-seq database analysis workflow. (B) This panel shows the PCA plot of samples after batch effect removal, illustrating the improved clustering and distribution, which validates the effectiveness of the correction. (C) UMAP of Sample Distribution Post-Batch Effect Removal: This panel presents a UMAP plot of samples post-batch effect removal, highlighting the refined clustering and spatial distribution, confirming the data’s consistency. (D) This panel features a UMAP plot with annotated cell clusters using “celltypist” and the Cell Marker2 database, revealing the distinct cellular composition within the dataset. (E) This panel displays a UMAP plot of PRG scores calculated with “scanpy” showcasing the distribution of gene expression patterns across the cell population. (F) This panel illustrates a UMAP plot distinguishing high- and low-PRG score cells, emphasizing the separation based on gene expression profiles. (G) This panel presents a volcano plot of differentially expressed genes between high- and low PRG-score groups, highlighting significant gene expression changes. |
Identification of the Pyroptosis-Related Modules and Genes
To investigate PRG expression patterns in patients with HCC, bulk RNA-seq data from 368 patients were obtained from the TCGA database and were analyzed to explore pyroptosis-related modules and core genes in these patients. The pyroptosis score for each sample was determined using ssGSEA, and based on this score, patients with HCC were stratified into high- (≥median) and low-score groups (Supplemental Table S4). Subsequently, WGCNA was employed to further identify pyroptosis-related modules and genes. As illustrated in Figure 2A and B, sample clustering based on Pearson’s correlation coefficient was conducted to filter outliers, leading to the creation of a cluster dendrogram. The selection of a soft-threshold power of 18 led to the formation of 8 modules, each comprising a minimum of 30 genes (Figure 2C). Among these modules, the blue module emerged as the most significant module in relation to pyroptosis (Figure 2D and E). Further exploration resulted in the identification of 259 hub genes associated with pyroptosis, with gene significance exceeding 0.2 and module membership exceeding 0.8 (cor=0.67, p=1.1e-52; Figure 2F and Supplemental Box 1).
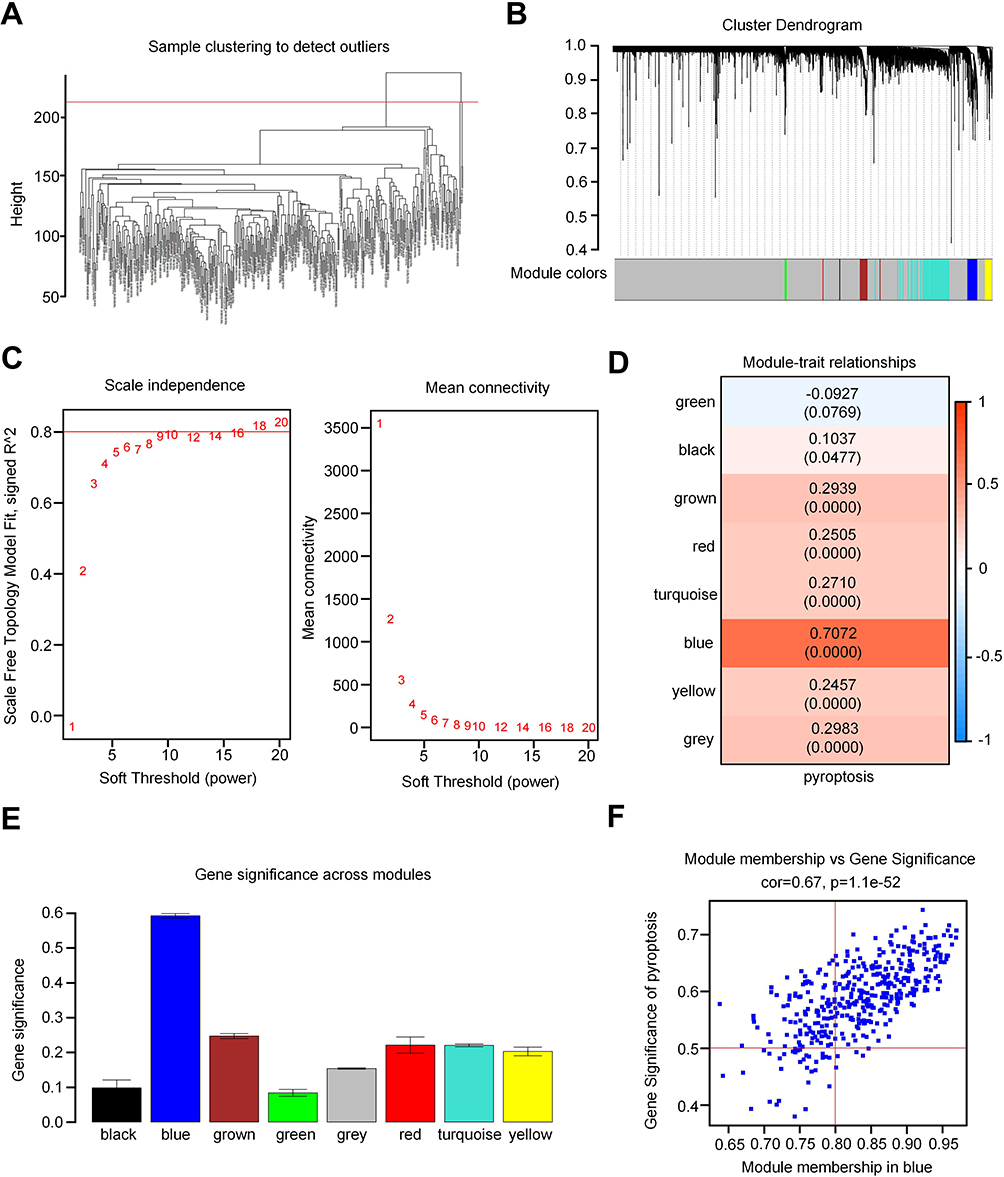 |
Figure 2 Identification of pyroptosis-related modules and genes. (A) Clustering dendrogram of samples. (B) Clustering dendrogram of genes based on the measurement of dissimilarity (1-TOM). (C) Analysis of the scale-free index for various soft-threshold powers (β). The left panel shows the X-axis representing a function of soft-threshold power, and the Y-axis representing the scale-free fit index. The right panel displays the X-axis representing a function of soft-threshold power, and the Y-axis representing the mean connectivity (degree). (D) The blue module demonstrated the closest association with pyroptosis, containing 3796 genes (Cor=0.67, p=1.1e-52). (E) Bar charts displaying the correlation between gene significance and pyroptosis in each module (black, blue, brown, green, gray, red, turquoise, and yellow). (F) Scatter plots showing the correlation between the module membership and pyroptosis in the blue module. |
Construction and Validation of a Pyroptosis-Related Prognostic Model
The study proceeded to delve deeper into the potential prognostic implications associated with the PRG signature in HCC. In total, 193 key PRGs were obtained by intersecting the 3796 DEGs identified in the scRNA-seq data between the high- and low-PRG score groups with the 259 hub genes associated with pyroptosis derived from bulk sequencing data (Figure 3A). Next, using univariate Cox analysis, we identified 15 PRGs with prognostic significance (Figure 3B and Supplemental Table S5). Among these, five prognostic genes (ADGRE2, FCER1G, SLC9A9, CYBB, and SLAMF6) were selected using the LASSO regression to construct a prognostic model (Figure 3C–E). Upon stratifying samples from the TCGA-LIHC cohort into HRG and LRG based on the median risk score, we observed that patients in the HRG exhibited a higher mortality rate (Figure 3F). This trend was consistently reflected in the lower survival rate of patients in the HRG (Figure 3G). Additionally, we utilized the GSE116174 and GSE144269 datasets for external validation. Patients in both datasets were categorized into HRG and LRG according to their risk score (Figure 3H and I), with those in the HRG demonstrating poorer prognosis (Figure 3J and K). The predictive accuracy of the risk model was substantiated by the area under the curve (AUC) values exceeding 0.6 in the ROC curve (Figure 3L and M).
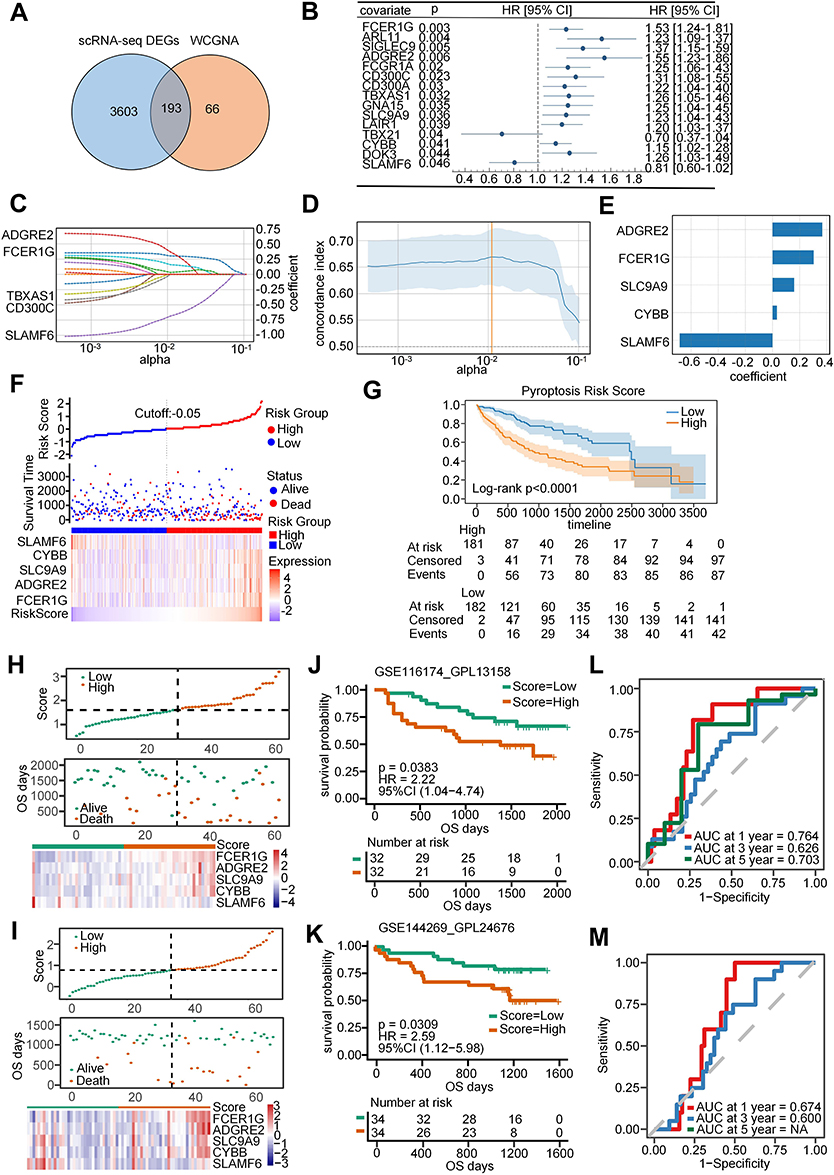 |
Figure 3 Construction and validation of a pyroptosis-related prognostic model. (A) Venn diagram illustrates the intersected genes between DEGs from scRNA-seq data and hub genes from WGCNA. (B) Univariate Cox analysis identified 15 potential prognostic genes for patients with HCC. (C and D) LASSO regression coefficient profiles of the 5 prognostic genes (ADGRE2, FCER1G, SLC9A9, CYBB, and SLAMF6). Each curve represents the changing trajectory of a gene. (E) The coefficient value of each prognostic gene in the LASSO regression model. (F) Top: Patients in the TCGA-LIHC cohort were divided into high-risk group (HRG) and low-risk group (LRG) based on the median value of the risk score. Middle: Scatter plot showing the distribution of patients who were alive and deceased. Bottom: Differential expression of the five prognostic genes between HRG and LRG. (G) Survival analysis depicting the survival rate of patients between the HRG and LRG. (H and K) Top: Patients in the GSE116174 and GSE144269 cohorts were categorized into the HRG and LRG, respectively, based on the median risk score. Middle: Scatter plots represent the distribution of patients with alive and deceased statuses. Bottom: depiction of the five differentially expressed prognostic genes between the HRG and LRG. (I and L) Survival analysis of the survival rate for patients in the GSE116174 and GSE144269 cohorts stratified by HRG and LRG. (J and M) ROC curves for 1-, 3-, and 5-year survival of patients in the GSE116174 and GSE144269 cohorts. |
To further assess the expression levels of prognostic genes in human HCC samples and adjacent normal tissues, we analyzed the immunohistochemistry (IHC) results available in the HPA database. Typical IHC micro-photographs are presented in Supplemental Figure S2. Except for ADGRE2, which was not detected, the expression of FCER1G, SLC9A9, and CYBB was found to be elevated in tumor tissues, whereas the expression of SLAMF6 was observed to be reduced in tumor tissues.
The GSDM family is a signature gene of pyroptosis. We analyzed the expression of five GSDM molecules in HCC tumor tissues and adjacent non-tumorous tissues, and found that the expression levels of four of these molecules were elevated in the tumor tissues (Supplemental Figure S3A). However, only GSDME is closely associated with the prognosis of HCC (Supplemental Figure S3B). Interestingly, GSDME exhibits a notable positive correlation with the five prognostic genes we have identified (Supplemental Figure S3C).
We further investigated the biological functions relevant to pyroptosis risk. All genes between HRG and LRG (Supplemental Table S6) were related to several biological processes, such as external encapsulating structure organization, fatty acid beta-oxidation, leukocyte migration, and mitotic cell phase transition (Supplemental Figure S4A and Supplemental Table S7). We also found some metabolic pathways enriched, such as retinol metabolism, fatty acid metabolism, drug metabolism cytochrome P450, and PPAR signaling pathway (Supplemental Figure S4B and Supplemental Table S8). In addition, epithelial-mesenchymaltransition (EMT), TNF-α signaling via NF-кB, G2M checkpoint, and E2F target pathways were significantly enriched (Supplemental Figure S4C and Supplemental Table S9).
Construction of a Nomogram
A novel nomogram was developed for assessing the prognosis risk associated with HCC. Through the integration of a multivariate Cox analysis involving the risk score and the demographic data (age, sex, and T/N/M stages), we established the risk score and T/N/M stages as independent prognostic factors (Figure 4A). Subsequently, a nomogram was constructed incorporating these independent factors (Figure 4B). The 2-year mortality rate in the TCGA-LIHC cohort was determined to be 0.479 (marked red). This finding contributed to the assessment of prognosis risk and offered valuable guidance in the selection of effective therapeutic strategies. Furthermore, our investigation revealed further results from the ROC curve, which provided AUC values for prognoses at 1-, 3-, and 5-year as 0.75, 0.69, and 0.68, respectively (Figure 4C). The calibration curves for survival rates at these specific time frames, as illustrated in Figure 4D, additionally underscored the predictive capability of the nomogram. Moreover, the effectiveness of the nomogram in accurately predicting the survival time of patients was substantiated by means of a DCA (Figure 4E).
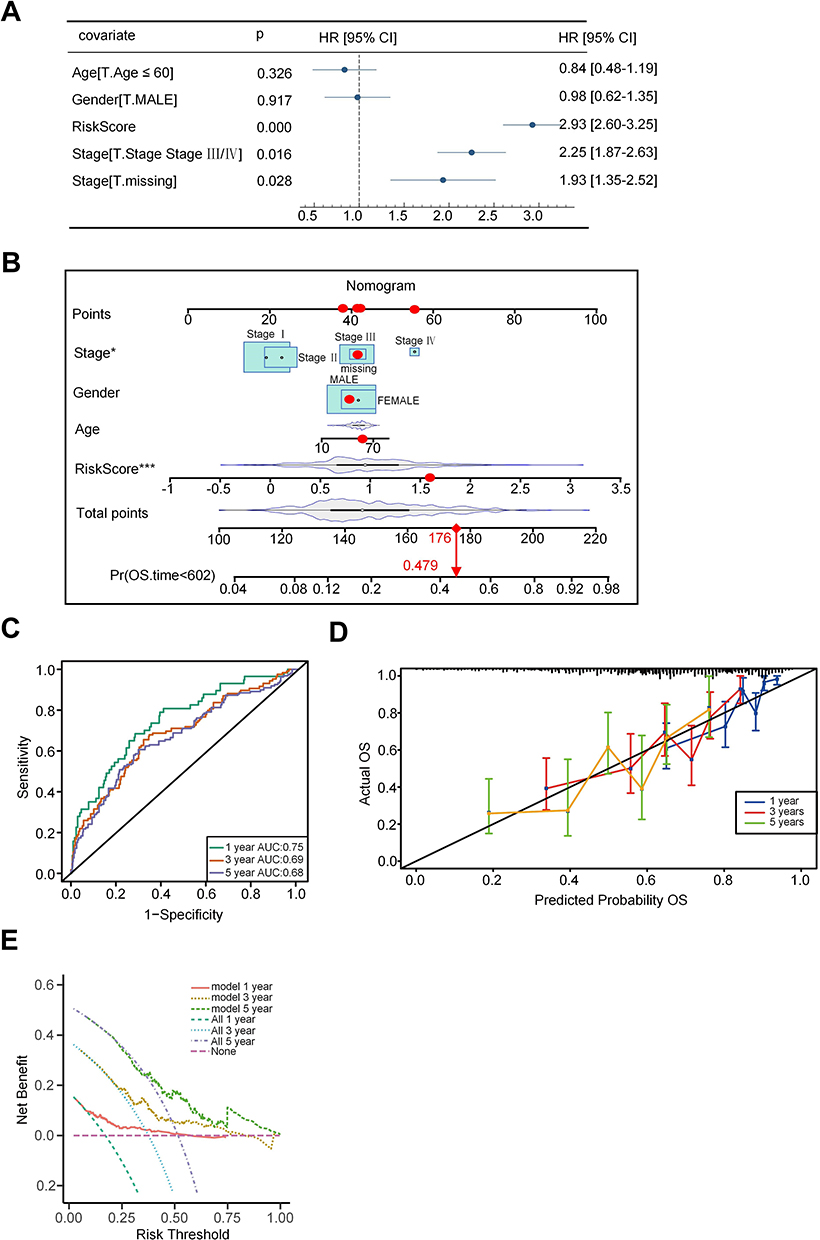 |
Figure 4 Construction of a nomogram. (A) Multivariate Cox analysis indicated independent factors (risk score and T/N/M stages) for HCC patients. (B) A nomogram was constructed by integrating risk score and T/N/M stages for predicting survival time. (C) ROC curves were drawn to predict the accuracy of a nomogram for 1-, 3-, and 5-year survival rates. (D) Calibration curves were drawn to evaluate the predictive ability of the nomogram. (E) Decision curves were drawn to evaluate the effectiveness of the nomogram. Note: *p < 0.05, ***p < 0.001 versus the corresponding control. |
Identification of the Pyroptosis-Related Immune Cell Landscape and Therapy Response
We subsequently investigated the immune characteristics between the HRG and LRG, revealing a diverse range of cell types. Notably, activated CD8+ T cells (marked red) associated with immune promotion were enriched in the LRG, while regulatory T cells (marked blue) associated with immune suppression were more prevalent in the HRG (Figure 5A). In addition, we also examined the expression of HLAs and immune checkpoint-related genes, indicating that high expression of HLA-A, HLA-DRA, and HLA-DRB1, etc. in the HRG compared with the LRG (Figure 5B). Moreover, the immune checkpoint molecule HAVCR2 (marked red), known to mediate T-cell exhaustion, exhibited significantly higher expression in the HRG (Figure 5C). Based on the distinct immune profiles observed between the HRG and LRG, we analyzed TIDE values and IPS scores, revealing an elevated TIDE score and a diminished IPS score in the HRG (Figure 5D and E). These findings point toward an immunosuppressive microenvironment in the HRG. Correspondingly, patients in the LRG demonstrated responsiveness to anti-PD1 therapy (Figure 5F). Furthermore, we investigated drug sensitivity in patients with HCC. The results indicated higher IC50 values for most drugs in the HRG than in the LRG (Figure 5G). These findings suggest that there may be a limited number of therapeutic drugs that could be considered for use in the HRG.
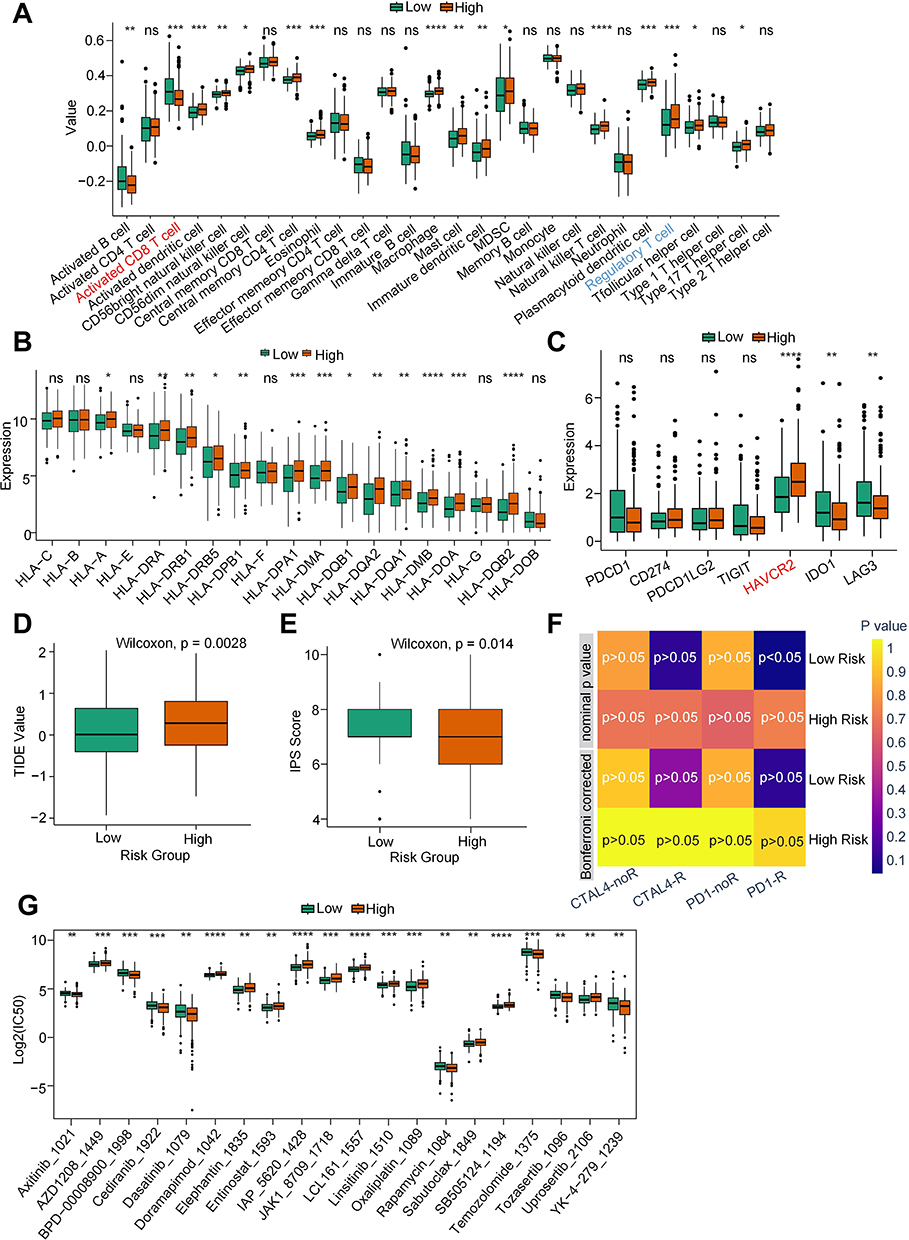 |
Figure 5 Identification of the pyroptosis-related immune cell landscape and therapy response. (A) Box plots indicated the differences in immune cell infiltration between high-risk and low-risk groups. (B) Box plots indicated the differentially expressed HLAs between high-risk and low-risk groups. (C) Box plots indicated that the differentially expressed immune checkpoint-related genes between high-risk and low-risk groups. (D and E) Box plots indicated the differences in TIDE values and IPS scores between high-risk and low-risk groups. (F) Submap showed the responses to anti-CTAL-4 and anti-PD-1 therapies between high-risk and low-risk groups. (G) The IC50 value of each drug between high-risk and low-risk groups was based on the GDSC2 database (http://www.cancerrxgene.org). Note: *p < 0.05, **p < 0.01, ***p < 0.001, ****p < 0.0001 versus the corresponding control, ns means no significance. |
Construction of m6A Regulator-Target Network and Identification of Relevant Candidate Drugs
Epigenetic abnormalities play crucial roles in HCC development and progression. Additionally, alterations in RNA N6-methyladenosine (m6A) modifications have been proposed to be linked with pyroptosis. Consequently, we delved into the pyroptosis-related m6A modification characteristics in patients with HCC. Upon analysis, several m6A regulators were elevated in the HRG compared with the LRG (Figure 6A). After that, the targets of the differentially expressed m6A regulators were predicted and overlapped with DEGs between HRG and LRG. These 20 targets were obtained (Figure 6B). Then, the correlation between m6A regulators and targets was determined based on the significant connection (Figure 6C). Four networks of m6A regulators-targets were subsequently developed (Figure 6D). Finally, we also predicted the therapeutic molecules for differentially expressed m6A regulators and their targets based on the Cmap database (Figure 6E and F).
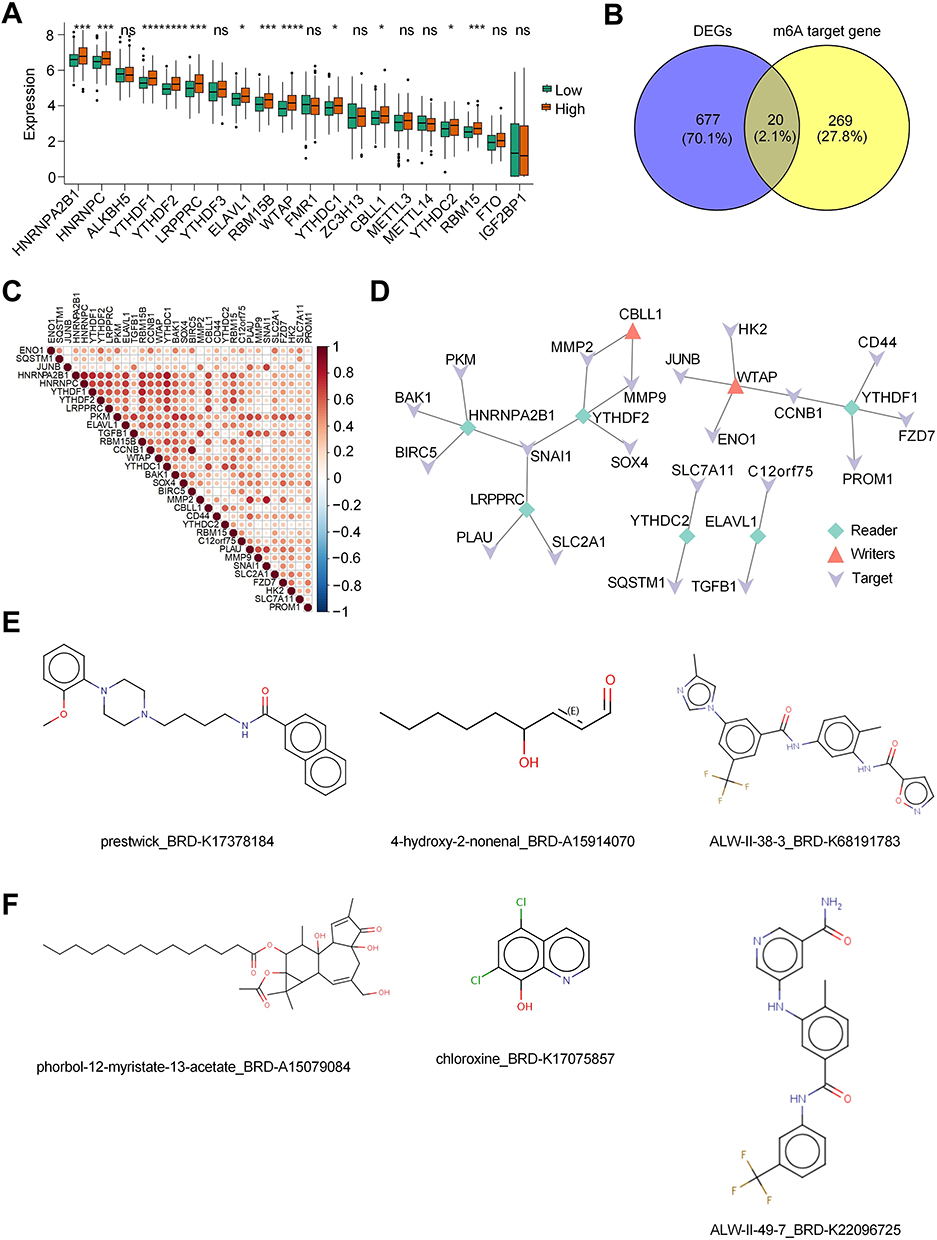 |
Figure 6 Construction of m6A regulator-target network and identify relevant candidate drugs. (A) Box plot indicated the differentially expressed m6A regulators between high-risk and low-risk groups. (B) Venn diagram showed the intersected genes of DEGs between high-risk and low-risk groups and the targets of m6A regulators that were predicted from the M6A2Target database (http://rm2target.canceromics.org). (C) Heatmap of correlation between m6A regulators and their targets. (D) The m6A regulator-target networks. (E) Therapeutic molecules for differentially expressed m6A regulators based on the Cmap database (https://clue.io/). (F) Therapeutic molecules for differentially expressed targets of m6A regulators based on the Cmap database (https://clue.io/). Note: *p < 0.05, ***p < 0.001, ****p < 0.0001 versus the corresponding control, ns means no significance. |
The Role of HNRNPA2B1 in Pyroptosis of HCC Cells
M6A modification plays a crucial role in HCC pyroptosis. The results indicate that among the m6A modification genes involved in regulating HCC pyroptosis, WTAP was identified as the m6A writer with the highest expression in HRG, while HNRNPA2B1 was the most highly expressed m6A reader. Notably, there was no significant difference in the expression levels of m6A erasers. Therefore, we focused on investigating how WTAP and HNRNPA2B1 influence HCC pyroptosis. In our recently published study, we confirmed that WTAP can regulate HCC cell pyroptosis through the NLRP3-GSDMD pathway, providing key evidence for the critical role of m6A modification in HCC pyroptosis.21 Additionally, compared to normal liver cells, HNRNPA2B1 is generally overexpressed in hepatocellular carcinoma cells, particularly in Hep3B cells (Figure 7A). Subsequently, we knocked down HNRNPA2B1 in Hep3B cells, where shRNA-3 showed the most effective knockdown and was used for subsequent experiments (Figure 7B). Nigericin can induce tumor cell pyroptosis through the key pyroptosis molecule NLRP3. However, compared to control cells, Hep3B cells with knocked-down HNRNPA2B1 exhibited a weakened increase in NLRP3 mRNA induced by Nigericin (Figure 7C), and also showed a reduction in HCC cell pyroptosis (Figure 7D).
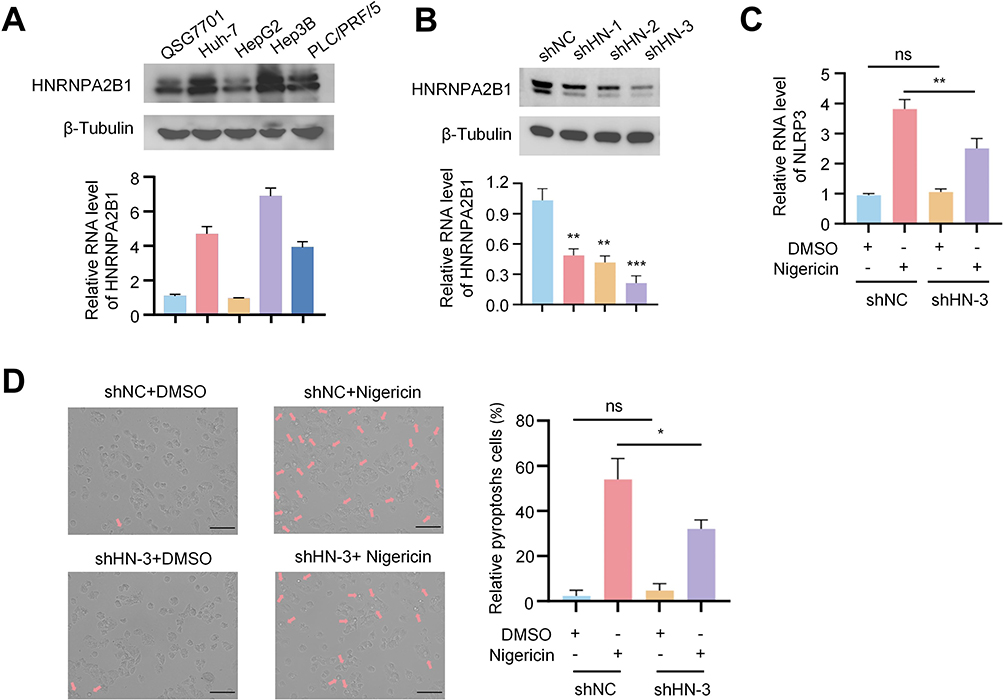 |
Figure 7 The role of HNRNPA2B1 in pyroptosis of HCC cells. (A) Protein and mRNA expression of HNRNPA2B1 in normal hepatocytes and four types of HCC Cells. (B) Protein and mRNA expression following HNRNPA2B1 knockdown using three shRNAs in Hep3B cells (C) Comparison of NLRP3 mRNA expression levels in Hep3B cells transfected with shNC or HNRNPA2B1 shRNA3 and treated with DMSO or Nigericin. (D) After transfection of Hep3B cells with either shNC or HNRNPA2B1 shRNA3, the cells were treated with either DMSO or Nigericin. The cellular response, particularly the occurrence of pyroptosis, was then observed under a microscope. The arrow in the images points to the characteristic vacuoles indicative of pyroptotic cell death. Scale bar: 100 µm. Note: *p < 0.05, **p < 0.01, ***p < 0.001 versus the corresponding control, ns means no significance. |
Discussion
Pyroptosis serves a dual function in tumor pathogenesis, influenced by both the tumor’s type and its surrounding environment. On one hand, the pyroptosis of cancer cells can serve as a novel therapeutic target for inhibiting cancer occurrence and progression. Pyroptosis-inducing therapy boosts the infiltration of CD8+ T cells and natural killer cells within breast tumor tissues and diminishes the presence of myeloid-derived suppressor cells, thus amplifying the body’s immune response against tumors.22 On the other hand, pyroptosis could modify the microenvironment and hasten immune evasion, thus providing protection for tumor progression. In certain solid tumors, the inflammasome complex can regulate and activate caspase-1-mediated cell pyroptosis, releasing cytokines and providing an inflammatory microenvironment conducive to tumor development and metastasis.23–25 Our developed pyroptosis-related prognostic model reveals a significant association between pyroptosis and HCC tumor progression as well as poor prognosis. This finding suggests that pyroptosis may play a role in the progression of HCC tumors and could be linked to an immunosuppressive microenvironment, although this study did not directly establish a causal relationship.
The GSDM family constitutes a central component of the pyroptosis pathway. Previous studies have predominantly focused on GSDMD as it possesses the capability to undergo cleavage and activate downstream pathways in both the classical and non-classical pyroptosis pathways.26 The pro-inflammatory signals mediated by GSDMD promote the growth of breast cancer, while the secretion of IL-1β drives an immunosuppressive phenotype, facilitating the metastasis of breast cancer.27 GSDME is a relatively new pyroptosis molecule that is found to be expressed at low levels in most tumors, making it a tumor suppressor.28 However, in certain types of tumors, like colon cancer, GSDME is highly expressed. In this context, GSDME promotes tumor growth by facilitating cell pyroptosis and releasing HMGB1.29 Our study indicates that the key pyroptosis molecule GSDME is highly expressed in HCC and is associated with poor prognosis. Furthermore, pyroptosis is a carcinogenic factor in HCC, as it can contribute to the formation of an inhibitory immune microenvironment, leading to tumor growth and progression.
This study establishes a pyroptosis-related risk model based on five gene characteristics (ADGRE2, FCER1G, SLC9A9, CYBB, and SLAMF6), which effectively predicts the prognosis of hepatocellular carcinoma (HCC). Among the five genes in our signature, the inclusion of ADGRE2 warrants specific discussion. While our analysis using the HPA database did not detect ADGRE2 protein expression, its necessity in the prognostic model is strongly supported by several lines of evidence. Firstly, from a statistical standpoint, ADGRE2 was identified as a significant prognostic factor and was retained after rigorous LASSO regression, a method that eliminates redundant variables and selects only the most predictive features. This indicates that ADGRE2 contributes uniquely to the model’s predictive accuracy. Secondly, the prognostic value of our model was consistently validated at the mRNA level across multiple independent cohorts. The potential discordance between mRNA and protein levels is a recognized biological occurrence. The identification of our five-gene signature’s strong association with the immune microenvironment prompts a deeper inquiry into the underlying mechanisms. Firstly, several components of our signature have direct or indirect links to the pyroptotic machinery. For instance, ADGRE2, previously identified as an oncogene in acute myeloid leukemia, has been reported to positively regulate the NLRP3 inflammasome, a crucial upstream activator of caspase-1 and subsequent GSDMD-mediated pyroptosis.30 Moreover, CYBB has been reported to be positively correlated with caspase-1, whose interaction can induce a potential inflammatory response.31 SLAMF6, an essential molecule for NK cell activation, is downregulated in HCC tissues, thereby facilitating immune evasion of tumor cells.32 The other two genes, SLC9A9 and FCER1G, while not yet directly implicated in pyroptosis in HCC, have established roles in regulating inflammatory signaling and cell stress responses, which are intricately linked with the initiation of pyroptosis.33–36 Based on these findings, we propose that these five genes modulate cellular inflammatory signals to induce pyroptosis and foster a suppressive immune microenvironment. This process ultimately contributes to the formation of a “cold” tumor and leads to a poor prognosis. While this pyroptosis-mediated mechanism is supported by existing literature, we acknowledge that it remains a computational hypothesis. Future experimental validation, such as by measuring cleaved GSDMD/GSDME levels or employing pyroptosis inhibitors in animal models, will be crucial to confirm this pathway.
For highly heterogeneous systems such as tumors, conventional transcriptome sequencing may result in the loss of a substantial amount of low-abundance information.37 Single-cell sequencing technology solves this problem by revealing the gene expression status of individual cells, reflecting the heterogeneity between cells, and providing an in-depth understanding of expression regulatory mechanisms during cell growth.38 By leveraging the benefits of two sequencing methods, we established a pyroptosis-related risk model and determined a negative correlation between pyroptosis and the prognosis of HCC. We also performed a thorough analysis to compare the differences between the pyroptosis risk groups in terms of immune infiltration, therapy response, and expression of m6A regulatory factors. Our findings suggest a correlation between pyroptosis and the progression of HCC. Further experimental validation is required to elucidate the specific mechanisms behind this phenomenon.
Despite the establishment of a risk model associated with pyroptosis in liver cancer through our research, and the validation of its accuracy using two GEO databases, which confirmed a negative correlation between pyroptosis and HCC prognosis, certain limitations remain. Firstly, despite our implementation of standardization procedures, systemic differences between datasets may still persist, potentially impacting the model’s generalizability. Secondly, the algorithms employed may exhibit sensitivity when handling high-dimensional data, which could lead to a lack of robustness in certain scenarios. Future research could consider comparing multiple algorithms to enhance the reliability of the results. Thirdly, while our model was validated in two external GEO cohorts, the sample sizes of GSE144269 (n=68) and GSE116174 (n=64) are relatively modest. This may limit the statistical power to fully confirm the model’s generalizability across diverse patient populations. We did not perform external validation on the nomogram in a separate, larger cohort, which is a crucial next step before its clinical application. Future validation in large, multi-center, prospective cohorts is necessary to solidify its prognostic utility. In addition, the small sample size for the scRNA-seq is a potential limitation of our study. Prospective clinical trials are required to validate the model’s real-world predictive power and clinical utility. Our study’s high-dimensional data analysis risks overfitting. Although we used LASSO regression with cross-validation to enhance robustness, the model’s performance may still be inflated in the training set. Thus, external validation and prospective studies—as conducted here—are essential to verify its true predictive power and generalizability. Moreover, future investigations are warranted to validate our findings in a broader panel of HCC cell lines and, crucially, to conduct HNRNPA2B1 rescue experiments to unequivocally confirm its role. Nonetheless, despite these limitations, this study is the first to elucidate the role of m6A modification in pyroptosis within HCC. The constructed model reveals the significance of PRGs in HCC, providing a foundational theoretical basis for the development of novel targeted therapies.
Data Sharing Statement
The raw data supporting the conclusions of this article are publicly available from The Cancer Genome Atlas (TCGA) (LIHC) and the Gene Expression Omnibus (GEO) (GSE146115, GSE162616, GSE149614, GSE125449, GSE144269, GSE116174). The datasets generated during and/or analysed during the current study are available from the corresponding author on reasonable request.
Ethics Approval and Consent to Participate
This study uses anonymized, publicly available data from TCGA-HCC and GEO. As per Article 32 of China’s “Measures for the Ethical Review of Life Science and Medical Research Involving Human Subjects” (2023), this research is exempt from institutional ethics review.
Acknowledgments
We are particularly grateful to Professor Liu Kun from the Department of Epidemiology and Biostatistics, School of Preventive Medicine, Air Force Medical University, for his invaluable guidance on the statistical aspects of this article.
Author Contributions
Conceptualization, Jiangbo Li, Yupeng Di, Xiaoli Kang, and Zhijia Sun; Data curation, Jiangbo Li; Methodology, Yupeng Di and Xiaoli Kang; Project administration, Zhijia Sun; Resources, Zhuo Song; Software, Jiangbo Li; Supervision, Zhijia Sun; Validation, Jiangbo Li; Visualization, Yupeng Di and Xiaoli Kang; Writing – original draft, Jiangbo Li; Writing – review & editing, Zhijia Sun. All authors made a significant contribution to the work reported, whether that is in the conception, study design, execution, acquisition of data, analysis and interpretation, or in all these areas; took part in drafting, revising or critically reviewing the article; gave final approval of the version to be published; have agreed on the journal to which the article has been submitted; and agree to be accountable for all aspects of the work.
Funding
There is no funding to report.
Disclosure
The authors declare that they have no competing interests.
References
1. Berkemeyer S. Primary liver cancers: connecting the dots of cellular studies and epidemiology with metabolomics. Int J Mol Sci. 2023;24:2409. doi:10.3390/ijms24032409
2. Singal AG, Kanwal F, Llovet JM. Global trends in hepatocellular carcinoma epidemiology: implications for screening, prevention and therapy. Nat Rev Clin Oncol. 2023;20:864–884. doi:10.1038/s41571-023-00825-3
3. He X, Ma J, Yan X, et al. CDT1 is a potential therapeutic target for the progression of NAFLD to HCC and the exacerbation of cancer. Curr Genomics. 2025;26(3):225–243. doi:10.2174/0113892029313473240919105819
4. Bibi K, Fatima T, Sohrab S, Haider G, Zarina S, Ilyas A. Polymorphic variants of ASS1 gene related to arginine metabolism and the risk of HCC. Protein Pept Lett. 2023;30(7):587–596. doi:10.2174/0929866530666230529143121
5. Fang Y, Tian S, Pan Y, et al. Pyroptosis: a new frontier in cancer. Biomed Pharmacother. 2020;121:109595. doi:10.1016/j.biopha.2019.109595
6. Wang Q, Wang Y, Ding J, et al. A bioorthogonal system reveals antitumour immune function of pyroptosis. Nature. 2020;579:421–426. doi:10.1038/s41586-020-2079-1
7. Hsu SK, Li CY, Lin IL, et al. Inflammation-related pyroptosis, a novel programmed cell death pathway, and its crosstalk with immune therapy in cancer treatment. Theranostics. 2021;11:8813–8835. doi:10.7150/thno.62521
8. Ruan J, Wang S, Wang J. Mechanism and regulation of pyroptosis-mediated in cancer cell death. Chem Biol Interact. 2020;323:109052. doi:10.1016/j.cbi.2020.109052
9. Hu Y, Chen D, Hong M, et al. Apoptosis, pyroptosis, and ferroptosis conspiringly induce immunosuppressive hepatocellular carcinoma microenvironment and gammadelta T-Cell imbalance. Front Immunol. 2022;13:845974. doi:10.3389/fimmu.2022.845974
10. Li G, Zhang D, Liang C, Liang C, Wu J. Construction and validation of a prognostic model of pyroptosis related genes in hepatocellular carcinoma. Front Oncol. 2022;12:1021775. doi:10.3389/fonc.2022.1021775
11. Wu Q, Jiang S, Cheng T, Xu M, Lu B. A novel pyroptosis-related prognostic model for hepatocellular carcinoma. Front Cell Dev Biol. 2021;9:770301. doi:10.3389/fcell.2021.770301
12. Wolf FA, Angerer P, Theis FJ. SCANPY: large-scale single-cell gene expression data analysis. Genome Biol. 2018;19:15. doi:10.1186/s13059-017-1382-0
13. Dominguez Conde C, Xu C, Jarvis LB, et al. Cross-tissue immune cell analysis reveals tissue-specific features in humans. Science. 2022;376:eabl5197. doi:10.1126/science.abl5197
14. Langfelder P, Horvath S. WGCNA: an R package for weighted correlation network analysis. BMC Bioinf. 2008;9:559. doi:10.1186/1471-2105-9-559
15. Bindea G, Mlecnik B, Tosolini M, et al. Spatiotemporal dynamics of intratumoral immune cells reveal the immune landscape in human cancer. Immunity. 2013;39:782–795. doi:10.1016/j.immuni.2013.10.003
16. Pagliuca S, Gurnari C, Rubio MT, Visconte V, Lenz TL. Individual HLA heterogeneity and its implications for cellular immune evasion in cancer and beyond. Front Immunol. 2022;13:944872. doi:10.3389/fimmu.2022.944872
17. Chowell D, Morris LGT, Grigg CM, et al. Patient HLA class I genotype influences cancer response to checkpoint blockade immunotherapy. Science. 2018;359:582–587. doi:10.1126/science.aao4572
18. Givechian KB, Wnuk K, Garner C, et al. Identification of an immune gene expression signature associated with favorable clinical features in Treg-enriched patient tumor samples. NPJ Genom Med. 2018;3:14. doi:10.1038/s41525-018-0054-7
19. Jiang P, Gu S, Pan D, et al. Signatures of T cell dysfunction and exclusion predict cancer immunotherapy response. Nat Med. 2018;24:1550–1558. doi:10.1038/s41591-018-0136-1
20. Sun Z, Mai H, Xue C, et al. Hsa-LINC02418/mmu-4930573I07Rik regulated by METTL3 dictates anti-PD-L1 immunotherapeutic efficacy via enhancement of Trim21-mediated PD-L1 ubiquitination. J Immunother Cancer. 2023;11(12):e007415. doi:10.1136/jitc-2023-007415
21. Sun Z, Li J, Zhang Z, et al. WTAP-mediated m6A modification of JUNB contributes to poor prognosis of HCC patients through the NLRP3-GSDMD pathway. Chin Med J. 2025;138(5):622–624. doi:10.1097/CM9.0000000000003468
22. Yin Q, Song SY, Bian Y, et al. Unlocking the potential of pyroptosis in tumor immunotherapy: a new horizon in cancer treatment. Front Immunol. 2024;15:1381778. doi:10.3389/fimmu.2024.1381778
23. Weichand B, Popp R, Dziumbla S, et al. S1PR1 on tumor-associated macrophages promotes lymphangiogenesis and metastasis via NLRP3/IL-1β. J Exp Med. 2017;214(9):2695–2713. doi:10.1084/jem.20160392
24. Gudivada IP, Amajala KC. Integrative bioinformatics analysis for targeting hub genes in hepatocellular carcinoma treatment. Curr Genomics. 2025;26(1):48–80. doi:10.2174/0113892029308243240709073945
25. Xu W, Liao S, Hu Y, Huang Y, Zhou J. Upregulation of miR-3130-5p enhances hepatocellular carcinoma growth by suppressing ferredoxin 1: miR-3130-5p enhances HCC growth via inhibiting FDX1. Curr Mol Pharmacol. 2024;17:e18761429358008. doi:10.2174/0118761429358008250305070518
26. Barber G, Anand A, Katarzyna O, et al. Characterizing caspase-1 involvement during esophageal disease progression. Cancer Immunol Immunother. 2020;69:2635–2649. doi:10.1007/s00262-020-02650-4
27. Ershaid N, Sharon Y, Doron H, et al. NLRP3 inflammasome in fibroblasts links tissue damage with inflammation in breast cancer progression and metastasis. Nat Commun. 2019;10:4375. doi:10.1038/s41467-019-12370-8
28. Zhang Z, Zhang Y, Xia S, et al. Gasdermin E suppresses tumour growth by activating anti-tumour immunity. Nature. 2020;579:415–420. doi:10.1038/s41586-020-2071-9
29. Tan G, Huang C, Chen J, Zhi F. HMGB1 released from GSDME-mediated pyroptotic epithelial cells participates in the tumorigenesis of colitis-associated colorectal cancer through the ERK1/2 pathway. J Hematol Oncol. 2020;13. doi:10.1186/s13045-020-00985-0
30. Ky I, Tseng WY, Wang WC, Gordon S, Ng KF, Lin HH. Stimulation of vibratory urticaria-associated adhesion-GPCR, EMR2/ADGRE2, triggers the NLRP3 inflammasome activation signal in human monocytes. Front Immunol. 2021;11:602016. doi:10.3389/fimmu.2020.602016
31. Zeng X, Luo X, Mao X, Wen D, Zhang H, Wang J. Inflammatory and immune-related factor Caspase 1 contributes to the development of oral lichen planus. Arch Oral Biol. 2021;131:105244. doi:10.1016/j.archoralbio.2021.105244
32. Sun H, Kim E, Ryu J, et al. TM4SF5-mediated liver malignancy involves NK cell exhaustion-like phenotypes. Cell Mol Life Sci. 2021;79(1):49. doi:10.1007/s00018-021-04051-x
33. Li S, Du H, Gan D, Li X, Zao X, Ye Y. Integrated analysis of single-cell and bulk RNA-sequencing reveals tumor heterogeneity and a signature based on NK cell marker genes for predicting prognosis in hepatocellular carcinoma. Front Pharmacol. 2023;14:1200114. doi:10.3389/fphar.2023.1200114
34. Guang D, Xiaofei Z, Yu M, Hui N, Min S, Xiaonan S. Pomiferin targeting SLC9A9 based on histone acetylation modification pattern is a potential therapeutical option for gastric cancer with high malignancy. Biochem Pharmacol. 2024;226:116333. doi:10.1016/j.bcp.2024.116333
35. Dong K, Chen W, Pan X, et al. FCER1G positively relates to macrophage infiltration in clear cell renal cell carcinoma and contributes to unfavorable prognosis by regulating tumor immunity. BMC Cancer. 2022;22(1):140. doi:10.1186/s12885-022-09251-7
36. Yang R, Chen Z, Liang L, et al. Fc Fragment of IgE Receptor Ig (FCER1G) acts as a key gene involved in cancer immune infiltration and tumour microenvironment. Immunology. 2023;168(2):302–319. doi:10.1111/imm.13557
37. Xu Y, Su GH, Ma D, Xiao Y, Shao ZM, Jiang YZ. Technological advances in cancer immunity: from immunogenomics to single-cell analysis and artificial intelligence. Signal Transduct Target Ther. 2021;6:312. doi:10.1038/s41392-021-00729-7
38. Choi JR, Yong KW, Choi JY, Cowie AC. Single-cell RNA sequencing and its combination with protein and DNA analyses. Cells. 2020;10:9. doi:10.3390/cells10010009
 © 2025 The Author(s). This work is published and licensed by Dove Medical Press Limited. The
full terms of this license are available at https://www.dovepress.com/terms
and incorporate the Creative Commons Attribution
- Non Commercial (unported, 4.0) License.
By accessing the work you hereby accept the Terms. Non-commercial uses of the work are permitted
without any further permission from Dove Medical Press Limited, provided the work is properly
attributed. For permission for commercial use of this work, please see paragraphs 4.2 and 5 of our Terms.
© 2025 The Author(s). This work is published and licensed by Dove Medical Press Limited. The
full terms of this license are available at https://www.dovepress.com/terms
and incorporate the Creative Commons Attribution
- Non Commercial (unported, 4.0) License.
By accessing the work you hereby accept the Terms. Non-commercial uses of the work are permitted
without any further permission from Dove Medical Press Limited, provided the work is properly
attributed. For permission for commercial use of this work, please see paragraphs 4.2 and 5 of our Terms.
Recommended articles
Single-Cell RNA Sequencing Revealed That the Enrichment of TPI1+ Malignant Hepatocytes Was Linked to HCC Metastasis and Immunosuppressive Microenvironment
Liang Y, Zhong D, Yang Q, Tang Y, Qin Y, Su Y, Huang X, Shang J
Journal of Hepatocellular Carcinoma 2024, 11:373-383
Published Date: 22 February 2024