Back to Journals » Breast Cancer: Targets and Therapy » Volume 17
Integrated Pan-Cancer Profiling and Breast Cancer Validation Identify BEND3 as a Potential Prognostic and Immune Biomarker
Authors Gou Y, Li Y ![]() , Wang Y, Ma H, Li H, Geni R, Ismtula D, Guo C
, Wang Y, Ma H, Li H, Geni R, Ismtula D, Guo C
Received 14 July 2025
Accepted for publication 20 December 2025
Published 30 December 2025 Volume 2025:17 Pages 1439—1461
DOI https://doi.org/10.2147/BCTT.S553681
Checked for plagiarism Yes
Review by Single anonymous peer review
Peer reviewer comments 6
Editor who approved publication: Professor Pranela Rameshwar
Yuting Gou,1,* Yongxiang Li,1,* Yiyang Wang,1,* Haotian Ma,1 Haocong Li,2 Reyima Geni,2 Dilimulati Ismtula,1 Chenming Guo1,3
1Department of Breast Surgery, Center of Digestive and Vascular, The First Affiliated Hospital of Xinjiang Medical University, Urumqi, People’s Republic of China; 2Department of Clinical Medicine, Xinjiang Medical University, Urumqi, People’s Republic of China; 3State Key Laboratory of Pathogenesis, Prevention and Treatment of High Incidence Diseases in Central Asia, The First Affiliated Hospital of Xinjiang Medical University, Urumqi, People’s Republic of China
*These authors contributed equally to this work
Correspondence: Chenming Guo; Dilimulati Ismtula, Email [email protected]; [email protected]
Purpose: BEND3 is implicated in various physiological processes, including chromatin regulation, cell cycle regulation, etc.; nonetheless, its function in cancer is not well comprehended.
Methods: Using public databases including UCSC Xena, TCGA, GTEx, and GEO, we conducted a comprehensive pan-cancer analysis to evaluate the clinical relevance of BEND3 across 33 cancer types. We analyzed genetic alterations, copy number variations (CNVs), and methylation profiles of BEND3, and explored its associations with tumor mutational burden (TMB), microsatellite instability (MSI), immune checkpoint molecules, and the tumor immune microenvironment. A protein-protein interaction (PPI) network and functional enrichment analysis were performed to investigate potential molecular mechanisms. In vitro, BEND3 expression was assessed by immunohistochemistry (IHC), Western blot (WB), and qRT-PCR. Cell Counting Kit-8 (CCK-8), colony formation, and wound healing assays were performed to validate BEND3’s oncogenic role in breast cancer cell lines.
Results: Our results show that BEND3 is frequently overexpressed in multiple cancers, including breast, liver, lung, thyroid, and gastric cancers, among others, and is associated with poor prognosis. Its expression correlates with TMB, MSI, immune checkpoint molecules, and immunoinfiltration, suggesting a role in tumor immunity. Functional analysis indicates involvement in key cancer-related pathways. In breast cancer, BEND3 was upregulated in clinical tissues and cell lines, and in vitro experiments demonstrated that BEND3 overexpression promoted the proliferation, migration, and invasion of breast cancer cells, whereas its knockdown suppressed these phenotypes.
Conclusion: Our findings suggest BEND3 is a potential prognostic and immune-related cancer biomarker. Its overexpression in multiple cancers, association with poor survival, and role in tumor immunity support its oncogenic function. Functional analysis indicates it may regulate key cancer pathways. Importantly, in vitro experiments confirm its tumor-promoting effects in breast cancer, providing a foundation for further study of BEND3’s mechanisms and therapeutic implications.
Keywords: BEND3, pan-cancer, prognosis, tumor immunity, methylation
Introduction
Cancer constitutes a complex and highly heterogeneous disease, standing out as a significant global public health concern with increasing incidence year by year.1 Recent advances in high-throughput sequencing have made pan-cancer genomic analysis a key tool in cancer research. By integrating multi-omics data across tumor types, this approach uncovers genetic drivers and molecular mechanisms of cancer. It supports precision medicine by identifying potential therapeutic targets and biomarkers, thereby informing drug development and improving our understanding of cancer biology.2,3
The BEND3 gene, known in full as BEN Domain Containing 3, is positioned on human chromosome 6q21 and generates a protein encompassing a BEN domain, belonging to the BEND3 family. This protein comprises four functionally distinct BEN domains (BD1-BD4), each approximately 80 amino acids in length. BD1 primarily facilitates protein-protein interactions, whereas BD4 is capable of interacting with DNA.4,5 Research shows that BEND3 is crucial for chromatin regulation,6–8 cell cycle control,9 and maintaining cellular pluripotency.10
Notably, BEND3 exhibits significantly increased expression in various cancer cell lines.9 Studies have indicated that it may be implicated in the exosome regulatory pathway of colorectal cancer.11 In acute myeloid leukemia (LAML), the efficacy of the drug TAK-243 closely correlates with BEND3 expression levels.12 Additionally, breast cancer (BRCA) research utilizing the TCGA database has highlighted BEND3’s importance as a prognostic marker,13 with its expression being linked to the incidence of visceral metastasis.14 BEND3 is also identified as a critical CD24-related biomarker in BRCA specifically.15 These observations suggest that BEND3 may serve a critical function in tumor initiation and progression.
This research presents an extensive pan-cancer analysis of the BEND3 gene, offering valuable insights for tumor diagnosis, innovative immunotherapy strategies, and clinical studies on epigenetic treatments.
Material and Methods
Analysis of BEND3 Expression Data Across Various Cancer Types
The research initiated with the acquisition of a standardized TCGA pan-cancer and GTEx dataset from the UCSC XENA (https://xenabrowser.net/)16 to analyze BEND3 expression across different cancer types. This dataset comprehensively incorporates RNA-seq expression profile data from 18,102 samples across 33 cancer types, including 7,568 normal tissue samples from GTEx, 727 adjacent non-tumor tissues from TCGA, and 9,807 tumor samples from TCGA. We selected this resource because its unified Toil pipeline minimizes technical variability between TCGA and GTEx data. Gene expression values (TPM) were log2-transformed prior to downstream analysis. To enhance the generalizability of our findings, we utilized six independent validation cohorts from the Gene Expression Omnibus (GEO) database: GSE42568, GSE63514, GSE9348, GSE12148, GSE40791, and GSE40595. The “GEOquery” R package was used to facilitate the retrieval process. Subsequently, to mitigate batch effects, We applied the “normalizeBetweenArrays” in the “limma package” R package for data normalization and updating probe annotations based on the most recent hgu133plus2. db annotation file. We assessed BEND3 protein levels in 16 malignant tumors using immunohistochemical data from the Human Protein Atlas (HPA, https://www.proteinatlas.org/).
Prognostic Evaluation of BEND3 in Pan-Cancers
By leveraging transcriptome data from the TCGA database, we systematically investigated the prognostic role of BEND3 gene expression across various cancer types. We combined BEND3 gene expression data with clinical prognostic metrics, such as overall survival (OS), disease-specific survival (DSS), and progression-free interval (PFI), across 33 cancer types. Using median dichotomization, patients were classified into high and low expression categories to correlate with prognostic outcomes. The prognostic significance of BEND3 expression was assessed using univariate Cox regression analysis with the “survival” and “survminer” packages in R.
Evaluation of the Auxiliary Diagnostic Potential of BEND3 Across Pan-Cancer
To systematically assess the diagnostic efficacy of the BEND3 gene across various cancers, we use TCGA-GTEx dataset from the UCSC Xena platform. Diagnostic performance was assessed using the receiver operating characteristic (ROC) curve, with BEND3 expression values used as the sole predictor to distinguish tumor from normal samples, representing a univariate assessment of its discriminative power. The area under the curve (AUC) was used to quantify diagnostic value: AUC values of 0.9 or higher demonstrate high diagnostic accuracy, whereas AUCs ranging from 0.7 to 0.9 indicate moderate diagnostic capability. The “pROC” R package is used for statistical analyses.
Build and Calibrate Nomograms
To assess BEND3’s independent OS prognostic significance across various cancers, we started by conducting a univariate Cox regression analysis to determine potential prognostic variables, applying a significance threshold of p<0.1. Subsequently, we incorporated these chosen variables into multivariate Cox regression analyses. Statistical significance was assessed with a P-value criterion of less than 0.05. Based on the median threshold, BEND3 expression levels were categorized high and low groups and incorporated into the model as an independent predictor.
We designed a prognostic nomogram that combines BEND3 expression levels with clinical parameters, including sex, grade, stage, T stage, and lymph node metastasis. Survival probabilities at 1, 3, and 5 years for different cancers are predicted by the nomogram. Model accuracy was evaluated using the concordance index (C-index). Cox regression analyses and tests of the proportional hazards assumption were performed using the “survival” R package, while nomogram construction and visualization were carried out using the “rms” R package.
Analysis of Genetic Variation in BEND3
Mutation analyses were performed using cBioPortal (https://www.cbioportal.org),17 with somatic variant data derived from the TCGA PanCancer Atlas. Using the GSCA platform (http://bioinfo.life.hust.edu.cn/GSCA/#/),18 we analyzed BEND3 copy number variations (CNVs) across multiple cancers and evaluated their associations with BEND3 expression, patient survival, and prognosis. COSMIC database data (https://cancer.sanger.ac.uk/cosmic) were used to assess the relative frequencies of BEND3 CNVs and single nucleotide variants (SNVs) across cancers, enhancing the depth of our analysis.
Methylation Analysis
We utilized the UALCAN database (https://ualcan.path.uab.edu/)19 to investigate the correlation between BEND3 methylation and expression across different cancer types by comparing promoter region methylation levels in BEND3 between adjacent normal and tumor tissues. The β value, which ranges from 0 to 1, is used to express the extent of methylation, with 0 meaning no methylation and 1 meaning complete methylation. The β value between 0.5 and 0.7 is generally defined as hypermethylation, and 0.25 to 0.3 is a hypomethylation state. We employed the GSCA platform to assess how the methylation of BEND3 influences prognosis for patients with various cancers. This analysis aimed to determine how methylation of the BEND3 gene influences patient survival outcomes.
BEND3 Expression Links to Genomic Heterogeneity and Immune
We investigated the relationship between genomic heterogeneity and BEND3 expression by analyzing its correlation with crucial immunological factors, TMB, MSI, and neoantigens (NEO), across multiple cancer types using the Sangerbox 3.0 online (http://sangerbox.com/).20 Employing R project for the computation of StromalScore, ImmuneScore, and ESTIMATEScore. These scores provided insights into the tumor microenvironment’s immune and stromal components. We proceeded to investigate how BEND3 and immune checkpoint molecules are co-expressed. We examined the association between BEND3 expression and immune-related genes by obtaining a collection of immune activating and suppressive genes from the GSEA database. This enabled us to examine how BEND3 expression correlates with these immune-related genes.
Analysis of Immune Infiltration
This study utilized the “GSVA” R package to analyze immune infiltration status using 24 immune cell markers.21,22 Additionally, we used the TIMER2.0 database (http://timer.cistrome.org/)23 to examine how BEND3 expression is linked to immune cell infiltration in various cancer types. To evaluate the abundance of seven cell types, including cancer-associated fibroblasts (CAFs) and CD8+ T cells, we used the EPIC, MCP-COUNTER, CIBERSORT, and TIDE algorithms. Insights into BEND3’s role in the tumor microenvironment were offered by a scatter plot showing the correlation between BEND3 expression and CAF abundance.
Analysis of the Role of BEND3 in Various Cancers by Functional Enrichment and Protein-Protein Interaction (PPI) Networks
We constructed a PPI network for BEND3 using the STRING database (https://cn.string-db.org/, v11.5),24 focusing on experimentally validated interactions, and visualized it in Cytoscape.25 Functional enrichment was performed with the “clusterProfiler” R package, including Gene Ontology (GO) terms for biological process (BP), cellular component (CC), and molecular function (MF), as well as KEGG pathway analysis. Enrichment results were filtered for adjusted p<0.05 (Benjamini–Hochberg correction) and a minimum gene set size of 10, and displayed as bubble plots.
Differential expression analysis was performed between high and low BEND3 expression groups, defined by the median BEND3 expression level in TCGA, using “DESeq2” on raw RNA-seq counts. For each of the 33 cancer types, Gene Set Enrichment Analysis (GSEA) was carried out with clusterProfiler based on MSigDB Reactome gene sets, using 1,000 permutations and significance thresholds of nominal p<0.05 and FDR<0.25. The top 10 enriched Reactome pathways for each cancer type were visualized as ridge plots.
Statistical Analysis
R project (version 4.2.1) was utilized for statistical evaluations, and the “ggplot2” package was utilized for visualization. The Student’s t-test or the Wilcoxon rank-sum test was employed to compare continuous variables between groups, depending on the normal distribution of the data. Spearman’s rank correlation assessed the relationship between two continuous variables, suitable for non-normally distributed data. Kaplan–Meier survival curves were used to evaluate time-to-event outcomes, and group differences were analyzed using the two-sided Log rank test. p<0.05 was considered statistically significant.
Patient Tissue Collection
Samples of clinical tumors and nearby normal tissues were obtained from eight individuals with breast cancer who had surgical treatment at the Department of Breast Surgery, The First Affiliated Hospital of Xinjiang Medical University. All cases were strictly selected according to predefined inclusion and exclusion criteria, ensuring that not one of the patients had undergone radiotherapy, chemotherapy, or hormone therapy before their surgical procedure. The Ethics Committee of The First Affiliated Hospital of Xinjiang Medical University approved the study (Ethics No. 230714–07). Informed consent was obtained from all participants. Tissues obtained post-surgery were swiftly frozen in liquid nitrogen and maintained at −80°C for later examination.
Immunohistochemical
The study included 8 pairs of paraffin-embedded breast cancer tissues and their corresponding normal tissues, which were sectioned at a thickness of 6μm for IHC. Sections were stained using a specific rabbit anti-human BEND3 antibody (PA5-117808, Invitrogen, 1:50) following standard protocols. The evaluation of staining results was conducted independently by two knowledgeable pathologists in a blinded manner. BEND3 protein expression was evaluated using a semi-quantitative scoring system. Staining intensity was rated on a scale from 0 to 3, where the value 0 indicates no staining, 1 shows a weak positive, 2 shows a moderate positive, and 3 shows a strong positive. Positive cell proportions were scored from 1 to 4, with 1 corresponding to 25% or less, 2 to 26%-50%, 3 to 51%-75%, and 4 to 76% or more. A total score was calculated by multiplying the intensity and proportion scores, yielding a possible range of 0–12. Samples were categorized into low-expression (0–5) and high-expression (6–12) groups for further statistical analysis based on this score. To assess inter-observer variability, we calculated Cohen’s kappa coefficient to evaluate the agreement between the two pathologists, which confirmed almost perfect concordance (κ=0.875).
Cell Culture
Two breast cancer cell lines, MCF-7 and MDA-MB-231, obtained from Procell Life Science & Technology Co., Ltd., China, were authentication using STR analysis. MCF-7 and MDA-MB-231 cells were cultured in DEME (PM150210; Procell) supplemented with 10% fetal bovine serum (10091148, Gibco, China), 0.5μg/mL streptomycin, and 0.5U/mL penicillin (SV30010, Hyclone, USA) under 5% CO2 at 37°C.
Plasmid Construction and Transfection
Lentiviral vectors for BEND3 knockdown and overexpression were constructed. Three shRNAs targeting BEND3 were cloned into the lentiviral vector GV493 (Supplementary Table S1). The full-length BEND3 cDNA was amplified and cloned into the GV385 vector. All constructs were verified by restriction digestion and Sanger sequencing. The successfully constructed shRNA or BEND3 overexpression plasmid (2μg each) was mixed with packaging plasmids in the ratio specified by the Lipofectamine 3000 reagent protocol (Invitrogen, Shanghai, China) and transfected into HEK-293T cells at approximately 80% confluence. The supernatant of the culture was obtained 48 hours post-transfection, and the supernatant was passed through the filter and then ultracentrifuged. After removing the supernatant, resuspend the virus pellet in storage buffer, divide into aliquots, and store at −80°C for future infection experiments.
Lentiviral Infection and Grouping
Viral infection experiments commence when MCF-7 and MDA-MB-231 breast cancer cells achieve around 80% confluence. The concentrated viral suspension is added to the culture system, and after 24 hours of infection, the medium is replaced with fresh complete culture medium, and the cells are grown for an additional 48-hour period. According to the experimental design, cells are divided into four groups: BEND3 knockdown control group (NC-KD), BEND3 knockdown group (KD), BEND3 overexpression control group (NC-OE), and BEND3 overexpression group (OE). Fluorescence microscopy is used to evaluate target gene expression levels in each group 72 hours after infection. Once stable expression is confirmed and the cell condition stabilizes, the cells are collected for subsequent experiments.
RNA Extraction and qRT-PCR
Following the instructions provided by the manufacturer, TRIzol reagent (Invitrogen, Shanghai, China) was employed to isolate total RNA from breast cancer tissues and cells. Using the SYBR Green PCR Kit (Takara, Beijing, China), cDNA was created through synthesis and the BEND3 fragment was amplified in a 20μL reaction system with specific forward and reverse primers. qRT-PCR with quantitative analysis was conducted using qRT-PCR System, with amplification signals recorded automatically. BEND3 expression levels were quantified using the 2−^ΔΔCT method, normalized against reference genes. Primer sequences for BEND3 and internal controls are listed in Supplementary Table S1.
Protein Extraction and Western Blot
Total protein was extracted from breast cancer cells and tissues using RIPA lysis buffer (P0013C, Beyotime) supplemented with PMSF (P0013B, Beyotime). Lysates were centrifuged, and the supernatants were collected. Protein concentrations were measured using a BCA assay kit (P0012S, Beyotime), and samples were adjusted to equal concentrations.
After protein separation and membrane transfer, membranes were blocked with 5% skim milk for 1h at room temperature, followed by overnight incubation with primary antibodies: rabbit anti-BEND3 (PA5-117808, Invitrogen, 1:1000) and mouse anti-β-actin (ab273577, Santa Cruz Biotechnology, 1:1000). The next day, the membrane was placed at room temperature and incubated for one hour with HRP-conjugated secondary antibodies provided by Cell Signaling Technology in Massachusetts, USA. Protein bands were detected using ECL reagents (Cell Signaling Technology), imaged using a Bio-Rad system, and quantified by ImageJ software. For loading, β-actin was used as an internal control.
Cell Counting Kit-8 Experiments
The investigators used the Cell Counting Kit-8 (CCK-8, Dojindo, Japan) to determine the proliferation of MCF-7 and MDA-MB-231 breast cancer cells. In 96-well plates, cells were maintained at 37°C with 5% CO2 for periods ranging from 1 to 5 days. CCK-8 solution was added to each well at each time point and incubated at 37°C for 1.5 hours. Absorbance (OD value) was measured at 450 nm using a multimode microplate reader (Tecan Infinite, Switzerland). Graphs of cell growth were plotted with time on the horizontal axis and optical density (OD) measurements on the vertical axis.
Clone Formation Experiments
MCF-7 and MDA-MB-231 breast cancer cell lines, in logarithmic growth phase, were seeded at about 1000 cells per well in 6-well plates and kept in culture for 14 days. Cells were washed with phosphate-buffered saline (PBS) after removing the culture medium, fixed with pre-cooled methanol for 15 minutes, and stained with 0.1% crystal violet solution (C0121, Beyotime, China) at room temperature for 30 minutes. To remove the surplus stain, the plate was gently rinsed with distilled water and then allowed to dry in the air. Colonies were observed at 200× magnification using an inverted microscope (MF52-N, Mshot, China), and photos were captured using a digital camera.
Transwell Experiment
The experiments for cell migration and invasion utilized 24-well Transwell chambers (3422, Corning, USA). MCF-7 and MDA-MB-231 cells, both transfected and control, were seeded into the upper chambers with 8μm pore size filters, with or without Matrigel coating. To function as a chemoattractant, the lower chamber was filled with 600μL of medium containing 10% FBS. Following a 24 hour incubation period, cells that remained on the upper side of the membrane without migrating or invading were eliminated using a cotton swab. Cells that managed to migrate or invade were treated with methanol for 15 minutes and then stained using 0.1% crystal violet. A minimum of five random fields were captured using an inverted microscope (MF52-N, Mshot, China) at 200× magnification.
Cell Wound Scratch Assay
During their exponential growth phase, MCF-7 and MDA-MB-231 cells were planted into 6-well plates at a concentration of roughly 5×10⁵ cells per well and maintained in a 10% FBS medium at 37°C with 5% CO2 until they exceeded 90% confluence. A scratch wound was made using a sterile 200μL pipette tip. The cells were rinsed twice with PBS to clear away debris and then incubated in a medium without serum. Wound images were initially captured at 200× magnification using an inverted microscope (MF52-N, Mshot, China), and wound closure was evaluated after 24 hours.
Results
Gene Expression Analysis of BEND3
Our analysis of the TCGA pan-cancer dataset showed that BEND3 was significantly overexpressed in 14 malignancies in comparison to the equivalent healthy tissues (Figure 1A). These carcinomas include bladder urothelial (BLCA), breast invasive (BRCA), cervical squamous cell and endocervical adenocarcinoma (CESC), cholangiocarcinoma (CHOL), colon adenocarcinoma (COAD), esophageal (ESCA), head and neck squamous cell (HNSC), hepatocellular (LIHC), lung adenocarcinoma (LUAD), lung squamous cell (LUSC), prostate adenocarcinoma (PRAD), rectal adenocarcinoma (READ), thyroid (THCA), and uterine corpus endometrial (UCEC). Conversely, BEND3 expression was lower in chromophobe renal cell carcinoma (KICH) and clear cell renal cell carcinoma (KIRC).
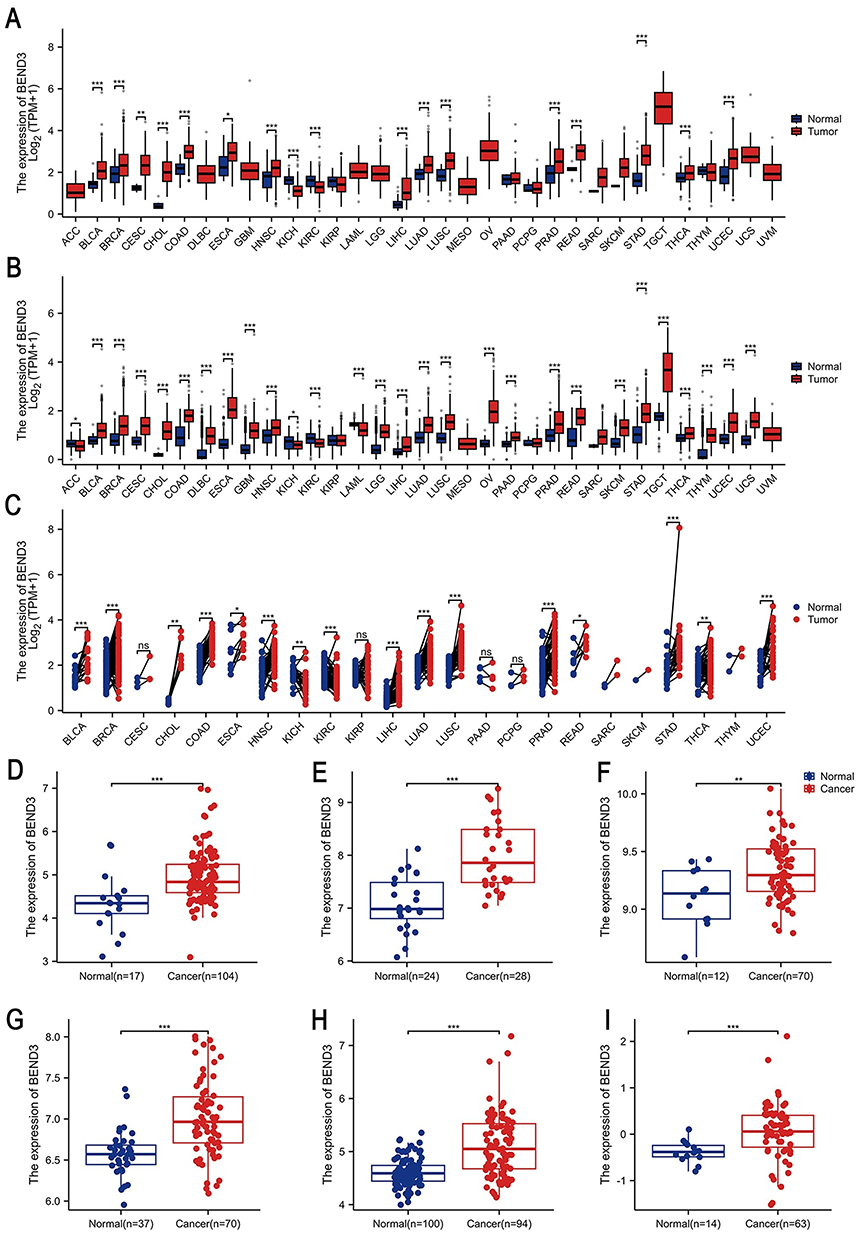 |
Figure 1 Differential analysis of BEND3 mRNA expression across 33 types of cancer. Comparison of BEND3 mRNA expression levels in tumor samples versus corresponding normal tissues based on the (A) TCGA dataset and (B) TCGA-GTEx dataset. (C) Comparison of BEND3 mRNA expression between TCGA tumor samples and their paired normal tissues based on the TCGA dataset. BEND3 expression changes were further validated using GEO datasets specific to certain cancer types, including: (D) BRCA (GSE42568), (E) CESC (GSE63514), (F) COAD (GSE9348), (G) LIHC (GSE121248), (H) LUAD (GSE40791), (I) OV (GSE40595). * p<0.05, ** p<0.01, *** p<0.001, ns represents no statistical significance. |
To validate these findings, we integrated TCGA tumor samples with GTEx no-tumor tissue data to create a cross-cancer cohort. A significant increase in BEND3 expression was observed in 24 types of cancer. (Figure 1B), including BLCA, BRCA, CESC, CHOL, COAD, DLBC, ESCA, GBM, HNSC, LGG, LIHC, LUAD, LUSC, OV, PAAD, PRAD, READ, SKCM, STAD, TGCT, THCA, THYM, UCEC, and UCS. BEND3 expression was decreased in adrenocortical carcinoma (ACC), KICH, KIRC, and acute myeloid leukemia (LAML). In the analysis of 23 cancers with control samples, the expression of BEND3 was markedly upregulated in 14 different types of cancer (Figure 1C), including BRCA, BLCA, CHOL, COAD, ESCA, HNSC, LIHC, LUAD, LUSC, PRAD, READ, STAD, THCA, and UCEC. Expression was significantly downregulated in KICH and KIRC. Datasets from the GEO database were employed to confirm our findings. In particular, in BRCA (p=1.5e-04), CESC (p=9.6e-07), COAD (p=5.2e-03), LIHC (p=2e-08), LUAD (p=3.8e-11), and OV (p=7e-04) (Figure 1D–I), BEND3 expression levels were significantly elevated compared to matched normal tissues.
The HPA database was employed to assess BEND3 protein expression differences between normal and malignant tissues across various cancer types. The study included the following cancer types: BLCA, BRCA, CESC, COAD, HNSC, LIHC, DLBC, LUAD, LUSC, OV, PAAD, PRAD, READ, STAD, THCA, and TGCT (Figure S1A–P). Protein level results corroborated our mRNA expression findings, strengthening the validity of our conclusions.
Prognostic Significance of BEND3 in Pan-Cancers
The analysis of survival data from the TCGA database was conducted using univariate Cox regression and Kaplan-Meier (KM) methods. Analysis of OS indicated that BEND3 overexpression serves as a risk factor across multiple tumor types, such as ACC (p=0.023), BRCA (p=0.037), KIRP (p=0.026), LIHC (p=0.027), MESO (p=0.003), SARC (p=0.046), SKCM (p=0.019), and STAD (p=0.049). Conversely, BEND3 overexpression acted as a protective factor in LAML (p=0.037) and READ (p=0.020) (Figure 2A and Figure S2A). DSS analysis identified BEND3 overexpression as a risk factor for several cancers, including ACC (p=0.040), BRCA (p=0.012), KIRP (p=0.009), LIHC (p=0.004), MESO (p=0.003), and SKCM (p=0.047) (Figure 2B and Figure S2B). PFI analysis identified BEND3 overexpression as a risk factor for ACC (p=0.012), BRCA (p=0.018), CESC (p=0.023), KIRP (p=0.032), LIHC (p=0.004), and MESO (p=0.024) (Figure 2C and Figure S2C). Notably, BEND3 expression in ACC, BRCA, KIRP, LIHC, and MESO was significantly correlated (p<0.05) with all three prognostic measures: OS, DSS, and PFI (Figure 2D). Our findings show: elevated BEND3 expression correlates with unfavorable outcomes across various cancer types.
 |
Figure 2 BEND3 expression and its relationship with the prognosis of cancer patients. The correlation between BEND3 expression and OS (A), DSS (B), and PFS (C). A Venn diagram of the analysis results of OS, DSS, and PFS in different types of cancer (D). significant (p<0.05). |
Evaluation of the Auxiliary Diagnostic Potential of BEND3 Across Pan-Cancer
To systematically evaluate the adjunct diagnostic value of the BEND3 gene across various cancer types, we performed ROC analysis using a cross-cancer cohort that included TCGA tumor samples and GTEx normal tissues. The study found that BEND3 exhibited high adjunct diagnostic value (AUC>0.9) across seven cancer types: cholangiocarcinoma (CHOL, AUC=0.997), colon adenocarcinoma (COAD, AUC=0.928), esophageal carcinoma (ESCA, AUC=0.983), ovarian serous cystadenocarcinoma (OV, AUC=0.987), rectal adenocarcinoma (READ, AUC=0.911), testicular germ cell tumors (TGCT, AUC=0.941), and uterine carcinosarcoma (UCS, AUC=0.931) (Figure 3A–G). BEND3 demonstrated moderate adjunct diagnostic efficacy (AUC>0.7) across 16 additional cancers, including lung squamous cell carcinoma (LUSC, AUC=0.891), brain lower grade glioma (LGG, AUC=0.871), stomach adenocarcinoma (STAD, AUC=0.870), glioblastoma multiforme (GBM, AUC=0.865), sarcoma (SARC, AUC=0.863), cervical squamous cell carcinoma and endocervical adenocarcinoma (CESC, AUC=0.860), uterine corpus endometrial carcinoma (UCEC, AUC=0.860), skin cutaneous melanoma (SKCM, AUC=0.859), lung adenocarcinoma (LUAD, AUC=0.827), breast invasive carcinoma (BRCA, AUC=0.820), thymoma (THYM, AUC=0.820), diffuse large B-cell lymphoma (DLBC, AUC=0.818), pancreatic adenocarcinoma (PAAD, AUC=0.810), bladder urothelial carcinoma (BLCA, AUC=0.800), prostate adenocarcinoma (PRAD, AUC=0.753), and liver hepatocellular carcinoma (LIHC, AUC=0.745) (Figure 3H–W). In conclusion, BEND3 has moderate to strong cancer adjunct diagnostic value in most types of cancer.
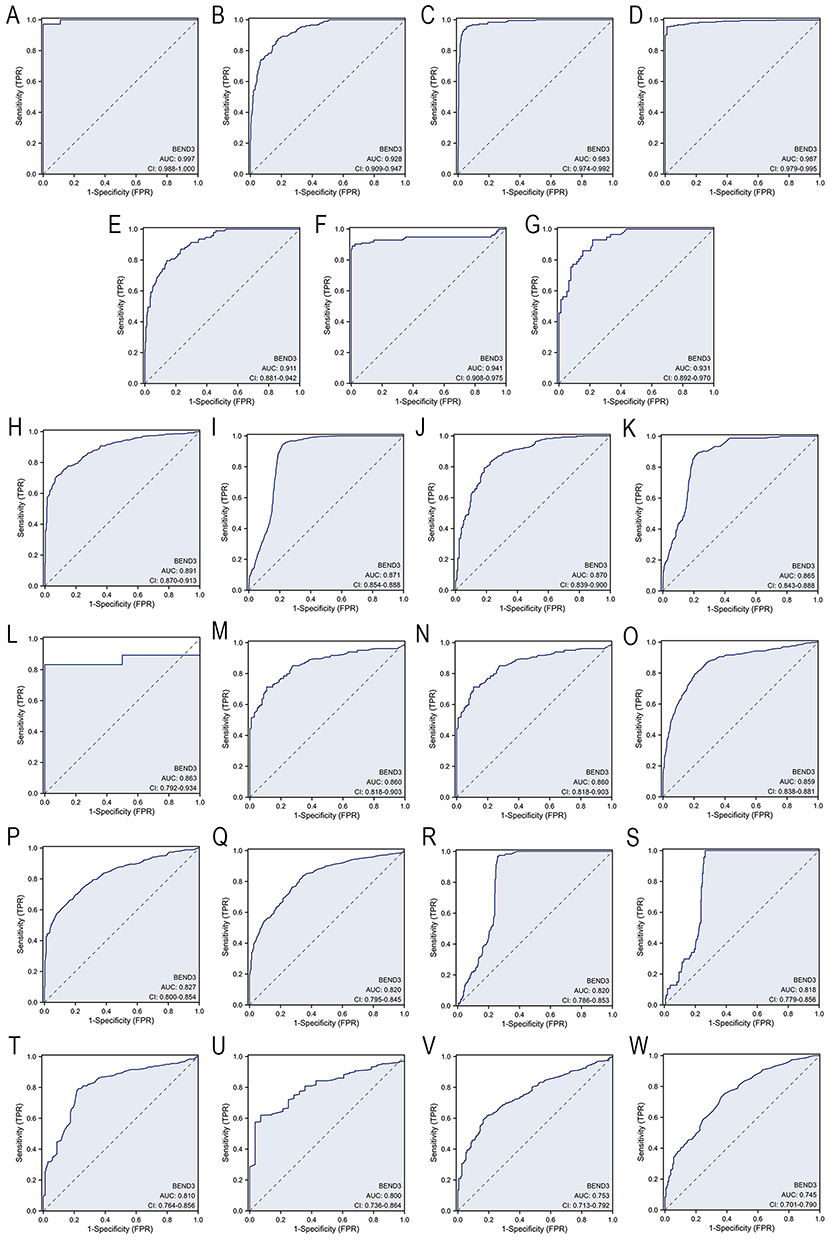 |
Figure 3 Analysis of the ROC for BEND3 expression in pan-cancer. Cancer types with high diagnostic value (AUC>0.9): (A) CHOL, (B) COAD, (C) ESCA, (D) OV, (E) READ, (F) TGCT, and (G) UCS. Cancer types with certain diagnostic value (AUC>0.7): (H) LUSC, (I) LGG, (J) STAD, (K) GBM, (L) SARC, (M) CESC, (N) UCEC, (O) SKCM, (P) LUAD, (Q) BRCA, (R) THYM, (S) DLBC, (T) PAAD, (U) BLCA, (V) PRAD, and (W) LIHC. |
BEND3 Independently Influences the Prognosis of Certain Cancers
Our study involved univariate and multivariate Cox regression analyses covering 10 types of cancer to determine the impact of various factors on the overall survival of individuals with cancer (Supplementary Material Table S2). These cancers include: ACC, BRCA, KIRP, READ, LAML, LIHC, MESO, SARC, SKCM, and STAD. In ACC, the primary treatment outcome, encompassing partial response (PR) and complete response (CR), was the sole independent prognostic factor (hazard ratio HR=15.825, p=0.001). In BRCA, independent prognostic factors were identified as pathologic N stage (N3, HR=3.932, p=0.010), pathologic M stage (M1, HR=2.752, p=0.023), menstrual status (menopause, HR=2.317, p=0.002), and elevated BEND3 expression (HR=1.591, p=0.030). In KIRP, the independent prognostic factors identified were primary treatment outcomes (PD/SD, HR=3.123, p=0.037), pathologic stage (stages 3 and 4, HR=8.277, p<0.001), and elevated BEND3 expression (HR=2.966, p=0.026). In READ, independent prognostic factors included pathologic N stage (N2, HR=4.348, p=0.010), pathologic M stage (M1, HR=2.703, p=0.049), age over 65 (HR=6.530, p=0.001), and high BEND3 expression (HR=0.366, p=0.038). In LAML, independent prognostic factors were identified as age over 65 (HR=2.978, p<0.001), primary treatment outcome (PR&CR, HR=0.376, p<0.001), cytogenetic risk (moderate/normal and poor, HR=2.078, p=0.039), and elevated BEND3 expression (HR=0.582, p=0.018). For LIHC, independent prognostic factors included pathologic T stage (T3&T4, HR=1.874, p=0.026), tumor status (residual tumor, HR=1.830, p=0.012), and BEND3 expression (high BEND3, HR=1.599, p=0.044). In MESO, histological type (epithelial, HR=0.545, p=0.025) and BEND3 expression (high BEND3, HR=2.169, p<0.003) were factors that independently predicted outcomes. For SARC, margin status (positive status, HR=2.102, p=0.008) and BEND3 expression (high BEND3, HR=1.875, p=0.029) were independent prognostic factors. In SKCM, both pathologic T stage (T4, HR=3.069, p=0.010) and pathologic N stage (N1, HR=1.620, p=0.032; N2, HR=2.117, p=0.008; N3, HR=4. 181, p<0.001) independently predicted prognosis. In STAD, independent prognostic factors included pathologic N stage (N3, HR=2.303, p=0.002), pathologic M stage (M1, HR=2.031, p=0.016), and elevated BEND3 expression (HR=1.469, p=0.032). Subsequently, we developed a prognostic nomogram as a predictive tool and thoroughly evaluated its accuracy. The nomogram for ACC (C-index=0.891, Figure 4A), BRCA (C-index=0.717, Figure 4B), KIRP (C-index=0.826, Figure 4C), READ (C-index=0.797, Figure 4D), LAML (C-index=0.723, Figure S3A), LIHC (C-index=0.655, Figure S3B), MESO (C-index=0.640, Figure S3C) and SARC (C-index=0.688, Figure S3D), SKCM (C-index=0.715, Figure S3E), and STAD (C-index=0.622, Figure S3F). The prediction probabilities of all models showed a good fit with actual observed values, and their trajectories were highly consistent with the ideal reference line (Figure 4E–H and Figure S3G–L).
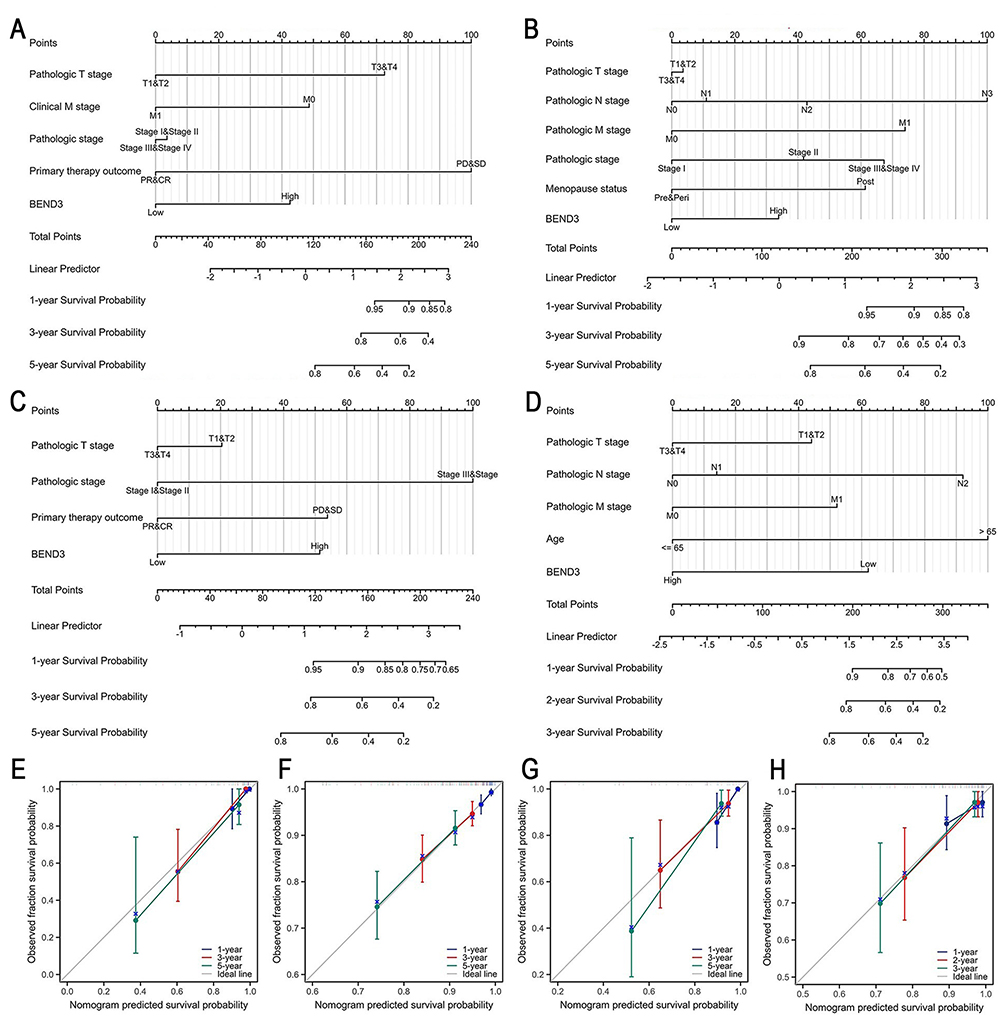 |
Figure 4 Prediction nomograms and calibration curves for OS of patients with four types of cancer. Nomograms for ACC (A), BRCA (B), KIRP (C), and READ (D). Calibration curves for ACC (E), BRCA (F), KIRP (G), and READ (H). |
Analysis of Genetic Variation in BEND3
We conducted a comprehensive analysis of BEND3 genetic variants across multiple cancers to assess its potential as a molecular therapy target. Our study found that out of 10,443 samples, 323 (3%) had mutations in the BEND3 gene (Figure 5A). The highest occurrence of BEND3 mutations was in DLBC at 9.76%, with PRAD at 8.5%, UVM at 7.5%, STAD at 6.65%, and BLCA at 6.1% following behind (Figure 5B). Additionally, D265T was identified as a key mutation site within the BEND3 domain in 8 STAD patients, 7 UCEC patients, 1 LIHC patient, and 1 READ patient (Figure 5C). Analysis of the COSMIC database revealed that missense mutations were the most common genetic alteration, accounting for 42.09% of all mutation types, followed by synonymous substitutions at 22.97% (Figure S4A). Among SNVs, the most prevalent were C>T transitions at 42.64% and G>A transitions at 28.79% (Figure S4B). Additionally, the presence of CNV mutations in BEND3 has been observed across a majority of cancer types (Figure S4C). To further investigate the association between BEND3 gene CNVs and mRNA expression levels with cancer patient prognosis, we used the GSCA platform for correlation analysis. The study found a significant positive correlation between BEND3 CNV alterations and mRNA expression across 23 cancer types (Figure S4D), such as BRCA, OV, STAD, LUSC, PAAD, PCPG, CESC, LIHC, THYM, GBM, BLCA, MESO, LUAD, KIRP, COAD, KIRC, LGG, PRAD, READ, ESCA, SKCM, HNSC, and SARC. Moreover, CNV alterations in BEND3 were detrimental to the prognosis of patients with KIRP, LGG, and THCA (Figure S4F).
 |
Figure 5 The mutation characteristics of BEND3 in various tumors. (A) An overview of the changes in BEND3 expression across different tumors. (B) Frequency distribution of different mutation types in various tumors. (C) Specific mutation positions marked on the BEND3 amino acid sequence. * only 10,443 samples are profiled, # number of queried samples for each patient=1. |
Correlation of BEND3 Expression with Methylation
Increasing evidence suggests that abnormal methylation plays a crucial role in cancer development. We investigated the connection between BEND3 expression and 24 core m6A methylation regulators across diverse cancer types to further understand their relationship. The study identifies 10 writer proteins, 3 eraser proteins and 11 reader proteins. Heat map analysis revealed a positive correlation between BEND3 expression and m6A regulator expression levels across various cancer types (Figure 6A). Next, we analyzed and compared BEND3 promoter methylation levels in healthy and tumor tissues across multiple cancers using the UALCAN platform. The outcomes revealed that methylation levels in the BEND3 promoter region exhibited a hypomethylation state (β<0.25) in most cancers. The BEND3 promoter exhibited significantly lower methylation levels in tumor tissues compared to BLCA (p=1.05E-06), UCEC (p=2.18E-04), HNSC (p=5.96E-03), PRAD (p=9.75E-11), and KIRP (p=9.84E-04). In LUSC (p=5.98E-14), SARC (p=9.25E-04), and COAD (p=1.88E-03), the BEND3 promoter exhibited significantly higher methylation levels in tumor tissues compared to normal tissues (Figure 6B). In most cancers, there is a significant negative correlation between BEND3 promoter methylation and mRNA expression (Figure S4E).
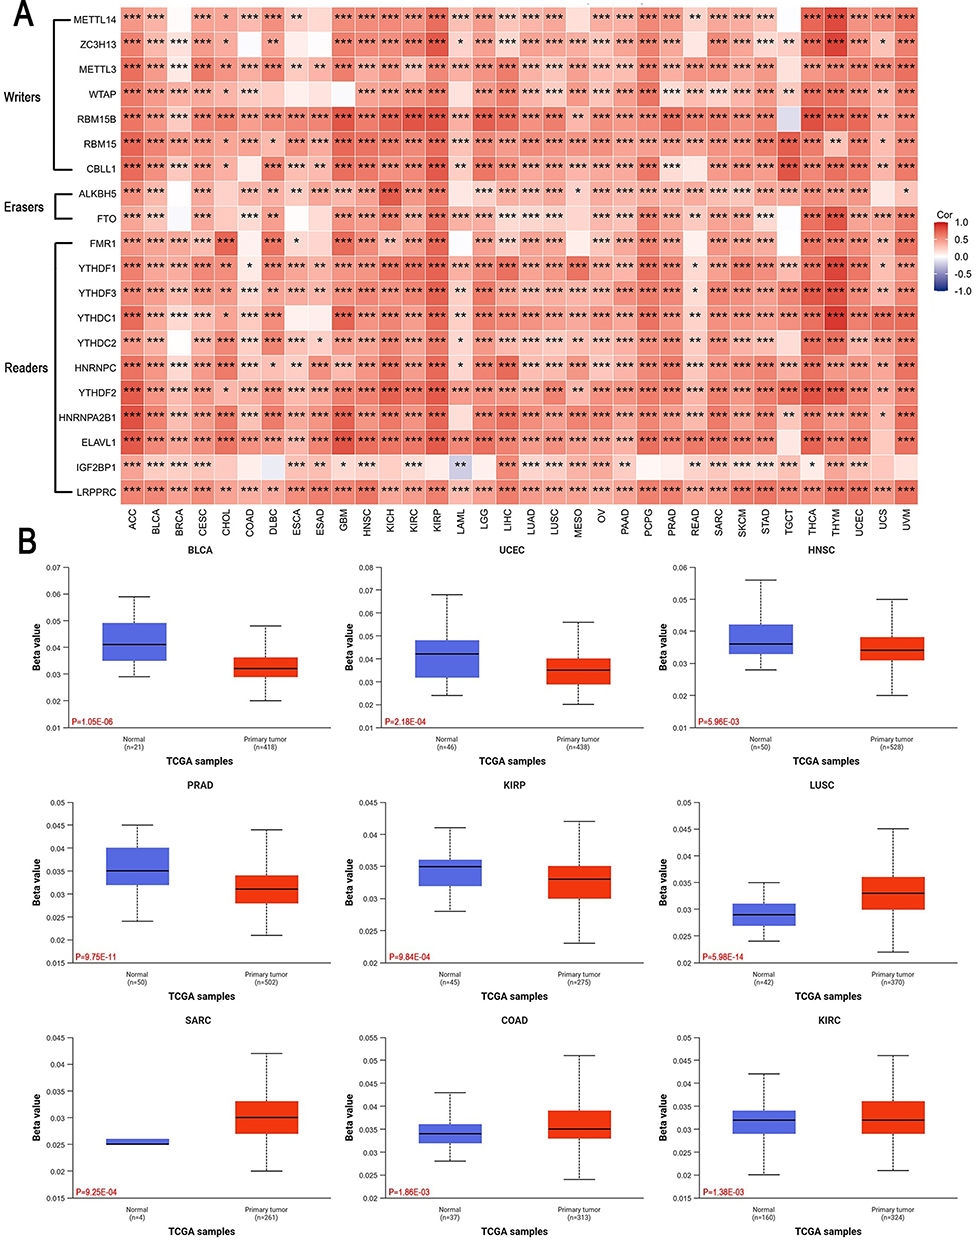 |
Figure 6 Epigenetic methylation analysis of BEND3. (A) The association between BEND3 mRNA expression and m6A modification-related regulatory factors in various cancers. (B) Analysis of the difference in methylation levels of the BEND3 promoter region between tumor and normal tissues (β values). Red text shows exact P values. * p<0.05, ** p<0.01, *** p<0.001. |
BEND3 Expression Links to Genomic Heterogeneity and Immune
Growing evidence indicates that TMB, MSI, and NEO could act as predictive markers for the response to immunotherapy. By assessing their Spearman correlations, we explored the link between BEND3 expression and specific biomarkers in various tumor types. The analysis revealed significant correlations between TMB and BEND3 expression in 13 tumors. Specifically, positive correlations were observed in 11 tumors: ACC, BRCA, STAD, THYM, GBM, ESCA, COAD, PRAD, LUAD, SARC, and BLCA.In contrast, KIRP and THCA exhibited a notable negative correlation (Figure 7A). For MSI, significant correlations with BEND3 expression were identified in 10 tumors. Positive correlations were noted in seven tumors: STAD, CESC, ESCA, LUSC, SARC, COAD, and LUAD. However, a significant negative correlation was observed in three other tumors: HNSC, THCA, and DLBC (Figure 7B). Regarding NEO, significant correlations with BEND3 expression were found in seven tumors. Positive correlations were seen in five tumors: ACC, SARC, COAD, BRCA, and LUSC. In contrast, significant negative correlations were observed in KICH and PCPG (Figure 7C). Notably, TMB, MSI, and NEO showed significant positive correlations with BEND3 expression in both COAD and SARC.
 |
Figure 7 BEND3 expression and its associations with TMB, MSI, NEO, tumor microenvironment, and immune checkpoint genes across 33 cancer types. The correlation between BEND3 expression and TMB (A), MSI (B), and NEO (C). (D) The association of BEND3 expression with StromalScore, ImmuneScore, and ESTIMATEScore. (E) The interrelationship of BEND3 expression with immune checkpoint genes. Red text indicates positive correlations; green text indicates negative correlations. * p<0.05, ** p<0.01, *** p<0.001. |
We utilized the ESTIMATE algorithm to assess the correlation between BEND3 expression and stromal and immune scores in multiple cancer types. The study found a negative correlation between BEND3 expression levels and stromal, immune, and ESTIMATE scores across 16 tumor types, encompassing: ACC, BLCA, BRCA, CESC, ESCA, GBM, LAML, LUAD, LUSC, OV, PRAD, SARC, SKCM, STAD, THCA, and UCEC (Figure 7D).
We examined the relationship between BEND3 expression levels and immune checkpoint markers encompassing: CD274, HAVCR2, LAG3, PDCD1, PDCD1LG2, CTLA4, SIGLEC15, and TIGIT. Heatmap analysis revealed a significant inverse correlation between BEND3 expression levels and the majority of immune checkpoints in CESC, LUSC, SARC, and SKCM. In contrast, significant positive correlations were observed in BRCA, LIHC, and TGCT (Figure 7E). We further explored the association between BEND3 expression and a set of curated immune-related genes from the GSEA database, consisting of 43 immune activation markers and 22 immunosuppressive factors. BEND3 expression demonstrated strong correlations with these immune genes. Notably, the expression levels of CD276, PVR, CD160, and TGFBR1 were significantly positively correlated with BEND3 across multiple cancer types (Figure S5B and C).
Analysis of Immune Cell Infiltration
Recent studies suggest that immune infiltration is crucial in cancer development, progression, and metastasis. Our findings found a positive correlation between the levels of BEND3 expression and the presence of tumor-promoting Th2 cells while showing a negative correlation with tumor-suppressing plasmacytoid dendritic cells (pDCs) across various cancers (Figure 8A). Using the TIMER2.0 database, the investigation focused on the correlation between BEND3 expression and immune cell infiltration in diverse cancers (Figure S5A).
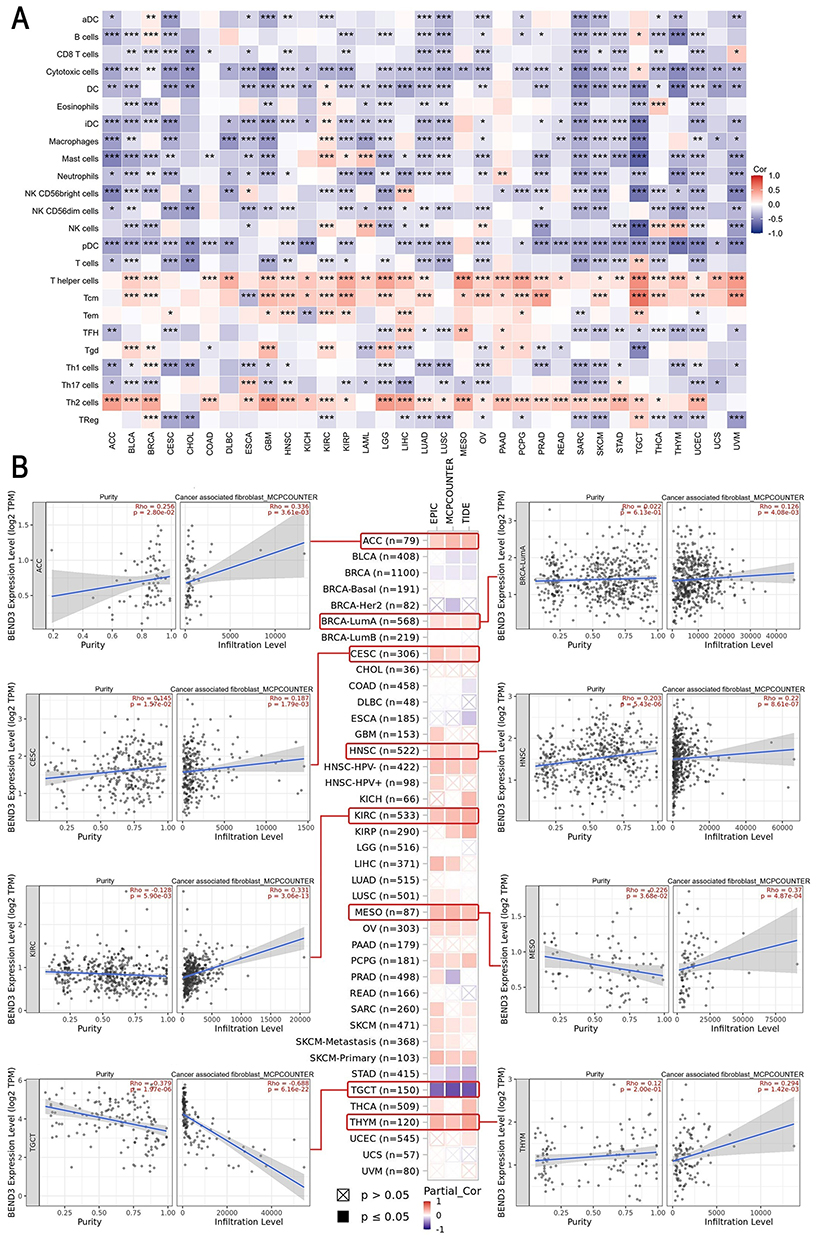 |
Figure 8 The relationship between immune cell infiltration and BEND3 expression in pan-cancer. (A) Analysis of the correlation between BEND3 expression and immune infiltration. (B) Assessment of the association between BEND3 expression and CAF infiltration, with the scatter plot including ACC, BRCA, CESC, HNSC, KIRC, MESO, TGCT, and THYM. Values in red denote Spearman’s rho coefficients; corresponding exact p-values are shown below each coefficient. * p<0.05, ** p<0.01, *** p<0.001. |
BEND3 expression demonstrated significant positive correlations with cancer-associated fibroblasts (CAFs) in the majority of cancer types, including ACC (r=0.336, p=3.61E-03), BRCA-lumA (r=0.126, p=4.08E-03), CESC (r=0.187, p=1.79E-03), HNSC (r=0.22, p=8.61E-07), KIRC (r=0.331, p=3.06E-13), MESO (r=0.37, p=4.87E-04), and THYM (r=0.294, p=1.42E-03). In contrast, a significant negative correlation was observed in TGCT (r=−0. 688, p=6.16E-22) (Figure 8B).
The expression of BEND3 demonstrated a significant positive correlation with the infiltration of CD4+ T cells and myeloid-derived suppressor cells (MDSCs) across a majority of cancer types, whereas it showed a negative correlation with natural killer (NK) cell levels (Figure S5A).
We investigated the association of BEND3 expression with immune-related genes utilizing the GSEA database, encompassing 43 genes linked to immunoactivation and 21 associated with immunosuppression. In various cancers, there is a strong positive correlation between the expression of CD276, PVR, TGFBR1, and BEND3 (Figure S5A).
The results indicate a strong correlation between BEND3 expression and specific immune cell infiltration patterns across various cancers.
BEND3-Related Networks and Pathways
Using the String online tool, we identified 48 proteins that bind to BEND3 (Supplementary Material Table S4), allowing us to examine the networks and pathways that might be related to BEND3. (Figure 9A). Enrichment analysis (Supplementary Material Table S3) revealed that in GO-BP, BEND3 is involved in biological processes such as histone modification, chromatin remodeling, protein deacetylation and methylation, and peptidyl-lysine modification—processes closely related to gene expression regulation (Figure 9B). In GO-CC analysis, BEND3 was found to associate with transcriptional regulatory complexes, nuclear chromosomes, heterochromatin, histone deacetylase complexes, and methyltransferase complexes, indicating its role in various functional structures within the nucleus (Figure 9C). GO-MF analysis indicates that BEND3 is involved in DNA-binding transcription factor interaction, ATP hydrolysis, histone deacetylase association, ubiquitin-like protein ligase interaction, and NF-κB binding, underscoring its essential function in gene regulation and signaling (Figure 9D). KEGG pathway analysis (Supplementary Material Table S3) demonstrated that BEND3 participates in key biological pathways including viral carcinogenesis, Notch signaling, eukaryotic ribosome biogenesis, neutrophil extracellular trap formation, and Th1/Th2 cell differentiation, all of which are integral to tumorigenesis, immune response, and cell differentiation (Figure 9E).
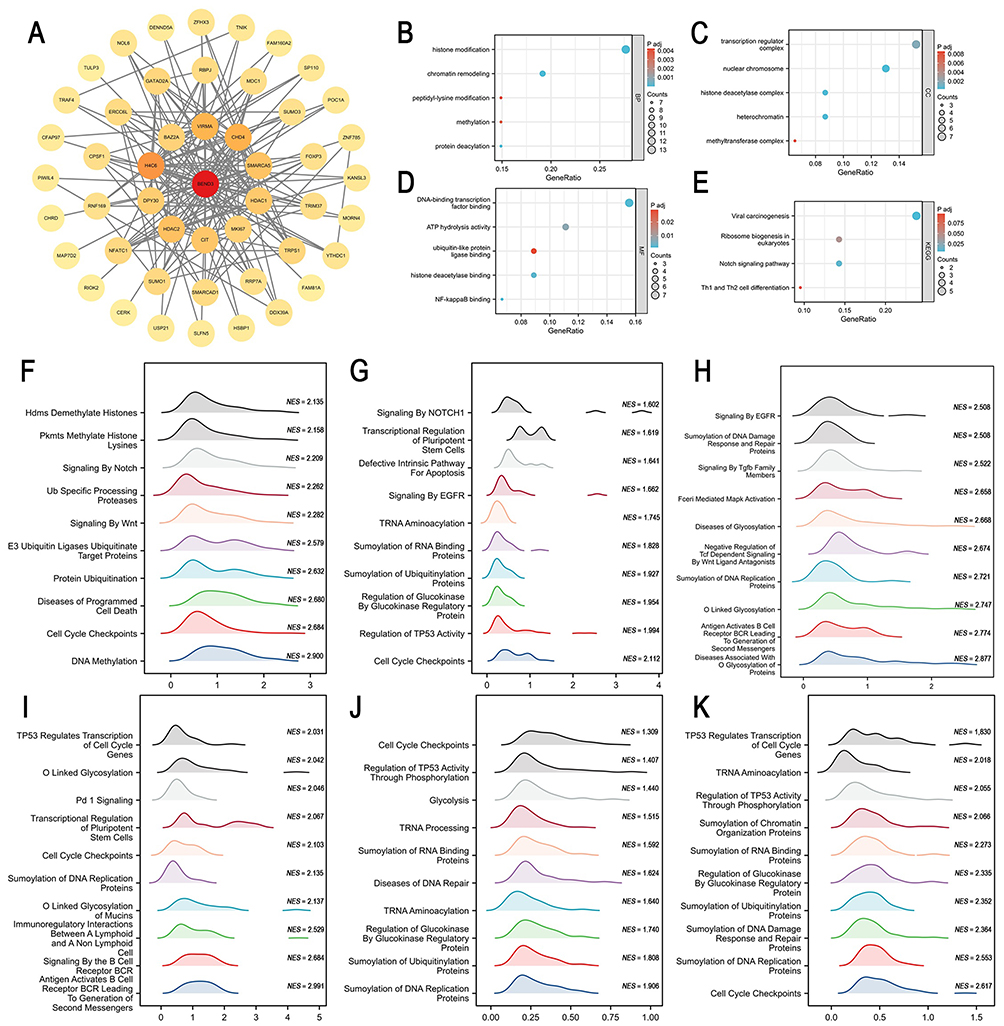 |
Figure 9 Analysis of the genes related to BEND3, interaction proteins, and functional enrichment. (A) Protein-protein interaction (PPI) network of BEND3. (B) GO biological process analysis. (C) GO cellular component analysis. (D) GO molecular function analysis. (E) KEGG pathway analysis. Functional enrichment analysis of BEND3 in six types of cancer. In ACC (F), BRCA (G), KIRP (H), LIHC (I), READ (J), and STAD (K), the top ten pathways are positively correlated with BEND3 expression. |
Using the Reactome pathway database, we performed gene set enrichment analysis (GSEA) to explore potential pathways involving BEND3 in six cancer types (ACC, BRCA, KIRP, LIHC, READ, and STAD). Differential gene enrichment analysis revealed that cell cycle checkpoints and SUMOylation were significantly enriched in all cancers within the high BEND3 expression group. This suggests that BEND3 may influence cancer progression through its impact on these processes (Figure 9F–K). In the low BEND3 expression group, biological oxidation, fatty acid metabolism, amino acid and their derivatives metabolic pathways, and PD-1 signaling were significantly enriched across various cancers. These findings indicate that these processes might be related to BEND3 downregulation, thereby affecting the tumor microenvironment (Figure S6A–F).
In summary, BEND3 plays a complex and essential role in gene expression regulation, cellular function maintenance, and disease progression by participating in various biological processes, cellular components, and molecular functions, as well as multiple significant pathways.
BEND3 Expression in Breast Cancer Tissues and Its Modulatory Effects on Cancer Cell Behavior
This investigation commenced by examining the expression levels of BEND3 in breast cancer tissues and their corresponding normal tissues, with the aim of elucidating its biological role in breast cancer cells. Examination through qRT-PCR, Western blot, and immunohistochemistry demonstrated significantly elevated BEND3 expression in breast cancer tissues relative to adjacent normal tissues (Figure 10A–D). BEND3 knockdown (BEND3-KD) and overexpression (BEND3-OE) models were developed in MCF-7 and MDA-MB-231 breast cancer cell lines. The efficiency of gene knockdown and overexpression was confirmed using qRT-PCR and Western blot analysis (Figure 10E–H). Cell proliferation was assessed using CCK-8 assays, which demonstrated that BEND3 knockdown significantly inhibited the proliferation of breast cancer cells, whereas BEND3 overexpression enhanced cell proliferation (Figure 10I and J). Colony formation assays further confirmed these findings, indicating that overexpressing BEND3 enhanced cell proliferation, whereas knocking down BEND3 inhibited it (Figure 10K–M). Scratch wound healing assays demonstrated that BEND3 overexpression increased the migratory ability of MCF-7 and MDA-MB-231 cells, while BEND3 knockdown decreased their migration (Figure S7A–D). Moreover, Transwell assays indicated that BEND3 overexpression significantly promoted both migration and invasion, while BEND3 knockdown exerted inhibitory effects (Figure S7E–J).
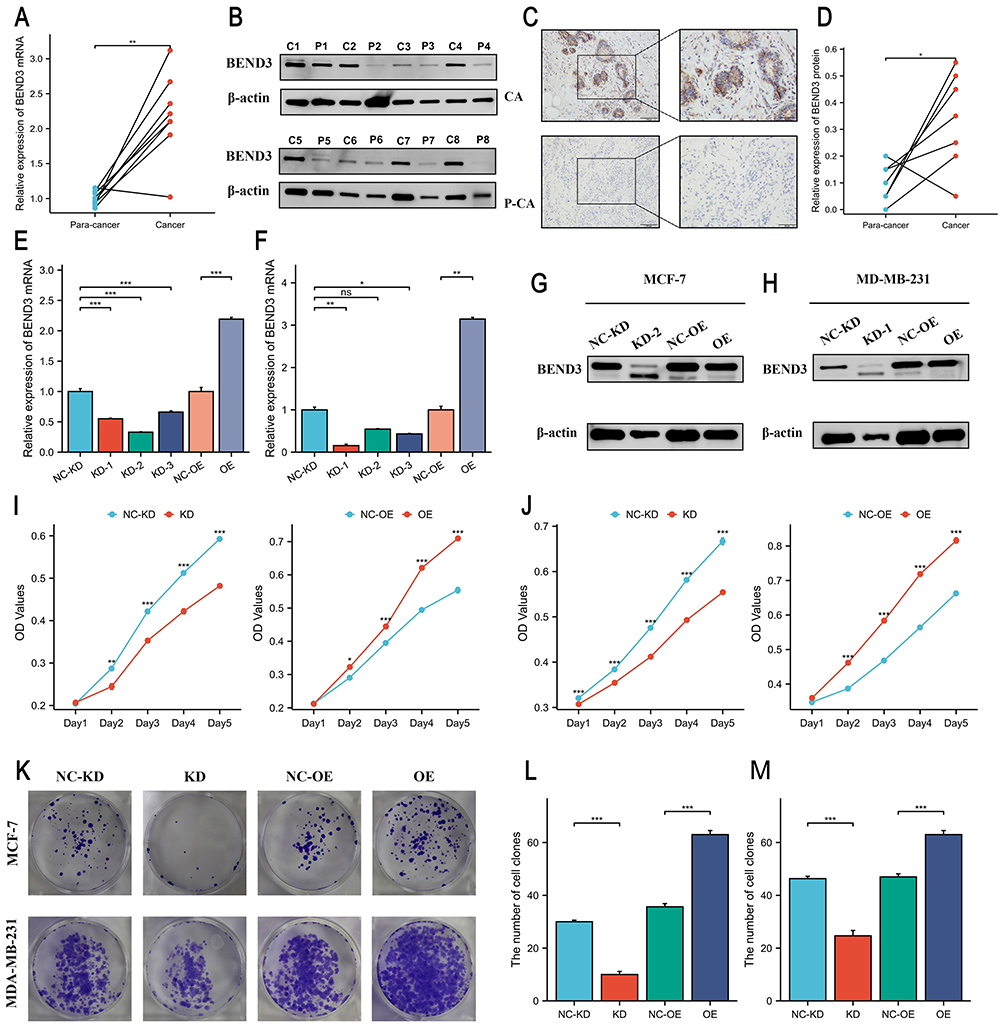 |
Figure 10 BEND3 is highly expressed in BRCA tissues and promotes the proliferation of breast cancer cells. (A and B) Expression of BEND3 mRNA and BEND3 protein in paired breast cancer tissues (p<0.01). (C and D) Results of immunohistochemical staining of BEND3 in breast cancer tissues compared to adjacent non-cancerous tissues (localized in the cytoplasm) (p<0.05). qRT-PCR was used to validate the knockdown and overexpression efficiency of BEND3 in both (E) MCF-7 (p<0.001) and (F) MDA-MB-231 (p<0.05) cell lines. Western blot confirms changes in BEND3 protein levels in (G) MCF-7 and (H) MDA-MB-231 cell lines. Determination of cell density in (I) MCF-7 cell line (p<0.001) and (J) MDA-MB-231 cell line (p<0.001) for KD group and NC-KD group in CCK-8 assays. (K) Colony formation assays and their quantitative analysis in (L) MCF-7 and (M) MDA-MB-231 cell lines further validate the impact of BEND3 on cell proliferation (p<0.001). * p<0.05, ** p<0.01, *** p<0.001, ns represents no statistical significance. |
Discussion
Previous studies on BEND3 have been confined to single cancer types.26 None have examined its genetic or epigenetic regulation, its links to the tumor immune microenvironment, or its relationship with immunotherapy biomarkers such as TMB, MSI, and NEO. Moreover, despite its inclusion in BRCA gene signatures,13 BEND3 has not been functionally validated in breast cancer cell lines. Our pan-cancer analysis across 33 tumor types, combined with experimental validation in breast cancer models, addresses these gaps. This approach follows the framework established by earlier pan-cancer studies that successfully linked genomic signatures to clinical implications across cancer types.27–29
BEND3, a transcription factor, has been recently recognized for its crucial function in regulating gene expression in mammals.10,30 Given the central role of transcriptional dysregulation in cancer,31 BEND3 represents a plausible candidate involved in tumorigenesis. Our study analysis revealed BEND3 expression levels in most tumors compared with nearby normal tissues. The evaluation of OS, DSS, and PFS indicated that high BEND3 expression is frequently associated with poor prognosis across several cancer types. Importantly, this association remains significant after adjusting for key clinical variables, indicating that BEND3 may serve as an independent prognostic factor. Previous studies have shown that BEND3 protein is expressed at higher levels in tumor tissues of patients with LIHC compared to adjacent non-tumor tissues.26 ROC analysis indicates that high BEND3 expression demonstrates moderate to strong supplementary diagnostic potential across most cancer types. These findings suggest that high BEND3 expression might have potential as a supplementary diagnostic marker, particularly in cancers with ambiguous morphology, and could also be explored as a prognostic indicator or a candidate therapeutic target. However, further validation in prospective clinical cohorts is needed to confirm its utility.
Epigenetic alterations significantly contribute to the process of carcinogenesis.32 Saksouk et al identified BEND3 as a regulatory protein involved in methylation processes.7 Our analysis indicated that somatic mutations in BEND3 are infrequent across cancer cohorts, making them unlikely primary drivers of tumorigenesis. Instead, we found that promoter hypomethylation of BEND3 is associated with increased BEND3 expression, pointing to epigenetic regulation as a more relevant mechanism in cancer progression. Furthermore, m6A RNA methylation has emerged as a critical regulator of cancer cell proliferation and invasion while also influencing the sensitivity and resistance to anticancer treatments.33,34 Our investigation identified a significant positive correlation between BEND3 expression and the expression of genes associated with m6A methylation across a range of malignant tumors. Future studies dissecting the interplay between BEND3, promoter methylation, and RNA epitranscriptomics could uncover novel layers of gene regulation in cancer.
In cancer biology, immunomodulation plays a critical role by influencing disease progression and Tumor drug resistance through various mechanisms.35 With the arrival of immune checkpoint inhibitors (ICIs), cancer immunotherapy has been revolutionized, granting patients extraordinary clinical benefits.36 Emerging evidence highlights that TMB and MSI can predict anti-tumor efficacy in ICIs.37,38 NEO are tumor-specific antigens derived from non-synonymous mutations and represent a highly promising target for tumor immunotherapy.39 Our analysis reveals that BEND3 expression is linked to immune-related genomic features such as TMB, MSI, and NEO in COAD and SARC, which may imply enhanced immunogenicity. This suggests that elevated BEND3 expression in these cancers may enhance responsiveness to immunotherapy. We also observe significant associations between BEND3 and specific immune cell populations. Elevated BEND3 expression is positively correlated with the infiltration levels of CAFs and MDSCs, which are known to be involved in immunosuppressive processes and reduced treatment response.40,41 BEND3 expression also shows a negative relationship with plasmacytoid dendritic cells, which are essential for initiating anti tumor T cell responses,42 and a positive association with Th2 cells, known to support tumor progression.43 Based on these findings, we speculate that elevated BEND3 expression might be linked to alterations in immune cell infiltration, which could potentially contribute to cancer development and progression. While these observations do not establish causality, BEND3 could be explored in future studies as a potential modulator of immune evasion and a candidate target for combination therapeutic approaches.
Uncontrolled cell proliferation is a defining feature of cancer,44 and BEND3 has been shown to promote cell cycle progression by repressing p21, a key cyclin-dependent kinase inhibitor.10 This is consistent with our GSEA results, which show that high BEND3 expression is associated with enrichment of cell cycle checkpoint pathways across most cancers. It remains unclear whether BEND3 dysregulation arises early in tumorigenesis or later during progression and metastasis, a distinction essential for defining its clinical relevance. In the absence of data from pre-neoplastic or stage-stratified cohorts, future studies using longitudinal or single-cell analyses across tumor evolution will be needed to clarify its temporal role and underlying mechanisms. Our functional experiments in breast cancer cell lines confirm that BEND3 enhances cellular proliferation, migration, and invasion, consistent with its proposed oncogenic role. Previous studies have shown that BEND3 promotes proliferation, migration, and invasion in LIHC by activating the PI3K/AKT/mTOR signaling pathway and inducing epithelial–mesenchymal transition.26 However, the mechanistic insights into BEND3’s oncogenic function are currently limited to liver cancer; whether similar pathways operate in other malignancies, including breast cancer, remains to be determined.
Although the data used have undergone batch effect correction, bulk RNA-seq findings remain subject to inherent technical and biological biases.45 We validated BEND3’s functional role in breast cancer cells, but not in other cancer types. Nonetheless, this study provides a foundation for future pan-cancer mechanistic and translational research.
Conclusion
In this study, BEND3 was found to be frequently overexpressed across multiple cancers and showed auxiliary diagnostic potential as well as association with poorer prognosis in most tumor types. Its expression levels correlated with promoter hypomethylation, co-expression of m6A regulators, and enrichment of gene sets related to cell cycle. Higher BEND3 levels were also associated with features of an immunosuppressive microenvironment, including altered immune cell infiltration and immune checkpoint expression. In functional assays, BEND3 expression correlated with increased proliferation, migration, and invasion in breast cancer cells. Nonetheless, it is important to acknowledge that the current functional validation is predominantly centered on breast cancer cells, necessitating further research to elucidate its mechanisms of action in other cancer types.
Abbreviations
BLCA, Bladder Urothelial Carcinoma; BRCA, Breast Cancer; CESC, Cervical squamous cell carcinoma and endocervical adenocarcinoma; CHOL, Cholangiocarcinoma; CNV, Copy Number Variants; COAD, Colon adenocarcinoma; DLBC, Lymphoid Neoplasm Diffuse Large B-cell Lymphoma; DSS, Disease-specific Survival; ESCA, Esophageal carcinoma; GBM, Glioblastoma multiforme; HNSC, Head and neck squamous cell carcinoma; IHC, Immunohistochemistry; KICH, Kidney chromophobe cell carcinoma; KIRC, Kidney renal clear cell carcinoma; KIRP, Kidney renal papillary cell carcinoma; LAML, Acute Myeloid Leukemia; LGG, Brain Lower Grade Glioma; LIHC, Liver hepatocellular carcinoma; LUAD, Lung adenocarcinoma; LUSC, Lung squamous cell carcinoma; MSI, Microsatellite Instability; NEO, Neoantigen; OS, Overall Survival; OV, Ovarian serous cystadenocarcinoma; PAAD, Pancreatic adenocarcinoma; PFS, Progression-free Survival; PPI, Protein-protein Interaction; PRAD, Prostate adenocarcinoma; READ, Rectum adenocarcinoma; SKCM, Skin Cutaneous Melanoma; STAD, Stomach adenocarcinoma; TGCT, Testicular Germ Cell Tumors; THYM, Thymoma; TMB, Tumor Mutational Burden; TME, Tumor Microenvironment; UCEC, Uterine corpus endometrial carcinoma; UCS, Uterine Carcinosarcoma; WB, Western blotting.
Data Sharing Statement
The original contributions are part of the article/supplementary material. For more details, please get in touch with the corresponding author, Chenming Guo.
Ethics Statement
The research involving human participants was approved by the Ethics Committee of The First Affiliated Hospital of Xinjiang Medical University (Approval No. 230714-07), and all procedures were carried out in accordance with local regulations and institutional guidelines, and the principles of the Declaration of Helsinki. Written informed consent was obtained from all participants prior to their involvement in the study.
Author Contributions
All authors made a significant contribution to the work reported, whether that is in the conception, study design, execution, acquisition of data, analysis and interpretation, or in all these areas; took part in drafting, revising or critically reviewing the article; gave final approval of the version to be published; have agreed on the journal to which the article has been submitted; and agree to be accountable for all aspects of the work.
Funding
National Natural Science Foundation of China (82560576; 32260186), The State Key Laboratory of Pathogenesis, Prevention, Treatment of Central Asian High Incidence Diseases Fund (SKL-HIDCA-2024-21), Outstanding Youth Science Fund (2024D01E22), Xinjiang Uygur Autonomous Region Youth Science and Technology Top-notch Talent Program (2022TSYCCX0029), National Health Commission of the People’s Republic of China (WKZX2023WK0109).
Disclosure
Yuting Gou, Yongxiang Li, and Yiyang Wang share the first authorship. The authors report no conflicts of interest in this work.
References
1. Bray F, Laversanne M, Sung H, et al. Global cancer statistics 2022: GLOBOCAN estimates of incidence and mortality worldwide for 36 cancers in 185 countries. CA Cancer J Clin. 2024;74(3):229–263. doi:10.3322/caac.21834
2. Wahida A, Buschhorn L, Frohling S, et al. The coming decade in precision oncology: six riddles. Nat Rev Cancer. 2023;23(1):43–54. doi:10.1038/s41568-022-00529-3
3. Sonkin D, Thomas A, Teicher BA. Cancer treatments: past, present, and future. Cancer Genet. 2024;286-287:18–24. doi:10.1016/j.cancergen.2024.06.002
4. Pitchai GP, Kaulich M, Bizard AH, et al. A novel TPR-BEN domain interaction mediates PICH-BEND3 association. Nucleic Acids Res. 2017;45(19):11413–11424. doi:10.1093/nar/gkx792
5. Zheng L, Liu J, Niu L, et al. Distinct structural bases for sequence-specific DNA binding by mammalian BEN domain proteins. Genes Dev. 2022;36(3–4):225–240. doi:10.1101/gad.348993.121
6. Khan A, Prasanth SG. BEND3 mediates transcriptional repression and heterochromatin organization. Transcription. 2015;6(5):102–105. doi:10.1080/21541264.2015.1100228
7. Saksouk N, Barth TK, Ziegler-Birling C, et al. Redundant mechanisms to form silent chromatin at pericentromeric regions rely on BEND3 and DNA methylation. Mol Cell. 2014;56(4):580–594. doi:10.1016/j.molcel.2014.10.001
8. Khan A, Giri S, Wang Y, et al. BEND3 represses rDNA transcription by stabilizing a NoRC component via USP21 deubiquitinase. Proc Natl Acad Sci U S A. 2015;112(27):8338–8343. doi:10.1073/pnas.1424705112
9. Sathyan KM, Shen Z, Tripathi V, et al. A BEN-domain-containing protein associates with heterochromatin and represses transcription. J Cell Sci. 2011;124(18):3149–3163. doi:10.1242/jcs.086603
10. Kurniawan F, Chetlangia N, Kamran M, et al. BEND3 safeguards pluripotency by repressing differentiation-associated genes. Proc Natl Acad Sci U S A. 2022;4:119. doi:10.1073/pnas.2107406119
11. Zhao Y, Song X, Song X, et al. Identification of Diagnostic Exosomal LncRNA-miRNA-mRNA Biomarkers in Colorectal Cancer Based on the ceRNA Network. Pathol Oncol Res. 2022;28:1610493. doi:10.3389/pore.2022.1610493
12. Barghout SH, Aman A, Nouri K, et al. A genome-wide CRISPR/Cas9 screen in acute myeloid leukemia cells identifies regulators of TAK-243 sensitivity. JCI Insight. 2021;6:14518. doi:10.1172/jci.insight.141518
13. Kumar S, Das A. Peripheral blood mononuclear cell derived biomarker detection using eXplainable Artificial Intelligence (XAI) provides better diagnosis of breast cancer. Comput Biol Chem. 2023;104:107867. doi:10.1016/j.compbiolchem.2023.107867
14. Savci-Heijink CD, Halfwerk H, Koster J, et al. A specific gene expression signature for visceral organ metastasis in breast cancer. BMC Cancer. 2019;19:333. doi:10.1186/s12885-019-5554-z
15. Yu B, Zhao Z, Chen Z, et al. CD24-associated ceRNA network reveals prognostic biomarkers in breast carcinoma. Sci Rep. 2023;13(1):3826. doi:10.1038/s41598-022-25072-x
16. Vivian J, Rao AA, Nothaft FA, et al. Toil enables reproducible, open source, big biomedical data analyses. Nat Biotechnol. 2017;35(4):314–316. doi:10.1038/nbt.3772
17. Gao J, Aksoy BA, Dogrusoz U, et al. Integrative analysis of complex cancer genomics and clinical profiles using the cBioPortal. Sci Signal. 2013;6(269):pl1. doi:10.1126/scisignal.2004088
18. Liu CJ, Hu FF, Xie GY, et al. GSCA: an integrated platform for gene set cancer analysis at genomic, pharmacogenomic and immunogenomic levels. Brief Bioinform. 2023;24:558. doi:10.1093/bib/bbac558
19. Chandrashekar DS, Karthikeyan SK, Korla PK, et al. UALCAN: an update to the integrated cancer data analysis platform. Neoplasia. 2022;25:18–27. doi:10.1016/j.neo.2022.01.001
20. Chen D, Xu L, Xing H, et al. Sangerbox 2: enhanced functionalities and update for a comprehensive clinical bioinformatics data analysis platform. Imeta. 2024;3(5):e238. doi:10.1002/imt2.238
21. Bindea G, Mlecnik B, Tosolini M, et al. Spatiotemporal Dynamics of Intratumoral Immune Cells Reveal the Immune Landscape in Human Cancer. Immunity. 2013;39(4):782–795. doi:10.1016/j.immuni.2013.10.003
22. Hänzelmann S, Castelo R, Guinney J. GSVA: gene set variation analysis for microarray and RNA-Seq data. BMC Bioinf. 2013;14(1):7. doi:10.1186/1471-2105-14-7
23. Li T, Fu J, Zeng Z, et al. TIMER2.0 for analysis of tumor-infiltrating immune cells. Nucleic Acids Res. 2020;48(W1):W509–W14. doi:10.1093/nar/gkaa407
24. Szklarczyk D, Kirsch R, Koutrouli M, et al. The STRING database in 2023: protein-protein association networks and functional enrichment analyses for any sequenced genome of interest. Nucleic Acids Res. 2023;51(D1):D638–D46. doi:10.1093/nar/gkac1000
25. Shannon P, Markiel A, Ozier O, et al. Cytoscape: a software environment for integrated models of biomolecular interaction networks. Genome Res. 2003;13(11):2498–2504. doi:10.1101/gr.1239303
26. Yang LL, Chen X, Huang KT, et al. BEND3 promotes hepatocellular carcinoma progression and metastasis by activating the PI3K/AKT/mTOR pathway and inducing epithelial-mesenchymal transition. Clin Res Hepatol Gastroenterol. 2025;49(5):102582. doi:10.1016/j.clinre.2025.102582
27. Liu HR, Weng JL. A Pan-Cancer Bioinformatic Analysis of RAD51 Regarding the Values for Diagnosis, Prognosis, and Therapeutic Prediction. Front Oncol. 2022;12:858756. doi:10.3389/fonc.2022.858756
28. Liu HR, Dilger JP, Lin J. A pan-cancer-bioinformatic-based literature review of TRPM7 in cancers. Pharmacol Therapeut. 2022;240:108302. doi:10.1016/j.pharmthera.2022.108302
29. Liu HR, Karsidag M, Chhatwal K, et al. Single-cell and bulk RNA sequencing analysis reveals CENPA as a potential biomarker and therapeutic target in cancers. PLoS One. 2025;20(1):e0314745. doi:10.1371/journal.pone.0314745
30. Zhang J, Zhang Y, You Q, et al. Highly enriched BEND3 prevents the premature activation of bivalent genes during differentiation. Science. 2022;375(6584):1053–1058. doi:10.1126/science.abm0730
31. Li YW, Azmi AS, Mohammad RM. Deregulated transcription factors and poor clinical outcomes in cancer patients. Semin Cancer Biol. 2022;86:122–134. doi:10.1016/j.semcancer.2022.08.001
32. Shen H, Laird PW. Interplay between the cancer genome and epigenome. Cell. 2013;153(1):38–55. doi:10.1016/j.cell.2013.03.008
33. Zhuang H, Yu B, Tao D, et al. The role of m6A methylation in therapy resistance in cancer. Mol Cancer. 2023;22(1):91. doi:10.1186/s12943-023-01782-2
34. Lan Q, Liu PY, Bell JL, et al. The Emerging Roles of RNA m(6)A Methylation and Demethylation as Critical Regulators of Tumorigenesis, Drug Sensitivity, and Resistance. Cancer Res. 2021;81(13):3431–3440. doi:10.1158/0008-5472.CAN-20-4107
35. Devaud C, John LB, Westwood JA, et al. Immune modulation of the tumor microenvironment for enhancing cancer immunotherapy. Oncoimmunology. 2013;2(8):e25961. doi:10.4161/onci.25961
36. Wang Y, Wang M, Wu HX, et al. Advancing to the era of cancer immunotherapy. Cancer Commun. 2021;41(9):803–829. doi:10.1002/cac2.12178
37. Baretti M, Le DT. DNA mismatch repair in cancer. Pharmacol Ther. 2018;189:45–62. doi:10.1016/j.pharmthera.2018.04.004
38. Xu Y, Fu Y, Zhu B, et al. Predictive Biomarkers of Immune Checkpoint Inhibitors-Related Toxicities. Front Immunol. 2020;11:2023. doi:10.3389/fimmu.2020.02023
39. Schumacher TN, Schreiber RD. Neoantigens in cancer immunotherapy. Science. 2015;348(6230):69–74. doi:10.1126/science.aaa4971
40. Zhang H, Yue X, Chen Z, et al. Define cancer-associated fibroblasts (CAFs) in the tumor microenvironment: new opportunities in cancer immunotherapy and advances in clinical trials. Mol Cancer. 2023;22(1):159. doi:10.1186/s12943-023-01860-5
41. Tesi RJ. MDSC; the Most Important Cell You Have Never Heard Of. Trends Pharmacol Sci. 2019;40(1):4–7. doi:10.1016/j.tips.2018.10.008
42. Reizis B. Plasmacytoid Dendritic Cells: development, Regulation, and Function. Immunity. 2019;50(1):37–50. doi:10.1016/j.immuni.2018.12.027
43. De Monte L, Reni M, Tassi E, et al. Intratumor T helper type 2 cell infiltrate correlates with cancer-associated fibroblast thymic stromal lymphopoietin production and reduced survival in pancreatic cancer. J Exp Med. 2011;208(3):469–478. doi:10.1084/jem.20101876
44. Vaghari-Tabari M, Ferns GA, Qujeq D, et al. Signaling, metabolism, and cancer: an important relationship for therapeutic intervention. J Cell Physiol. 2021;236(8):5512–5532. doi:10.1002/jcp.30276
45. Liu HR, Li YY, Karsidag M, et al. Technical and Biological Biases in Bulk Transcriptomic Data Mining for Cancer Research. J Cancer. 2025;16:33–43. doi:10.7150/jca.100922
 © 2025 The Author(s). This work is published and licensed by Dove Medical Press Limited. The
full terms of this license are available at https://www.dovepress.com/terms
and incorporate the Creative Commons Attribution
- Non Commercial (unported, 4.0) License.
By accessing the work you hereby accept the Terms. Non-commercial uses of the work are permitted
without any further permission from Dove Medical Press Limited, provided the work is properly
attributed. For permission for commercial use of this work, please see paragraphs 4.2 and 5 of our Terms.
© 2025 The Author(s). This work is published and licensed by Dove Medical Press Limited. The
full terms of this license are available at https://www.dovepress.com/terms
and incorporate the Creative Commons Attribution
- Non Commercial (unported, 4.0) License.
By accessing the work you hereby accept the Terms. Non-commercial uses of the work are permitted
without any further permission from Dove Medical Press Limited, provided the work is properly
attributed. For permission for commercial use of this work, please see paragraphs 4.2 and 5 of our Terms.