Back to Journals » OncoTargets and Therapy » Volume 11
Integrated omics and gene expression analysis identifies the loss of metabolite–metabolite correlations in small cell lung cancer
Authors Yu L, Li K ![]() , Xu Z, Cui G, Zhang X
, Xu Z, Cui G, Zhang X
Received 21 February 2018
Accepted for publication 10 May 2018
Published 6 July 2018 Volume 2018:11 Pages 3919—3929
DOI https://doi.org/10.2147/OTT.S166149
Checked for plagiarism Yes
Review by Single anonymous peer review
Peer reviewer comments 2
Editor who approved publication: Dr XuYu Yang
Li Yu,1 Kefeng Li,2 Zhaoguo Xu,1 Guoyuan Cui,1 Xiaoye Zhang1
1Department of Oncology, Shengjing Hospital of China Medical University, Shenyang, Liaoning, China; 2School of Medicine, University of California–San Diego, San Diego, CA, USA
Background and objective: Small cell lung cancer (SCLC) is the most aggressive type of lung carcinoma with high metastatic potential and chemoresistance upon relapse. Cancer cells remodel the existing metabolic pathways for their benefits and the perturbations in cellular metabolism are the hallmark of cancer. However, the extent of these changes remains largely unknown for SCLC.
Materials and methods: We characterized the metabolic perturbations in SCLC cells (SCLCC) by metabolomics. Large-scale correlation analysis was performed between metabolites. Targeted proteomics and gene expression analysis were employed to investigate the changes of key enzymes and genes in the disturbed pathways.
Results: We found dramatic decrease of metabolite–metabolite correlations in SCLCC compared with normal control cells and non-small cell lung cancer cells. Pathway analysis revealed that the loss of correlations was associated with the alternations of fatty acid oxidation, urea cycle, and purine salvage pathway in SCLCC. Targeted proteomics and gene expression analysis confirmed significant changes of the expression for the key enzymes and genes in the pathways in SCLCC including the upregulation of carbamoyl phosphate synthase 1 (urea cycle) and carnitine palmitoyltransferase 1A (fatty acid oxidation), and the downregulation of hypoxanthine–guanine phosphoribosyltransferase and adenine phosphoribosyltransferase in purine salvage pathway.
Conclusion: We demonstrated the loss of metabolite–metabolite correlations in SCLCC associated with the upregulation of fatty acid oxidation and urea cycle and the downregulation of purine salvage pathways. Our findings provide insights into the metabolic reprogramming in SCLCC and highlight the potential therapeutic targets for the treatment of SCLC.
Keywords: small cell lung cancer, metabolomics, metabolite–metabolite correlations, purine salvage pathway, urea cycle, fatty acid oxidation
Introduction
Lung cancer is the leading cause of cancer-related death for both men and women in the USA and all over the world.1 Small cell lung cancer (SCLC) accounts for about 10%–15% of lung cancer.2 Because of its high metastatic potential and chemoresistance upon relapse, the prognosis of SCLC is very poor compared with other histological types of lung cancer. The median survival time for patients with SCLC is 15–20 months for the localized stage (LD-SCLC),3 and <10 months for the extensive stage (ED-SCLC).4
The treatment regimen of SCLC and the survival rate of patients have not changed substantially over the past 30 years. The standard treatment for SCLC is using the combination of radiotherapy and chemotherapy for LD-SCLC and adopting chemotherapy for ED-SCLC. Although most patients may be sensitive to radiotherapy and chemotherapy in the early stages of treatment (45%–80% effective rate), almost all patients will relapse within 6–12 months after treatment.5
Unlike non-small cell lung cancer (NSCLC), there are no molecular targeted drugs approved for SCLC. Most of the current clinical trials using new molecular targeted drugs for the treatment of SCLC did not show significant clinical benefits over the existing treatment regimens.6 The main factors are the genomic instability and high mutability of SCLC. The heterogeneity is very high, resulting in the limited efficacy of a single targeted drug.
Metabolism is more conserved than genomic or transcriptomic sequences. Cancer cells generally reprogram the existing metabolic pathways to support cell survival under stress or allow cells to grow and proliferate at pathologically elevated levels. A comprehensive understanding of the underlying metabolic perturbations in SCLC is urgently needed. Such knowledge would help to elucidate the unique metabolic signatures of SCLC and identify drug targets and biomarkers for diagnosis. The recent development of next-generation metabolomics has provided a powerful tool to simultaneously quantify all the essential metabolites in the major metabolic pathways such as lipids, amino acids, organic acids, and carbohydrates.7 This enables the global evaluation of the metabolic disturbances that occur in the biological systems. To date, investigations of lung cancer using metabolomics were primarily on NSCLC8–11 and little information is available on the metabolic features of SCLC.
Cancer cell lines are straightforward experimental models and have been highly informative about the molecular mechanisms of metabolic reprogramming.12 This is particularly essential for SCLC due to poor access to the primary tumor material.13 In this situation, cell lines are the main research tool for SCLC.
In this study, we performed comparative metabolomic analysis to characterize the metabolic perturbations in SCLC cells (SCLCC) compared with normal human bronchial epithelial cells (HBEC) and NSCLC cells (NSCLCC). We conducted large-scale metabolite–metabolite correlation analysis (MMCA) and found dramatic decrease of metabolite–metabolite correlations (MMCs) in SCLCC. The loss of correlations is primarily from fatty acid oxidations, urea cycle, and purine salvage pathway. The changes of the expression for key enzymes and genes in the altered metabolic pathways were further confirmed using targeted proteomics and real-time quantitative polymerase chain reaction (qPCR). This study will help our understanding of metabolic reprogramming in SCLC and support the development of new strategies to treat SCLC through targeting cellular metabolism.
Materials and methods
Cell culture
Three types of cell lines including human SCLCC (NCI-H446), human NSCLCC (A549), and HBEC (BEAS-2B) were purchased from BeNa Cell Culture Collection (Beijing, China). The cells were maintained in RPMI-1640 medium supplemented with 10% fetal bovine serum, 100 U/mL penicillin, and 100 μg/mL streptomycin. The cell lines were maintained in the cell incubator at 37°C, 5% CO2, and humidified conditions. The cells were passaged when the cell density was up to 80%–90%. They were washed with PBS and digested with 0.25% trypsin (containing 0.01% EDTA), and then the cells were washed off the wall of the bottles using RPMI-1640 complete medium, for metabolomic analysis. The logarithmic phase cells were used for the experiments.
Extraction of metabolites
Metabolites from the cells were extracted according to a previous report with slight modifications.14 Six replicates were set up for each type of cells. The cell number of about 1 million (SD≤10%) was used for each replicate. The culture medium was aspirated with a pipette and the cells were digested with 3 mL of 0.25% trypsin and then transferred to a centrifuge tube. The cells were centrifuged for 10 min (800× g) at room temperature and the supernatant was discarded. Five hundred microliters of the extraction buffer (methanol:water=50:50, v/v) was then added to the centrifuge tube. After incubation for 10 min on ice, the mixture was centrifuged at 16,000× g for 10 min at 4°C. After centrifugation, 200 μL of the supernatant was then transferred to a new 1.5 mL centrifuge tube, dried with nitrogen gas, sealed and stored at −80°C for metabolomic analysis.
LC-MS/MS-based metabolomics analysis
The metabolomic analysis was conducted based on previous reports.14,15 Briefly, the metabolite extract was redissolved in 100 μL of extraction buffer. The major metabolites in the samples were analyzed by ultra-performance liquid chromatography (LC-20AD, Shimadzu, Kyoto, Japan), coupled with SCIEX Qtrap 5500 (SCIEX, Framingham, MA, USA). Chromatographic separation was achieved on a Luna NH2 column (250×2 mm, 5 μm). The mobile phases were as follows: mobile Phase A: 95% water +5% acetonitrile +20 μM ammonium hydroxide, pH 9.4; mobile Phase B: 100% acetonitrile. The flow rate was set at 0.3 mL/min. The column temperature was set at 25°C. The injection volume was 10 μL. The liquid chromatography (LC) gradient was: 0–3 min, 95% B; 3–6 min, 75% B; 6–7 min, 0% B; 7–12 min, 0% B, 12–15 min, 95% B. The mass spectrometry (MS) was operated in multiple reaction monitoring mode and the conditions were set as follows: ESI source temperature: 500°C, Gas 1: 30 psi, Gas 2: 30 psi, curtain gas: 30 psi, ion spray voltage: 5,500 V for positive mode and −4,500 V for negative mode.
The area of the obtained chromatographic peaks was integrated and manually inspected in Multiquant 3.0 (SCIEX). The missing values in the dataset were evaluated by the k-nearest neighbor method and the metabolites with missing data >50% were removed. Prior to statistical analysis, data were log2 transformed and autoscaled. Statistical analyses including partial least square analysis (PLS-DA), heatmap analysis, principal component analysis (PCA), and large-scale correlation analysis were conducted in metaboanalyst 3.0 (www.metaboanalyst.ca).
Targeted proteomics by parallel reaction monitoring
Protein was extracted from the cells using Pierce™ Mass Spec Sample Prep Kit for Cultured Cells (Thermo Fisher Scientific, Waltham, MA, USA) and quantified using BCA kit according to the manufacturer’s instructions. The protein was then digested with trypsin as described in the Mass Spec Sample Prep Kit for Cultured Cells (Thermo Fisher Scientific). The digested peptides were resuspended in 0.1% (v/v) formic acid for LC-MS/MS analysis. The separation of the peptides was performed on Thermo EASY-nLC 1000 nanoliquid chromatography (Thermo Fisher Scientific) using a C18 column (75 μm×15 cm, Acclaim PepMap, Thermo Fisher Scientific). The mobile phases were as follows: mobile Phase A: 98% water with 2% acetonitrile and 0.1% formic acid; mobile Phase B: 90% acetonitrile and 0.1% formic acid. The gradient was as follows: 0–40 min, 7%–25% B; 40–52 min, 25%–40% B; 52–56 min, 40%–80% B; 56–60 min, 80% B. The flow rate was 400 nL/min. The parallel reaction monitoring analysis was performed on a Q Exactive plus mass spectrometer (Thermo Fisher Scientific). The MS cycle consisted of a full MS1 scan (350–1,000 m/z) with the resolution of 70,000 followed by the scheduled targeted MS2 scan with the resolution of 35,000. The fragmentation energy of the HCD collision pool was set at 27. The isolation window for MS/MS was set at 2.0 m/z. The resulting MS data were processed using Skyline software (v3.6, MacCoss Lab, Seattle, WA, USA) as described previously.16 Peptide settings were as follows: enzyme was set as Trypsin (KR/P), max missed cleavage was set as 0. The peptide length was set as 7–25 amino acid residues. The variable modification was set as carbamidomethyl on cys and oxidation on Met. Transition settings were as follows: precursor charges were set as 2 and 3. The ion match tolerance was set at 0.02 Da.
Real-time quantitative PCR
Cells were collected and 1 mL of Trizol was added per 2 million cells. Total RNA was extracted using the RNA isolation kit according to the manufacturer’s instructions (Thermo Fisher Scientific). The RNA concentration was quantified by NanoPhotometer® N50 spectrophotometer (Implen, Westlake Village, CA, USA). Total RNA from each sample was reverse-transcribed to cDNA using PrimeScript™ RT Reagent Kit (Takara Bio, Mountain View, CA, USA). qPCR was performed on an ABI 7500 Fast Real-Time PCR system (Applied Biosystems, Carlsband, CA, USA). The reaction mixture contained 10 μL of SYBR Premix Ex Taq (Tli RNaseH Plus) (2×), 0.4 μL of the forward primer, 0.4 μL of the reverse primer, 0.4 μL of ROX Reference Dye II (50×), 2 μL of DNA template, and 6.8 μL of sterilized water. The amplification conditions were as follows: 95°C predenaturation for 30 s, then 95°C/3 s, 60°C/30 s for 40 cycles. Triplicates were set up for each sample. GAPDH was used as the internal control. The expression ratio of each gene relative to GAPDH was calculated. The primer sequences are listed in Table S1.
Statistical analysis
Data are expressed as the mean±SD. Six replicates were set up for metabolomic and proteomic analysis. Three replicates were used for qPCR. Statistical analysis was conducted using GraphPad Prism 7.0 software (GraphPad, San Diego, CA, USA) unless otherwise indicated. Student’s t-test was used to calculate the significance levels between two groups. A p-value <0.05 was considered as statistically significant.
Results
Metabolomic analysis revealed the dramatic, different metabolic profiles between SCLCC, NSCLCC, and the controls
To investigate the metabolic features of SCLCC, we first conducted a broad-spectrum targeted metabolomic analysis, and in total 420 metabolites were analyzed covering all the major metabolic pathways. Multivariate analysis using PLS-DA showed the distinct separation of SCLCC from NSCLCC and the controls (Figure 1A). The metabolic profile of NSCLCC was in between HBEC and SCLCC. Since PLS-DA is a supervised model, leave-one-out cross-validation was performed to avoid the overfitting of the model. The validation confirmed the accuracy of PLS-DA classification in this study (Figure 1B). Similarly, the metabolic profile of SCLCC was also completely separated from the controls by the PCA model (Figure S1). Metabolites were analyzed by cluster analysis and thermal map analysis (Figure 1C). Replicates of SCLCC were clustered together, while replicates of NSCLCC were clustered in another category. SCLCC had a higher content of nucleosides (adenine and deoxyadenosine), acylcarnitines, and argininosuccinic acid than NSCLCC and the controls. In contrast, SCLCC had a lower level of adenosine monophosphate and inosine monophosphate (IMP) compared with NSCLCC and the control cell line. All these data suggested dramatic metabolic differences between SCLCC, NSCLCC, and the control cells (HBEC).
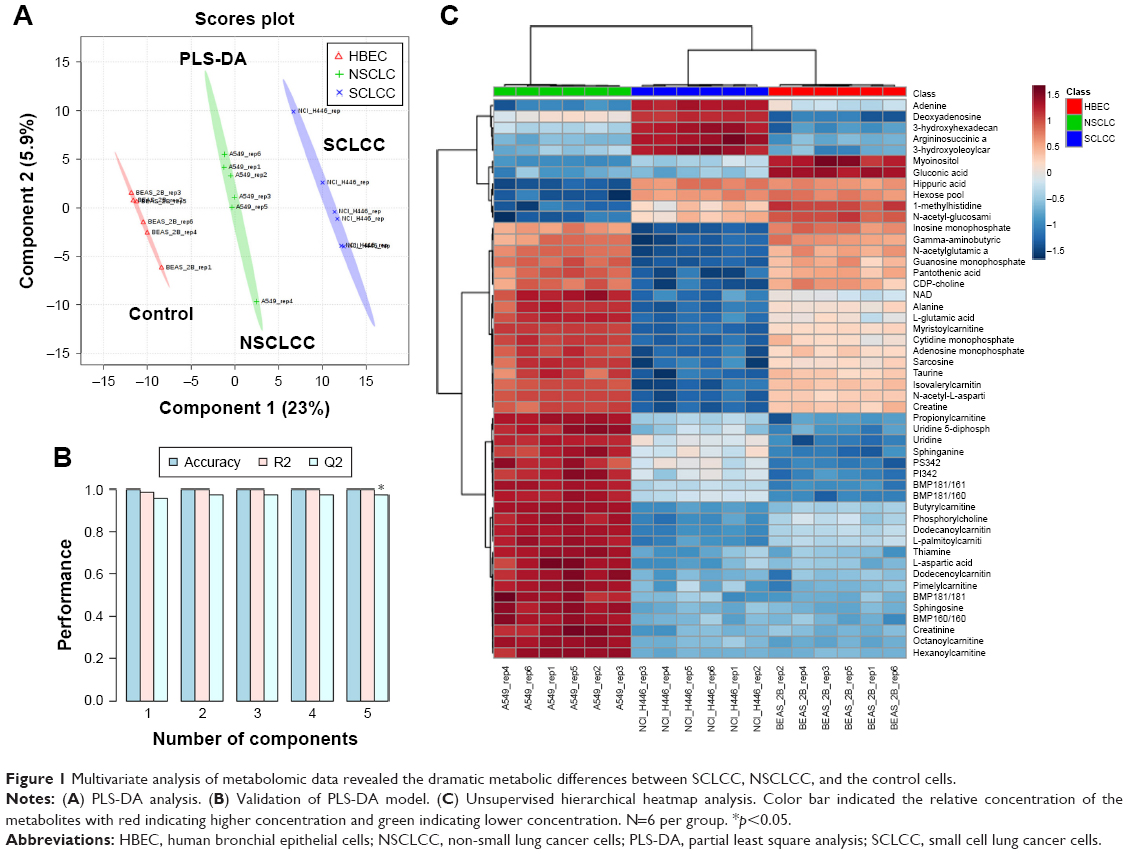 | Figure 1 Multivariate analysis of metabolomic data revealed the dramatic metabolic differences between SCLCC, NSCLCC, and the control cells. |
The dramatic decrease of correlations between metabolites in SCLCC
We next explored the correlations between the metabolites in HBEC, NSCLCC, and SCLCC. Log2 transformation and normalization of the metabolites peak areas were performed prior to correlation analysis to achieve Gaussian distribution of the metabolomic dataset. Pearson correlations were then conducted between the metabolites. The cutoff values were set as Pearson correlation r >0.7 or <−0.7 and p<0.05. Surprisingly, as shown in the heatmap (Figure 2A), the correlation patterns in SCLCC were dramatically different from those in HBEC and NSCLCC. We then analyzed the correlation matrix to investigate significant correlations between metabolites. We found that the number of significant correlations between metabolites was dramatically reduced in lung cancer cells for both negative and positive correlations (Figure 2B). Compared with NSCLCC, a further reduction in the number of significant correlations was observed in SCLCC. Totally, 17,485 positive correlations were found in HBEC, while 16,001 were identified in NSCLCC and only 14,130 were present in SCLCC. Similarly, only 5,400 negative correlations between metabolites in SCLCC were identified and 6,011 in NSCLCC. In contrast, 6,816 significant negative MMCs were found in normal control cells.
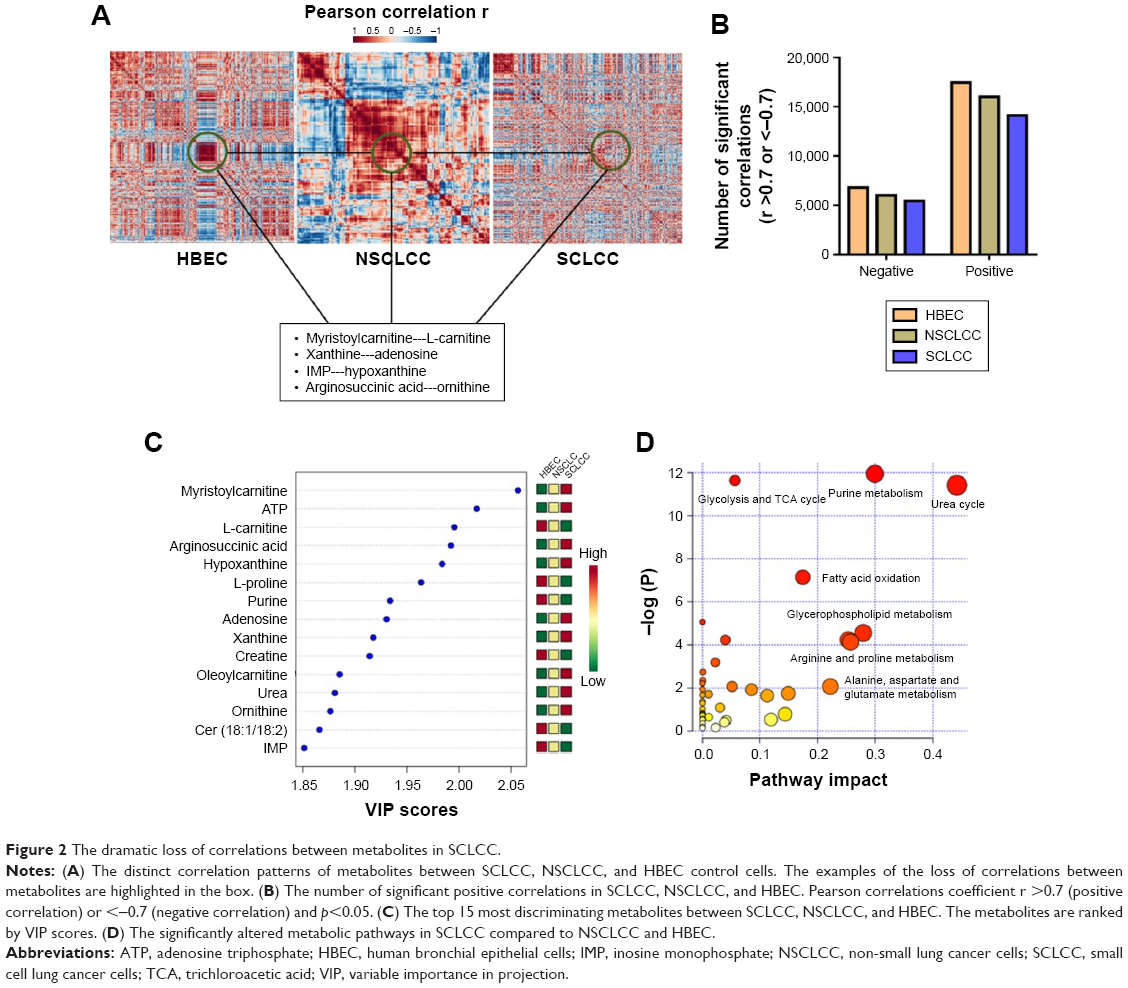 | Figure 2 The dramatic loss of correlations between metabolites in SCLCC. |
The dysregulation of fatty acids oxidation, urea cycle, and purine salvage pathway in SCLCC
We next explored in more detail what metabolites lose their correlations in SCLCC compared with HBEC and NSCLCC. For example, myristoylcarnitine and L-carnitine in control cells were highly correlated with the Pearson correlation coefficient r of 0.94 (Figure 2A). However, in NSCLCC, the positive correlation coefficient between these two metabolites was dramatically reduced to 0.62. In SCLCC, the correlation coefficient further decreased to 0.53. Similarly, the significant positive correlations disappeared in SCLCC for xanthine-adenosine, IMP-hypoxanthine, and argininosuccinic acid-ornithine (Figure 2A).
To verify our findings in the correlation analysis, we conducted variable influence on projection (VIP) analysis in PLS-DA model to investigate the metabolites that contributed to the separation of SCLCC from HBEC and NSCLCC. The top 15 most significantly altered metabolites are shown in Figure 2C. We found that acylcarnitines and purine nucleotides such as carnitine, myristoylcarnitine, IMP, adenosine, and xanthine were significantly changed in SCLCC compared with HBEC and NSCLCC (Figure 2C). Interestingly, even though the same metabolites were altered in NSCLCC, the changes in SCLCC were much more dramatic. For instance, the level of myristoylcarnitine in NSCLCC was 30.1% higher than in HBEC, while it was 2.2-fold in SCLCC compared with HBEC. In addition, VIP analysis showed the dramatic increase of argininosuccinic acid and urea in SCLCC.
Further pathway analysis was conducted using the metabolites with altered correlations in SCLCC, and the biochemical pathway abnormalities are illustrated in Figure 2D. Glycolysis, trichloroacetic acid (TCA) cycles, urea cycle, purine and pyrimidine metabolism, fatty acid oxidation, and glycerophospholipids were the main pathways disturbed in SCLCC. Since the metabolic characteristics of glycolysis and TCA cycle were well documented in cancer cells, we next focused on urea cycle, fatty acid oxidation, and purine salvage pathways.
Confirmation using targeted proteomics and qPCR analysis
To confirm the disturbed metabolic pathways in SCLCC revealed by metabolomic analysis, we conducted targeted proteomics and qPCR to analyze the changes of key enzymes and genes in the pathways. For targeted proteomics, in purine salvage pathway, the protein expression of xanthine dehydrogenase (XDH), hypoxanthine–guanine phosphoribosyltransferase (HPRT1), and adenine phosphoribosyltransferase (APRT) were significantly reduced in SCLCC compared with the control cells (Figure 3A–C). Carbamoyl phosphate synthase 1 (CPS1) is the rate-limiting enzyme for the urea cycle. We found that CPS1 was elevated in SCLCC relative to control (Figure 3D). This was consistent with the increase of argininosuccinic acid and urea in our metabolomic analysis. Carnitine palmitoyltransferase 1A (CPT1A) and carnitine palmitoyltransferase 2 (CPT2) are the key enzymes located in mitochondria for fatty acid oxidation. Compared with the control cells, CPT1A was significantly elevated indicating the upregulation of fatty acid oxidation in SCLCC, which was in line with the accumulation of acylcarnitines found in the metabolomic analysis (Figure 3E). CPT2 expression in SCLCC was about 1.3-fold of the expression in HBEC but this was not statistically significant (p=0.12; Figure 3F).
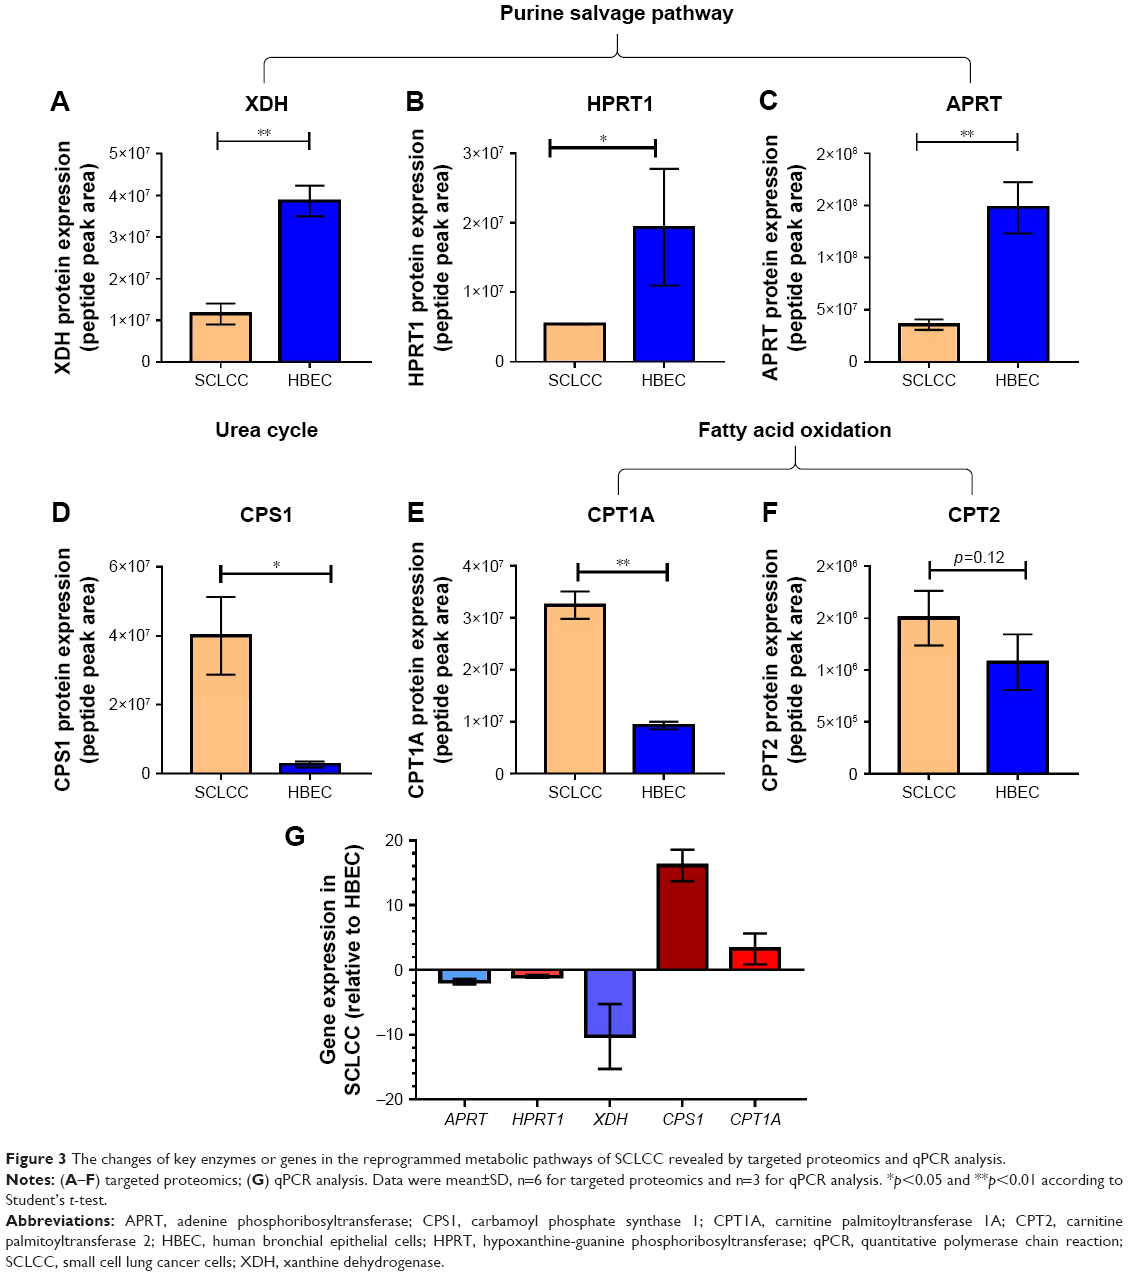 | Figure 3 The changes of key enzymes or genes in the reprogrammed metabolic pathways of SCLCC revealed by targeted proteomics and qPCR analysis. |
In the qPCR analysis, the expression of key genes in purine salvage pathway including APRT, HPRT1, and XDH was significantly reduced by 2–15 fold compared with HBEC (Figure 3G). In contrast, CPS1 and CPT1A were overexpressed by 4–18 fold (Figure 3G). Together, targeted proteomics and qPCR analysis corroborated SCLCC-associated perturbations in purine salvage pathway, fatty acid oxidation, and the urea cycle.
Integrated network analysis
We then performed integrated network analysis of SCLCC to outline biochemical relationships between metabolites, proteins, and genes related to urea cycle and proximal biosynthetic pathways (Figure 4). Quite noticeably, purine salvage pathway, fatty acid oxidation, and urea cycle are interconnected with each other through mitochondrial metabolism. These specific metabolic pathways are remodeled by SCLCC to support the biological processes that enable tumor growth and therapy resistance.
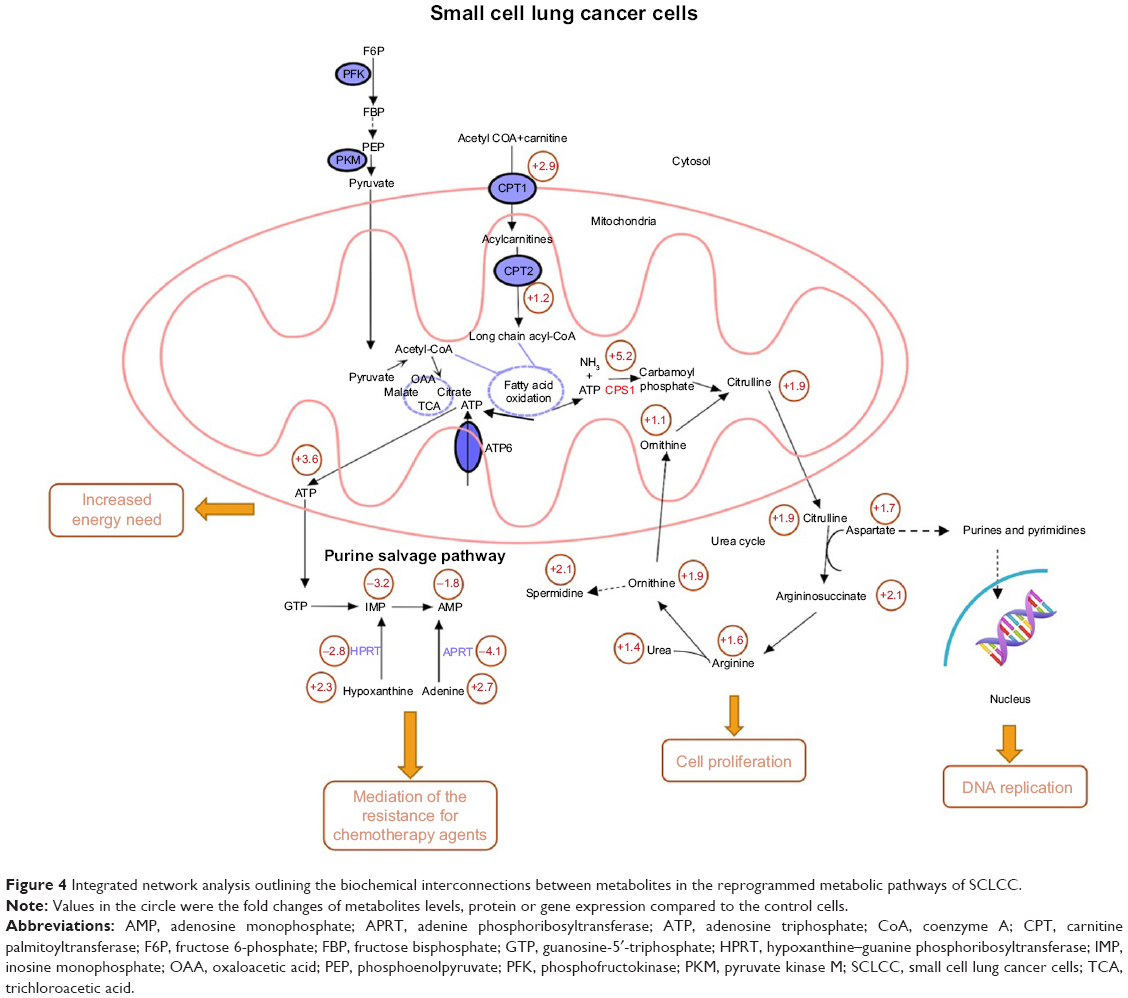 | Figure 4 Integrated network analysis outlining the biochemical interconnections between metabolites in the reprogrammed metabolic pathways of SCLCC. |
For instance, urea cycle is the main metabolic pathway for nitrogen recycling from ammonia generated by glutamine and asparagine catabolism.17 Ammonia is assimilated through CPS1 and subsequently incorporated into amino acid metabolism and nucleotide biosynthesis. The upregulation of urea cycle enables SCLCC to maximize cancer cell nitrogen utilization and thus accelerate tumor proliferation. Downregulation of purine salvage pathway in SCLCC resulted in the increase of adenine and hypoxanthine. Addition of adenine and hypoxanthine had been shown to alleviate the cytotoxicity of chemotherapeutic agent cisplatin in Saccharomyces cerevisiae.18 It is likely that the dysregulation of purine salvage pathway is used by SCLCC to mediate the resistance for chemotherapy agents. Overactivation of fatty acid oxidation fuels SCLCC growth via ATP production.
Comparisons across different types of cancer
We next investigated the expression pattern of the above-identified key genes (HPRT1, XDH, CPS1, and CPT1A) among different types of cancer tissues through a publicly available database oncomine (www.oncomine.org). Surprisingly, very limited information was available regarding the expression of these genes in SCLC tissues. This was likely due to the poor access to primary tumor material as most SCLC patients were diagnosed in their late stages. The expressions of these genes in different types of cancer were not in the same direction compared with normal control tissues (Figure 5). For instance, HPRT1 expression significantly decreased by 1.2–8 fold in renal and breast cancer which was the same as our finding in SCLCC. In contrast, HPRT1 was upregulated in brain glioblastoma and cecum adenocarcinoma. Similarly, CPT1A a key gene in acylcarnitines biosynthesis, was significantly upregulated in the tissues of liver cancer and renal Wilms’ tumor. CPT1A expression was significantly reduced compared with the controls in breast cancer and ovarian cancer. The expression of urea cycle gene CPS1 in liver cancer, rectal adenoma, and lung adenocarcinoma was about 1.5–3 fold higher than the controls, while, it was dramatically downregulated in breast carcinoma.
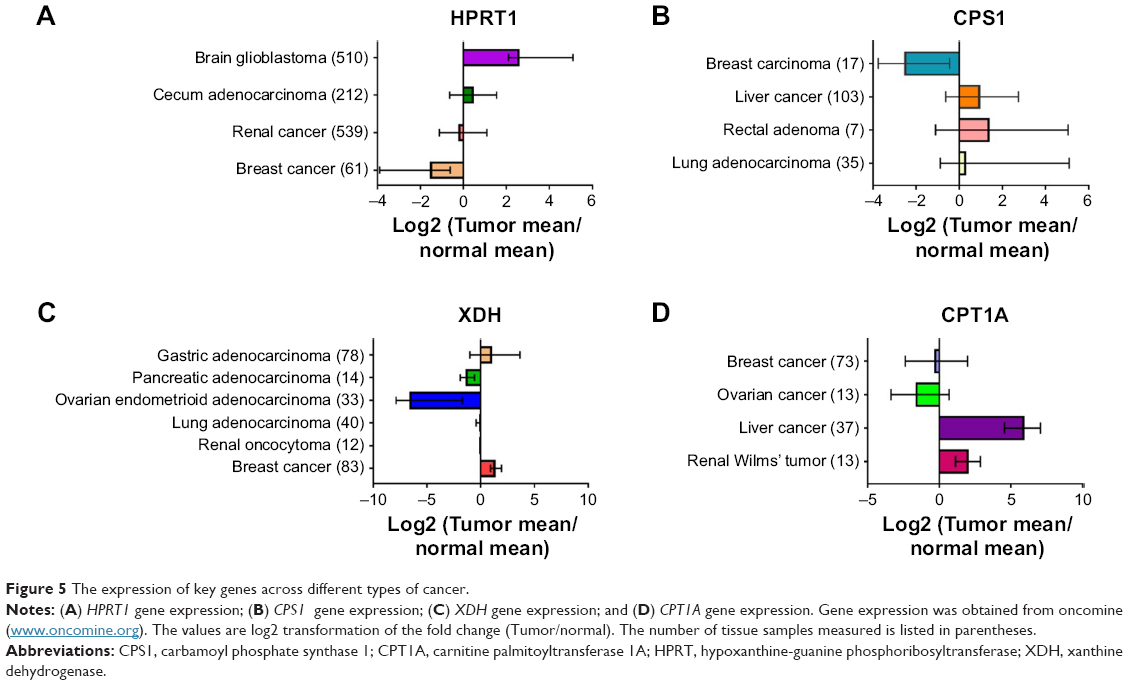 | Figure 5 The expression of key genes across different types of cancer. |
Discussion
The present study represented the first attempt to characterize the metabolic features of SCLCC using metabolomics in combination with targeted proteomics and gene expression analysis. Specific focus was placed on SCLCC since SCLC is rather aggressive and no molecular targeted drugs are standardized for SCLC.19 Cancer cells generally reprogram the existing metabolic pathways to meet their special needs. Metabolic characteristics of SCLCC can be exploited to provide prognostic information, image tumors, and improve cancer therapeutics.
In this study, we selected cell line NCI-H446 as the representative of SCLC, A549 as the representative of NSCLC, and cell line BEAS-2B as the normal lung cell control. Metabolism is highly conserved to the specific taxa.20,21 It was reported that cancer metabolome profiles are mainly associated with the malignancy.22 Compared with NSLCC, SCLC is more malignant with shorter doubling time, higher growth fraction, and earlier development of metastases.23 In contrast, the malignancy between cell lines of the same type is similar. In this study, we attempted to explore the large metabolic differences between different types of lung cancer cells other than the cell-line-specific subtle differences.
Metabolites are tightly coordinated and interconnected in the context of metabolic pathways in a steady state. MMCA represents a new approach to understanding the metabolome. The method allows to monitor even the tiny cellular perturbations even if no detectable changes in mean metabolite concentrations are observed.24 MMCA had previously been used to explore the metabolic variations between japonica and indica rice cultivars.25 Here, we applied this approach to investigate the metabolic differences between HBEC, NSCLCC, and SCLCC. MMCA generated a large number of significant correlations. By checking over 10,000 correlations in the correlation matrix, we found that the number of correlations dramatically decreased in SCLCC. In our previous study, we also identified the loss of metabolites correlations in rat hippocampal metabolism during aging.26 The correlation patterns between metabolites in SCLCC reflect the recoordination of cancer metabolism and might be used as biomarkers for the diagnosis of SCLC.
Our study highlighted the importance of purine salvage pathway, fatty acid oxidation, and urea cycle to support the acquisition and maintenance of malignant properties of SCLCC. Recently, metabolic recycling of ammonia through urea cycle was shown to facilitate the growth of breast cancer.27 In this study, for the first time, we observed a significant increase in urea cycle metabolites including L-arginine, urea, and ornithine in SCLCC (Figure 4). Enhanced L-arginine metabolism contributes to the modulation of immune responses by tumor cells during pathologies associated with chronic inflammation.28 A recent study had proposed the depletion of L-arginine as a therapy for the treatment of liver cancer.29 CPS1 is the first rate-limiting mitochondrial enzyme in the urea cycle. We discovered a significant overexpression of CPS1 in SCLCC. A previous study showed that CPS1 knockdown in lung adenocarcinoma dramatically inhibited cell proliferation and decreased metabolites related to nucleic acid biosynthesis.30 In addition, upregulation of CPS1 was associated with poor therapeutic response in rectal cancer patients receiving neoadjuvant concurrent chemoradiotherapy.31
Our study demonstrated the increased fatty acid beta oxidation in SCLCC. Fatty acid oxidation was reported as a dominant bioenergetic pathway in prostate cancer.32 Overexpression of key fatty acid synthesis enzymes was observed in human prostate cancers.33 Inhibition of fatty acid oxidation by drugs was used for the prevention of prostate cancer.34 CPT1A plays an important role in long-chain fatty acids uptake by mitochondria for beta oxidation. In addition to the overexpression in SCLCC identified in our study, the upregulation of CPT1A enzyme in fatty acid oxidation had been reported in ovarian cancer and glioblastoma.35,36 High expression of CPT1A was reported to be an adverse prognostic biomarker in acute myeloid leukemia.37
The role of purine salvage pathway in cancer cells has not been fully understood since most proliferating cells synthesize nucleotides de novo, mainly from glucose, glutamine, and CO2 other than utilization of the salvage pathway.38 In this study, we showed that purine salvage metabolism decreased in SCLCC. A study on yeast indicated that purine salvage pathway might mediate the resistance of chemotherapeutic agents.18 Reduced purine salvage and increased de novo purine synthesis were also found in the tissues of the early stage of lung adenocarcinoma.39 HPRT1 is the key enzyme in purine salvage pathway that converts hypoxanthine to IMP (Figure 4). In contrast to SCLCC, HPRT1 gene was dramatically upregulated in melanoma cells.40 HPRT1 was identified as a stable reference gene without significant differences between cancer and normal tissues for the normalization of other genes in uterine sarcoma.41 More work is needed to further understand the role of HPRT1 in cancer cells in order to explain the heterogeneity of gene expression in different cancer types.
Acknowledgments
This work was partially supported by grants from National Natural Science Foundation of China (No 81628008) and Natural Science Foundation of Tianjin City (No 16JCQNJC14400).
Disclosure
The authors report no conflicts of interest in this work.
References
Rebecca LS, Kimberly DM, Ahmedin JD. Cancer statistics, 2017. CA Cancer J Clin. 2017;67(1):7–30. | ||
Byers LA, Rudin CM. Small cell lung cancer: where do we go from here? Cancer. 2015;121(5):664–672. | ||
Van Meerbeeck JP, Fennell DA, De Ruysscher DK. Small cell lung cancer. Lancet. 2011;378(9804):1741–1755. | ||
Nicholson AG, Chansky K, Crowley J, et al. The International Association for the Study of Lung Cancer Lung Cancer staging project: proposals for the revision of the clinical and pathologic staging of small cell lung cancer in the forthcoming eighth edition of the TNM classification for lung cancer. J Thorac Oncol. 2016;11(3):300–311. | ||
Hute JP, Chen T, Feigal E, Simon R, Johnson BE. Twenty years of phase III trials for patients with extensive-stage small-cell lung cancer: perceptible progress. J Clin Oncol. 1999;17(6):1794–1801. | ||
Sgambato A, Casaluce F, Maione P, et al. Medical treatment of small cell lung cancer: state of the art and new development. Expert Opin Pharmacother. 2013;14(15):2019–2031. | ||
Yu L, Li K, Zhang X. Next-generation metabolomics in lung cancer diagnosis, treatment and precision medicine: mini review. Oncotarget. 2017;8(70):115774–115786. | ||
Kim J, Hu Z, Cai L, et al. CPS1 maintains pyrimidine pools and DNA synthesis in KRAS/LKB1-mutant lung cancer cells. Nature. 2017;546(7656):168–172. | ||
Ciborowski M, Kisluk J, Pietrowska K, et al. Development of LC-QTOF-MS method for human lung tissue fingerprinting. A preliminary application to nonsmall cell lung cancer. Electrophoresis. 2017;38(18):2304–2312. | ||
Klupczynska A, Dereziński P, Dyszkiewicz W, Pawlak K, Kasprzyk M, Kokot ZJ. Evaluation of serum amino acid profiles’ utility in non-small cell lung cancer detection in Polish population. Lung Cancer. 2016;100:71–76. | ||
Mazzone PJ, Wang XF, Beukemann M, et al. Metabolite profiles of the serum of patients with non-small cell carcinoma. J Thorac Oncol. 2016;11(1):72–78. | ||
DeBerardinis RJ, Chandel NS. Fundamentals of cancer metabolism. Sci Adv. 2016;2(5):e1600200. | ||
Calbo J, van Montfort E, Proost N, et al. A functional role for tumor cell heterogeneity in a mouse model of small cell lung cancer. Cancer Cell. 2011;19(2):244–256. | ||
Yuan M, Breitkopf SB, Yang X, Asara JM. A positive/negative ion-switching, targeted mass spectrometry-based metabolomics platform for bodily fluids, cells, and fresh and fixed tissue. Nat Protoc. 2012;7(5):872–881. | ||
Li K, Wang X, Pidatala VR, Chang CP, Cao X. Novel quantitative metabolomic approach for the study of stress responses of plant root metabolism. J Proteome Res. 2014;13(12):5879–5887. | ||
Martinez-Garcia E, Lesur A, Devis L, et al. Development of a sequential workflow based on LC-PRM for the verification of endometrial cancer protein biomarkers in uterine aspirate samples. Oncotarget. 2016;7(33):53102–53115. | ||
Altman BJ, Stine ZE, Dang CV. From Krebs to clinic: glutamine metabolism to cancer therapy. Nat Rev Cancer. 2016;16(11):749. | ||
Kowalski D, Pendyala L, Daignan-Fornier B, Howell SB, Huang RY. Dysregulation of purine nucleotide biosynthesis pathways modulates cisplatin cytotoxicity in Saccharomyces cerevisiae. Mol Pharmacol. 2008;74(4):1092–1100. | ||
Saber A, Hiltermann TJN, Kok K, et al. Mutation patterns in small cell and non-small cell lung cancer patients suggest a different level of heterogeneity between primary and metastatic tumors. Carcinogenesis. 2017;38(2):144–151. | ||
Peregrín-Alvarez JM, Sanford C, Parkinson J. The conservation and evolutionary modularity of metabolism. Genome Biol. 2009;10(6):R63. | ||
Strickaert A, Saiselet M, Dom G, et al. Cancer heterogeneity is not compatible with one unique cancer cell metabolic map. Oncogene. 2017;36:2637–2642. | ||
Dubuis S, Baenke F, Scherbichler N, Alexander LT, Schulze A, Zamboni N. Metabotypes of breast cancer cell lines revealed by non-targeted metabolomics. Metab Eng. 2017;43:173–186. | ||
Harris K, Khachaturova I, Azab B, et al. Small cell lung cancer doubling time and its effect on clinical presentation: a concise review. Clin Med Insights Oncol. 2012;6:199–203. | ||
Madhu B, Narita M, Jauhiainen A, et al. Metabolomic changes during cellular transformation monitored by metabolite-metabolite correlation analysis and correlated with gene expression. Metabolomics. 2015;11(6):1848–1863. | ||
Hu C, Shi J, Quan S, et al. Metabolic variation between japonica and indica rice cultivars as revealed by non-targeted metabolomics. Sci Rep. 2014;4:5067. | ||
Lin L, Cao B, Xu Z, et al. In vivo HMRS and lipidomic profiling reveals comprehensive changes of hippocampal metabolism during aging in mice. Biochem Biophys Res Commun. 2016;470(1):9–14. | ||
Spinelli JB, Yoon H, Ringel AE, Jeanfavre S, Clish CB, Haigis MC. Metabolic recycling of ammonia via glutamate dehydrogenase supports breast cancer biomass. Science. 2017;358(6365):941–946. | ||
Caldwell RW, Rodriguez PC, Toque HA, Narayanan SP, Caldwell RB. Arginase: a multifaceted enzyme important in health and disease. Physiol Rev. 2018;98(2):641–665. | ||
Fultang L, Vardon A, De Santo C, Mussai F. Molecular basis and current strategies of therapeutic arginine depletion for cancer. Int J Cancer. 2016;139(3):501–509. | ||
Çeliktas M, Tanaka I, Tripathi SC, et al. Role of CPS1 in cell growth, metabolism and prognosis in LKB1-inactivated lung adenocarcinoma. J Natl Cancer Inst. 2017;109(3):1–9. | ||
Lee YY, Li CF, Lin CY, et al. Overexpression of CPS1 is an independent negative prognosticator in rectal cancers receiving concurrent chemoradiotherapy. Tumour Biol. 2014;35(11):11097–11105. | ||
Schlaepfer IR, Rider L, Rodrigues LU, et al. Lipid catabolism via CPTI as a therapeutic target for prostate cancer. Mol Cancer Ther. 2014; 13(10):2361–2371. | ||
Wu X, Daniels G, Lee P, Monaco ME. Lipid metabolism in prostate cancer. Am J Clin Exp Urol. 2014;2(2):111–120. | ||
Singh KB, Kim SH, Hahm ER, Pore SK, Jacobs BL, Singh SV. Prostate cancer chemoprevention by sulforaphane in a preclinical mouse model is associated with inhibition of fatty acid metabolism. Carcinogenesis. 2018;39(6):826–837. | ||
Roy D, Mondal S, Wang C, et al. Loss of HSulf-1 promotes altered lipid metabolism in ovarian cancer. Cancer Metab. 2014;2:13. | ||
Cirillo A, Di Salle A, Petillo O, et al. High grade glioblastoma is associated with aberrant expression of ZFP57, a protein involved in gene imprinting, and of CPTIA and CPTIC that regulate fatty acid metabolism. Cancer Biol Ther. 2014;15(6):735–741. | ||
Shi J, Fu H, Jia Z, He K, Fu L, Wang W. High expression of CPT1A predicts adverse outcomes: a potential therapeutic target for acute myeloid leukemia. EBio Medicine. 2016;14:55–64. | ||
Lane AN, Fan TW. Regulation of mammalian nucleotide metabolism and biosynthesis. Nucleic Acids Res. 2015;43(4):2466–2485. | ||
Wikoff WR, Grapov D, Fahrmann JF, et al. Metabolomic markers of altered nucleotide metabolism in early stage adenocarcinoma. Cancer Prev Res. 2015;8(5):410–418. | ||
Zhou J, Liu R, Wang Y, et al. miR-199a-5p regulates the expression of metastasis-associated genes in B16F10 melanoma cells. Int J Clin Exp Pathol. 2014;7(10):7182–7190. | ||
Kowalewska M, Danska-Bidzinska A, Bakula-Zalewska E, Bidzinski M. Identification of suitable reference genes for gene expression measurement in uterine sarcoma and carcinosarcoma tumors. Clin Biochem. 2012;45(4–5):368–371. |
Supplementary materials
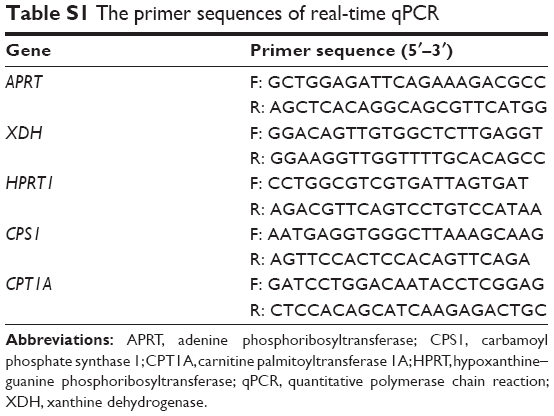 | Table S1 The primer sequences of real-time qPCR |
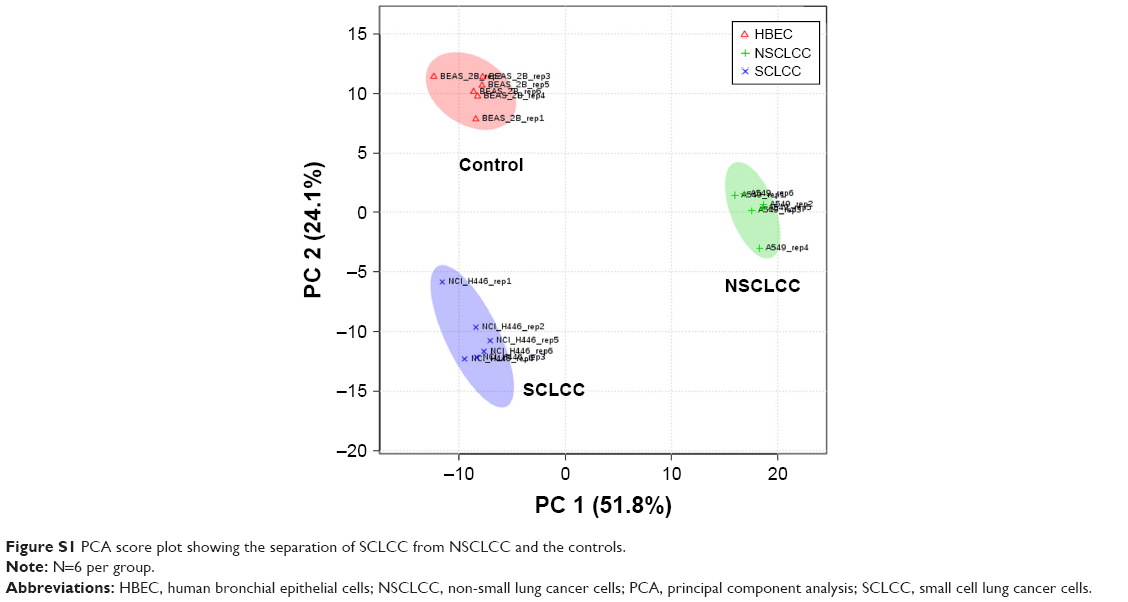 | Figure S1 PCA score plot showing the separation of SCLCC from NSCLCC and the controls. |
 © 2018 The Author(s). This work is published and licensed by Dove Medical Press Limited. The
full terms of this license are available at https://www.dovepress.com/terms
and incorporate the Creative Commons Attribution
- Non Commercial (unported, 3.0) License.
By accessing the work you hereby accept the Terms. Non-commercial uses of the work are permitted
without any further permission from Dove Medical Press Limited, provided the work is properly
attributed. For permission for commercial use of this work, please see paragraphs 4.2 and 5 of our Terms.
© 2018 The Author(s). This work is published and licensed by Dove Medical Press Limited. The
full terms of this license are available at https://www.dovepress.com/terms
and incorporate the Creative Commons Attribution
- Non Commercial (unported, 3.0) License.
By accessing the work you hereby accept the Terms. Non-commercial uses of the work are permitted
without any further permission from Dove Medical Press Limited, provided the work is properly
attributed. For permission for commercial use of this work, please see paragraphs 4.2 and 5 of our Terms.