Back to Journals » Journal of Inflammation Research » Volume 19
Integrated Multi-Omics Profiling Identifies CD84-Associated Microglial Alterations in Focal Cortical Dysplasia Type II
Authors Fang Y ![]() , Yang S, Lei L, Li Y
, Yang S, Lei L, Li Y ![]() , Zhang Y, Huang T, Zhou L
, Zhang Y, Huang T, Zhou L
Received 17 September 2025
Accepted for publication 16 December 2025
Published 8 January 2026 Volume 2026:19 566227
DOI https://doi.org/10.2147/JIR.S566227
Checked for plagiarism Yes
Review by Single anonymous peer review
Peer reviewer comments 2
Editor who approved publication: Professor Ning Quan
Yubao Fang,* Shengyu Yang,* Lei Lei,* Yinchao Li, Yaqian Zhang, Tiancai Huang, Liemin Zhou
Department of Neurology, The Seventh Affiliated Hospital of Sun Yat-Sen University, Shenzhen, Guangdong, People’s Republic of China
*These authors contributed equally to this work
Correspondence: Liemin Zhou, Email [email protected]
Background: Focal cortical dysplasia type II (FCDII) is a major cause of drug-resistant epilepsy in children, yet its molecular pathogenesis remains poorly characterized. Accumulating evidence has underscored the critical role of persistent neuroinflammatory activity in the pathogenesis of focal cortical dysplasia.
Methods: We employed an integrated multi-omics approach to dissect the molecular pathology of FCDII. This included data-independent acquisition mass spectrometry (DIA-MS) proteomics and re-analysis of public transcriptomic datasets. Differential expression analysis, protein-protein interaction (PPI) network construction, and hub gene identification were performed. Key findings were validated using quantitative real-time PCR (qPCR) and further investigated through analysis of single-cell RNA sequencing (scRNA-seq) data to resolve cellular heterogeneity and cell-cell communication.
Results: Proteomic profiling of FCDII tissue identified 460 differentially expressed proteins (DEPs) enriched in cortical development, cytoskeletal organization, and immune–inflammatory signaling. Protein–protein interaction (PPI) network analysis further prioritized several hub molecules, among which the pro-inflammatory glycoprotein CD84 exhibited consistent upregulation across both proteomic and transcriptomic datasets. Single-cell analysis revealed that CD84 expression was preferentially localized to a microglial subpopulation characterized exhibiting elevated inflammation-related signatures, with particularly prominent enrichment in FCDIIB samples. CD84-positive microglia also demonstrated increased predicted interactions with astrocytes, neurons, and endothelial cells through signaling pathways involving colony-stimulating factor (CSF), CX3C motif chemokine, macrophage migration inhibitory factor (MIF), and somatostatin-related signaling.
Conclusion: Our multi-omics approaches suggest a potential role for CD84 in influencing microglial inflammatory states and in shaping their predicted interactions with astrocytes, neurons, and endothelial cells in FCDII. These findings offer preliminary molecular clues that may inform future mechanistic investigations of microglial alterations in this disorder.
Keywords: focal cortical dysplasia type II, multi-omics integration, neuroinflammation, CD84, microglial activation
Introduction
Epilepsy is a chronic neurological disease characterized by abnormal synchronized neuronal discharges in the brain.1 As a major cause of drug-resistant epilepsy, focal cortical dysplasia (FCD) represents the most common etiology in children and ranks among the top causes in adults.2,3 As a subtype of malformations of cortical development (MCD),4 FCD is classified into five distinct categories under the latest International League Against Epilepsy (ILAE) framework, with type II FCD being the most prevalent subtype, accounting for 45.3% of cases.5,6 FCD II is histopathologically defined by cortical dyslamination, dysmorphic neurons (DNs), reduced white matter myelination, and blurred gray-white matter boundaries,7 while FCD IIB is distinguished from IIA by the pathognomonic presence of balloon cells (BCs) and disorganized oligodendroglial clusters.8
The epileptogenic mechanism of FCD II remains intricate and unclarified. Increasing data also indicate a prominent neuroinflammatory component, with upregulation of the high mobility group box 1- toll like receptor 4 (HMGB1-TLR4) signaling pathway,9 and localization of nuclear factor-κB (NF-κB), interleukin-2 (IL-2), and IL-2 receptors to DNs.10,11 In human neocortical tissue derived from epilepsy surgery, FCD II lesions have been shown to exhibit microglial activation, accompanied by classical complement pathway.12
CD84, a member of the signaling lymphocyte activation molecule (SLAM) family, is an immunoregulatory glycoprotein expressed predominantly in immune cells.13 Dysregulation of CD84 has been reported in several neurological conditions, including Parkinson’s disease, acute stroke, and spinal cord injury.14–16 Nevertheless, its relevance in epilepsy or FCD has not been systematically explored. Moreover, despite recent multi-omics studies providing important genomic and transcriptomic insights into FCD subtypes,17,18 the cross-layer integration of proteomic alterations with single-cell–resolved immune signatures remains limited.
To address these gaps, we integrated data-independent acquisition mass spectrometry (DIA-MS) proteomics, bulk RNA-seq (GSE128300), and single-cell RNA sequencing (scRNA-seq) datasets (GSE268807) to construct a multi-omic framework of FCD II. Through differential protein analysis, PPI network prioritization, and cross-omics validation, we identified CD84 as a candidate molecule of interest and investigated its cellular context, microglial enrichment, and associated signaling pathways at single-cell resolution.
Materials and Methods
Clinical Samples and Data Sources
To ensure robust cross-platform validation, this study integrated data from three independent cohorts.
Proteomic Cohort (In-House)
The clinical profiles of the study cohort are illustrated in Table 1. The samples were obtained from the Department of Neurology, The Seventh Affiliated Hospital of Sun Yat-sen University. A total of 12 cortical tissue samples were analyzed, including 6 patients with FCD II (4 FCD IIA and 2 FCD IIB) and 6 non-dysplastic control samples. According to the ILAE 2011 classification, the FCD II cohort consisted of 4 FCD IIA cases (F4, F5, F8, F10) and 2 FCD IIB cases (F1, F13). These patients had undergone thorough pre-surgical evaluations, in which the resection sites were determined based on magnetic resonance imaging (MRI), video electroencephalography (vEEG), and fluoro-2-deoxyglucose positron emission tomography (FDG-PET). The resected tissues were ultimately confirmed as FCD II through histopathological examinations by neuropathologists (Figure 1A). Control tissues (n = 6) were collected from surgery resections and consisted of perilesional but non-dysplastic cortex from patients with glioma (C1), encephalomalacia (C3), arteriovenous malformation (C4), and non-dysplastic temporal neocortex from temporal lobe epilepsy resections (C5–C7). No dysplastic features were found in these samples (Figure 1B). Tissue collection followed standard neurosurgical procedures and was conducted in accordance with institutional ethical guidelines. Written informed consent was obtained from all patients or their legal guardians prior to sample acquisition.
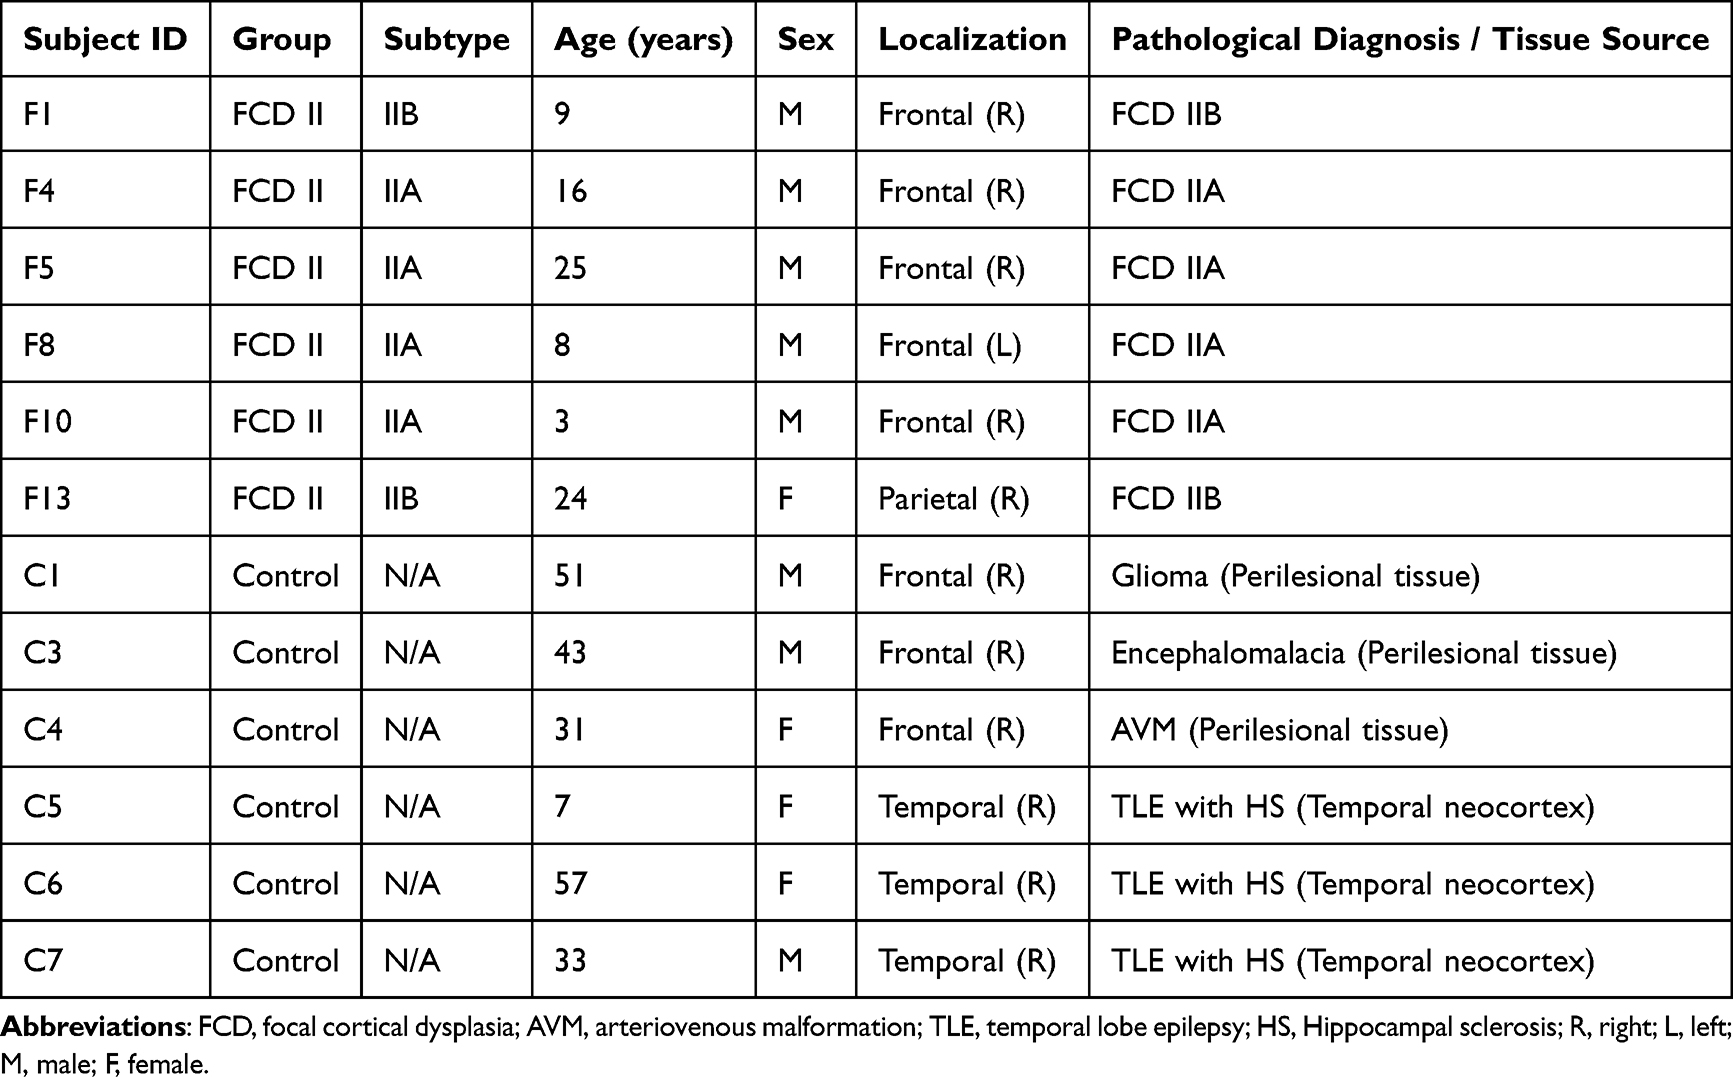 |
Table 1 Cohort Characteristics and Tissue Validation |
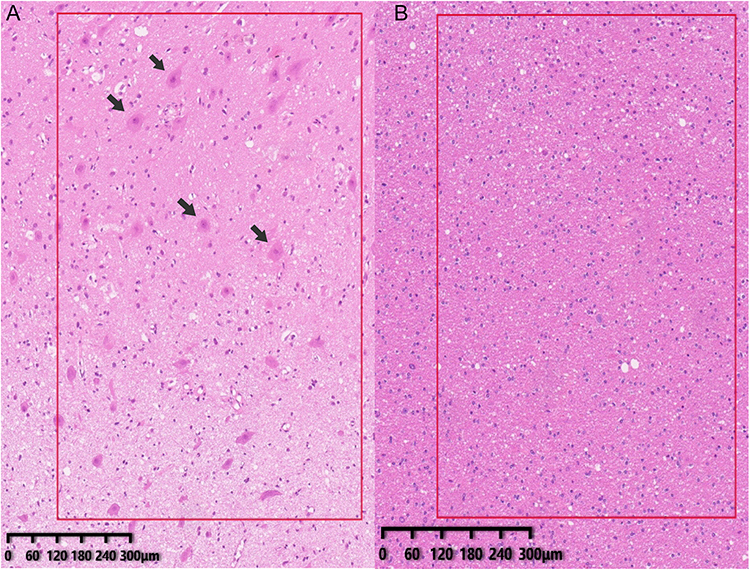 |
Figure 1 Tissue validation of clinical samples. (A) Representative histopathological features of focal cortical dysplasia type II (FCD II) shown by hematoxylin and eosin (H&E) staining, including cortical laminar disorganization and dysmorphic neurons (DNs; arrowheads). (B) Histologically normal cortex from control (CTRL) tissues (H&E staining), demonstrating preserved cortical architecture. |
Bulk Transcriptomic Cohort (GSE128300)
Validation was performed using the GSE128300 dataset, comprising 19 samples: 11 FCD type II (6 FCD IIA and 5 FCD IIB) and 8 controls (CTRL).19
Single-Cell RNA Cohort (GSE268807)
To resolve cellular heterogeneity, raw data were obtained from the GSE268807 dataset. This cohort included 11 samples: 9 FCD type II (3 FCD IIA and 6 FCD IIB) and 2 controls (histologically normal cortex).20
Data-Independent Acquisition (DIA) Mode Mass Spectrometry Analysis
For proteomic analysis, 50–100 mg of cortical tissue was used for each sample. Individual samples were cryogenically pulverized in liquid nitrogen and homogenized in sodium dodecyl sulfate–dithiothreitol (SDT) buffer, supplemented with 100 mM sodium chloride (NaCl) and 1% (v/v) dithiothreitol (DTT). The lysates were sonicated for 5 minutes on ice and subsequently denatured at 95°C for 8–15 minutes, followed by rapid cooling in an ice bath for 2 minutes. After centrifugation at 12,000 ×g for 15 minutes at 4°C, the supernatant was incubated with iodoacetamide (IAM) under dark conditions at room temperature for 1 hour to alkylate cysteine residues.
Proteins were precipitated by adding a four-fold volume of prechilled acetone, vortexing thoroughly, and incubating the mixture at –20°C for at least 2 hours. The precipitated proteins were collected by centrifugation (12,000 ×g, 15 minutes, 4°C), washed once with 1 mL of ice-cold acetone, and resolubilized in dissolution buffer (DB buffer).
Protein aliquots (100 μL in DB buffer consisting of 8 M urea and 100 mM triethylammonium bicarbonate [TEAB], pH 8.5) were diluted to a final volume of 100 μL. Proteins were digested with trypsin for 4 hours at 37°C, followed by a second addition of trypsin supplemented with calcium chloride (CaCl2) for overnight digestion. The resulting peptide mixture was acidified with formic acid to pH < 3, centrifuged (12,000 ×g, 5 minutes, room temperature), and the clarified supernatant was loaded onto a C18 reversed-phase desalting cartridge. Sequential washes were performed with 0.1% formic acid / 3% acetonitrile, followed by elution with 0.1% formic acid / 70% acetonitrile. Eluted peptides were lyophilized for downstream analysis.
Chromatographic separation was conducted on a Vanquish Neo ultra-high-performance liquid chromatography (UHPLC) system (Thermo Fisher Scientific) equipped with a C18 pre-column (5 mm × 300 μm, 5 μm) maintained at 50°C and an analytical column (PepMap™ Neo C18, 150 μm × 15 cm, 2 μm). Mass spectrometric acquisition was performed on a Thermo Orbitrap Astral mass spectrometer fitted with an Easy-Spray ion source, operated at a spray voltage of 1.9 kV and an ion transfer tube temperature of 290°C. Full-scan mass spectrometry (MS1) spectra were acquired from m/z 380–980 at a resolution of 240,000 (at m/z 200) with an automatic gain control (AGC) target of 500%.
300 variable isolation windows (2 Thomson [Th] width) were applied. MS2 spectra were acquired at a resolution of 80,000 over m/z 150–2000, using a normalized collision energy (NCE) of 25% and a 3 ms maximum injection time.
Raw data files were processed using the Data-Independent Acquisition Neural Network (DIA-NN) software for spectral library searching and quantification.
Statistics and Pathway/Network Analysis
Differentially expressed proteins (DEPs) were defined as those with a p-value < 0.05 and fold change (FC) > 1.2 or < 0.83, as determined by the Student’s t-test or the Mann–Whitney U-test for normally and non-normally distributed data, respectively. Functional enrichment analysis for Gene Ontology (GO) terms and Kyoto Encyclopedia of Genes and Genomes (KEGG) pathways was conducted using InterProScan through gene set enrichment analysis (GSEA). Significance thresholds were set as an absolute normalized enrichment score (NES) > 1, p-value < 0.05, and false discovery rate (FDR) < 0.25.21
Protein-protein interaction (PPI) networks were constructed using the STRING database22 and visualized with Cytoscape (v3.10.2). Using the molecular complex detection (MCODE) plugin with default parameters (degree cutoff = 2, node score cutoff = 0.2, k-core = 2, max depth = 100), key modules were identified from the PPI network, from which the top three modules meeting the criteria of an MCODE score > 5.5 and containing more than 5 nodes were selected for further analysis.23 KEGG pathway enrichment for these modules was assessed using the DAVID online tool (v6.8, https://david.ncifcrf.gov), with pathways considered significantly enriched at p-value < 0.05.24 All visualizations were generated using the ggplot2 package in R (v6.6.2) based on p-values.
Additionally, key hub proteins were predicted by evaluating clustering coefficients using the cytoHubba plugin in Cytoscape.25
Bioinformatics Analysis of Public Datasets
The expression data and clinical information were obtained from the GSE128300 and GSE268807 dataset in Gene Expression Omnibus (GEO) (http://www.ncbi.nlm.nih.gov/geo/).
For GSE128300, GEO2R was used to screen for differentially expressed genes (DEGs) between FCD II and control groups. DEGs were defined by an adjusted p-value < 0.05 combined with FC threshold of >1.2 or <0.83.26 KEGG pathway enrichment analysis was performed using the DAVID bioinformatics platform (version 6.8; https://davidbioinformatics.nih.gov/). Results were visualized with the ggplot2 package in R (v6.6.2), based on calculated P-values. A significance threshold of P-values < 0.05 was applied for identifying enriched pathways.24
Raw snRNA-seq data from GSE268807 (FCD IIA, n = 3; FCD IIB, n = 6; Control, n = 2) were analyzed using R.27 Seurat package was used to handle the single nuclei data objects. Cell type identification was performed using known cell type markers expressed in the human brain. “FindMarkers” function of Seurat was used to analyze the DEGs between the FCD II and Control groups (avg_log2 FC > 0.26, P < 0.05, test.use = “Wilcox”).28 Tissue preference for each cluster, quantified using the ratio of observed to expected cell numbers (Ro/e), was analyzed in R utilizing the STARTRAC toolkit.29 We re-analyzed bulk RNA sequencing data from the GSE128300 dataset using CIBERSORTx (https://cibersortx.stanford.edu/) to estimate the relative proportions of major cortical cell populations. Cellchat was utilized to analyze intercellular communication.30
GSEA was performed using the web-based platform WebGestalt 2024 (https://www.webgestalt.org/).31 The absolute NES value > 1, P<0.05 and FDR <0.25 were considered significant differences.
Real-Time Quantitative PCR
Total RNA was isolated from 20 mg of cortical tissue from FCD II patients and control cases (n = 3 per group) using a commercial RNA extraction kit (#9767, TaKaRa). RNA concentration and purity were assessed spectrophotometrically, and 1 μg of total RNA was reverse-transcribed into complementary DNA (cDNA) using the PrimeScript™ RT reagent kit (#RR047A, TaKaRa), following the manufacturer’s instructions.Quantitative PCR (qPCR) was performed using SYBR® Premix Ex Taq™ II (#RR420A, TaKaRa) with cDNA templates and gene-specific primers listed in Table 2. The thermal cycling protocol consisted of an initial denaturation at 95°C for 30s, followed by 40 cycles of denaturation at 95°C for 5s and annealing/extension at 60°C for 30s. Given that β-actin expression showed no significant variation across samples in studies of cortical dysplasia, cycle threshold (Ct) values were determined, and relative gene expression levels were calculated using the 2^−ΔΔCt method, with normalization to β-actin as the internal control.32
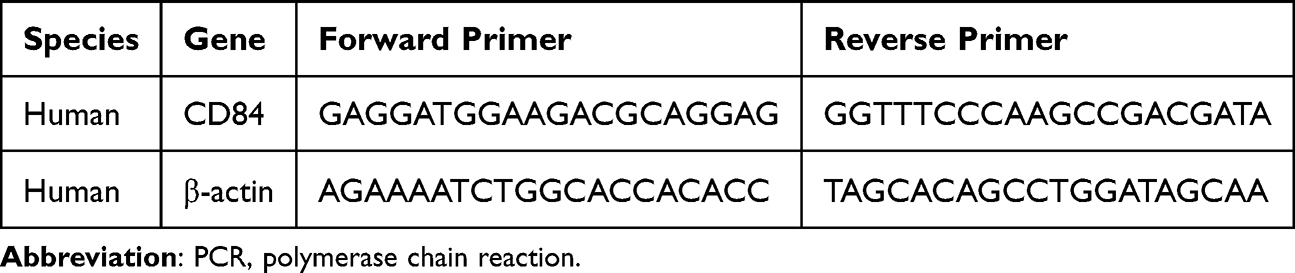 |
Table 2 The Primers for the Real-Time Quantitative PCR (RT-qPCR) Analysis |
A complete list of all abbreviations used in this study is provided in Supplementary_Data1.
Results
DEPs Screening and Subcellular Location
Comparative proteomic analysis of cortical tissues from FCD II patients (n=6) and CTRL subjects (n=6) revealed the intergroup divergence, as evidenced by principal component analysis (PCA; Figure 2A). Differential expression profiling identified 371 upregulated and 89 downregulated proteins (FC >1.2, p<0.05) in FCD II compared to CTRL, with the distribution of these DEPs visualized in a volcano plot (Figure 2B). Subcellular localization profiling demonstrated that nuclear proteins constituted the largest proportion of DEPs (26.25%), followed by cytoplasmic (20.62%), plasma membrane-associated (14.06%), and extracellular proteins (8.44%) (Figure 2C).
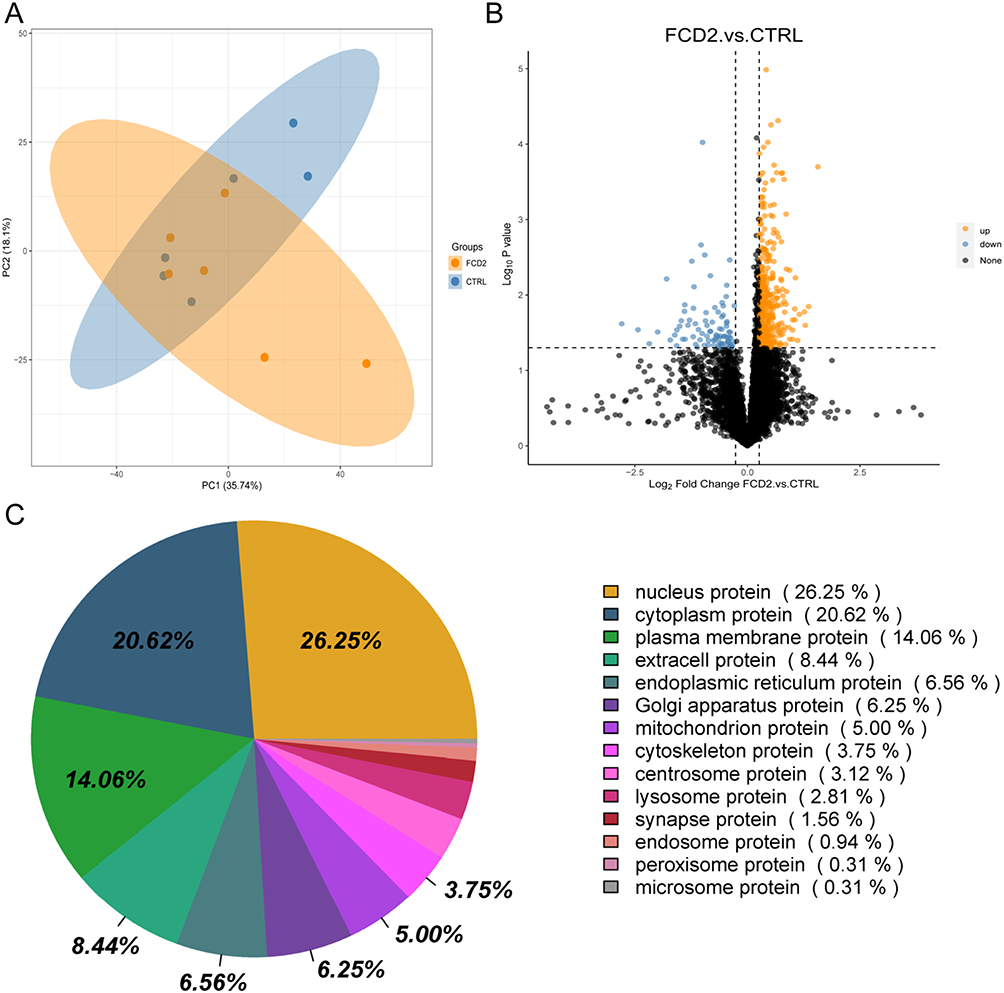 |
Figure 2 Proteomic signatures of FCD II cortical tissues. (A) Principal component analysis (PCA) plot of proteomes from FCD II (n = 6) and CTRL (n = 6) samples. (B) Volcano plot showing 371 upregulated (yellow; fold change [FC] > 1.2, p < 0.05) and 89 downregulated (blue; FC < 0.83, p < 0.05) proteins in FCD II versus CTRL. Black dots indicate non-significant proteins. (C) Subcellular localization of differentially expressed proteins (DEPs). |
Functional Enrichment Analysis of DEPs
GSEA of DEPs-associated GO and KEGG gene sets revealed significant pathway dysregulation (Figure 3).
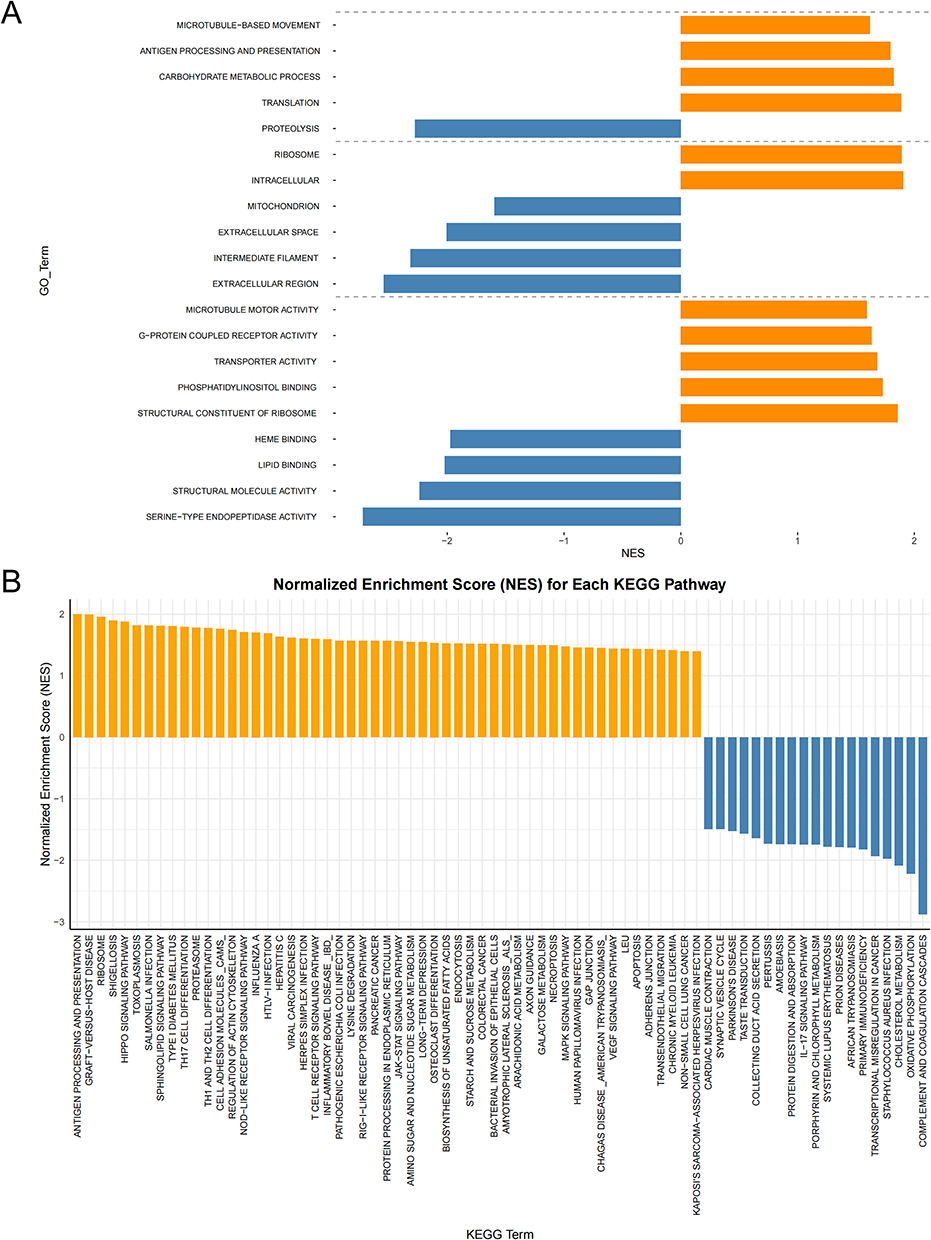 |
Figure 3 GSEA of DEPs-Associated GO and KEGG Gene Sets. (A) GSEA of biological processes (BP), cellular components (CC), and molecular functions (MF), showing the top 20 significantly enriched GO terms. (B) KEGG enrichment of DEP-associated pathways. Yellow bars denote normalized enrichment score (NES) > 1; blue bars denote NES < −1. Thresholds: |NES| > 1, p < 0.05, false discovery rate (FDR) q < 0.25. |
GO analysis of DEPs revealed broad functional dysregulation across biological processes, cellular components, and molecular functions. Biological processes (BP) exhibited upregulation of microtubule-based movement, antigen processing and presentation, carbohydrate metabolic process, and translation, while proteolysis was significantly downregulated. Cellular components (CC) showed enrichment of intracellular and ribosome localization, contrasting with depletion of extracellular region, intermediate filament, extracellular space, and mitochondrion. Molecular functions (MF) were dominated by upregulated activities, including structural constituent of ribosome, phosphatidylinositol binding, transporter activity, G-protein coupled receptor activity, and microtubule motor activity. Conversely, serine-type endopeptidase activity, structural molecule activity, lipid binding, and heme binding were markedly suppressed. These findings highlight compartment-specific molecular disturbances in FCD II pathogenesis.
KEGG pathway analysis revealed significant enrichment of pathways converging on cortical development (eg, Hippo, MAPK, RAS, VEGF),33–36 cytoskeletal/synaptic dysfunction (Actin Cytoskeleton, Axon Guidance, CAMs), and neuroinflammatory cascades (NOD-like receptor, JAK-STAT)37,38 in FCD II. Proteasome dysregulation and apoptosis pathways further indicated proteolytic stress and homeostatic failure, and ribosome upregulation reflected anabolic hyperactivity.
Modular and Hub Protein Analysis of the PPI Network
The PPI network, derived from DEPs, encompassed 443 nodes and 4503 interaction pairs (Supplementary_Data2). Utilizing the MCODE plugin within Cytoscape, three distinct sub-network modules were identified and isolated from the PPI network (Figure 4). Module A, with a score of 18, comprised 36 nodes and 324 interaction pair. Module B, scoring 12, included 17 nodes and 93 interaction pairs. Module C, with a score of 10, contained 39 nodes and 188 interaction pairs.
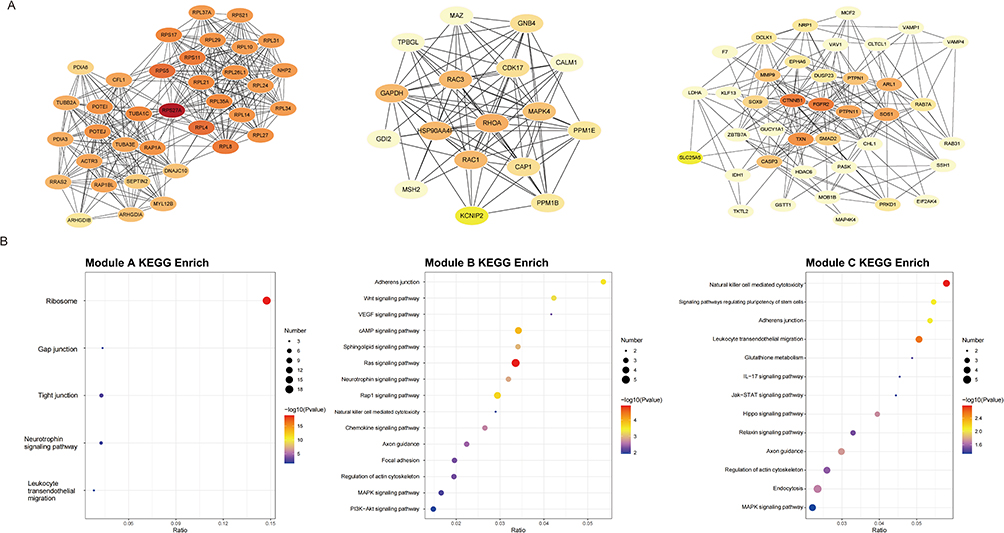 |
Figure 4 Modular analysis of the protein–protein interaction (PPI) network. (A) Three key sub-network modules identified by MCODE. (B) KEGG pathway enrichment results for each module, with top-ranked pathways (P<0.05). |
Furthermore, proteins within these modules underwent KEGG enrichment analysis, and significant pathways were highlighted for each module. Proteins in Module A were notably implicated in pathways related to the ribosome, gap junctions, and tight junctions. In contrast, Proteins in Module B were significantly linked to the Ras, Wnt, VEGF and cAMP signaling pathway. Proteins in Module C were associated with pathways related to natural killer cell mediated cytotoxicity, leukocyte transendothelial migration and regulate the pluripotency of stem cells.
PPI network analysis using Cytoscape’s CytoHubba plugin prioritized 10 hub proteins based on degree clustering coefficient (Figure 5). DFFA, AIF1, ARHGAP22, SFXN5, SYPL1, HERPUD2, TESMIN, SHTN1, and CD84 were upregulated in proteomic profiling. These proteins exhibited the highest degree of clustering coefficient within the PPI network, suggesting their potential regulatory roles in FCD II-associated molecular networks.
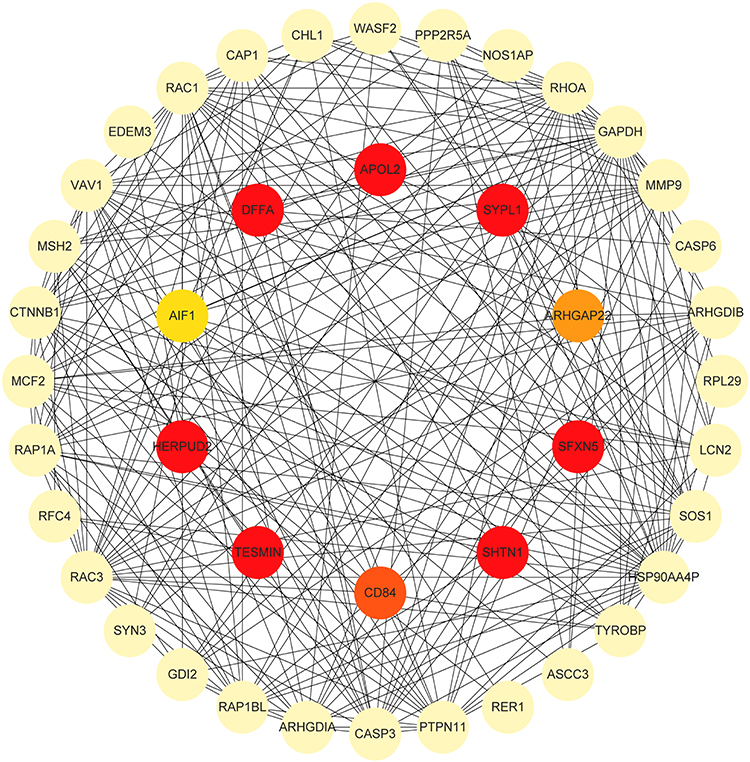 |
Figure 5 Hub Protein Identification in the PPI Network. Top 10 hub proteins prioritized by CytoHubba. |
Integrated Analysis of Proteomics and Bulk Transcriptomics
In this study, differential gene expression analysis of the GSE128300 dataset was performed using GEO2R to compare cortical tissues from FCD II patients and controls, with DEGs defined by stringent thresholds (p < 0.05, FC>1.2 or FC<0.83). This analysis identified 93 upregulated and 252 downregulated DEGs (Figure 6A). Subsequent KEGG pathway enrichment analysis via DAVID revealed significant dysregulation in key pathways, including the Mitogen-activated protein kinase (MAPK) signaling pathway, cytokine-cytokine receptor interaction, spliceosome and transforming growth factor beta (TGF-β) signaling pathway (Figure 6B). Through integration of transcriptomic and proteomic datasets, CD84—a hub protein prioritized via CytoHubba analysis within the protein-protein interaction network—demonstrated consistent upregulation across both datasets (Figure 6C). Subsequent qPCR validation confirmed significant upregulation of CD84 in FCD II tissues (Figure 6D).
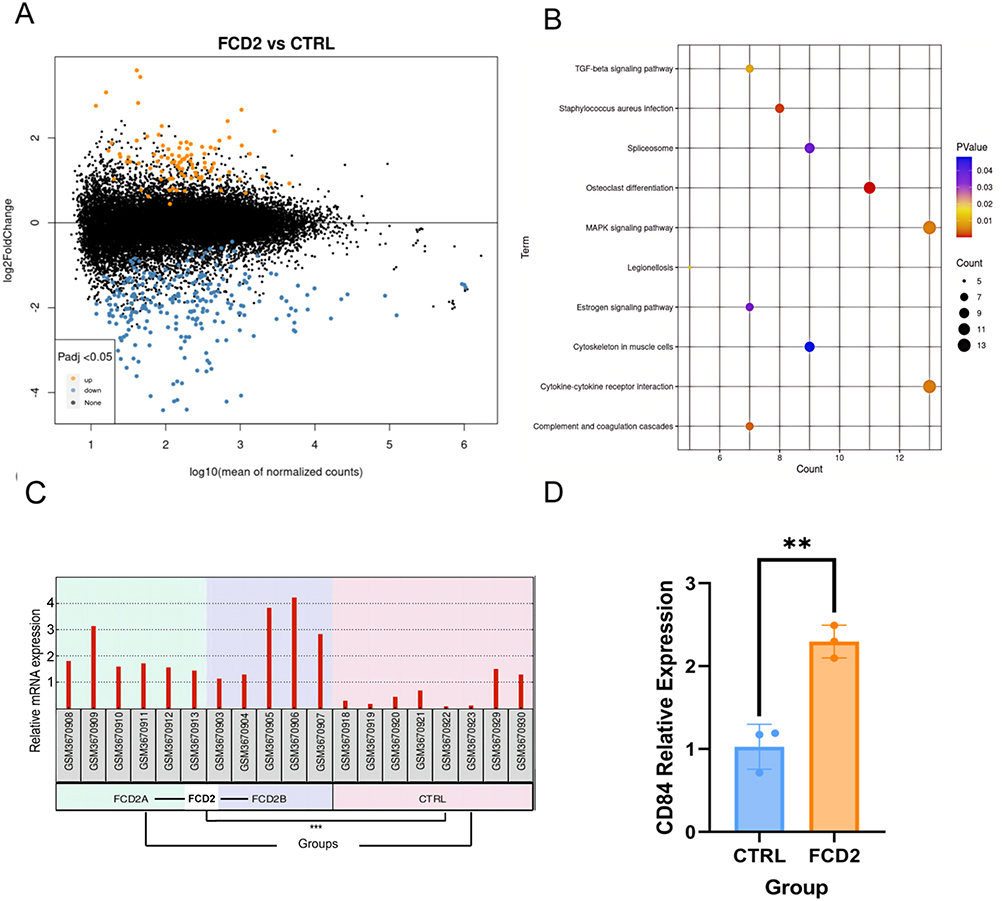 |
Figure 6 Integrated analysis of differentially expressed genes (DEGs) and DEPs. (A) Volcano plot showing 93 upregulated (yellow; FC > 1.2, p < 0.05) and 252 downregulated (blue; FC < 0.83, p < 0.05) DEGs in FCD II versus CTRL. Black dots denote non-significant genes. (B) KEGG enrichment analysis of DEGs (P<0.05). (C) CD84 Expression in the GSE128300 Dataset (***P < 0.001). (D) The mRNA expression of CD84 in brain tissue samples (**P < 0.01). |
Integrated Single-Cell and Bulk Transcriptomic Analyses of Microglia-1
ScRNA-seq data from the GSE268807 dataset were processed using the Seurat package in R. After rigorous quality control and normalization, single-cell objects from FCD II and control cohorts were integrated via canonical correlation analysis (CCA), followed by dimensionality reduction and clustering into 17 transcriptionally distinct clusters (Figure 7A).
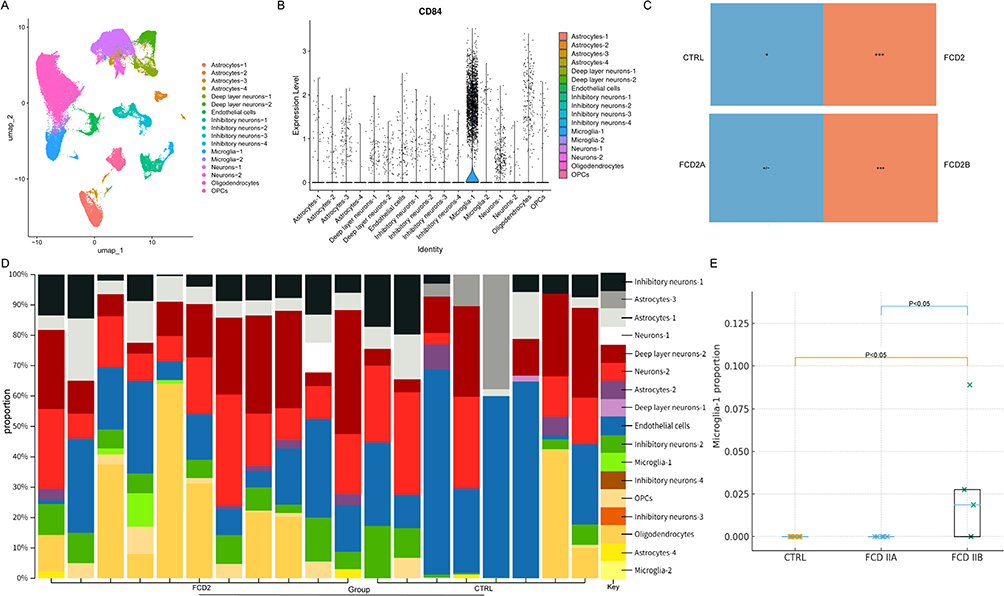 |
Figure 7 Visualization of CD84 expression and cell-type composition across single-cell RNA sequencing (scRNA-seq) and bulk datasets. (A) Uniform manifold approximation and projection (UMAP) projection of integrated scRNA-seq data (GSE268807). (B) Violin plot of CD84 expression across 17 clusters. (C) Microglia-1 Tissue Preference (ratio of observed to expected cells, Ro/e > 1, +++). (D) CIBERSORT-Inferred Cell-Type Composition in GSE128300 Dataset. (E) Statistical Comparison of CIBERSORT-Inferred Microglia-1 Proportions (FCD IIB vs CTRL, p < 0.05; FCD IIB vs IIA, p < 0.05). |
Notably, CD84 exhibited specific expression within the microglial subset Microglia-1 (Figure 7B). The Ro/e analysis indicated that Microglia-1 was enriched in FCD II tissue, whereas only minimal enrichment was detected in control samples. Subtype comparison further showed that FCD2B exhibited a higher Ro/e value than FCD2A (Figure 7C).
To confirm our analysis results, we re-analyzed the bulk RNA sequencing data from the GSE128300 dataset using CIBERSORTx,39 based on signature matrices derived from the scRNA-seq data GSE268807 (Figure 7D). Stratification by subtype revealed a distinct pattern of cellular heterogeneity consistent with the scRNA-seq observations. While the FCD IIA subtype showed Microglia-1 proportions comparable to controls (undetectable/low levels), the FCD IIB subtype exhibited a significant expansion of this population (Figure 7E; FCD IIB vs CTRL, p < 0.05; FCD IIB vs IIA, p < 0.05).
Subsequently, we performed differential expression analysis and KEGG enrichment analysis on CD84-positive microglia (Microglia-1) and CD84-negative microglia (Microglia-2). The results demonstrated that CD84-positive microglia exhibited significant upregulation in key signaling pathways such as phosphatidylinositol 3-kinase (PI3K)/Akt, MAPK (Figure 8A).
 |
Figure 8 Transcriptomic Analyses of CD84-Defined Microglial Subsets. (A) KEGG enrichment analysis of upregulated genes in Microglia-1 (CD84⁺) versus Microglia-2 (CD84−). (B) Differential expression of CD84 in Microglia-1 between FCD II and control samples. (avg_log2 FC > 0.26, ***p <0.001). (C–E) Gene set enrichment analysis (GSEA) of oxidative phosphorylation (C), ribosome (D), and metabolic pathways (E). |
Differential expression analysis, employing the Wilcoxon rank-sum test with Bonferroni correction, confirmed that CD84 was significantly upregulated in the Microglia-1 subcluster derived from FCD II tissues compared to those from controls (Figure 8B). To further characterize these cells, we examined pathway-level differences within the Microglia-1 subset. GSEA of DEGs within Microglia-1 revealed significant activation of specific pathways. Notably, the oxidative phosphorylation (Figure 8C), ribosome (Figure 8D), and general metabolic pathways (Figure 8E) were markedly upregulated in FCD II-derived Microglia-1 cells.
Cell-Cell Communication Networks in Microglia-1
To systematically map intercellular communication dynamics, we applied CellChat to scRNA-seq data, comparing interaction networks of Microglia-1 in FCD II versus controls. As a ligand source, Microglia-1 in FCD II exhibited significantly enhanced outgoing signals to Microglia-2 and Astrocyte-4 (Figure 9A and B). Conversely, when acting as a signaling receiver, Microglia-1 displayed heightened responsiveness to microenvironmental cues from Astrocyte-4, Astrocyte-1, Deep layer neurons 1/2, Endothelial cells and Inhibitory neuron-3 in FCD II (Figure 9C and D).
 |
Figure 9 Analysis of the interaction strength and number of interactions among different cell types in the FCD II samples and control samples (red: upregulated; blue: downregulated). (A) The change of interaction strength of interactions from Microglia-1 (as ligand sources). (B) The change of number of interactions from Microglia-1 (as ligand sources). (C) The change of interaction strength of interactions from Microglia-1 (as receptor targets). (D) The change of number of interactions from Microglia-1 (as receptor targets). |
We identified distinct cell-cell communication signatures mediated by Microglia-1 in FCD II compared to controls. In FCD II tissues, Microglia-1 exhibited upregulated Colony-stimulating factor (CSF) and CX3C motif chemokine signaling, alongside two novel disease-specific pathways: macrophage migration inhibitory factor (MIF) and Somatostatin (Figure 10A).
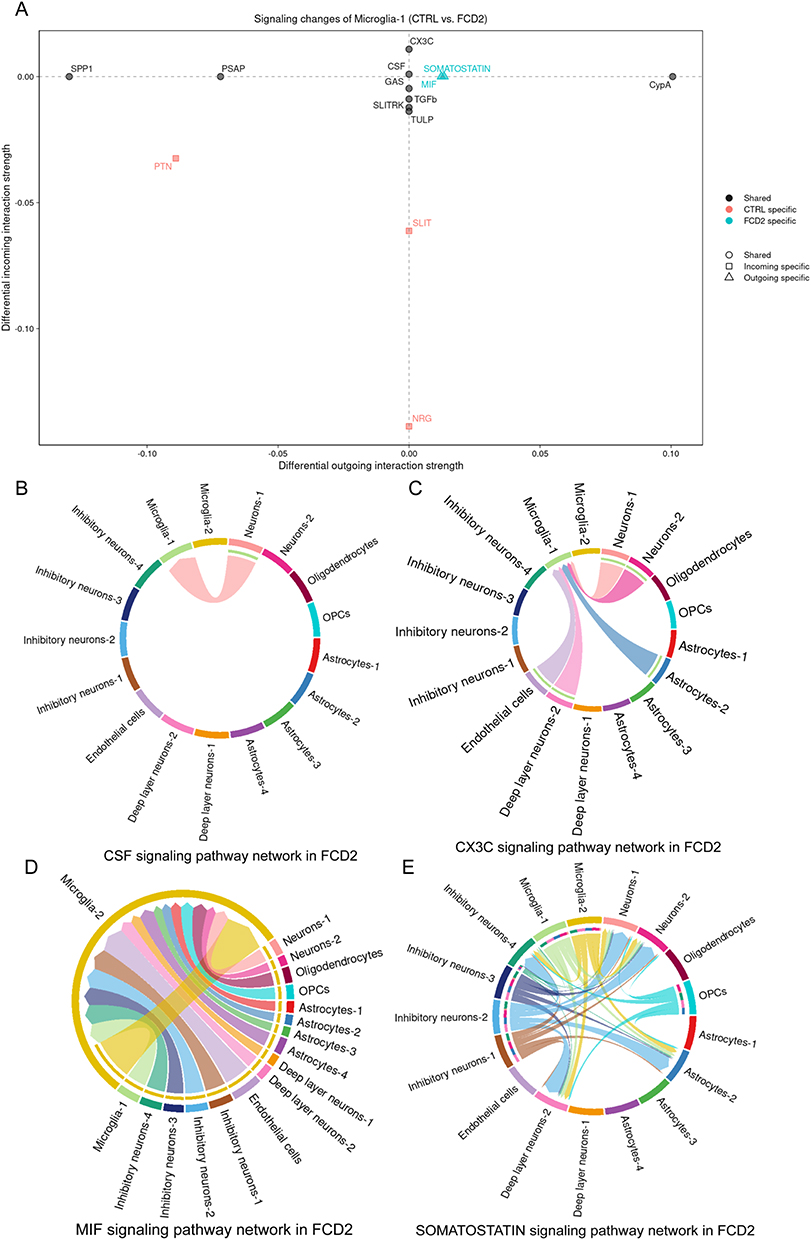 |
Figure 10 Changes of Microglia-1 Signaling Network Pathways. (A) Overview of pathway profiles altered in Microglia-1. (B) Colony-stimulating factor (CSF) signaling. (C) CX3C motif chemokine signaling. (D) Macrophage migration inhibitory factor (MIF) signaling. (E) Somatostatin signaling. |
Interaction analysis revealed that CSF signaling predominantly engaged Neuron-1 (Figure 10B), while CX3C signaling involved interactions with Neuron-1/2, Astrocyte-2, Deep layer neurons-2, and Endothelial cells (Figure 10C). Notably, MIF signaling was exclusively detected between Microglia-1 and Microglia-2 (Figure 10D), whereas Somatostatin signaling connected Microglia-1 to Inhibitory neuron-4, Deep layer neurons-2, Astrocyte-2, and Neuron-2 (Figure 10E).
Discussion
FCDII is a leading etiology of drug-resistant epilepsy in pediatric populations, often resulting in persistent neurological and behavioral deficits.40 Despite its clinical significance, systematic proteomic characterization of FCDII lesions remains sparse, limiting mechanistic insights into its pathogenesis.
In this study, we adopted a DIA-MS approach to profile proteomic alterations in FCDII tissues compared to controls. We identified 371 upregulated and 89 downregulated proteins, classified into 14 subcellular localizations. The most abundant categories were nuclear proteins (26.25%), cytoplasmic proteins (20.62%), plasma membrane-associated proteins (14.06%), and extracellular proteins (8.44%). This spatial distribution highlights potential dysregulation of nuclear regulatory pathways and cell-matrix interactions in FCDII pathogenesis.
Functional enrichment analysis of DEPs revealed their involvement in diverse biological processes, including microtubule-based movement, antigen processing and presentation, carbohydrate metabolism, and translation. Notably, multiple signaling pathways exhibited significant dysregulation in FCDII compared to controls, such as cortical development, immune-inflammatory signaling, cytoskeletal/synaptic regulation, and protein metabolism/homeostasis. These pathways may collectively contribute to the disease progression.
A PPI network (443 nodes, 4503 interaction pairs) was constructed from DEPs, with the top 3 functional clusters linked to ribosome, growth-related signaling pathways, and immune-related pathways. Using the cytoHubba plugin in Cytoscape, 10 DEPs were identified as hub genes: DFFA, AIF1, ARHGAP22, SFXN5, SYPL1, HERPUD2, TESMIN, SHTN1, CD84 and APOL2. Notably, all except APOL2 were upregulated in FCDII, suggesting their potential critical roles in FCDII pathogenesis.
CD84 is a glycoprotein (64–82 kDa) that is involved in monocyte, macrophage activation and the regulation of inflammatory factor secretion.13,41,42 Murine studies have shown that CD84 modulates signaling pathways downstream of TLR4 and it also could induce a higher secretion of proinflammatory cytokines such as TNF-α.41 Furthermore, prior experimental studies using mouse models and in vitro microglial cultures have reported that microglial activation and neuronal death have been shown to be promoted by CD84.16
Subsequently, integration of the GEO dataset GSE128300 (analyzing transcriptional dysregulation) with our proteomic data revealed CD84 as a consistently upregulated cross-omics entity across both datasets. Validation via RT-qPCR confirmed its elevated mRNA expression in FCDII, reinforcing its potential role as a biomarker or mechanistic contributor to cortical dysplasia (Supplementary Figure 1). This cross-omics consistency highlights CD84—a hub gene in the PPI network—as a key candidate for future functional studies in FCDII.
To investigate the role of CD84 in FCD II pathogenesis, we analyzed scRNA-seq data from the GEO dataset GSE268807, comprising 9 FCD type II patients and 2 relatively normal controls. After rigorous quality control, normalization, and integration, we performed dimensionality reduction and clustering, followed by cell type annotation using canonical marker genes (Supplementary Figure 2).
Notably, CD84 exhibited specific expression within the microglial subset Microglia-1. In addition to its cell-type specificity, the abundance of the CD84-positive Microglia-1 subset appeared upregulated in FCD II compared with control neocortex. However, stratification by subtype revealed that this expansion was predominantly driven by FCD IIB. This pattern is consistent with recent multi-omics analyses in human FCD cortical tissue, which reported pronounced microglial activation within type II lesions and further demonstrated that the expansion of microglial subpopulations is more evident in FCD IIB than in IIA.18,43 Such subtype-specific differences support the notion that inflammatory responses may be particularly accentuated in the IIB subtype. Our findings extend these observations by indicating that this enrichment is particularly notable within the CD84-positive microglial compartment. This pattern may reflect a potential link between CD84-expressing microglia and the comparatively stronger immune–inflammatory signatures described in FCD II, especially in subtype IIB.
Microglial reactivity has been found to be associated with abnormalities in FCD II tissue.12 Differential analysis between CD84-positive and CD84-negative microglia showed that CD84-positive cells demonstrated higher expression of genes associated with PI3K/Akt, MAPK signaling pathways. The PI3K/Akt cascade play a significant role in the microglial activation and neuroinflammation.44 Evidence from experimental models shows that pharmacological blockade of PI3K/Akt in lipopolysaccharide (LPS) -stimulated microglia markedly suppresses the production of pro-inflammatory mediators.45 Signals that converge on MAPK pathways serve as key mediators of neuroinflammatory responses and have been implicated in multiple neurodegenerative conditions.46 In addition, aberrant activation of MAPK signaling has been shown to contribute to mitochondrial dysfunction and to promote neuronal hyperexcitability in epilepsy.47 Pharmacological inhibition of MAPK signaling markedly suppresses cytokine synthesis and release in Lysophosphatidic acid (LPA)-activated primary microglia.48
Given its selective localization to the Microglia-1 subset, CD84 showed higher expression in FCD II–derived Microglia-1 cells relative to controls, together with enriched signatures related to oxidative phosphorylation, ribosomal, and metabolic pathways. These transcriptional patterns are consistent with a more activated and inflammation-related microglial state.49,50
To dissect the interplay between CD84-positive microglia and other cell populations, we analyzed cell-cell communication networks in the Microglia-1 subset. Analysis of the Microglia-1 subset revealed significantly enhanced cell-cell communication with astrocytes, neurons, and endothelial cells in FCD II compared to controls. Furthermore, CSF, CX3C, MIF, and Somatostatin signaling pathways were upregulated in FCD II patients.
Within the CNS, the CSF-1R is mainly expressed on microglia and plays an important role in microglial development and steady-state maintenance.51,52 Ligand-induced activation of the CSF-1/CSF-1R signaling axis can drive pathogenic inflammatory responses and activate downstream intracellular cascades, including the PI3K–AKT and MAPK pathways, which have been repeatedly implicated in neuroinflammation.53 Therefore, pharmacological inhibition of CSF-1R signaling has been proposed as a potential therapeutic strategy to modulate microglia-mediated neuroinflammatory processes.54 CX3C, a subfamily of cytokines, has been implicated in the pathogenesis of various neurological disorders such as Alzheimer’s disease and multiple sclerosis.55 Notably, CX3C differs from other chemokines by exhibiting dual chemotactic and adhesive activities, and it participates in diverse pathophysiological processes such as inflammatory responses and tissue development.56 MIF could recruit multiple inflammatory mediators, and its dysregulation also induces neuroinflammation.57 Elevated MIF has been associated with epilepsy and other neuroinflammatory disorders, and experimental studies demonstrate that pharmacologic blockade of MIF effectively reduces microglia-mediated inflammatory activity.58–60 Lastly, somatostatin, a neuropeptide produced by neuroendocrine, inflammatory, and immune cells, exerts broad inhibitory effects on cellular functions, including secretion, motility, and proliferation.61,62
Regarding the specificity of these observations, we note that CD84 upregulation is not exclusive to FCD II; as mentioned, it appears in other neuroinflammatory conditions such as Parkinson’s disease and stroke. This suggests that the CD84+ Microglia-1 subset likely represents a shared, high-inflammatory state of microglia common to various CNS pathologies rather than a cell type unique to cortical dysplasia. However, the significance in the context of FCD II lies in how this inflammatory module interacts with the specific lesional architecture. Our CellChat analysis reveals that these CD84+ microglia are not acting in isolation but are specifically engaged in signaling loops (CSF, CX3C, Somatostatin) with cell types distinct to the FCD environment, such as specific neuronal layers and astrocytes. Thus, while the presence of CD84+ microglia may be a hallmark of general neuroinflammation, their functional impact—specifically shaping the epileptogenic microenvironment and interacting with dysplastic circuitry—contributes to the specific pathology of FCD II.
This study has several limitations that should be acknowledged. Primarily, although we integrated proteomic and transcriptomic datasets to ensure robust validation, the sample size was limited by the availability of surgical FCD specimens. This constrained our ability to perform in-depth stratification based on FCD subtypes (IIA vs IIB) or clinical covariates such as seizure frequency and anti-seizure medication history. Second, biological variables including sex, age, and cortical location were not fully balanced. Prior work indicates that microglial phenotypes are highly sensitive to these extrinsic microenvironmental factors,63–65 and future studies should aim to disentangle these variables from disease-specific alterations. Finally, this study is primarily descriptive and lacks functional experiments to directly test the mechanistic role of CD84⁺ microglia in FCD II, which will be an important direction for future work. Nevertheless, the integration of proteomic, transcriptomic, and single-cell transcriptomic datasets provides convergent evidence supporting a potential role for CD84 in microglial alterations associated with FCD II.
Conclusions
In conclusion, this study provides an integrated multi-omic framework that highlights CD84 as a consistently upregulated molecule in FCD II across proteomic, bulk transcriptomic, and single-cell datasets. CD84 is selectively enriched in the Microglia-1 subset, which is expanded in FCD II—particularly in type IIB—and displays transcriptional features indicative of heightened inflammatory and metabolic activation. Moreover, CD84⁺ microglia show strengthened interactions with neurons, astrocytes, and endothelial cells through CSF, CX3C, MIF, and somatostatin signaling, suggesting a broader role in shaping the lesional microenvironment.
While CD84 is not unique to FCD II and can also be upregulated in other neuroinflammatory conditions, our data indicate that in FCD II, CD84⁺ microglia participate in lesion-specific signaling interactions that may contribute to the disease microenvironment. Thus, CD84 may serve as a biomarker of inflammatory activity in FCD II and a potential node of therapeutic interest. Further mechanistic studies are warranted to clarify its functional role.
Data Sharing Statement
The mass spectrometry proteomics data have been deposited to the ProteomeXchange Consortium (https://proteomecentral.proteomexchange.org) via the iProX partner repository66,67 with the dataset identifier PXD063912.
Ethics Approval
This study was conducted in compliance with the ethical principles of the Declaration of Helsinki and its subsequent amendments. The research protocol received formal approval from the Institutional Review Board of the Seventh Affiliated Hospital, Sun Yat-sen University (Shenzhen, China; Approval No. KY-2023-019-02). Written informed consent was obtained from all participants or their legal guardians prior to inclusion in the study, including consent for the publication of any potentially identifiable medical information.
Acknowledgments
The authors have no acknowledgements to declare.
Author Contributions
All authors made a significant contribution to the work reported, whether that is in the conception, study design, execution, acquisition of data, analysis and interpretation, or in all these areas; took part in drafting, revising or critically reviewing the article; gave final approval of the version to be published; have agreed on the journal to which the article has been submitted; and agree to be accountable for all aspects of the work.
Yubao Fang, Shengyu Yang, and Lei Lei are co-first authors. Yubao Fang: Conceptualization; Methodology; Investigation; Data curation; Formal analysis; Visualization; Writing – original draft; Writing – review and editing. Shengyu Yang: Validation; Formal analysis; Investigation; Writing – review and editing. Lei Lei: Formal analysis; Methodology; Writing – review and editing. Yinchao Li: Data curation; Validation; Writing – review and editing; Resources. Yaqian Zhang: Data curation; Visualization; Writing – review and editing; Resources. Tiancai Huang: Data curation; Visualization; Writing – review and editing; Resources. Liemin Zhou: Project administration; Data curation; Writing – review and editing.
Funding
This work was supported by the Shenzhen Municipal Science and Technology key projects of the Basic Research Program (file no. LMZ JCYJ20220818102007015) and the National Natural Science Foundation of China (file no. LMZ 82371456).
Disclosure
The authors declare no conflict of interest.
References
1. Wang L, Gui J, Ding R, et al. Identification and verification of key molecules in the epileptogenic process of focal cortical dysplasia. Metab Brain Dis. 2024;40(1):47. doi:10.1007/s11011-024-01426-4
2. Kun Y, Zejun D, Jian Z, Feng Z, Changqing L, Xueling Q. Surgical histopathologic findings of 232 Chinese children cases with drug-resistant seizures. Brain Behav. 2020;10(4):e01565. doi:10.1002/brb3.1565
3. Cloppenborg T, May TW, Blümcke I, et al. Differences in pediatric and adult epilepsy surgery: a comparison at one center from 1990 to 2014. Epilepsia. 2019;60(2):233–19. doi:10.1111/epi.14627
4. Barkovich AJ, Dobyns WB, Guerrini R. Malformations of cortical development and epilepsy. Cold Spring Harb Perspect Med. 2015;5(5):a022392. doi:10.1101/cshperspect.a022392
5. Blumcke I, Spreafico R, Haaker G, et al. Histopathological findings in brain tissue obtained during epilepsy surgery. New Engl J Med. 2017;377(17):1648–1656. doi:10.1056/NEJMoa1703784
6. Agarwal A, Bathla G, Soni N, et al. Updates from the international league against epilepsy classification of epilepsy (2017) and focal cortical dysplasias (2022): imaging phenotype and genetic characterization. AJNR Am J Neuroradiol. 2024;45(8):991–999. doi:10.3174/ajnr.A8178
7. Blümcke I, Thom M, Aronica E, et al. The clinicopathologic spectrum of focal cortical dysplasias: a consensus classification proposed by an ad hoc task force of the ILAE diagnostic methods commission. Epilepsia. 2011;52(1):158–174. doi:10.1111/j.1528-1167.2010.02777.x
8. Najm I, Lal D, Alonso Vanegas M, et al. The ILAE consensus classification of focal cortical dysplasia: an update proposed by an ad hoc task force of the ILAE diagnostic methods commission. Epilepsia. 2022;63(8):1899–1919. doi:10.1111/epi.17301
9. Zhang Z, Liu Q, Liu M, et al. Upregulation of HMGB1-TLR4 inflammatory pathway in focal cortical dysplasia type II. J Neuroinflamm. 2018;15(1):27. doi:10.1186/s12974-018-1078-8
10. Arena A, Zimmer TS, van Scheppingen J, et al. Oxidative stress and inflammation in a spectrum of epileptogenic cortical malformations: molecular insights into their interdependence. Brain Pathol. 2019;29(3):351–365. doi:10.1111/bpa.12661
11. Guo W, Zheng D, Sun F, et al. Expression and cellular distribution of the interleukin 2 signaling system in cortical lesions from patients with focal cortical dysplasia. J Neuropathol Exp Neurol. 2014;73(3):206–222. doi:10.1097/NEN.0000000000000042
12. Rossini L, De Santis D, Cecchini E, et al. Dendritic spine loss in epileptogenic type II focal cortical dysplasia: role of enhanced classical complement pathway activation. Brain Pathol. 2023;33(3):e13141. doi:10.1111/bpa.13141
13. Cuenca M, Sintes J, Lányi Á, Engel P. CD84 cell surface signaling molecule: an emerging biomarker and target for cancer and autoimmune disorders. Clin Immunol. 2019;204:43–49. doi:10.1016/j.clim.2018.10.017
14. Gu X, Su W, Dou M, et al. Expanding causal genes for Parkinson’s disease via multi-omics analysis. NPJ Parkinsons Dis. 2023;9(1):146. doi:10.1038/s41531-023-00591-0
15. Schuhmann MK, Stoll G, Bieber M, et al. CD84 links t cell and platelet activity in cerebral thrombo-inflammation in acute stroke. Circ Res. 2020;127(8):1023–1035. doi:10.1161/CIRCRESAHA.120.316655
16. Tong D, Zhao Y, Tang Y, Ma J, Wang Z, Li C. Circ-usp10 promotes microglial activation and induces neuronal death by targeting miRNA-152-5p/CD84. Bioengineered. 2021;12(2):10812–10822. doi:10.1080/21655979.2021.2004362
17. Chung C, Yang X, Bae T, et al. Comprehensive multi-omic profiling of somatic mutations in malformations of cortical development. Nat Genet. 2023;55(2):209–220. doi:10.1038/s41588-022-01276-9
18. Bizzotto S, Talukdar M, Stronge EA, et al. Cell-type-informed genotyping of mosaic focal epilepsies reveals cell-autonomous and non-cell-autonomous disease-associated transcriptional programs. Proc Natl Acad Sci U S A. 2025;122(29):e2509622122. doi:10.1073/pnas.2509622122
19. Kobow K, Ziemann M, Kaipananickal H, et al. Genomic DNA methylation distinguishes subtypes of human focal cortical dysplasia. Epilepsia. 2019;60(6):1091–1103. doi:10.1111/epi.14934
20. Galvão IC, Lemoine M, Messias LA, et al. Multimodal single-cell profiling reveals neuronal vulnerability and pathological cell states in focal cortical dysplasia. iScience. 2024;27(12):111337. doi:10.1016/j.isci.2024.111337
21. Song J, Ren K, Zhang D, et al. A novel signature combing cuproptosis- and ferroptosis-related genes in sepsis-induced cardiomyopathy. Front Genet. 2023;14:1170737. doi:10.3389/fgene.2023.1170737
22. Franceschini A, Szklarczyk D, Frankild S, et al. STRING v9.1: protein-protein interaction networks, with increased coverage and integration. Nucleic Acids Res. 2013;41(Database issue):D808–D815. doi:10.1093/nar/gks1094
23. Raju B, Narendra G, Verma H, Silakari O. Identification of chemoresistance associated key genes-miRNAs-TFs in docetaxel resistant breast cancer by bioinformatics analysis. 3 Biotech. 2024;14(5):128. doi:10.1007/s13205-024-03971-2
24. Dennis GJ, Sherman BT, Hosack DA, et al. DAVID: database for annotation, visualization, and integrated discovery. Genome Biol. 2003;4(5):3.
25. Kour B, Shukla N, Bhargava H, et al. Identification of plausible candidates in prostate cancer using integrated machine learning approaches. Curr Genomics. 2023;24(5):287–306. doi:10.2174/0113892029240239231109082805
26. Francisco DMF, Marchetti L, Rodríguez-Lorenzo S, et al. Advancing brain barriers RNA sequencing: guidelines from experimental design to publication. Fluids Barriers CNS. 2020;17(1):51. doi:10.1186/s12987-020-00207-2
27. Multimodal single-cell profiling reveals neuronal vulnerability and pathological cell states in focal cortical dysplasia. Available from: https://www.cell.com/iscience/abstract/S2589-0042(24)02562-8.
28. Wang X, Sun Q, Wang W, Liu B, Gu Y, Chen L. Decoding key cell sub-populations and molecular alterations in glioblastoma at recurrence by single-cell analysis. Acta Neuropathol Commun. 2023;11(1):125. doi:10.1186/s40478-023-01613-x
29. Zhang L, Yu X, Zheng L, et al. Lineage tracking reveals dynamic relationships of t cells in colorectal cancer. Nature. 2018;564(7735):268–272. doi:10.1038/s41586-018-0694-x
30. Jin S, Guerrero-Juarez CF, Zhang L, et al. Inference and analysis of cell-cell communication using CellChat. Nat Commun. 2021;12(1):1088. doi:10.1038/s41467-021-21246-9
31. Elizarraras JM, Liao Y, Shi Z, Zhu Q, Pico AR, Zhang B. WebGestalt 2024: faster gene set analysis and new support for metabolomics and multi-omics. Nucleic Acids Res. 2024;52(W1):W415–W421. doi:10.1093/nar/gkae456
32. Qin L, Liu X, Liu S, et al. Differentially expressed proteins underlying childhood cortical dysplasia with epilepsy identified by iTRAQ proteomic profiling. PLoS One. 2017;12(2):e0172214. doi:10.1371/journal.pone.0172214
33. Boer K, Troost D, Spliet WGM, van Rijen PC, Gorter JA, Aronica E. Cellular distribution of vascular endothelial growth factor a (VEGFA) and b (VEGFB) and VEGF receptors 1 and 2 in focal cortical dysplasia type IIB. Acta Neuropathol. 2008;115(6):683–696. doi:10.1007/s00401-008-0354-6
34. Li X, Wang T, Liu N, et al. Focal cortical dysplasia II caused by brain somatic mutation of IRS-1 is associated with ERK signaling pathway activation. Cerebral Cortex. 2024;34(6). doi:10.1093/cercor/bhae227
35. Li L, Liu C, Li T, et al. Analysis of altered micro RNA expression profiles in focal cortical dysplasia IIB. J Child Neurol. 2016;31(5):613–620. doi:10.1177/0883073815609148
36. Cotter D, Honavar M, Lovestone S, et al. Disturbance of notch-1 and wnt signalling proteins in neuroglial balloon cells and abnormal large neurons in focal cortical dysplasia in human cortex. Acta Neuropathol. 1999;98(5):465–472.
37. Snäkä T, Fasel N. Behind the scenes: nod-like receptor x1 controls inflammation and metabolism. Front Cell Infect Microbiol. 2020;10:609812. doi:10.3389/fcimb.2020.609812
38. Sun H, Ma D, Cheng Y, et al. The JAK-STAT signaling pathway in epilepsy. Curr Neuropharmacol. 2023;21(10):2049–2069. doi:10.2174/1570159X21666221214170234
39. Newman AM, Steen CB, Liu CL, et al. Determining cell type abundance and expression from bulk tissues with digital cytometry. Nat Biotechnol. 2019;37(7):773–782. doi:10.1038/s41587-019-0114-2
40. Wang D, Katoch M, Jabari S, et al. The specific DNA methylation landscape in focal cortical dysplasia ILAE type 3d. Acta Neuropathol Commun. 2023;11(1):129. doi:10.1186/s40478-023-01618-6
41. Sintes J, Romero X, de Salort J, Terhorst C, Engel P. Mouse CD84 is a pan-leukocyte cell-surface molecule that modulates LPS-induced cytokine secretion by macrophages. J Leukoc Biol. 2010;88(4):687–697. doi:10.1189/jlb.1109756
42. Mobini S, Chizari M, Rismani E, Mafakher L, Sadrzadeh MJ, Vosough M. Targeting CD84 protein on myeloid-derived suppressor cells as a novel immunotherapy in solid tumors. Comput Methods Programs Biomed. 2025;261:108607. doi:10.1016/j.cmpb.2025.108607
43. Galvao IC, Kandratavicius L, Messias LA, et al. Identifying cellular markers of focal cortical dysplasia type II with cell-type deconvolution and single-cell signatures. Sci Rep. 2023;13(1):13321. doi:10.1038/s41598-023-40240-3
44. Cianciulli A, Porro C, Calvello R, Trotta T, Lofrumento DD, Panaro MA. Microglia mediated neuroinflammation: focus on PI3k modulation. Biomolecules. 2020;10:1. doi:10.3390/biom10010137
45. Saponaro C, Cianciulli A, Calvello R, Dragone T, Iacobazzi F, Panaro MA. The PI3k/akt pathway is required for LPS activation of microglial cells. Immunopharmacol Immunotoxicol. 2012;34(5):858–865. doi:10.3109/08923973.2012.665461
46. Munoz L, Ammit AJ. Targeting p38 MAPK pathway for the treatment of Alzheimer’s disease. Neuropharmacology. 2010;58(3):561–568. doi:10.1016/j.neuropharm.2009.11.010
47. Singh S, Singh TG. Emerging perspectives on mitochondrial dysfunctioning and inflammation in epileptogenesis. Inflamm Res. 2021;70(10–12):1027–1042. doi:10.1007/s00011-021-01511-9
48. Plastira I, Bernhart E, Joshi L, et al. MAPK signaling determines lysophosphatidic acid (LPA)-induced inflammation in microglia. J Neuroinflamm. 2020;17(1):127. doi:10.1186/s12974-020-01809-1
49. Lauro C, Limatola C. Metabolic reprograming of microglia in the regulation of the innate inflammatory response. Front Immunol. 2020;11:493. doi:10.3389/fimmu.2020.00493
50. Song S, Yu L, Hasan MN, et al. Elevated microglial oxidative phosphorylation and phagocytosis stimulate post-stroke brain remodeling and cognitive function recovery in mice. Commun Biol. 2022;5(1):35. doi:10.1038/s42003-021-02984-4
51. Rumberger AS, Vassel LA, Hess CC, et al. Colony stimulating factor-1 (CSF-1) and interleukin-34 (IL-34) differentially alter white matter and gray matter microglia and oligodendrocyte progenitor cells. J Neurochem. 2025;169(8):e70186. doi:10.1111/jnc.70186
52. Erblich B, Zhu L, Etgen AM, Dobrenis K, Pollard JW. Absence of colony stimulation factor-1 receptor results in loss of microglia, disrupted brain development and olfactory deficits. PLoS One. 2011;6(10):e26317. doi:10.1371/journal.pone.0026317
53. Xiang C, Li H, Tang W. Targeting CSF-1r represents an effective strategy in modulating inflammatory diseases. Pharmacol Res. 2023;187:106566. doi:10.1016/j.phrs.2022.106566
54. Han J, Chitu V, Stanley ER, Wszolek ZK, Karrenbauer VD, Harris RA. Inhibition of colony stimulating factor-1 receptor (CSF-1r) as a potential therapeutic strategy for neurodegenerative diseases: opportunities and challenges. Cell Mol Life Sci. 2022;79(4):219. doi:10.1007/s00018-022-04225-1
55. Wang F, Guo B, Jia Z, et al. The role of CXCR3 in nervous system-related diseases. Mediators Inflammation. 2024;2024:8347647. doi:10.1155/2024/8347647
56. Chen X, Yang Y, Sun S, Liu Q, Yang Y, Jiang L. CX3c chemokine: hallmarks of fibrosis and ageing. Pharmacol Res. 2024;208:107348. doi:10.1016/j.phrs.2024.107348
57. Zeng L, Hu P, Zhang Y, et al. Macrophage migration inhibitor factor (MIF): potential role in cognitive impairment disorders. Cytokine Growth Factor Rev. 2024;77:67–75. doi:10.1016/j.cytogfr.2024.03.003
58. Danis O, Demir S, Gunel A, et al. Changes in intracellular protein expression in cortex, thalamus and hippocampus in a genetic rat model of absence epilepsy. Brain Res Bull. 2011;84(6):381–388. doi:10.1016/j.brainresbull.2011.02.002
59. Basile MS, Battaglia G, Bruno V, et al. The dichotomic role of macrophage migration inhibitory factor in neurodegeneration. Int J Mol Sci. 2020;21(8). doi:10.3390/ijms21083023
60. Zhang Y, Gu R, Jia J, Hou T, Zheng LT, Zhen X. Inhibition of macrophage migration inhibitory factor (MIF) tautomerase activity suppresses microglia-mediated inflammatory responses. Clin Exp Pharmacol Physiol. 2016;43(11):1134–1144. doi:10.1111/1440-1681.12647
61. Benali N, Ferjoux G, Puente E, Buscail L, Susini C. Somatostatin receptors. Digestion. 2000;62 Suppl 1:27–32.
62. Duchene J, Ahluwalia A. The kinin b(1) receptor and inflammation: new therapeutic target for cardiovascular disease. Curr Opin Pharmacol. 2009;9(2):125–131. doi:10.1016/j.coph.2008.11.011
63. Vanryzin JW, Marquardt AE, Pickett LA, Mccarthy MM. Microglia and sexual differentiation of the developing brain: a focus on extrinsic factors. Glia. 2020;68(6):1100–1113. doi:10.1002/glia.23740
64. Antignano I, Liu Y, Offermann N, Capasso M. Aging microglia. Cell Mol Life Sci. 2023;80(5):126. doi:10.1007/s00018-023-04775-y
65. Tan Y, Yuan Y, Tian L. Microglial regional heterogeneity and its role in the brain. Mol Psychiatry. 2020;25(2):351–367. doi:10.1038/s41380-019-0609-8
66. Ma J, Chen T, Wu S, et al. IProX: an integrated proteome resource. Nucleic Acids Res. 2019;47(D1):D1211–D1217. doi:10.1093/nar/gky869
67. Chen T, Ma J, Liu Y, et al. IProX in 2021: connecting proteomics data sharing with big data. Nucleic Acids Res. 2022;50(D1):D1522–D1527. doi:10.1093/nar/gkab1081
 © 2026 The Author(s). This work is published and licensed by Dove Medical Press Limited. The
full terms of this license are available at https://www.dovepress.com/terms
and incorporate the Creative Commons Attribution
- Non Commercial (unported, 4.0) License.
By accessing the work you hereby accept the Terms. Non-commercial uses of the work are permitted
without any further permission from Dove Medical Press Limited, provided the work is properly
attributed. For permission for commercial use of this work, please see paragraphs 4.2 and 5 of our Terms.
© 2026 The Author(s). This work is published and licensed by Dove Medical Press Limited. The
full terms of this license are available at https://www.dovepress.com/terms
and incorporate the Creative Commons Attribution
- Non Commercial (unported, 4.0) License.
By accessing the work you hereby accept the Terms. Non-commercial uses of the work are permitted
without any further permission from Dove Medical Press Limited, provided the work is properly
attributed. For permission for commercial use of this work, please see paragraphs 4.2 and 5 of our Terms.