
Back to Journals » Neuropsychiatric Disease and Treatment » Volume 21
Integrated Gut Microbiota, Metabolomics, and Network Pharmacology to Investigate the Anti-Alzheimer’s Mechanism of Tripterygium Glycoside
Authors Zhang Y, Silang Q, Wang Y, Wang N, Gesang L, Tang L, Liu L
Received 6 June 2025
Accepted for publication 26 August 2025
Published 3 September 2025 Volume 2025:21 Pages 1911—1933
DOI https://doi.org/10.2147/NDT.S537129
Checked for plagiarism Yes
Review by Single anonymous peer review
Peer reviewer comments 2
Editor who approved publication: Professor Taro Kishi
Yongcang Zhang,1 Quxi Silang,2 Yan Wang,3 Niannian Wang,4 Luobu Gesang,5 Liang Tang,3 Lan Liu1
1Medical College, Tibet University, Lhasa, Tibet, People’s Republic of China; 2Clinical Laboratory, Maternal and Child Health Hospital of Tibet, Lhasa, Tibet, People’s Republic of China; 3Hunan Provincial University Key Laboratory of the Fundamental and Clinical Research on Neurodegenerative Diseases, Changsha Medical University, Changsha, People’s Republic of China; 4Plateau Brain Science Research Center, Tibet University, Lhasa, Tibet, People’s Republic of China; 5Department of research and development, Tibet Ganlu Tibetan Medicine Co, LTD, Lhasa, Tibet, People’s Republic of China
Correspondence: Lan Liu, Medical College, Tibet University, No. 36, Jiangsu road, Chengguan district, Lhasa, Tibet, 850000, People’s Republic of China, Email [email protected]
Background: Tripterygium glycoside (TG) has been reported to have the effect of ameliorating Alzheimer’s disease (AD)-like symptoms in mice model. However, the underlying mechanism is largely unknown. This study aimed to investigate the potential mechanism of TG against AD by integrating metabolomics, 16s rRNA sequencing, network pharmacology, molecular docking, and molecular dynamics simulation.
Methods: Memory and cognitive functions were assessed in mice via the Morris water maze. The pathological changes were assessed using hematoxylin and Nissl’s straining. Pathological changes in p-Tau and Aβ1-42 were assessed using immunohistochemistry, immunofluorescence, ELISA, and Western blotting. 16S rRNA sequencing and metabolomics were performed to analyze alterations in the structure of gut microbiota and hippocampus metabolites. Network pharmacology, molecular docking, and molecular dynamics simulation were performed to determine the putative molecular regulatory mechanism of TG in treating AD.
Results: TG significantly could inhibit neuron loss, improved cognitive and memory functions, and significantly reduce the expression of p-Tau and Aβ1-42. In addition, 16s rRNA analysis revealed that TG could reverse AD-induced gut microbiota dysbiosis in AD model mice by reducing the abundance of Alistipes. Furthermore, metabolomic analysis revealed that TG may reverse AD-induced metabolic disorders by regulating glycerophospholipid metabolism. And spearman analysis revealed that glycerophospholipids metabolism might closely related to Alistipes. Moreover, network pharmacology, molecular docking, and molecular dynamics simulation analyses indicated that TG might regulate lipid metabolism-related pathways via SRC for the treatment of AD.
Conclusion: TG may serve as a potential therapeutic drug for preventing AD via the microbiota-gut-brain axis.
Keywords: tripterygium glycoside, Alzheimer’s disease, gut microbiota, metabolomic, glycerophospholipids metabolism
Graphical Abstract:

Introduction
Alzheimer’s disease (AD), a complex degenerative disease in the central nervous system, was characterized by memory loss, cognitive dysfunction, and mental behavioral abnormalities.1,2 Epidemiology has shown that the prevalence of AD is increasing among people over 65 years of age, and the number of patients will reach 152 million by 2050.3 The pathogenesis of AD is complex. Cholinergic deficiency,4 Aβ toxicity,5 tau protein hyperphosphorylation,6 synaptic dysfunction,7 oxidative stress,8 and neuroinflammation9 were causative factors of AD. The drugs used for the treatment of AD mainly target cholinergic neurotransmitters, Aβ, and p-tau yet,10 while the clinical effects were not significant.
Tripterygium glycoside (TG), an extract of Tripterygium wilfordii Hook. C,11 has the effects of anti-inflammatory, antiviral, and immunomodulatory,12 which was mainly used in treating rheumatoid arthritis (RA),13 systemic lupus erythematosus (SLE),14 diabetic nephropathy (DN),15 lupus nephritis (LN),16 hyperthyroidism,17 and ovarian cancer (OC).18 Our previous study revealed that TG could significantly ameliorate neuroinflammation in an Aβ25-35-induced AD mouse model by inhibiting IκBα and p38 phosphorylation.19 Moreover, TG could regulate the expression of noncoding RNAs in the hippocampus of AD mice.20,21 However, the in-depth mechanism of TG treatment for AD is not clear.
The gut microbiota is a complex and dynamic ecosystem. Changes in the diversity and abundance of the gut microbiota in AD patients and a link between dysbiosis of the gut microbiota and the pathological process of AD have been reported.22–24 In addition, the regulatory effect of traditional Chinese medicine on the gut microbiota has become a hotpot.25–29 Zhang et al30 reported that Xiao Yao San could improve the structure of the gut microbiota in AD model mice, increase the richness and diversity of the gut microbiota, and subsequently alleviated the dysfunction of bacterial metabolism and improve AD symptoms. Liu et al31 reported that icariin can regulate the abundance of Akkermansia and Alistipes in APP/PS1 mice. Furthermore, TG was shown to change the structure of gut microbiota in RA rats32 and ulcerative colitis (UC) mice.33 The above studies suggested that TG may have a regulatory effect on the gut microbiota.
Researches have shown that imbalance of gut microbiota may lead to increased permeability of the intestinal barrier and the blood–brain barrier through bidirectional communication within the gut-brain axis.34,35 In addition, the metabolites of the gut microbiota may lead to changes in neuroreactive metabolites such as the secretion of γ-aminobutyric acid, serotonin, β -n-methylamino-L-alanine, and the expression of brain-derived neurotrophic factor.36,37 Therefore, it is reliable that alteration in the structure of the gut microbiota could cause differences in the expression of metabolites in the brain and subsequently induce AD. However, whether TG could change the structure of gut microbiota, and then alter the expression of metabolites in the AD mice model is not clear yet.
The 16S rRNA sequencing technique has provided insights into the gut microbiota’ s role in AD, revealing significant differences in microbial composition between AD and control.26 Moreover, metabolomics, a rapidly advancing field, offers insights into disease-induced metabolic disturbances.38 Increasing evidence has revealed that multiomics including 16S rRNA sequencing and metabolomics, play important roles in investigating the pathogenesis or mechanism of drug intervention in neurodegenerative diseases including AD and vascular dementia (VD).39,40 In the present study, we aimed to treat an Aβ25-35-AD mouse model with TG and investigate the potential mechanism integrating metabolomics, 16S rRNA sequencing, and network pharmacology analysis.
Materials and Methods
AD Animal Modeling and Grouping
A total of 54 SPF KM mice (male, 8 months, 30±5 g) were purchased from Hunan Slake Jinda Laboratory Animal Co. (Animal Production License No. SYXK (Xiang) 2019–004). The animal experimental procedures followed the ARRIVE Guidelines (https://arriveguidelines.org), the American Veterinary Medical Association (AVMA) Guidelines for the Euthanasia of Animals (2020), and were approved by the Ethics Committee of the Tibet University (Ethics Approval No. 2023SQ005). The mice were randomly divided into a control group (N=6) and an AD model group (N=36) and were then acclimatized and reared for 1 week. The temperature ranged from 18 to 22 °C, and the relative humidity ranged from 50% to 60%. AD mice model were conducted as described by Tang et al21 and Gao et al.41 The mice in the AD model group and control group were injected with D-gal (1.2 mg/10 g) and 0.9% saline subcutaneously in the dorsum of the neck for 28 days (once a day). The mice in the AD model group and control group were subsequently injected with 1 μL of Aβ25-35 (1 μg/μL) (Sigma, USA) and 1 μL of 0.9% saline into the lateral ventricle using stereotaxic localization (bregma: −2.3 mm, lambda: ±1.8 mm, depth: −2.0 mm, unilateral, once) separately. The mice in the AD model group were then randomly divided into AD (N=12), TG-L (N=12), and TG-H (N=12) groups. Another control group (N=12) was also established. The mice in the control group were gavaged with 0.1 mL of 0.9% saline. The mice in the TG-L and TG-H groups were gavaged with 9.1 mg/kg and 13.65 mg/kg TG, respectively (purchased from Zhejiang Duende Co. Ltd., China) according to Yan et al42 (once a day for 28 consecutive days). The procedure of the animal experiment is shown in Figure 1A.
 |
Figure 1 The changes of memory and cognitive function in AD mice detected by Morris water maze. (A) The animal experimental procedure. (B) Comparison of escape latency of mice in the control, AD, TG-L, and TG-H groups. (C) Comparison of the frequency of crossing the virtual platform in the control, AD, TG-L, and TG-H groups. (D) The swimming trajectory of mice in the control, AD, TG-L, and TG-H groups. Data was expressed as the means ± standard deviation (SD). (n =6/group in each group). “**” means P < 0.05. All experimental results were performed in triplicates. |
Morris Water Maze
The Morris water maze (MWM) was used to detect learning and memory functions in the mice. The MWM test was performed according to Vorhees et al.43 Data from the place navigation test and spatial probe test were collected following the methods of our previous studies.44,45
Sample Collection
The mice were anesthetized via intraperitoneal injection of 0.4% sodium pentobarbital. Hippocampal tissues from the control, AD, and TG-H groups (N=6) were collected, rapidly frozen in liquid nitrogen, and then placed in a −80 °C freezer for metabolomic analysis after the mice were sacrificed by cervical dislocation. In addition, feces from the control, AD, and TG-H groups (N=6) were randomly collected from the colon and stored at −80 °C for 16S rRNA sequencing. The left hemibrain of the remaining mice from the control, AD, TG-L, and TG-H groups (N=6) was preserved in 4% paraformaldehyde solution for morphological examination. The hippocampus from the remaining right hemibrain (N=6) were isolated and stored at −80 °C for biochemical assays.
Enzyme Linked Immunosorbent Assay (ELISA)
PBS buffer was added to make hippocampus tissue homogeneity, and the supernatant was extracted after centrifugation. The levels of Aβ1-42 were detected according to the instructions of mouse Aβ1-42 ELISA kit (Cat: ML59211, R&D). The absorbance at 450 nm was measured by enzyme-labeled instrument (Cmax plus, Molecular Ltd).
HE Staining
Hemibrain tissue was immersed in 4% paraformaldehyde at room temperature for 36 h. Hematoxylin–eosin (HE) staining was performed after fixation, and the samples were dehydrated, cleared, paraffin-embedded, and sectioned at a thickness of 4 μm. Morphological changes in the hippocampal tissue were observed under a light microscope.
Nissl’s Staining
The post-fixed hemibrains were cut into approximately 0.5 cm tissue blocks, which were then immersed in 0.1 M PBS configured in 20–40% sucrose with a gradient of sinking sugar in 4°C. The hemibrain tissue was dehydrated with alcohol, embedded in paraffin and sliced at a thickness of 4 mm. Following dewaxing, Nissl dye (ASPEN) was applied for 40 min (60 °C). The slices were washed with distilled water three times and differentiated with 95% ethanol for 5 min, followed by dehydration with alcohol-xylene until they were transparent. The sections were observed and photographed under a Ckx53 inverted microscope (Olympus, Japan).
Immunohistochemistry
After the paraffin sections were deparaffinized, 3% H2O2 was added to inactivate endogenous peroxidase. After microwave antigen retrieval and horse serum blocking, anti-Aβ1-42 antibody (Abcam, #: ab201060) and anti-p-Tau (p-T181) (Abcam, #: ab254409) were added dropwise, and the samples were incubated at 37 °C for 1 h. After rinsing with PBS, the samples were incubated with SABC mouse IgG (Solarbio, #: SA0011, China) at 37 °C for 30 min. After sequential DAB color development, hematoxylin restaining, dehydration, and clearing, the slices were sealed. The optical density of positive cells were photographed under a Ckx53 inverted microscope (Olympus, Japan) and analyzed using Image J 6.0.
Immunofluorescence
The dewaxed sections were placed in 0.01M citrate buffer (PH6.0) and microwave heated at 65°C for antigen repair. Next, 50 μL anti-NeuN (1:400) (PTG, #: 66,836-1-Ig) and anti-p-Tau (1:200)(Abcam, #: ab254409) were added to each section, followed by incubation at 4°C overnight. Subsequently, 50 μL FITC labeled goats against rats IgG (Sanying, #: SA00003-11)(1:100) and Cy3-labeled sheep anti-mouse IgG (Aspen, #: AS1111) (1:100) were added, followed by incubation at 37°C for 40 min without light. Next, 50 μL DAPI (Sigma, #: D8417-1MG) was added to each section, followed by incubation for 30 min at room temperature away from light. Finally, 50 μL anti-fluorescence quencher dropwise (Aladdin, #: T105635-50g) was added, and the sections were observed and photographed under a confocal laser microscope (Leica CTS-SP5). The light source used a laser wavelength of 488 nm and a laser wavelength of 561 nm to excite green and red fluorescence, respectively. 20 hippocampal neurons were randomly selected for each high-power field of view, and the fluorescence intensity was analyzed by Leica confocal software. The experiment was repeated for 3 times, and the average fluorescence intensity was used as the relative expression of the protein.
Western Blotting
Tissue protein extraction kit (Invitrogen, USA) was used to extract total protein from brain tissues of each group. The protein concentration was determined by BCA method. Equal amounts of protein extracts were separated by SDS-PAGE and then transferred to PVDF membranes. After blocking with 5% skim milk, they were incubated overnight at 4°C with anti-p-tau (p-Tau181) (1:500) (Abcam, #: ab254409, Abcam), anti-tau (1:500)(Abcam, #: ab254256, Abcam), anti-P-src (Y416)(1:800)(Abcam, #: ab278693, Abcam) and anti-src (1:800)(Abcam, #: ab109381, Abcam) primary antibodies, respectively. Washed with PBS-Tween-20 for 5 minutes and incubated with goat anti-mouse IgG antibody (1:6,000)(Abcam, #: ab150113, Abcam) at room temperature for 1 h. Then, the impression is developed and fixed. ImageJ 6.0 software was used to scan and calculate the gray values of each protein band. The relative protein expression levels of p-Tau, Tau, p-SRC, and SRC were normalized with the relative protein expression levels of GAPDH.
Metabolomic Analysis
Metabolomic analysis of the hippocampus in the control, AD and TG-H groups was performed via LC-MS/GC-MS via a Waters ACQUITY UPLC I-Class plus/Thermo QE ultrahigh-performance liquid tandem high-resolution mass spectrometer and an Agilent 7890B‒5977A gas chromatograph mass spectrometer platform system (OE Biotech, Shanghai).
The chromatographic conditions were as follows: LC: column: ACQUITY UPLC HSS T3 (100 mm×2.1 mm, 1.8 µm); column temperature: 45 °C; mobile phase: A-water (containing 0.1% formic acid), B-acetonitrile; flow rate: 0.35 mL/min; inlet volume: 2 μL; GC: DB-5MS capillary column (30 m × 0.25 mm × 0.25 μm, Agilent J&W Scientific, Folsom, CA, USA); carrier gas: high-purity helium; flow rate: 1.0 mL/min; temperature at the injection port: 1.0 mL/min, 0.25 μm (Agilent J&W Scientific, Folsom, CA, USA); carrier gas: high purity helium at a flow rate of 1.0 mL/min, inlet temperature: 260 °C; inlet volume: 1 μL; programmed temperature: the initial temperature of the column oven was 60 °C and held for 0.5 min; the temperature was programmed to increase to 125 °C with a programmed increase of 8 °C/min; the initial temperature of the column oven was 60 °C and held for 0.5 min; the temperature was programmed to increase to 125 °C with an increase of 8 °C/min, 8 °C/min to 210 °C, 15 °C/min to 270 °C, and 20 °C/min to 305 °C for 5 min.
The LC-MS/MS mass spectrometry conditions were as follows: ion source: ESI; sample mass spectrometry signal acquisition was performed with separate scans for positive and negative ions, and the acquisition mode was DDA (data-dependent acquisition) data-dependent scanning mode.
The GC-MS mass spectrometry conditions were as follows: electron bombardment ion source (EI), ion source temperature of 230 °C, quadrupole temperature of 150 °C, and electron energy of 70 eV. The scanning mode used was full scan mode (SCAN), and the mass scanning range was m/z 50–500.
The raw data were obtained after being baseline filtered, peak identified, integrated, retention time corrected, peak aligned, and normalized via Progenesis QI v3.0 software (Nonlinear Dynamics, Newcastle, UK). The Human Metabolome Database (HMDB) (https://hmdb.ca/), Lipidmaps (v2.3) (https://www.lipidmaps.org/), METLIN database (https://ngdc.cncb.ac.cn/databasecommons/database/id/5907) and LuMet-Animal database were used for identification analysis. Unsupervised principal component analysis (PCA) was used to detect the overall distribution among samples and the stability of the process. Partial least squares discriminant analysis (PLS-DA) and orthogonal partial least squares discriminant analysis (OPLS-DA) were used to distinguish the overall differences in metabolism between groups. The parameters of R2X (cum), interpretation rate R2Y (cum), and prediction rate Q2 (cum) were used to evaluate the validity of the PLS-DA model. The OPLS-DA model was established by using 7-fold cross validation and 200-response permutation testing (RPT). The R2 and Q2 values of the random model were obtained to examine the quality of the model. Differentially expressed metabolites (DEMs) were screened on the basis of the VIP and P values (variable importance in the projection (VIP)>1, P<0.05). The DEMs with the top 50 VIPs were subjected to hierarchical clustering. Correlations of DEMs with the top 20 VIPs were analyzed using the Pearson correlation coefficient. Metabolic pathway enrichment analysis was performed for the DEMs via the KEGG database (https://www.genome.jp/kegg/).
16S rRNA Amplicon Sequencing
Total DNA from feces in the control, AD, and TG-H groups was extracted using a Genomic DNA Extraction Kit (Thermo Fisher Scientific, USA). The purity and concentration of the DNA were tested using a NanoDrop 2000 (Thermo Fisher Scientific, USA). PCR amplification of the V3-V4 variable region of the 16S rRNA gene was performed with the primers 343F (5’-TACGGRAGGCAGCAG-3’) and 798R (5’-AGGGTATCTAATCCT-3’).46 16s rRNA sequencing was performed out using the Illumina NovaSeq 6000 sequencing platform (Shanghai OE Biotechnology Co). The abundance of amplicon sequence variant (ASV) was analysis by using the DADA2,47 and QIIME 2.48 The α diversity was assessed by using the ACE, Chao1, Simpson, coverage, and Shannon indices. Unweighted UniFrac principal coordinate analysis (PCoA) was used to assess the β diversity via R package. The Wilcoxon statistical algorithm was used in variance analysis. Species differences between groups were analyzed using Linear discriminant analysis Effect Size (LEfSe). KEGG pathway enrichment was analyzed via the KEGG database (https://www.genome.jp/kegg/).
Gut Microbiota–Metabolite Correlation Analysis
Data with significant differences in microbial abundance (P<0.05) and metabolite abundance (P<0.05, |VIP| > 1.0) were selected for joint analysis. The Spearman correlation coefficients were calculated between all the differentials. Correlation heatmaps were plotted using matplotlib (version 3.3.4).
Network Pharmacology Analysis
The active compounds of TG were then obtained by screening previous studies.49,50 Information of the active compounds of TG were retrieved from the Traditional Chinese Medicine Systems Pharmacology Database and Analysis Platform (TCMSP) (OB ≥ 30% and DL ≥ 0.18) (https://tcmsp-e.com/) and HERB (http://herb.ac.cn/). The chemical structures were retrieved from the PubChem database (https://pubchem.ncbi.nlm.nih.gov/). The target of the TG active compounds were retrieved using the SwissTarget prediction target prediction (http://swisstargetprediction.ch/). The GeneCards (https://www.genecards.org/), DrugBank (https://www.drugbank.ca/), and DisGeNET (https://www.disgenet.org/) databases were used to retrieve the potential targets of AD by using the keyword “Alzheimer’s disease”. AD targets were obtained after standardizing via UniProt database and removing duplicate data. The target intersection of TG and AD were screened by using InteractiVenn software. Protein‒protein interaction (PPI) network was constructed using the String database (https://www.string-db.org). Gene Ontology (GO) functional and KEGG pathway enrichment analyses were performed via DAVID software (https://david.ncifcff.gov/). The “drug-compound-target” and “compound-target-pathway” networks were constructed using Cytoscape 3.9.0 software.
Molecular Docking
The 3D structures of the active compounds were obtained from the PubChem database (https://pubchem.ncbi.nlm.nih.gov/). The AD target protein structure was downloaded from the PDB database (https://www.rcsb.org/). Molecular docking was performed out using Discovery Studio (2024) software (http://www.discoverystudio.net/) with the CDOCKER module. A binding energy of less than 5 kcal/mol indicates a relatively stable docking between the receptor and the ligand.51,52
Molecular Dynamics Simulation (MDs)
Gromacs 2020.6 software, Charmm36 force field, and TIP3P model were selected to simulate the system, force field, water model. After setting the ion concentration at 0.145M, the system was heated to 310 K and 1bar, respectively. The MDs were performed at 100 ns. The cut-off value for the non-bond interaction was set to 1.2 nm, and the interaction of long distance electrostatic is calculated. The root mean square deviation (RMSD) and the root mean square fluctuation (RMSF) of atomic position were analyzed.
Statistical Analysis
The GraphPad Prism (Version 8) software (https://www.graphpad.com/) was used for statistical analysis. Measurement data were expressed as means ± standard deviation (SD) and analyzed by one-way ANOVA with Tukey multiple comparison test. A P<0.05 indicated statistically significant difference.
Results
TG May Significantly Reduce Neuronal Damage, Decrease p-Tau and Aβ1-42 Production, and Improve Learning and Memory Functions in AD Mice
The escape latency in the AD group was significantly higher than that in the control group (P<0.05). The escape latency in the TG-H group was significantly lower than that in the AD group (P< 0.05). There was no difference in escape latency between the TG-L group and the AD group (P>0.05) (Figure 1B–D). In addition, the number of platform crossings was significantly lower in the AD group than in the control group (P<0.05). The number of platform crossings was significantly higher in the TG-H group than that in the AD group (P<0.05). The difference in the number of platform crossings between the TG-L group and the AD group was not statistically significant (P>0.05) (Figure 1B–D). These data suggested that high-dose of TG may effectively improve memory and cognitive function in AD mice.
HE staining revealed that the hippocampal neurons in the control group were regularly arranged, with clear edges and clear nuclei and nucleoli (Figure 2A–D). While, the hippocampal neurons in the AD group were irregularly arranged, with blurred structures, shrunken nuclei, and deep staining. Compared to the AD group, the TG-H group had more cell layers, a larger cytosol, and a clearer structure. The hippocampal neurons in the TG-L group were irregularly arranged, with a blurred structure, shrunken nuclei, and dark staining (Figure 2A–D). These results indicated that a high dose of TG may reduce the damage of hippocampal neuron in AD mice.
 |
Figure 2 The morphologic changes of neurons in the hippocampus of AD mice detected by HE and Nissl’s staining. A-D. The results of HE staining (Scale bars: 20 µm, 200µm). (A) control; (B) AD; (C) TG-L; (D) TG-H. E-H. Nissl’s stained brain sections from each group (Scale bars: 20 µm, 200µm). (E) control; (F) AD; (G) TG-L; (H) TG-H. (I) The comparison of the number of hippocampus neuron among groups. Data was expressed as the means ± standard deviation (SD) (n =6). “**” means P < 0.05. All experimental results were performed in triplicates. |
The Nissl’s staining results showed that the number of neuron was observed to be significantly lower in the AD group when compared with that in the control group (P < 0.05) (Figure 2E–I). Compared with the AD group, the number of neuron in the TG-H group, but not the TG-L group, was significantly higher (P < 0.05) (Figure 2E–I). Thus, high-dose of TG could significantly reduce the neuronal loss.
The expressions of p-Tau and Aβ1-42 in the mice hippocampus in the AD group were significantly higher than those in the control group (P<0.05). Compared to the AD group, the expressions of p-Tau and Aβ1-42 in the mice hippocampus in the TG-H group (P<0.05), but not the TG-L group (P>0.05) were significantly lower (Figure 3A–J). Moreover, the expressions of Aβ1-42 and p-Tau proteins were identified via ELISA and western-blotting separately. The results revealed that the expressions of Aβ1-42 and p-Tau proteins in the AD group were significantly higher than those in the control group, while they were significantly lower than those in the TG-H group, which indicated that TG could reduce the production of Aβ1-42 and p-Tau proteins (Figure 3K–M).
 |
Figure 3 The effect of TG on AD mice model by immunohistochemistry (IHC). (A–D) The IHC results of Aβ1-42 (Scale bars: 20 µm, 200µm). (E–H) The IHC results of p-tau (Scale bars: 20 µm, 200µm). (I and J) The comparisons of expression of Aβ1-42 and p-tau between groups. (I) Aβ1-42; (J) p-tau. (K) The comparison of Aβ1-42 levels detected by ELISA. (L) The Western blotting images of p-Tau and Tau proteins. (M) The comparison of expression of p-tau protein between groups. Data was expressed as the means ± standard deviation (SD). (n =6). “**” means P < 0.05. All experimental results were performed in triplicates. |
Furthermore, the accumulation of p-Tau in neurons was detected by NeuN/p-Tau immunodouble labeling fluorescence staining. The NeuN protein localized in the nucleus and cytoplasm. The p-tau protein localized in cytoplasm and cell membrane. And NeuN and p-Tau proteins were co-expressed in hippocampal neurons (Figure 4A–Q). The average fluorescence intensities of NeuN and p-Tau proteins showed a significantly decreasing expression of p-Tau in the TG-H group compared to the AD group (P<0.05) (Figure 4R–S). These results further confirmed that TG may effectively reduce the production of p-Tau.
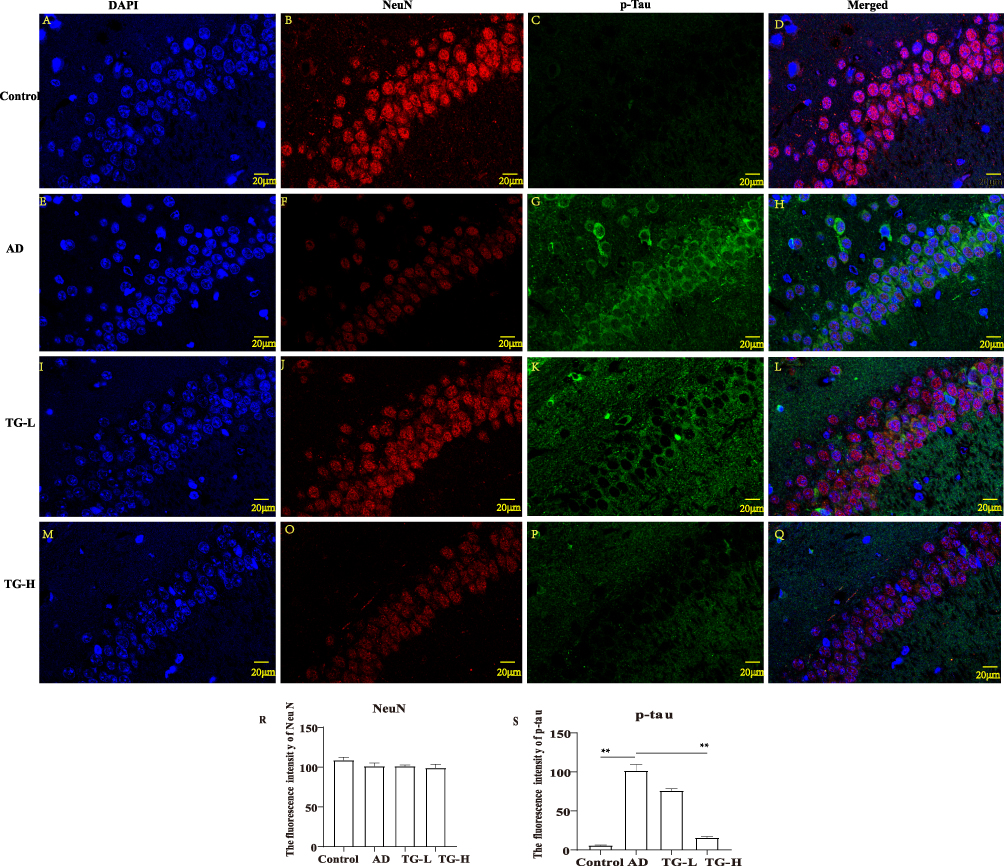 |
Figure 4 The co-expression of NeuN and p-Tau proteins in hippocampus neuron. (A), (E), (I), (M) Immunofluorescence images of DAPI. (B), (F), (J), (O) Immunofluorescence images of NeuN. (C), (G), (K), (P) Immunofluorescence images of p-Tau. (D), (H), (L), (Q) Merged immunofluorescence images between groups (Scale bars: 20 µm). (R) Comparison of the fluorescence intensities of NeuN and p-Tau between groups. (R) NeuN; (S) p-Tau. “**” means P < 0.05. All experimental results were performed in triplicates. |
TG May Reverse Hippocampal Metabolites Disorder in AD Mice
The chromatographic mass spectral peaks of the mouse hippocampal tissue samples were clearly separated and evenly distributed (Supplemental file Figure 1). The results of PCA, PLS-DA, and OPLS-DA analysis showed that the metabolites in the control, AD, and TG groups were in high intragroup clustering and significant among groups both in GC/MS and LC/MS (Figure 5A–H). The parameters including R2X(cum), R2Y(cum), Q2(cum), R2, and Q2 used in measuring the PLS-DA and OPLS-DA models were listed in the Supplemental file Table 1. The volcano plots and clustering diagrams of DEMs are shown in Figure 6A–6D. There were 103 DEMs (42 upregulated and 61 downregulated) between the AD group and the control group (Supplemental file Table 2) and 96 DEMs (62 upregulated and 34 downregulated) between the TG group and the AD group (Figure 6E) (Supplemental file Table 3). A total of 49 common DEMs among the control, AD, and TG groups were found (Figure 6F) (Supplemental file Table 4).
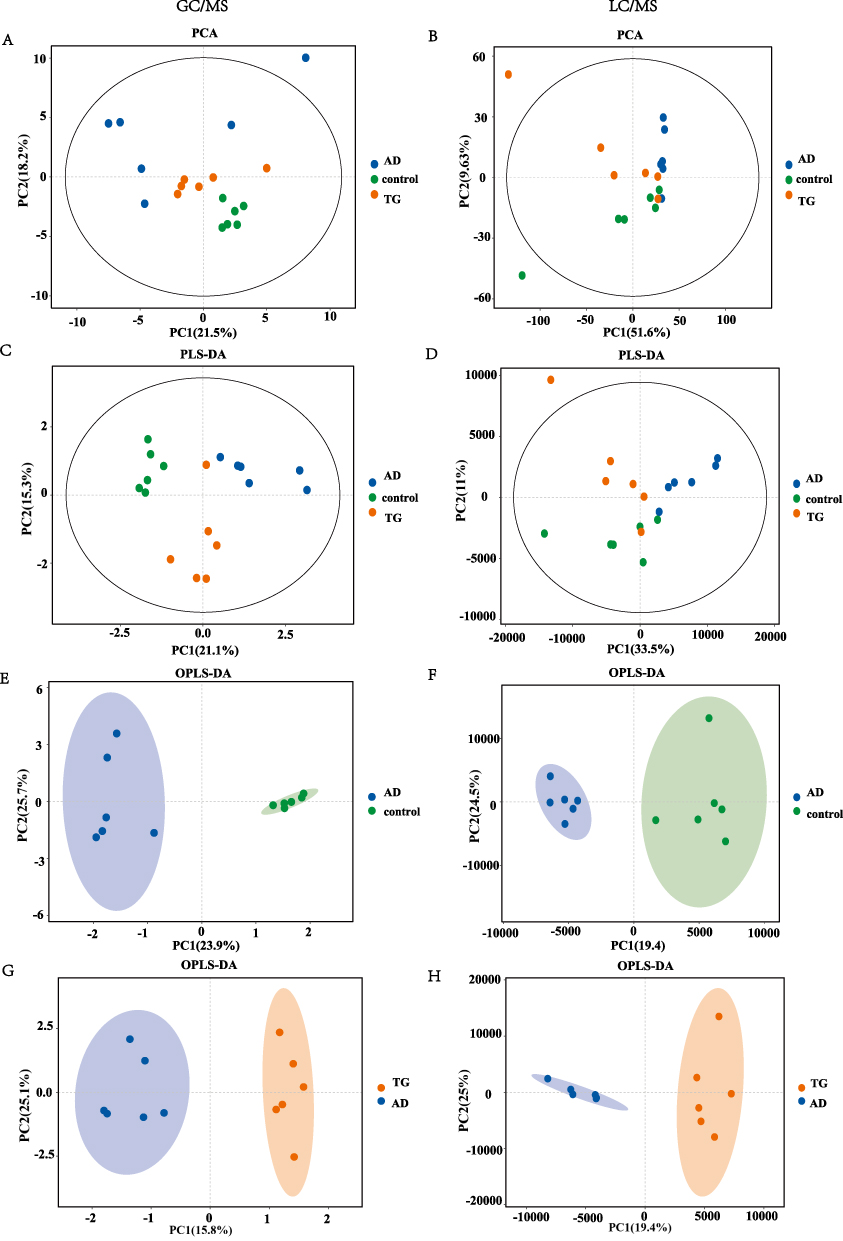 |
Figure 5 The PCA, PLS-DA, and OPLS-DA in GC-MS and LC-MS/MS. (A and B) PCA analysis of the three groups. (A) GC-MS. (B) LC-MS/MS. (C and D) (C) PLS-DA analysis between groups. (C) GC-MS; (D) LC-MS/MS. (E and F) OPLS-DA score plot between the AD and control groups. (E) GC-MS. (F) LC-MS/MS. (G and H) OPLS-DA score plot between AD and TG groups. (G) GC-MS. (H) LC-MS/MS. |
 |
Figure 6 Hippocampus metabolomics of the control, AD, and TG groups. (A and B) Volcano plot of metabolomics between groups. (A) AD group vs Control group; (B) AD group vs TG group. (C and D) Heatmap of the DEMs between groups. (C) AD group vs Control group; (D) AD group vs TG group. (E) Number of DEMs between groups. (F) Venn diagram of differential metabolites. |
The top 10 DEMs with the highest VIP values were used to plot a LolipopMap. Compared with those in the control group, the levels of 4-methyltridecanoylcarnitine (fatty acyls) (P<0.05), PC (20:0/18:3(9Z,12Z,15Z)) (glycerophospholipids) (P<0.05), histidylproline (carboxylic acids and derivatives) (P<0.05), and tetraethylene glycol monododecyl ether (organooxygen compounds) (P<0.05) were significantly lower in the AD group. While, PGP (6 keto-PGF1alpha/20:1(11Z)) (fatty acyls) (P<0.001), PG (19:1(9Z)/15:0) (glycerophospholipids) (P<0.01), PC (P-18:0/20:3(6,8,11)-OH(5)) (glycerophospholipids) (P<0.05), and thiabendazole (benzimidazoles) (P<0.01) significantly elevated in the AD group (Figure 7A). The levels of the above metabolites significantly reversed after TG intervention (Figure 7B). These results indicates that TG may modulates various metabolites, especially glycerophospholipids, and fatty acyls, in the hippocampus of AD mice.
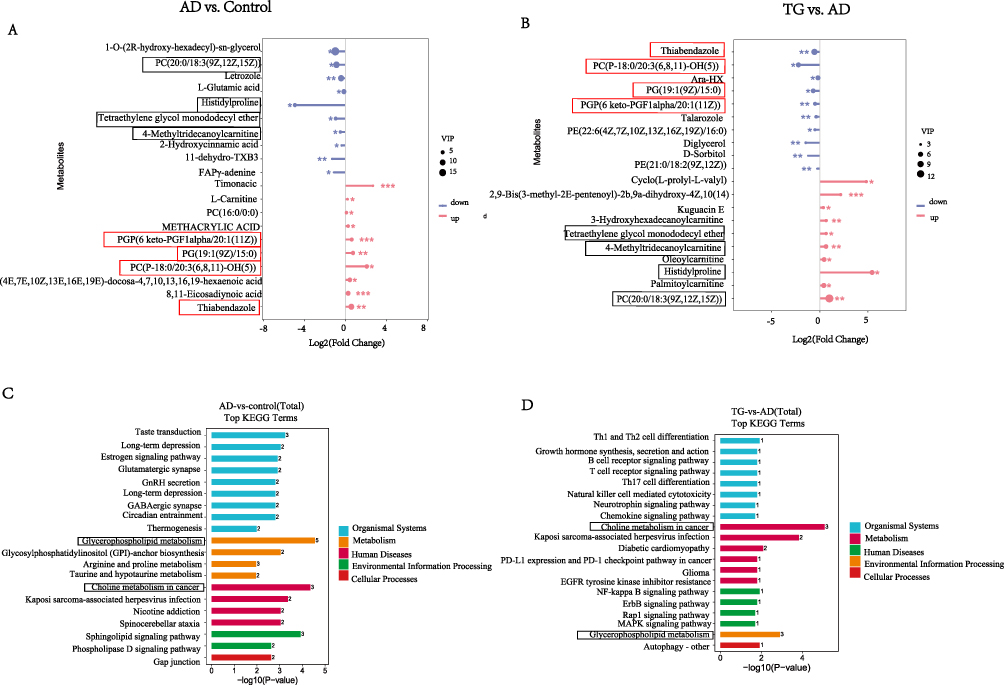 |
Figure 7 Analysis of hippocampus DEMs. (A and B) Lolipopmap of differential metabolites between groups. (A) AD group vs Control group; (B) AD group vs TG group. Red indicates upward adjustment, blue indicates downward adjustment, and asterisks indicate significance of DEMs (* means 0.01< P <0.05; ** means 0.001< P <0.01; *** means 0.0001< P <0.001), and the size of the dots is determined by VIP values. (C and D) KEGG pathway terms enriched by DEMs of hippocampus between groups. (C) AD group vs Control group; (D) AD group vs TG group. |
KEGG pathway enrichment analysis shown 137 and 97 metabolic pathways were enriched in the AD vs control and TG vs AD comparisons, respectively. The glycerophospholipid metabolism, choline metabolism in cancer, and the sphingolipid signaling pathway were the top 3 enriched pathways in the AD vs control comparison. The choline metabolism in cancer, Kaposi sarcoma-associated herpesvirus infection, and glycerophospholipid metabolism were the top 3 enriched pathways in the TG vs AD comparison (Figure 7C–D). 93 common metabolic pathways were found between the AD vs control comparison and TG vs AD comparison (Supplemental file Table 5). Taken together, these findings suggest that TG may modulate hippocampus metabolism and the consequent synthesis of metabolites, particularly choline and glycerophospholipids.
TG Might Alter the composition of the Gut Microbiota in AD Mice
The α diversity results indicated that the Ace and Chao1 indices (P<0.01), but not the Simpson and Shannon indices (P>0.05), were significantly lower in the AD group than those in the control group (Supplemental file Table 6). Compared with those in the AD group, the Ace and Chao1 indices, but not the Simpson and Shannon indices (P>0.05), were significantly greater in the TG group (P<0.01) (Supplemental file Table 6). PCoA analysis indicated that there were significant separations between the groups. The contribution of PCoA difference were 16.44% (AD vs control) and 15.79% (TG vs AD) separately (Figure 8A and B). The degree of taxonomic similarity between the bacteria revealed that Bacteroidetes (control: 57.9%; AD: 60.5%; TG: 53.9%) and Firmicutes (control: 34.9%; AD: 30.6%; TG: 32.6%) were the major phyla among groups (Figure 8C and D). The Firmicutes/Bacteroidetes (F/B) ratio in the AD group (0.51) was lower than that in the control group (0.60) and higher than that in the TG group (0.60). The above results suggested that TG might increase the abundance of gut microbiota in AD mice.
 |
Figure 8 16S rRNA analysis in the control, AD, and TG groups. (A and B) PCoA analyses between groups. (A) AD group vs control group. (B) AD group vs TG group. (C and D) Percent of community abundance at the phylum level between groups. (C) AD group vs control group; (D) AD group vs TG group. (E and F) Boxplot of differential species at the genus level between groups. (E) AD group vs control group; (F) AD group vs TG group. (G and H) Histogram of the LDA scores of differential abundant gut microbiota between the groups. (G) AD group vs control group; (H) AD group vs TG group. (I and J) Heatmap of the KEGG pathway analysis between groups. (I) AD group vs control group; (J) AD group vs TG group. |
The presence of certain lipid and glucose metabolism-associated bacterial species, such as Alistipes and Aeromonas, is considered a health concern. In our study, the abundances of Alistipes and Aeromonas in the control group were significantly greater than those in the AD group (P<0.05). However, the abundance of Alistipes but not Aeromonas significantly decreased after TG intervention (Figure 8E and F). The LEfSe results revealed that the TG-treated mice presented a decreased abundance of Alistipes but not Aeromonas (Figure 8G and H). The KEGG pathway results revealed that the enriched pathways in the TG group were associated primarily with choline and lipid metabolism, especially sphingolipid and glycosphingolipid metabolism (Figure 8I and J).
Interaction Between the Gut Microbiota and Metabolites
At the genus level, Aeromonas and Alistipes were significantly correlated with DEMs in both the AD vs control and TG vs AD comparisons. For the AD vs control comparison, 2-amino-5-nitrophenol, allopurinol, PGP (6 keto-PGF1alpha/20:1(11Z)), PS(18:1(9Z)/0:0), and thiabendazole were negatively correlated with Aeromonas and Alistipes. While, creatinine, Glc-GP(18:0/20:4(5Z,8Z,11Z,14Z)), PG(16:0/22:6(4Z,7Z,10Z,13Z,16Z,19Z)), and PGP(i-19:0/18:1(12Z)-O(9S,10R)), were positively correlated with Aeromonas and Alistipes (Figure 9A). After treatment with TG, 2-amino-5-nitrophenol, allopurinol, PGP (6 keto-PGF1alpha/20:1(11Z)), PS (18:1(9Z)/0:0), and thiabendazole were positively correlated with Alistipes but not Aeromonas. In addition, creatinine, Glc-GP(18:0/20:4(5Z,8Z,11Z,14Z)), PG(16:0/22:6(4Z,7Z,10Z,13Z,16Z,19Z)), and PGP(i-19:0/18:1(12Z)-O(9S,10R)) were negatively correlated with Alistipes but not Aeromonas (Figure 9B). Taken together, these results indicated that the therapeutic effect of TG may be associated with the metabolism of glycerophospholipids, and Alistipes may play a role in glycerophospholipids metabolism.
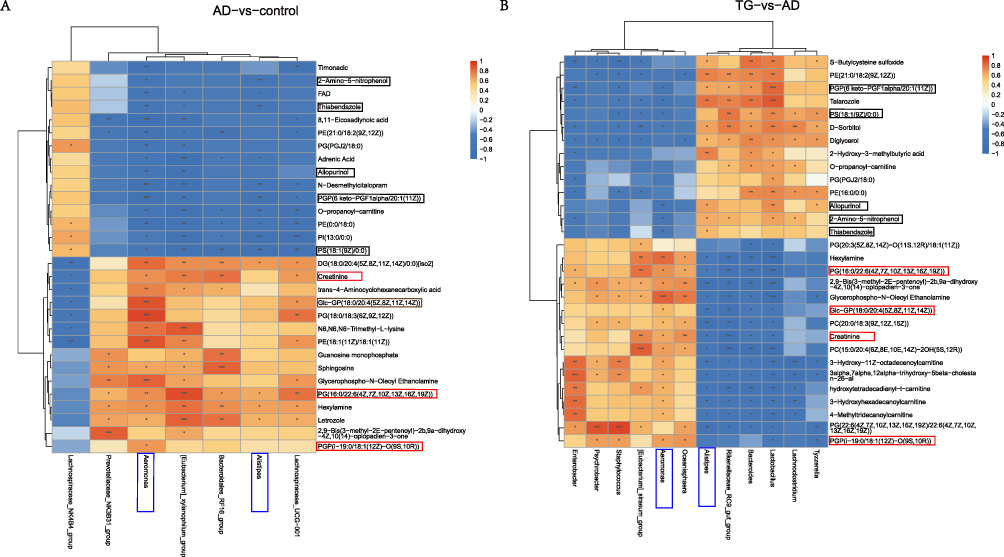 |
Figure 9 Spearman analysis heatmap between the control, AD, and TG groups (A) AD group vs Control group. (B) AD group vs TG group.“*” means P < 0.05, “**” means P < 0.01, and “***” means P < 0.001. Orange-red indicates positive correlation, blue indicates negative correlation. |
Prediction of potential Drug-Target Pathways Associated with the Anti-AD Activity of TG
A total of 29 TG active compounds were obtained through the TCMSP (OB ≥ 30% and DL ≥ 0.18), HERB databases, and existing references (Table 1). And 271 targets of the 29 active compounds were obtained. In addition, a total of 2,052 AD-related targets were obtained after taking the intersection. Finally, 146 intersecting targets were identified (Figure 10A). The PPI network based on 146 common targets involved 146 nodes and 5,097 edges (Figure 10B). The CASP3, SRC, EGFR, ESR1, HIF1A, PTGS2, and MMP9 might be the hub targets in the PPI network (Figure 10C and D). GO enrichment analysis identified 3,149 GO terms (Figure 10E). KEGG pathway enrichment analysis revealed 250 AD-related pathways, including Alzheimer’s disease (hsa05010) and the lipid and atherosclerosis pathway (hsa05417) (Figure 10F). And the western-blotting results showed that the p-SRC significantly increased in the AD group compared to the control group (P<0.05), while significantly decreased after TG treatment compared to the AD group (P<0.05) (Figure 10G–I).
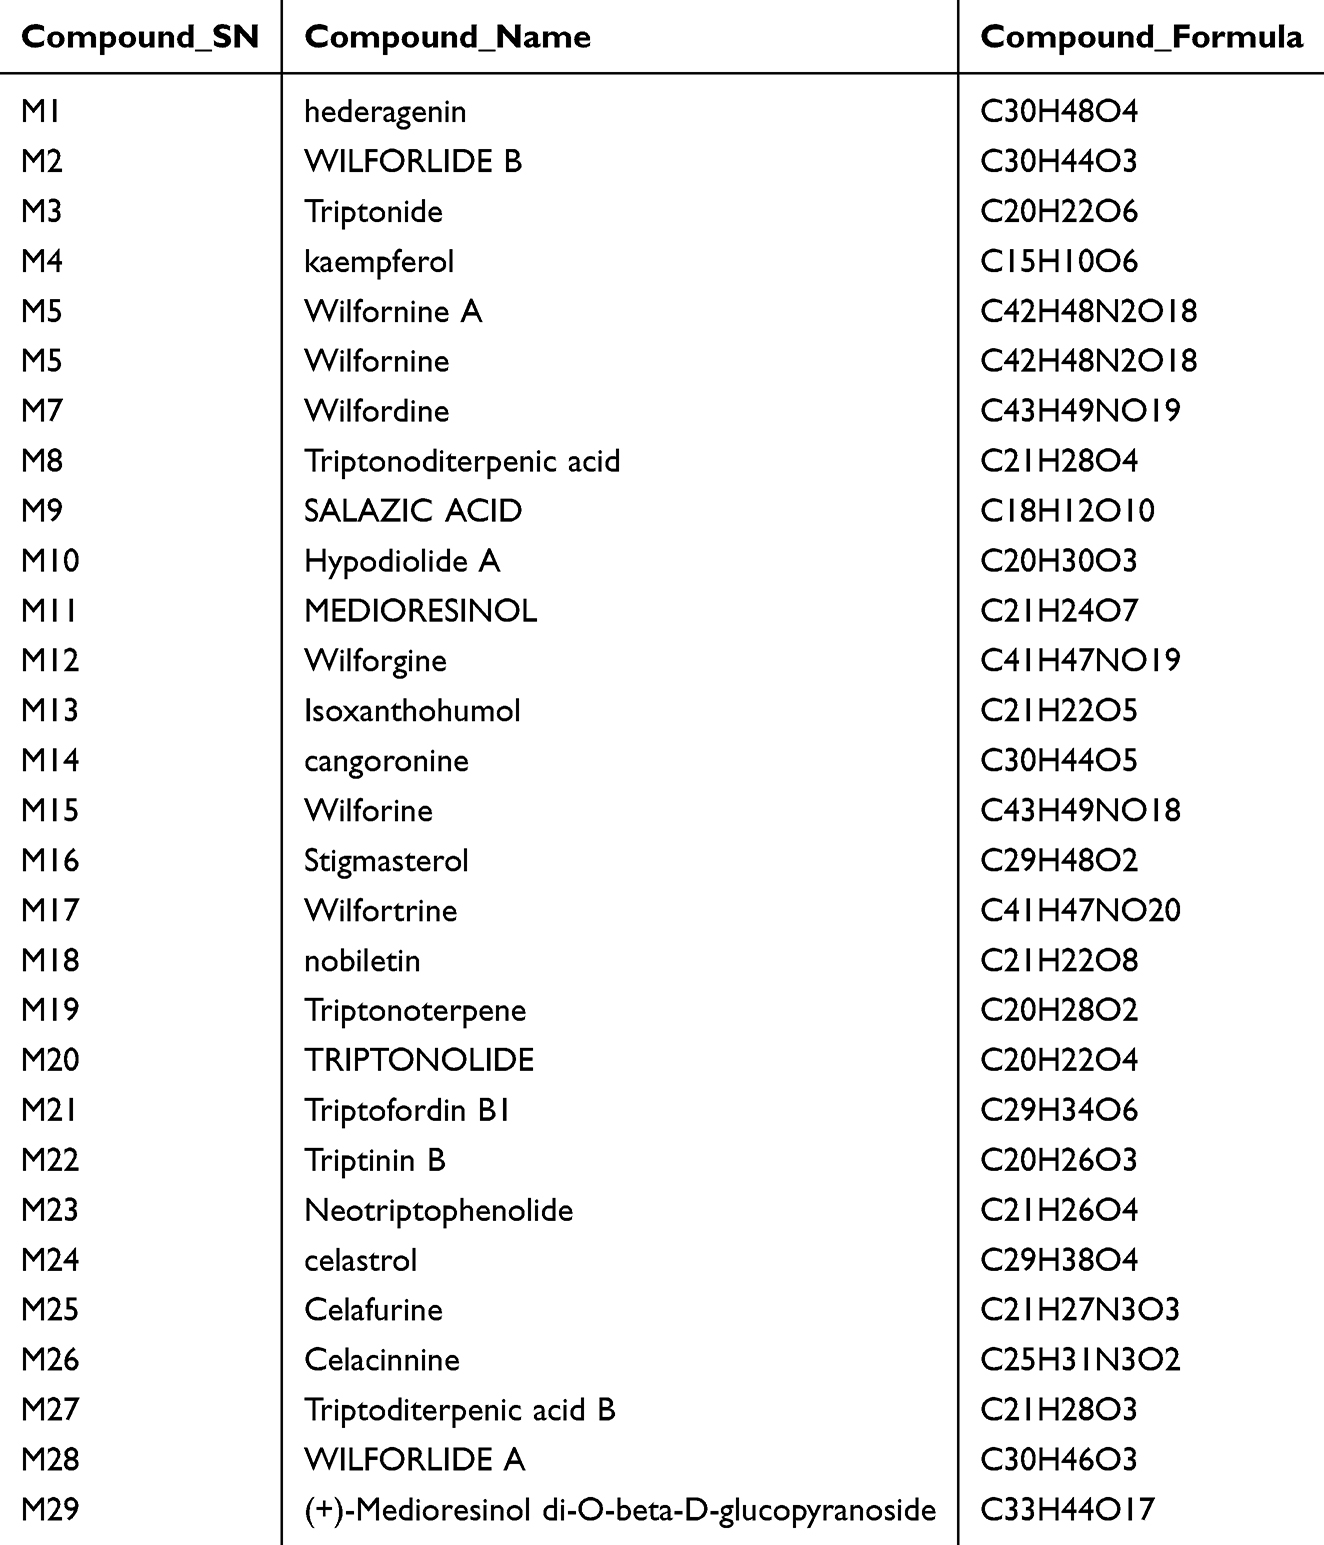 |
Table 1 The Information of 29 Active Compounds in Tripterygium Glycoside |
 |
Figure 10 Network pharmacology of TG active compounds. (A) Venn of TG active compounds targets and AD targets. (B) PPI network of potential targets for TG active compounds treated for AD. (C) Hub targets based on MCC, MNC, Degree, EPC, Closeness, and Betweenness algorithms. (D) The frequency of hub targets occurrence. (E) GO analysis of hub targets. (F) KEGG pathway analysis of hub targets. (G) Western blotting image in the control, AD, TG-L, and TG-H groups. (H and I) The comparison of the expressions of p-Src and Src proteins among groups. (H) p-Src proteins; (I) Src protein. “**” means P < 0.05. |
In addition, the 29 active compounds in the drug-compound-target network corresponded to 146 targets with 329 edges (Supplemental file Figure 2). The compound-target pathway revealed that the top 5 active compounds were M12 (Wilforgine), M21 (triptofordin B1), M5 (Wilfornine A), M6 (Wilfornine), and M19 (triptonoterpene). Notably, TG might have a regulatory effect on lipid metabolism-associated pathways (lipid and atherosclerosis pathway (hsa05417)) via hub targets, including CASP3, SRC, MAPK3, PPARG, and MMP9 (Supplemental file Figure 3). Thus, the 5 hub targets and the top 5 active compounds were selected for molecular docking analysis.
Molecular docking analysis revealed that 4 of the top 5 active compounds of TG (Wilforgine, triptofordin B1, wilfornine A, and triptonoterpene) were in relatively stable docking with the active pocket of SRC protein (Table 2 and Figure 11A–D). Triptonoterpene forms hydrogen bonds with SRC at LYS155 and TYR93. Triptofordin B1 forms a hydrogen bond with SRC at THR250. Wilforgine forms hydrogen bonds with SRC to LYS155 and ASN138. Wilfornine A forms hydrogen bonds with SRC at THR157, LYS404, GLN254, and ASN138 (Figure 11A–D). And the Pi-Alkyl, Alkyl, and π-π stacking are shown in the Figure 11A–D. To investigate the stability of Wilforgine, triptofordin B1, wilfornine A, and triptonoterpene combined to SRC protein, the MDs was performed out. The results revealed that the RMSDs of SRC and Wilforgine, Triptofordin B1, Wilfornine A, and Triptonoterpene reached equilibrium at 2–3ns in the 100ns simulation, indicating that the system of SRC and Wilforgine, Triptofordin B1, Wilfornine A, and Triptonoterpene quickly reached a stable state without excessive fluctuations (Figure 11E–H). The value of RMSF ranged from 0.1nm to 0.6nm, which was in a low flexibility stable state when combined with Wilforgine, Triptofordin B1, Wilfornine A, and Triptonoterpene (Figure 11I–L).
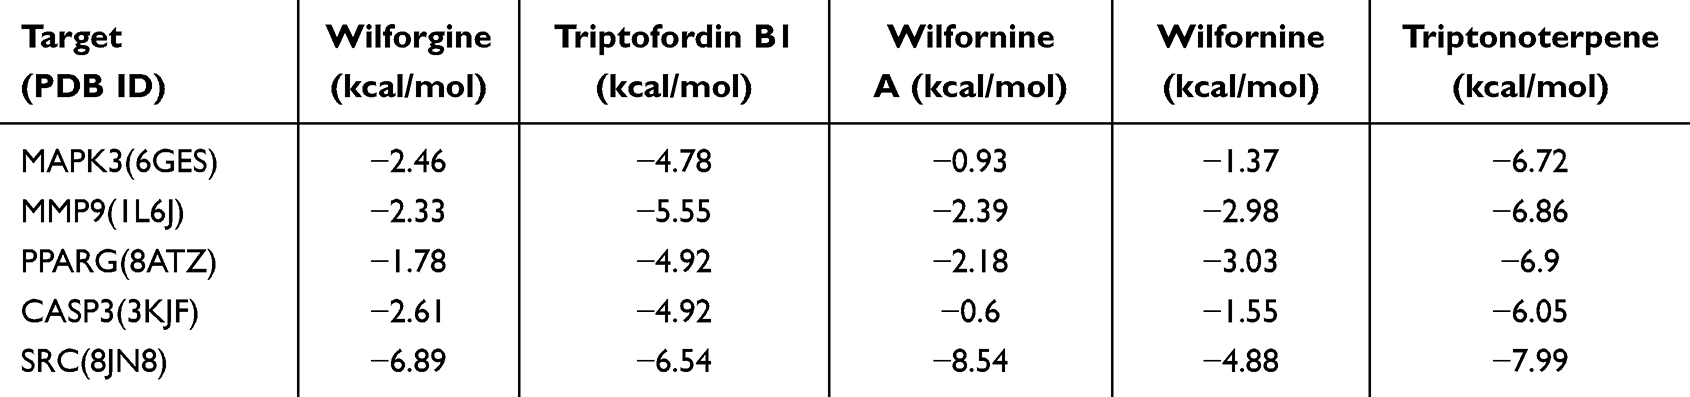 |
Table 2 The Binding Free Energy of Molecular Docking |
 |
Figure 11 Results of molecular docking and molecular dynamics simulation of active compounds and hub targets. (A) SRC(8JN8)-Triptonoterpene binds to two residues (SRC: TYR-93 and LYS-155). (B) Triptofordin B1 binds to one residue (SRC: THR-250). (C) Wilforgine binds to five residues (SRC: GLU-323, LYS-155, and ASN-138). (D) Wilfornine A binds to four residues (SRC: LYS-404, THR-157, GLN-254, and ASN-138). (E–H) The RMSDs of SRC and Wilforgine, Triptofordin B1, Wilfornine A, and Triptonoterpene. (I–L) The RMSFs of SRC and Wilforgine, Triptofordin B1, Wilfornine A, and Triptonoterpene. |
Discussion
TG has been proposed as a potential drug for AD treatment.19–21 In the present study, we explored the potential mechanism of TG against AD in mice model. Collectively, the present study found that TG may have an effect on gut microbiota restoration and metabolite regulation via SRC protein, and that Alistipes might significantly affect glycerophospholipid metabolism, suggesting a promising therapeutic target for TG-mediated AD treatment.
Initially, the metabolomic results revealed that the levels of glycerophospholipids such as PG (19:1(9Z)/15:0) and PC (P-18:0/20:3(6,8,11)-OH(5)) significantly increased and the level of PC (20:0/18:3(9Z,12Z,15Z)) significantly decreased in the AD group. Glycerophospholipids play a crucial role in many cellular functions, such as cell membrane formation, energy storage, and cell signaling.53 Growing evidence suggested that lipid homeostasis in the nervous system is significantly altered during neurodegenerative diseases, including PD and AD.54–59 Walter et al60 demonstrated that phosphatidylinositol (PI) levels were significantly reduced in the anterior temporal lobe cortex of the brains of AD patients, with a trend toward reduced levels of PI phosphate (PIP) and PI-4,5- diphosphate (PIP2). Yin et al indicated there are differences in the distribution of phospholipids in different brain regions during AD pathogenesis and at different stages of the AD process.61 A previous study also clarified that the levels of phosphatidylcholines (PCs), including PC (22:6(4Z,7Z,10Z,13Z,16Z,19Z)/0:0) and PC (17:1(9Z)/18:2(9Z,12Z)), increased in AD patients, and the increase in PCs may be related to the aggregation of Aβ in the cerebrospinal fluid.38 Moreover, Yu et al hypothesized that TG may alter lysophosphatidylcholine (LPC) metabolic profiles and levels in rat serum by affecting the expression levels and activities of metabolic enzymes such as lysophosphatidylcholineacyltransferase (LPCAT), phospholipase A2 (PLA2) and autotaxin (ATX).62 The contents of the above glycerophospholipids were reversed after TG intervention. These results suggested that TG may influence the development of AD by regulating glycerophospholipid metabolism.
Additionally, compared with the control group, the F/B ratio in the AD group was decreased. And TG could restore gut dysbiosis by increasing the F/B ratio. To the best of our knowledge, gut microbiota could involved in signaling between the gut and the brain,63 which might influence central nervous system function through the gut‒brain axis.64 The changes of the diversity and abundance of gut microbiota in patients with AD and a link between dysbiosis of the gut microbiota and the pathological process of AD has been confirmed.23 According to the study by Vogt et al,24 there was a significant decrease in the diversity of the Bacteroidetes and a decrease in the abundance of the Firmicutes and bifidobacterium (bifidus) between the patients with AD and controls. And Liu et al65 demonstrated that there were large differences in the Bacteroidetes at different stages of AD development. The abundance of Bacteroidetes increased in the early stages of AD development and then decreased with increasing severity of cognitive deficits. As Chen et al clarified that there were decreased Firmicutes and increased Bacteroidetes in 5XFAD mice compared to WT mice.66 Imbalance of the Firmicutes and Bacteroidetes might lead to chronic intestinal inflammation, damage to the intestinal barrier, induce systemic chronic inflammation and reactive glial cell proliferation, as well as Aβ deposition, Tau hyperphosphorylation, and then cognitive impairment.67 Shen et al have provided evidence that a reduction in Firmicutes and an increase in Bacteroidota abundance were associated with early-stage Aβ accumulation in the intestines of AD models.68 In addition, the gut microbiota could also affect cognitive ability through the short-chain fatty acid (SCFA)s, which could directly enter the brain through the blood–brain barrier (BBB) to exert their physiological functions69 As Ho et al advocated that the decreased levels of key SCFA-producing bacteria, such as Firmicutes, hinder the reversal of Aβ aggregation.70 Our study revealed that the expression of Aβ in the hippocampus of AD model mice was significantly higher compared to the control group, while the F/B ratio was markedly lower. In this regards, our results were consistent with previous studies. Furthermore, studies have highlighted the close relationship between TG and the gut microbiota in RA,32,71 UC33, and Epithelial ovarian cancer (EOC),18 but not in AD. In our results, lower expression of Aβ and higher F/B ratio were detected after treated with TG. To our knowledge, this is the first time that TG might influence the F/B ratio in the AD mice model was reported, which suggested TG may have a effect of regulating gut microbiota in AD mice.
Additionally, the abundance of Alistipes (associated with lipid metabolism72) was found to be increased in the AD group and decreased after TG intervention. Alistipes is a common bacteria in the human gut, which is closely related to host health and disease, and its abundance changes in different diseases have certain heterogeneity. Studies have shown that Alistipes may have a protective effect on specific diseases including colitis, abnormal lipid metabolism and pancreatic cancer, while it might be pathogenic in colorectal cancer and nervous system diseases.73,74 As Dunham et al demonstrated that the abundance of Alistipes increases in AD patients and was enriched in elderly mice and AD model mice.75 Our results were consistent with previous study. And we observed that TG intervention might reduce the abundance of Alistipes. Abnormal release of inflammatory cytokines accelerates neurodegeneration and Aβ plaque accumulation was important factors in AD progress.76,77 Alistipes, as a conditioned pathogen, was shown to be related to inflammation in rodents,78 and was reported to be linked with lipid metabolism.57 Therefore, an imbalance in Alistipes abundance may lead to disorders of lipid metabolism, which in turn may lead to impaired function and structure of the gut microbiota. In the present study, TG intervention could decrease glycerophospholipid levels, including PG(19:1(9Z)/15:0) and PC(P-18:0/20:3(6,8,11)-OH(5)) levels, in AD mice, which was associated with a decrease in the abundance of Alistipes. Collectively, our findings may underscore the importance of TG in mediating glycerophospholipid metabolism by decreasing the abundance of Alistipes.
Furthermore, we found that the therapeutic effect of TG on AD may be mediated via a variety of signaling pathways, especially lipid metabolism-related pathways. TG had a regulatory effect on hub targets, including CASP3, SRC, MAPK3, PPARG, and MMP9, in the lipid metabolism-associated pathway. Molecular docking results revealed that wilforgine, triptofordin B1, wilfornine A, and triptonoterpene stable binding to the active pocket of the SRC protein. SRC tyrosine protein kinases, a family of tyrosine-specific protein kinases, were important in Aβ accumulation and regulation of tau phosphorylation.79 Phosphorylation of Src at Tyr416 could increase the activity of Src, thus promoting the phosphorylation of protein phosphatase 2Ac (PP2Ac),80 which was reported to play a key role in inhibiting tau hyperphosphorylation in AD patients.81 In addition, Jiang et al, has shown that Tyr/Y phosphorylation of Tau proteins was mediated mainly by the Src family of kinases.82 By inhibiting the activity of Src, the accumulation of p-Tau can also be effectively reduced.79 In the present study, the phosphorylation level of SRC (p-SRC), expressions of Aβ and p-tau were found significantly increased in the AD group, while decreased in the TG-H group, which was consistent with the previous studies. Thus, the results indicated that TG may reduce the accumulation of p-Tau and Aβ via inhibiting the expression of p-SRC.
Moreover, molecular docking and molecular dynamics simulation analysis confirmed the affinity of SRC for wilforgine, triptofordin B1, wilfornine A, and triptonoterpene in TG, suggesting that this protein may serve as a potential target for TG in AD treatment. As reported in previous study, a binding free energy less than −5 kcal/mol was considered to be in stable bind between the receptor and the ligand.51,52 We found that SRC has better binding affinity to wilforgine, triptofordin B1, wilfornine A, and triptonoterpene in TG. In MDs testing, wilforgine-SRC, triptofordin B1-SRC, wilfornine A-SRC, and triptonoterpene-SRC could be combined relatively stably and the result was consistent with that of molecular docking. Among the 4 pairs of docking, there were 4 hydrogen bond in the wilfornine A-SRC, and a lowest binding free energy was detected, which indicated that hydrogen bonding might be the most crucial factor for its stable combination, and the wilfornine A might be a major active compound in TG against AD. Recent study noted that Wilforlide A could ameliorate M1 macrophage polarization in RA through TLR4/NF-κB signaling pathway.83 And Wilforlide A could protect lupus nephritis by attenuating the IL-17 expression in MRL/lpr mice.84 Whereas, there was no report that Wilforlide A has an improving effect on AD. It is speculated that its specific mechanism of action may be by binding to SRC, affecting the phosphorylation of SRC and PP2A, and subsequently leading to the accumulation of Aβ and p-tau, which still required further experimental verification.
While our study elucidated the therapeutic potential of TG in AD, it is important to acknowledge its limitations. First, although we have found that TG has an intervention effect on AD models, it has not been further confirmed in other animal models such as APP/PS1 transgenic mice and cell models. It is necessary to verify the effect of TG in multiple models in the future. Second, Alistipes might play an important role in TG treating AD. However, it has not yet been verified through experiments such as microbiota transplantation. Third, SRC might be the key target for TG intervention in AD. Although we have initially confirmed the changes of SRC expression under TG intervention via Western blotting experiments, further experiments are still needed to verify its function and drug-target binding. Finally, it remains unclear how the gut microbiota causes brain damage in AD. Therefore, it is necessary to analyze the influence of the gut microbiota on the occurrence of AD and its specific mechanisms at the genetic and molecular levels to confirm the special fingerprints and metabolic characteristics of the AD-related gut microbiota.
Conclusions
Overall, we may concluded that TG could effectively alleviated cognitive and memory impairment and AD-like pathology by ameliorating gut microbiota dysbiosis and hippocampus metabolic disorders. Moreover, TG may regulate the lipid metabolism-related pathway via SRC protein. Taken together, our results indicated that TG might serve as a potential therapeutic drug for preventing AD via the microbiota–gut–brain axis. Our results highlight TG’ s potential as an innovative therapeutic approach, addressing cognitive decline, neuropathological changes, and gut dysbiosis in AD, and underscores the need for further research into the function of Alistipes, as well as the effect and mechanism of Wilforlide A on AD.
Acknowledgments
We greatly appreciate Shanghai Oebiotech Co, Ltd. (Shanghai, China) for 16S rRNA sequencing and metabolomics analysis.
Funding
The work was funded by the project of Regional Collaborative Innovation Special Program of Lhasa (LSKJ202465), Science and technology project of Tibet Autonomous Region (XZ202401ZY0051), Key science and technology project of Lhasa (LSKJ202413), Natural Science Foundation of Tibet (XZ202301ZR0012G), and the foundation of the education department of Hunan province (23A0661, 23B0875).
Disclosure
The authors declare no conflicts of interest.
References
1. Sengoku R. Aging and Alzheimer’s disease pathology. Neuropathology. 2020;40(1):22–29. doi:10.1111/neup.12626
2. Liu Y, Tan Y, Zhang Z, et al. The interaction between ageing and Alzheimer’s disease: insights from the hallmarks of ageing. Transl Neurodegener. 2024;13(1):7. doi:10.1186/s40035-024-00397-x
3. Tiwari S, Atluri V, Kaushik A, et al. Alzheimer’s disease: pathogenesis, diagnostics, and therapeutics. Int J Nanomed. 2019;14:5541–5554. doi:10.2147/IJN.S200490
4. Hampel H, Mesulam MM, Cuello AC, et al. The cholinergic system in the pathophysiology and treatment of Alzheimer’s disease. Brain. 2018;141(7):1917–1933. doi:10.1093/brain/awy132
5. O’Brien RJ, Wong PC. Amyloid precursor protein processing and Alzheimer’s disease. Annu Rev Neurosci. 2011;34:185–204. doi:10.1146/annurev-neuro-061010-113613
6. Naseri NN, Wang H, Guo J, et al. The complexity of tau in Alzheimer’s disease. Neurosci Lett. 2019;705:183–194. doi:10.1016/j.neulet.2019.04.022
7. Griffiths J, Grant SGN. Synapse pathology in Alzheimer’s disease. Semin Cell Dev Biol. 2023;139:13–23. doi:10.1016/j.semcdb.2022.05.028
8. Plascencia-Villa G, Perry G. Preventive and therapeutic strategies in alzheimer’s disease: focus on oxidative stress, redox metals, and ferroptosis. Antioxid Redox Signal. 2021;34(8):591–610. doi:10.1089/ars.2020.8134
9. Ozben T, Ozben S. Neuro-inflammation and anti-inflammatory treatment options for Alzheimer’s disease. Clin Biochem. 2019;72:87–89. doi:10.1016/j.clinbiochem.2019.04.001
10. Athar T, Al Balushi K, Khan SA. Recent advances on drug development and emerging therapeutic agents for Alzheimer’s disease. Mol Biol Rep. 2021;48(7):5629–5645. doi:10.1007/s11033-021-06512-9
11. Zhang Y, Mao X, Li W, et al. Tripterygium wilfordii: an inspiring resource for rheumatoid arthritis treatment. Med Res Rev. 2021;41(3):1337–1374. doi:10.1002/med.21762
12. Zhang J, Li SL, Lin W, et al. Tripterygium glycoside tablet attenuates renal function impairment in diabetic nephropathy mice by regulating triglyceride metabolism. J Pharm Biomed Anal. 2022;221:115028. doi:10.1016/j.jpba.2022.115028
13. Lin N, Zhang YQ, Jiang Q, et al. Clinical practice guideline for tripterygium glycosides/tripterygium wilfordii tablets in the treatment of rheumatoid arthritis. Front Pharmacol. 2021;11:608703. doi:10.3389/fphar.2020.608703
14. Xiao L, Xiao W, Zhan F. Targets of Tripterygium glycosides in systemic lupus erythematosus treatment: a network-pharmacology study. Lupus. 2022;31(3):319–329. doi:10.1177/09612033221076725
15. Guo HB, Peng JQ, Xuan W, et al. Efficacy of tripterygium glycosides for diabetic nephropathy: a meta-analysis of randomized controlled trials. BMC Nephrol. 2021;22(1):304. doi:10.1186/s12882-021-02487-8
16. Zhou YY, Liang HS, Yan JY, et al. Effectiveness and safety of tripterygium glycosides tablet for lupus nephritis: a systematic review and Meta-analysis. J Tradit Chin Med. 2022;42(5):671–680. doi:10.19852/j.cnki.jtcm.2022.05.001
17. Xie C, He C, Gao J, et al. Efficacy and safety of tripterygium glycosides in the treatment of hyperthyroidism: a systemic review and meta-analysis. Medicine. 2020;99(38):e22282. doi:10.1097/MD.0000000000022282
18. Zhan X, Zuo Q, Huang G, et al. Tripterygium glycosides sensitizes cisplatin chemotherapeutic potency by modulating gut microbiota in epithelial ovarian cancer. Front Cell Infect Microbiol. 2023;13:1236272. doi:10.3389/fcimb.2023.1236272
19. Tang L, Xiang Q, Xiang J, et al. Tripterygium glycoside ameliorates neuroinflammation in a mouse model of Aβ25-35-induced Alzheimer’s disease by inhibiting the phosphorylation of IκBα and p38. Bioengineered. 2021;12(1):8540–8554. doi:10.1080/21655979.2021.1987082
20. Tang L, Xiang Q, Xiang J, et al. lncRNA-associated competitive endogenous RNA Regulatory Network in an Aβ25-35-Induced AD mouse model treated with tripterygium glycoside. Neuropsychiatr Dis Treat. 2021;17:1531–1541. doi:10.2147/NDT.S310271
21. Tang L, Wang Y, Xiang J, et al. lncRNA and circRNA expression profiles in the hippocampus of Aβ25-35-induced AD mice treated with Tripterygium glycoside. Exp Ther Med. 2023;26(3):426. doi:10.3892/etm.2023.12125
22. Cattaneo A, Cattane N, Galluzzi S, et al. Association of brain amyloidosis with pro-inflammatory gut bacterial taxa and peripheral inflammation markers in cognitively impaired elderly. Neurobiol Aging. 2017;49:60–68. doi:10.1016/j.neurobiolaging.2016.08.019
23. Zhang W, Zhang X, Zhang Y, et al. Analysis of changes of intestinal flora in elderly patients with alzheimer’s disease and liver cancer and its correlation with abnormal gastrointestinal motility. J Oncol. 2021;2021:7517379. doi:10.1155/2021/7517379
24. Vogt NM, Kerby RL, Dill-McFarland KA, et al. Gut microbiome alterations in Alzheimer’s disease. Sci Rep. 2017;7(1):13537. doi:10.1038/s41598-017-13601-y
25. Wang K, Ma J, Li Y, et al. Effects of essential oil extracted from Artemisia argyi leaf on lipid metabolism and gut microbiota in high-fat diet-fed mice. Front Nutr. 2022;9:1024722.
26. Wang K, Zhou M, Gong X, et al. Starch-protein interaction effects on lipid metabolism and gut microbes in host. Front Nutr. 2022;9:1018026. doi:10.3389/fnut.2022.1018026
27. Zhu Z, Gu Y, Zeng C, et al. Olanzapine-induced lipid disturbances: a potential mechanism through the gut microbiota-brain axis. Front Pharmacol. 2022;13:897926.
28. Zeng M, Guo D, Fernández-Varo G, et al. the integration of nanomedicine with traditional Chinese Medicine: drug delivery of natural products and other opportunities. Mol Pharm. 2023;20(2):886–904. doi:10.1021/acs.molpharmaceut.2c00882
29. Hu E, Li Z, Li T, et al. A novel microbial and hepatic biotransformation-integrated network pharmacology strategy explores the therapeutic mechanisms of bioactive herbal products in neurological diseases: the effects of Astragaloside IV on intracerebral hemorrhage as an example. Chin Med. 2023;18(1):40. doi:10.1186/s13020-023-00745-5
30. Zhang WJ, Xie XF, Yan H. Effects of a compound Chinese herb on cognitive dysfunction and intestinal flora in Alzheimer’s disease model mice. Sci Technol Food Ind. 2021;42(13):345–350.
31. Liu Y, Li H, Wang X, et al. Anti-Alzheimers molecular mechanism of icariin: insights from gut microbiota, metabolomics, and network pharmacology. J Transl Med. 2023;21(1):277. doi:10.1186/s12967-023-04137-z
32. Qin ZY, Tan GY, Jiang SQ. Effect of tretinoin tablets on the intestinal flora of rats with rheumatoid arthritis. China Pharm. 2022;25(5):789–794.
33. Wu H, Yu XH, Wang HJ. Effect of Lei Gong Teng on the intestinal flora of mice with dextrose sodium sulfate-induced ulcerative colitis. Chin Traditional Herbal Drugs. 2020;51(2):387–396.
34. Di Vincenzo F, Del Gaudio A, Petito V, et al. Gut microbiota, intestinal permeability, and systemic inflammation: a narrative review. Intern Emerg Med. 2024;19(2):275–293. doi:10.1007/s11739-023-03374-w
35. Aburto MR, Cryan JF. Gastrointestinal and brain barriers: unlocking gates of communication across the microbiota-gut-brain axis. Nat Rev Gastroenterol Hepatol. 2024;21(4):222–247. doi:10.1038/s41575-023-00890-0
36. Conn KA, Borsom EM, Cope EK. Implications of microbe-derived ɣ-aminobutyric acid (GABA) in gut and brain barrier integrity and GABAergic signaling in Alzheimer’s disease. Gut Microbes. 2024;16(1):2371950. doi:10.1080/19490976.2024.2371950
37. Li C, Cai YY, Yan ZX. Brain-derived neurotrophic factor preserves intestinal mucosal barrier function and alters gut microbiota in mice. Kaohsiung J Med Sci. 2018;34(3):134–141. doi:10.1016/j.kjms.2017.11.002
38. Huo Z, Yu L, Yang J, et al. Brain and blood metabolome for Alzheimer’s dementia: findings from a targeted metabolomics analysis. Neurobiol Aging. 2020;86:123–133. doi:10.1016/j.neurobiolaging.2019.10.014
39. Li H, Tan Y, Cheng X, et al. Untargeted metabolomics analysis of the hippocampus and cerebral cortex identified the neuroprotective mechanisms of Bushen Tiansui formula in an aβ25-35-induced rat model of Alzheimer’s disease. Front Pharmacol. 2022;13:990307.
40. Tang L, Wang Y, Gong X, et al. Integrated transcriptome and metabolome analysis to investigate the mechanism of intranasal insulin treatment in a rat model of vascular dementia. Front Pharmacol. 2023;14:1182803. doi:10.3389/fphar.2023.1182803
41. Gao D, Li P, Gao F, et al. Preparation and multitarget Anti-AD activity study of chondroitin sulfate lithium in AD mice induced by combination of D-Gal/AlCl 3. Oxid Med Cell Longev. 2022;2022:9466166. doi:10.1155/2022/9466166
42. Yan M, Zhang L, Zhang LL, et al. Effects of intranasal administration of tripterygium glycoside-bearing liposomes on behavioral cognitive impairment of mice induced by central nervous system inflammation. Zhongguo Zhong Yao Za Zhi. 2023;48(9):2426–2434. doi:10.19540/j.cnki.cjcmm.20230104.301
43. Vorhees CV, Williams MT. Morris water maze: procedures for assessing spatial and related forms of learning and memory. Nature Protocol. 2006;1(2):848–858. doi:10.1038/nprot.2006.116
44. Liu L, Zhang Y, Tang L, et al. The neuroprotective effect of byu d mar 25 in LPS-induced alzheimer’s disease mice model. Evid Based Complement Alternat Med. 2021;2021:8879014.
45. Tang L, Liu L, Li G, et al. Expression profiles of long noncoding RNAs in intranasal LPS-mediated alzheimer’s disease model in mice. Biomed Res Int. 2019;2019:9642589. doi:10.1155/2019/9642589
46. Nossa CW, Oberdorf WE, Yang L, et al. Design of 16S rRNA gene primers for 454 pyrosequencing of the human foregut microbiome. World J Gastroenterol. 2010;16(33):4135–4144. doi:10.3748/wjg.v16.i33.4135
47. Callahan BJ, McMurdie PJ, Rosen MJ, et al. DADA2: high-resolution sample inference from Illumina amplicon data. Nat Methods. 2016;13(7):581–583. doi:10.1038/nmeth.3869
48. Bolyen E, Rideout JR, Dillon MR, et al. Reproducible, interactive, scalable and extensible microbiome data science using QIIME 2. Nat Biotechnol. 2019;37(8):852–857. doi:10.1038/s41587-019-0209-9
49. Zhang XY, Xin GZ, Liu JQ, et al. Identification of chemical constituents in lei gong teng polyglucoside tablets based on UPLC-QTOF/MS technique. Acta Chinese Medicine and Pharmacology. 2020;48(9):12–20.
50. Wan HN, Zhang GY, Duan F, et al. Exploring the potential mechanism of tretinoin polyglucoside in the treatment of Graves’ disease based on network pharmacology and molecular docking. Chin Trad Patent Med. 2023;45(6):2039–2045.
51. Zhu M, He Q, Wang Y, et al. Exploring the mechanism of aloe-emodin in the treatment of liver cancer through network pharmacology and cell experiments. Front Pharmacol. 2023;14:1238841. doi:10.3389/fphar.2023.1238841
52. Wang Y, Li S, Ren T, et al. Mechanism of emodin in treating hepatitis B virus-associated hepatocellular carcinoma: network pharmacology and cell experiments. Front Cell Infect Microbiol. 2024;14:1458913. doi:10.3389/fcimb.2024.1458913
53. Wong MW, Braidy N, Poljak A, et al. Dysregulation of lipids in Alzheimer’s disease and their role as potential biomarkers. Alzheimers Dement. 2017;13(7):810–827. doi:10.1016/j.jalz.2017.01.008
54. Li J, Luo J, Liu L, et al. The genetic association between apolipoprotein E gene polymorphism and Parkinson disease: a meta-Analysis of 47 studies. Medicine. 2018;97(43):e12884. doi:10.1097/MD.0000000000012884
55. Shippy DC, Ulland TK. Lipid metabolism transcriptomics of murine microglia in Alzheimer’s disease and neuroinflammation. Sci Rep. 2023;13(1):14800. doi:10.1038/s41598-023-41897-6
56. Chew H, Solomon VA, Fonteh AN. Involvement of lipids in alzheimer’s disease pathology and potential therapies. Front Physiol. 2020;11:598. doi:10.3389/fphys.2020.00598
57. Kao YC, Ho PC, Tu YK, et al. Lipids and Alzheimer’s Disease. Int J Mol Sci. 2020;21(4):1505. doi:10.3390/ijms21041505
58. Morita SY, Ikeda Y. Regulation of membrane phospholipid biosynthesis in mammalian cells. Biochem Pharmacol. 2022;206:115296. doi:10.1016/j.bcp.2022.115296
59. Maruoka M, Suzuki J. Regulation of phospholipid dynamics in brain. Neurosci Res. 2021;167:30–37. doi:10.1016/j.neures.2021.01.003
60. Walter A, Korth U, Hilgert M, et al. Glycerophosphocholine is elevated in cerebrospinal fluid of Alzheimer patients. Neurobiol Aging. 2004;25(10):1299–1303. doi:10.1016/j.neurobiolaging.2004.02.016
61. Yin F. Lipid metabolism and Alzheimer’s disease: clinical evidence, mechanistic link and therapeutic promise. FEBS J. 2023;290(6):1420–1453. doi:10.1111/febs.16344
62. Yu XC, Hu C, Zhao YM, et al. Metabolic profile of serum lysophosphatidylcholine in rats with liver injury induced by Tripterygium wilfordii multiglucoside. J Toxicol. 2024;38(1):36–42.
63. Ojeda J, Ávila A, Vidal PM. Gut Microbiota interaction with the central nervous system throughout life. J Clin Med. 2021;10(6):1299. doi:10.3390/jcm10061299
64. Pluta R, Ułamek-Kozioł M, Januszewski S, et al. Gut microbiota and pro/prebiotics in Alzheimer’s disease. Aging. 2020;12(6):5539–5550. doi:10.18632/aging.102930
65. Liu P, Wu L, Peng G, et al. Altered microbiomes distinguish Alzheimer’s disease from amnestic mild cognitive impairment and health in a Chinese cohort. Brain Behav Immun. 2019;80:633–643. doi:10.1016/j.bbi.2019.05.008
66. Chen C, Ahn EH, Kang SS, et al. Gut dysbiosis contributes to amyloid pathology, associated with C/EBPbeta/AEP signaling activation in Alzheimer’sdisease mouse model. Sci Adv. 2020;
67. Kim MS, Kim Y, Choi H, et al. Transfer of a healthy microbiota reduces amyloid and tau pathology in an Alzheimer’s disease animal model. Gut. 2020;69(2):283–294. doi:10.1136/gutjnl-2018-317431
68. Shen L, Liu L, Ji HF. Alzheimer’s disease histological and behavioral manifestations in transgenic mice correlate with specific gut microbiome state. J Alzheimers Dis. 2017;56(1):385–390. doi:10.3233/JAD-160884
69. Sun Y, Zhang H, Zhang X, et al. Promotion of astrocyte-neuron glutamate-glutamine shuttle by SCFA contributes to the alleviation of Alzheimer’s disease. Redox Biol. 2023;62:102690. doi:10.1016/j.redox.2023.102690
70. Ho L, Ono K, Tsuji M, et al. Protective roles of intestinal microbiota derived short chain fatty acids in Alzheimer’s disease-type beta-amyloid neuropathological mechanisms. Expert Rev Neurother. 2018;18(1):83–90. doi:10.1080/14737175.2018.1400909
71. Xu H, Pan LB, Yu H, et al. Gut microbiota-derived metabolites in inflammatory diseases based on targeted metabolomics. Front Pharmacol. 2022;13:919181. doi:10.3389/fphar.2022.919181
72. Wan Y, Wang F, Yuan J, et al. Effects of dietary fat on gut microbiota and faecal metabolites, and their relationship with cardiometabolic risk factors: a 6-month randomised controlled-feeding trial. Gut. 2019;68(8):1417–1429. doi:10.1136/gutjnl-2018-317609
73. Ren T, Gao Y, Qiu Y, et al. Gut microbiota altered in mild cognitive impairment compared with normal cognition in sporadic parkinson’s disease. Front Neurol. 2020;11:137. doi:10.3389/fneur.2020.00137
74. Hasan R, Bose S, Roy R, et al. Tumor tissue-specific bacterial biomarker panel for colorectal cancer: bacteroides massiliensis, alistipes species, alistipes onderdonkii, bifidobacterium pseudocatenulatum, corynebacterium appendicis. Arch. Microbiol. 2022;204(6):348. doi:10.1007/s00203-022-02954-2
75. Dunham SJB, McNair KA, Adams ED, et al. Longitudinal analysis of the microbiome and metabolome in the 5xfAD mouse model of Alzheimer’s disease. mBio. 2022;13(6):e0179422. doi:10.1128/mbio.01794-22
76. Hoyles L, Snelling T, Umlai UK, et al. Microbiome-host systems interactions: protective effects of propionate upon the blood-brain barrier. Microbiome. 2018;6(1):55. doi:10.1186/s40168-018-0439-y
77. Soliman ML, Puig KL, Combs CK, et al. Acetate reduces microglia inflammatory signaling in vitro. J Neurochem. 2012;123(4):555–567. doi:10.1111/j.1471-4159.2012.07955.x
78. Caruso R, Mathes T, Martens EC, et al. A specific gene-microbe interaction drives the development of Crohn’s disease-like colitis in mice. Sci Immunol. 2019;4(34):eaaw4341. doi:10.1126/sciimmunol.aaw4341
79. Li H, Zhou X, Chen R, et al. The src-kinase fyn is required for cocaine-associated memory through regulation of tau. Front Pharmacol. 2022;13:769827.
80. Yang W, Wang X, Duan C, et al. Alpha-synuclein overexpression increases phospho-protein phosphatase 2A levels via formation of calmodulin/Src complex. Neurochem Int. 2013;63(3):180–194. doi:10.1016/j.neuint.2013.06.010
81. Iqbal K, Gong CX, Liu F. Hyperphosphorylation-induced tau oligomers. Front Neurol. 2013;4:112. doi:10.3389/fneur.2013.00112
82. Jiang Y, Li L, Wu R, et al. c-Src regulates -secretase activation and truncated Tau production by phosphorylating the E3 ligase Traf6. J Biol Chem. 2023;299(12):105462. doi:10.1016/j.jbc.2023.105462
83. Cao Y, Liu J, Huang C, et al. Wilforlide A ameliorates the progression of rheumatoid arthritis by inhibiting M1 macrophage polarization. J Pharmacol Sci. 2022148(1):116–124.
84. Li Y, Ding T, Chen J, et al. The protective capability of Hedyotis diffusa Willd on lupus nephritis by attenuating the IL-17 expression in MRL/lpr mice. Front Immunol. 2022;13:943827. doi:10.3389/fimmu.2022.943827
 © 2025 The Author(s). This work is published and licensed by Dove Medical Press Limited. The
full terms of this license are available at https://www.dovepress.com/terms
and incorporate the Creative Commons Attribution
- Non Commercial (unported, 4.0) License.
By accessing the work you hereby accept the Terms. Non-commercial uses of the work are permitted
without any further permission from Dove Medical Press Limited, provided the work is properly
attributed. For permission for commercial use of this work, please see paragraphs 4.2 and 5 of our Terms.
© 2025 The Author(s). This work is published and licensed by Dove Medical Press Limited. The
full terms of this license are available at https://www.dovepress.com/terms
and incorporate the Creative Commons Attribution
- Non Commercial (unported, 4.0) License.
By accessing the work you hereby accept the Terms. Non-commercial uses of the work are permitted
without any further permission from Dove Medical Press Limited, provided the work is properly
attributed. For permission for commercial use of this work, please see paragraphs 4.2 and 5 of our Terms.