Back to Journals » Journal of Inflammation Research » Volume 13
Integrated Gene Expression Profiling Analysis Reveals Probable Molecular Mechanism and Candidate Biomarker in Anti-TNFα Non-Response IBD Patients
Received 27 October 2019
Accepted for publication 14 January 2020
Published 12 February 2020 Volume 2020:13 Pages 81—95
DOI https://doi.org/10.2147/JIR.S236262
Checked for plagiarism Yes
Review by Single anonymous peer review
Peer reviewer comments 3
Editor who approved publication: Professor Ning Quan
Yifan Liu, Yantao Duan, Yousheng Li
Department of General Surgery, Shanghai Ninth People’s Hospital, Shanghai JiaoTong University School of Medicine, Shanghai 200011, People’s Republic of China
Correspondence: Yousheng Li
Department of General Surgery, Shanghai Ninth People’s Hospital, Shanghai JiaoTong University School of Medicine, Shanghai 200011, People’s Republic of China
Email [email protected]
Purpose: To explore the molecular mechanism and search for candidate biomarkers in the gene expression profile of IBD patients associated with the response to anti-TNFα agents.
Methods: Differentially expressed genes (DEGs) of response vs non-response IBD patients in datasets GSE12251, GSE16879, and GSE23597 were integrated using NetworkAnalyst. We conducted functional enrichment analysis of Gene Ontology and Kyoto Encyclopedia of Genes and Genomes (KEGG) pathway and extracted hub genes from the protein–protein interaction network. The proportion of immune cell types was estimated via CIBERSORT. ROC curve analysis and binomial Lasso regression were applied to assess the expression level of hub genes in datasets GSE12251, GSE16879, and GSE23597, and another two datasets GSE107865 and GSE42296.
Results: A total of 287 DEGs were obtained from the integrated dataset. They were enriched in 14 Gene Ontology terms and 11 KEGG pathways. Polarization from M2 to M1 macrophages was relatively high in non-response individuals. We found nine hub genes (TLR4, TLR1, TLR8, CCR1, CD86, CCL4, HCK, and FCGR2A), mainly related to the interaction between Toll-like Receptor (TLR) pathway and FcγR signaling in non-response anti-TNFα individuals. FCGR2A, HCK, TLR1, TLR4, TLR8, and CCL4 show great value for prediction in intestinal tissue. Besides, FCGR2A, HCK, and TLR8 might be candidate blood biomarkers of anti-TNFα non-response IBD patients.
Conclusion: Over-activated interaction between FcγR-TLR axis in the innate immune cells of IBD patients might be used to identify non-response individuals and increased our understanding of resistance to anti-TNFα therapy.
Keywords: differentially expressed genes, inflammatory bowel disease, toll-like receptor pathway, FcγR signaling, anti-TNFα therapy
Introduction
Crohn’s disease (CD) and ulcerative colitis (UC), the two common forms of inflammatory bowel disease (IBD), are the chronic and relapsing inflammatory disorder of the intestine.1 The diseases can be of great importance to the affected persons, reducing the quality of life, as well as for the society, losing labor due to sickness, treatment, and medicine.1 Millions of people in North American and Europe are affected, as well as a rapid increase in newly industrialized countries.2
While classified as separate diseases, common driving disease mechanisms have been highlighted, such as the shared genetics risk factors, chronic inappropriate immune responses pathological features as well as joint involvement of various biological pathways.1,3,4 Thus, several similar attempts have been made to treat this disease, monoclonal antibodies to anti-tumor necrosis factor α (anti-TNFα) have been one of the dominant strategies.5 However, patients must often be treated for an extended period to determine if the chosen drug is efficacious as a lack of accuracy in predicting the response of anti-TNFα agents. Meanwhile, approximately one-third of the patients benefit minimally or not at all from the treatment.5,6
This arouses a question about the molecular events that facilitate the differential response of anti-TNFα therapy. Firstly, the Fab region of anti-TNFα agents neutralizes the biological activity of soluble TNFα and induct the apoptosis of the immune cell.7 Secondly, the Fc region of anti-TNFα agents induces Antibody-dependent cellular cytotoxicity (ADCC), complement-dependent cytotoxicity (CDC), and FcγR-mediated induction of wound healing macrophages.7,8 Thirdly, the synthesis of anti-drug antibodies (ADAs) and proteolytic degradation of matrix metalloproteinase (MMP) against anti-TNFα agents may decrease drug concentration.6,9 Hence, Anti-TNFα agents may have one or more known or unknown mechanisms of taking action as well as avoiding clearance. Interestingly, some of its underlying mechanisms are on a degree of overlapping or opposite to each other.8,10 Thus, a comprehensive comparison via genetics, gene expression data, and microbe provides an excellent to investigate the molecular mechanisms of resistance to anti-TNFα agents and predictive biomarkers.11–17
So far, published studies using gene expression data from intestinal or blood samples of IBD patients collected before anti-TNFα therapy have identified several signature patterns of non-response patients.11–16 However, it is still difficult to predict the response of anti-TNFα therapy.1,6 We hypothesized that shared baseline molecular patterns may be associated with the clinical efficacy of anti-TNFα agents in IBD patients. The shared patterns in anti-TNFα non-response patients may enable its use as a predictive factor or even a novel target.
Method
Microarray Data Extraction and Processing
Six transcription datasets under accession GSE12251, GSE16879, GSE23597, GSE92415, GSE107865, and GSE42296were downloaded from the Gene expression omnibus (GEO) database (http://www.ncbi.nlm.nih.gov/geo/). GSE12251, GSE16879, GSE23597, and GSE92415 discovered the gene expression profile of intestinal tissue samples between responses and non-response IBD patients before anti-TNFα therapy.11–13,15 GSE107865 and GSE42296 explored the blood gene expression profile of IBD patients.14,18 The raw expression data underwent background correction, normalization, and summarization using the robust multi-array average (RMA) algorithm in oligo.19,20
Integration of Microarray Datasets and DEGs Screening
We integrated six cohorts of microarray datasets from three independent studies using NetworkAnalyst, a web interface for integrative statistical and visualizing tool.21 In the option of “multiple gene expression data” for the web interface, all processed expression data attaching with response status were uploaded. Following the integrity check of all uploaded data, the ComBat procedures implemented in the NetworkAnalyst tool were used to reduce potential study‐specific batch effects.22 Principal component analysis (PCA) was applied to visualize and compare the sample clustering patterns before and after batch effect adjustment. Therefore, the efficiency of batch effect removal is estimated effective size (ES) is a well-established approach to integrate different datasets for increased statistical power and cross-study validation. The fixed model was selected in the current study to identify DEGs between response and non-response patients.23 In this analysis, combined P-value <0.05 and fold change >0.85 were used as the cutoff criteria.
Functional Enrichment DEGs
We performed the Gene Ontology (GO) analysis of BP, MF, and CC enrichment analysis of DEGs through integrated Discovery (DAVID).24,25 Then, the bubble chart showing P-value, Fold Enrichment, and gene counts were used to describe essential GO terms. Later, the Clue-go plug-in app of Cytoscape was utilized to visualize KEGG results, followed by enrichment analysis of KEGG pathways by DAVID.26 We set the criteria as gene counts>5 and P-value<0.05.
Verification and Supplement of DEGs Enrichment Result
We used the Gene Set Enrichment Analysis (GSEA) to verify and supplement the result acquired by DEG enrichment analysis. GSEA is relative robustness to noise and outliers in the data. GSEA was performed using the clusterProfiler package (version 3.10) within the Bioconductor platform.27
Composition of Immune Cells
We estimated the proportion of immune cell types of intestinal tissue from gene expression profile using CIBERSORT, an accurate and robust algorithm web tool for calculating the cell composition. We uploaded the gene expression data with response status to the CIBERSORT web (http://cibersort.stanford.edu/), choosing included LM22 signature and 500 permutations.28 Cases with a CIBERSORT output of p < 0.05, meaning that the inferred fractions of immune cell populations produced by CIBERSORT are accurate. For each sample, the calculated result of CIBERSORT output was normalized to 1 for further comparison.
PPI Network Analysis and Hub Gene Searching
We applied Search Tool for the Retrieval of Interacting Genes (STRING) to predict the functional protein interactions of DEGs.29 Cytoscape was used to compute the properties of the PPI network and for visualization. We extract the most highly connected cluster from the PPI network through MCODE analysis.30 The genes with high Maximal Clique Centrality (MCC) score calculated by CytoHubba in the extracted network were considered to be hub genes.31
ROC Curve Analysis
The glmnet package (binomial Lasso) in R software was used to calculate and compression of linear models and preserve valuable variables.32 The expression level of hub genes and the status of responsiveness from eight cohorts (six cohorts form intestinal tissue and two cohorts from serum samples) were obtained. ROC analysis in PRISM 8.0 was used to count the area under the curve (AUC) and draw the ROC curves for each cohort separately. Thus, we investigated the ability of hub genes in prediction though the AUC value.
Result
Selection of Discovery and Verified Cohort
A total of six microarray datasets (GEO) were retrieved from Pubmed for anti-TNFα therapy IBD patients, followed by RMA normalized.GSE12251 discovered the gene expression profile of intestinal tissue samples between 12 responses to 10 non-response UC patients before the treatment of infliximab. GSE16879 detected the gene expression profile of 28 responses to 33 non-response IBD patients. GSE23597 analyzed the gene expression profile of 24 responses to 5 non-response UC patients. GSE92415 compare the gene expression profile of 32 responses to 27 non-response golimumab treated UC patient. GSE107865 and GSE42296 explored the blood gene expression profile 14 responses to 6 non-response or 17 responses to 5 non-response CD patient. Patient samples of GSE16879 were distinguished as three cohorts, including UC, CDi, CDc.GSE23597 is excluded for some of its patients is overlapped with GSE16879 in the process of data integration. Collectively, five cohorts from intestinal tissue (GSE12251, GSE16879UC, GSE16879CDi, GSE16879CDc, GSE92415) were selected as discovery cohort, which as eligible microarray datasets from integration. Six cohorts (GSE12251, GSE16879UC, GSE16879CDi, GSE16879CDc, GSE92415, GSE23597) from intestinal tissue and two cohorts from blood sample (GSE107865 and GSE42296) were chosen as verified cohorts. Detailed information for each dataset, including Cohort name, Sample source, IBD type, Definition time, Definition method, Anti-TNFα therapy, Purpose in the current study, and GEO accession number, is present in Table 1 (also in Table S1).
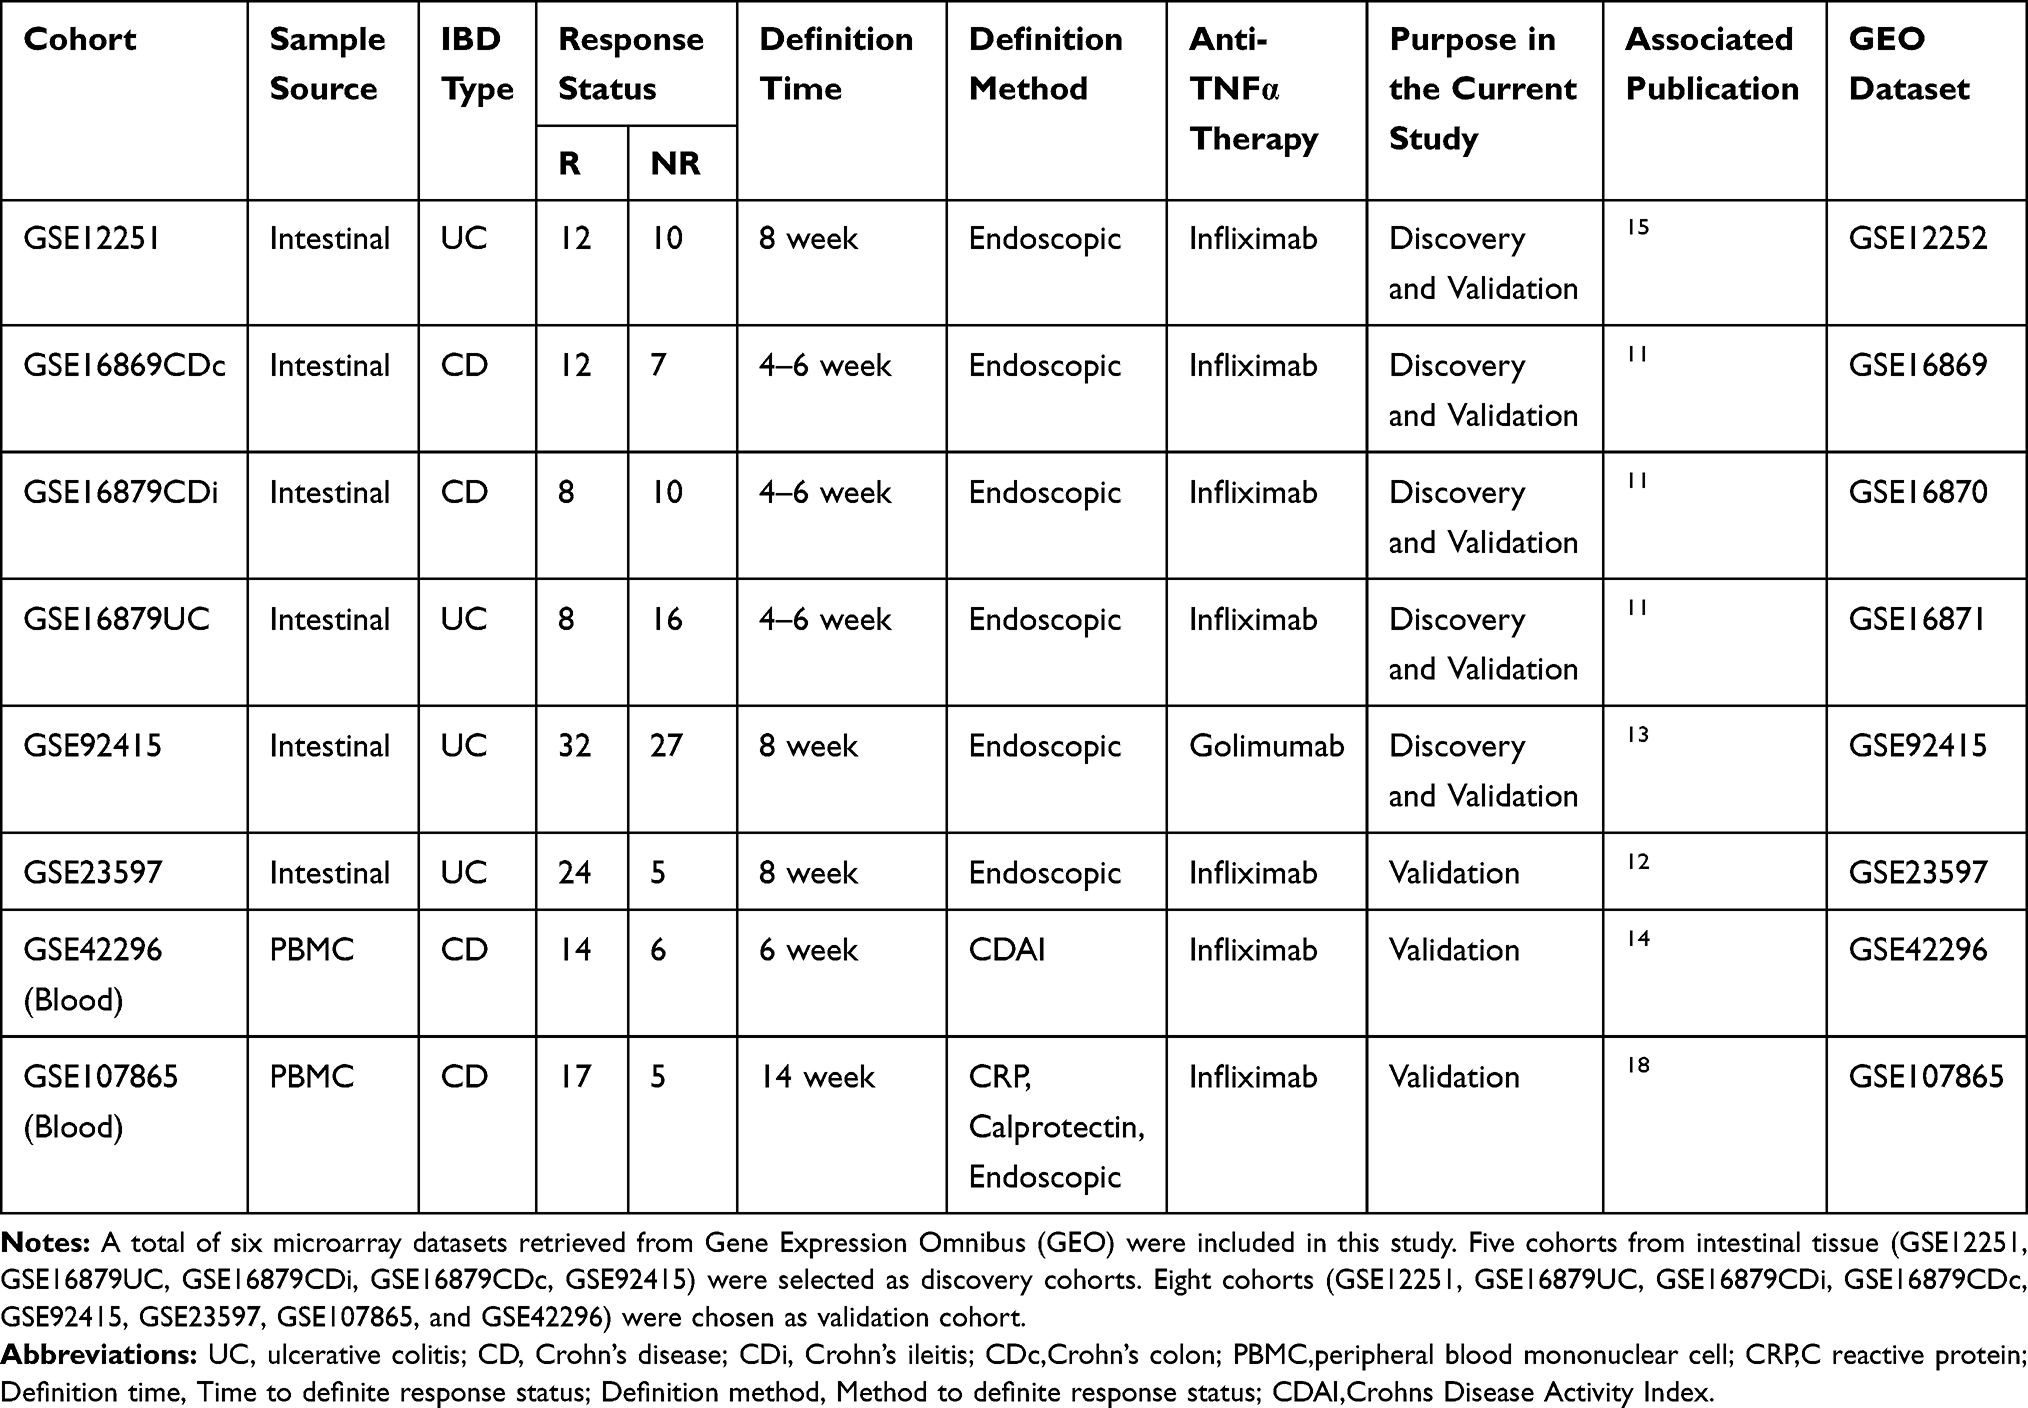 |
Table 1 Summary of Individual Studies Included |
Screening of DEGs Between Response and Non-Response Patients
To identify the shared transcriptional signatures between response and non-response patients, we uploaded the data from the discovery cohort in succession to NetworkAnalyst. All uploaded data passed the integrity check. We performed” ComBat procedures” implemented in the NetworkAnalyst tool to reduce batch effects among different datasets. No apparent batch effects are found after this step, and the sample clustering patterns with or without batch effect adjustment were visualized by PCA plots (Figure 1A and B). All the five cohorts from the verified cohort were then integrated utilize ES statistical methods provided by NetworkAnalyst, which is the difference between two group means divided by standard deviation facilitate to reveal the DEGs between anti-TNFα agent response and non-response patients across different microarray datasets. Finally, a total of 288 DEGs between non-response and response IBD patients were obtained with the criteria of P-value <0.05 and log2|combined-fold change|>0.85. The 274 up-regulated genes and the 14 down-regulated genes were shown in the heat map as well as the volcano plot (Figures 1C and 2A, and Table S2).
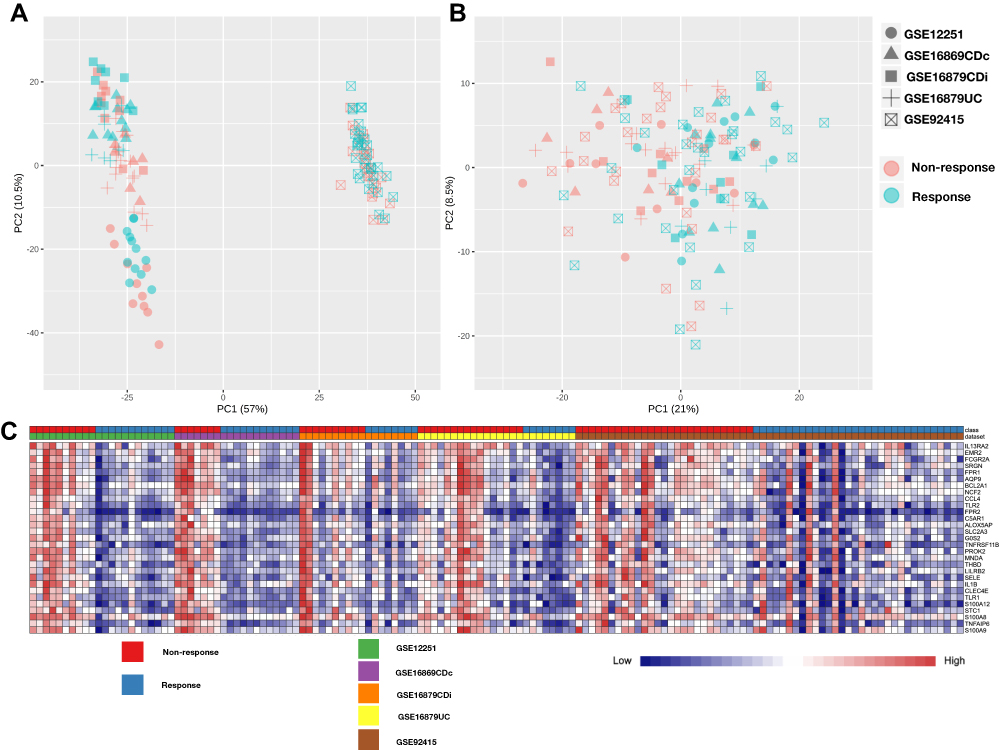 |
Figure 1 PCA plot for sample clustering and the heat map of differentially expressed genes of five cohort microarray datasets. (A) PCA plot for sample clustering of microarray datasets without batch effect adjustment. (B) PCA plot for sample clustering of microarray datasets with batch effect adjustment. (C) The heat map of the top 30 differentially expressed genes in response vs non-response IBD patient. The vertical axis represents the top 30 regulated genes (26 down-regulated genes and 4 down-regulated genes), and the horizontal represents a total of 142 samples. Abbreviations: PCA, principal component analysis; DEG, differentially expressed genes. |
 |
Figure 2 The volcano plot of differentially expressed genes, bubble map of GO BP terms and network of KEGG analysis. (A) The volcano plot of the differentially expressed genes. Blue dots on the left indicate up-regulated genes in non-response individuals, and red dots on the right indicate down-regulated. Gray dots indicate genes with no statistical difference. (B) The bubble map of BP GO BP terms. The horizontal axis represents the fold enrichment rate of BP GO terms, and the vertical represents pathway names. The color depends on the P-value, and the size of bubbles represents the number of enriched genes. (C) The network view of pathway KEGG enrichment results. Each node represents the enriched pathway. The connection of nodes indicates the number of genes shared between the pathways. The color represents the classification of the node. Abbreviations: DEG, differentially expressed genes; FC, fold-change; GO, Gene Ontology; BP, biological process; KEGG, Kyoto Encyclopedia of Genes and Genomes. |
Functional Annotation and Enrichment of DEGs
Functional enrichment analyses were performed using DAVID to have further insight into the biological functions of DEGs. Considering the low count number of down-regulated DEGs, we focused on the up-regulated DEGs. For the GO analysis, “positive regulation of tumor necrosis factor production” was the most significant BP term with fold enrichment. We show the top 14 BP terms according to the P-value, gene counts, and fold enrichment (Figure 2B). These terms indicated that the gene expression differences of intestinal samples in non-response IBD patients were associated with an abundance of inflammatory cytokines and pathogen recognition. On the categories of Molecular function (MF), IgG binding, lipopolysaccharide-binding, and pattern recognition receptor activity were the prominent MF term. Intrinsic to membrane and integral to membrane were top 2 CC terms. We listed useful information of these GO terms in (Table 2). KEGG pathway enrichment analysis discovers 11 significantly enriched KEGG pathways with P-value <0.05 (Table 3). Among these pathways, the Toll-like receptor signaling pathway was the most important one according to the P-value, gene counts, FDR, and fold enrichment. The DEGs in the Toll-like receptor signaling pathway were concentrated in TLR (Figure S1). There were 11 DEGs genes that participated in this pathway (CD86, IL6, LY96, TLR1, TLR2, IL1B, TLR4, CXCL11, CCL4, TLR8, CD14, and SPP1). We visualize KEGG pathways by the ClueGO plug-in of Cytoscape v.3.4.0 (Figure 2C)
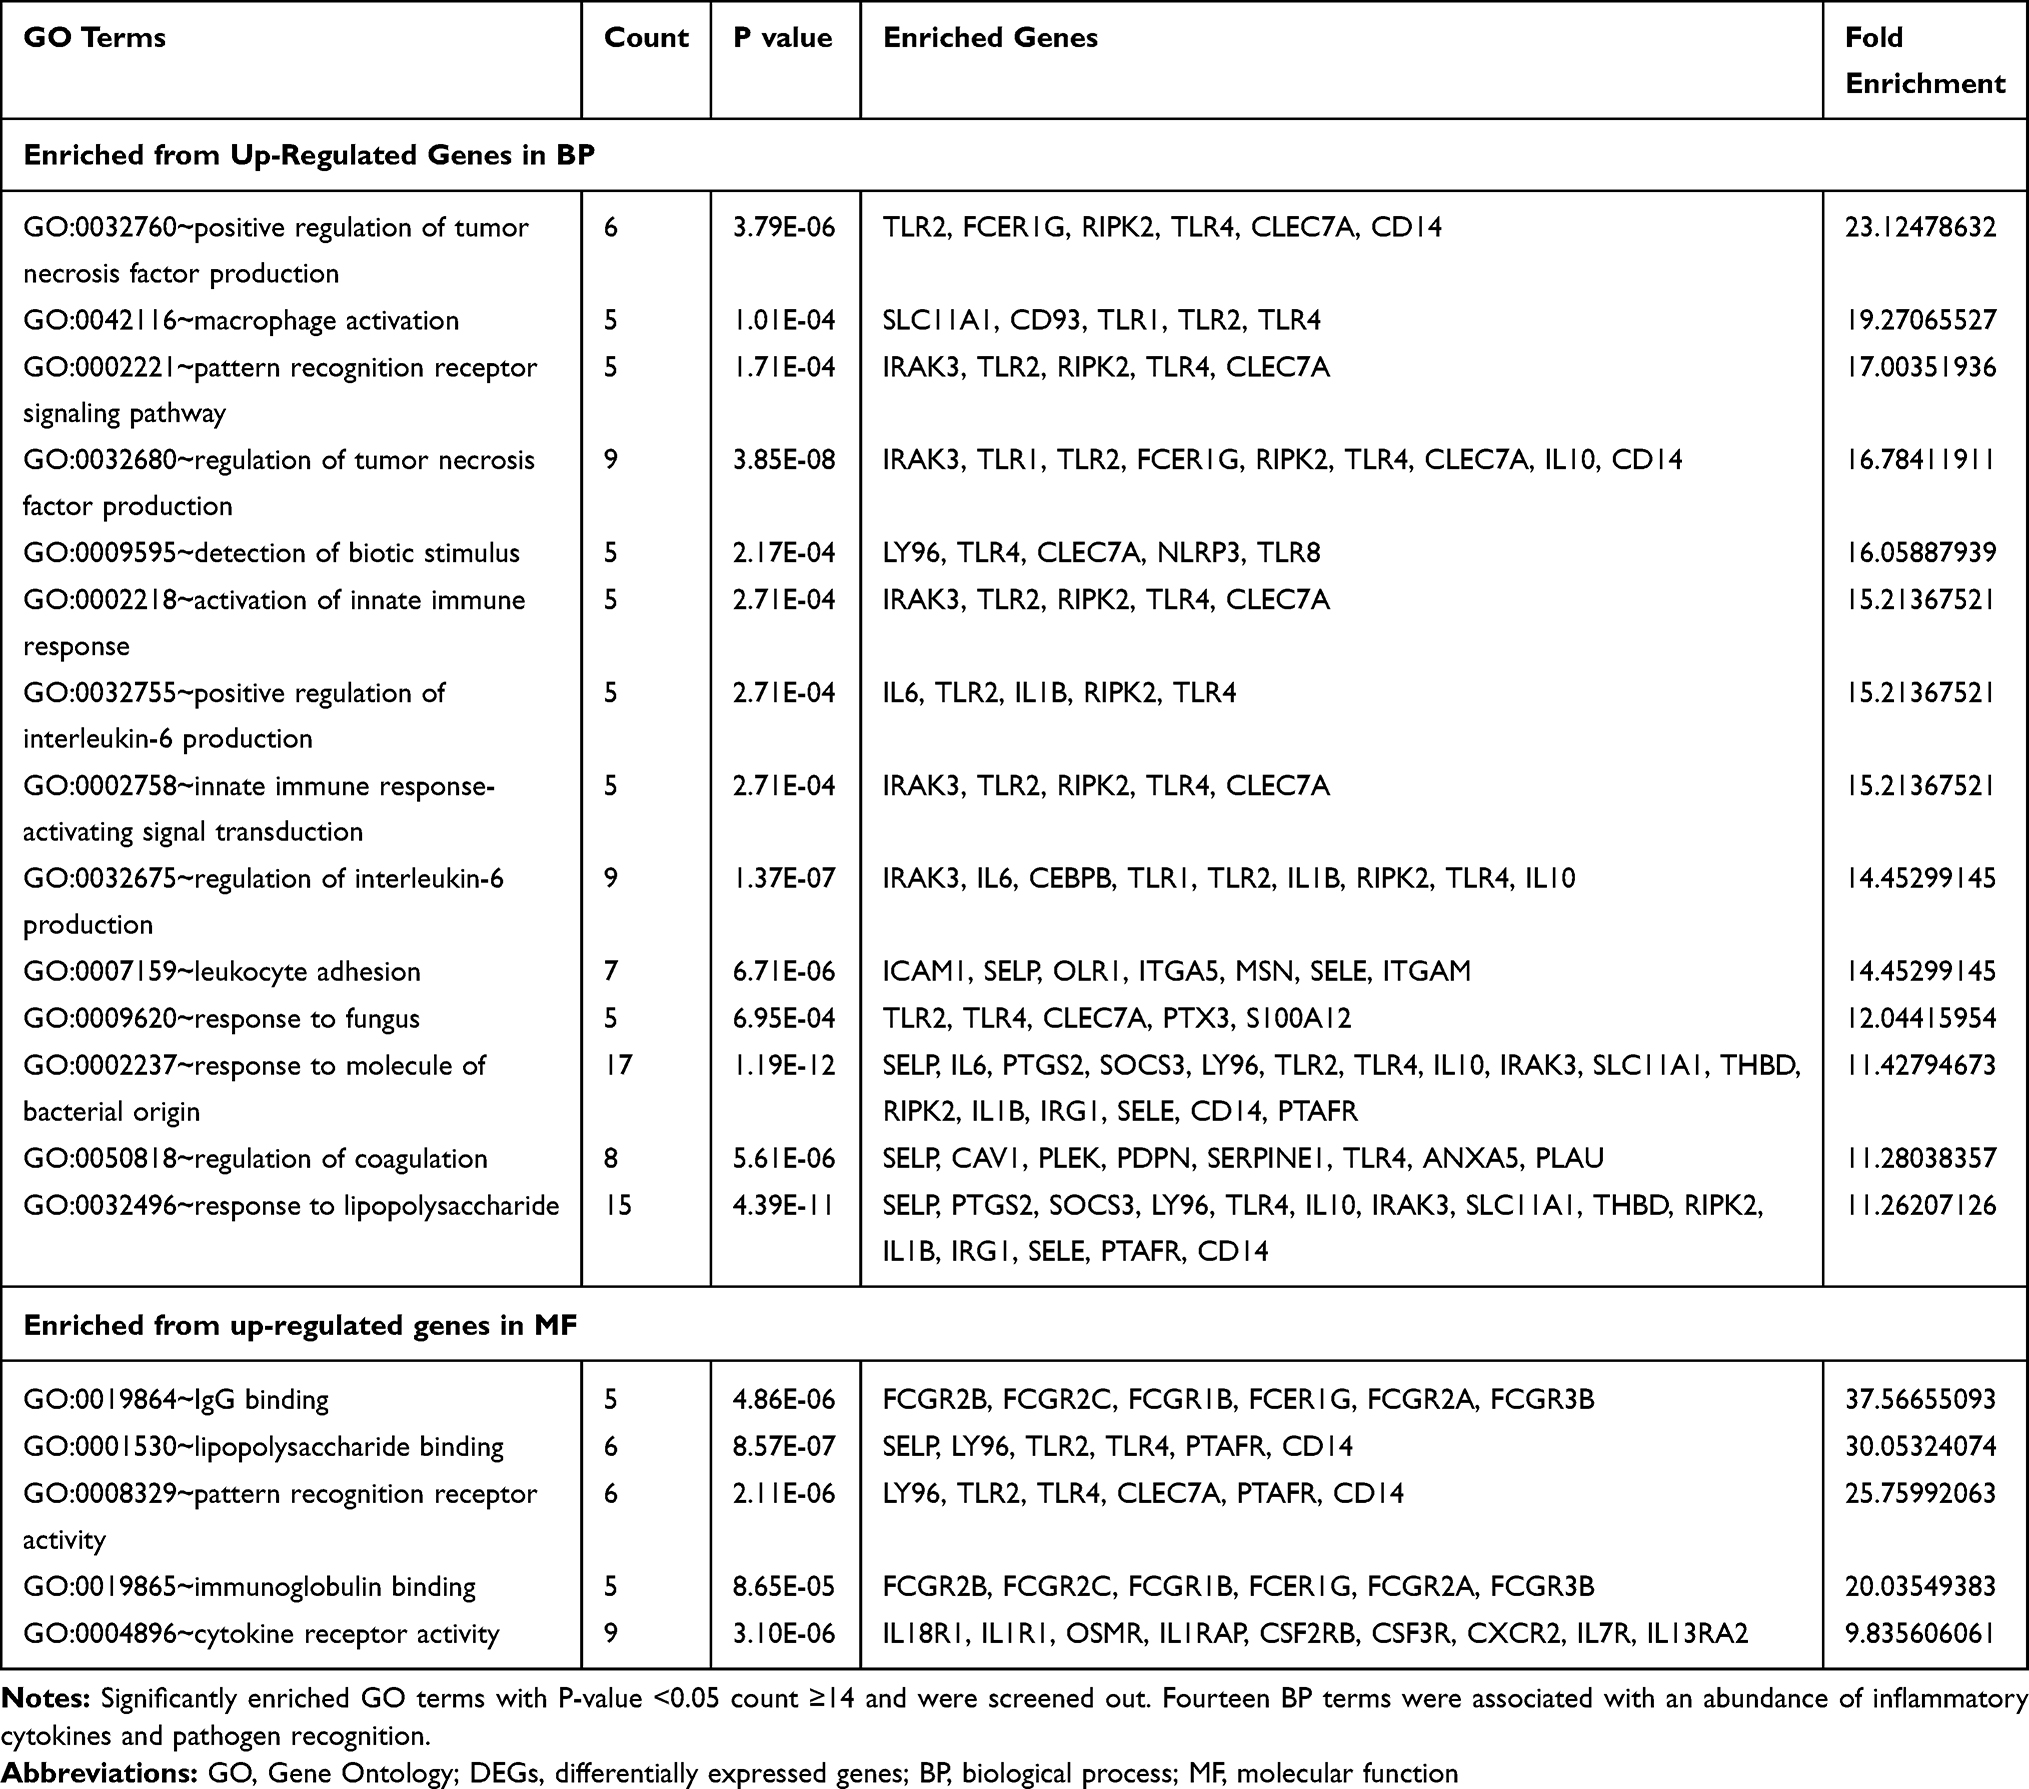 |
Table 2 GO Terms Enrichment Results of DEGs |
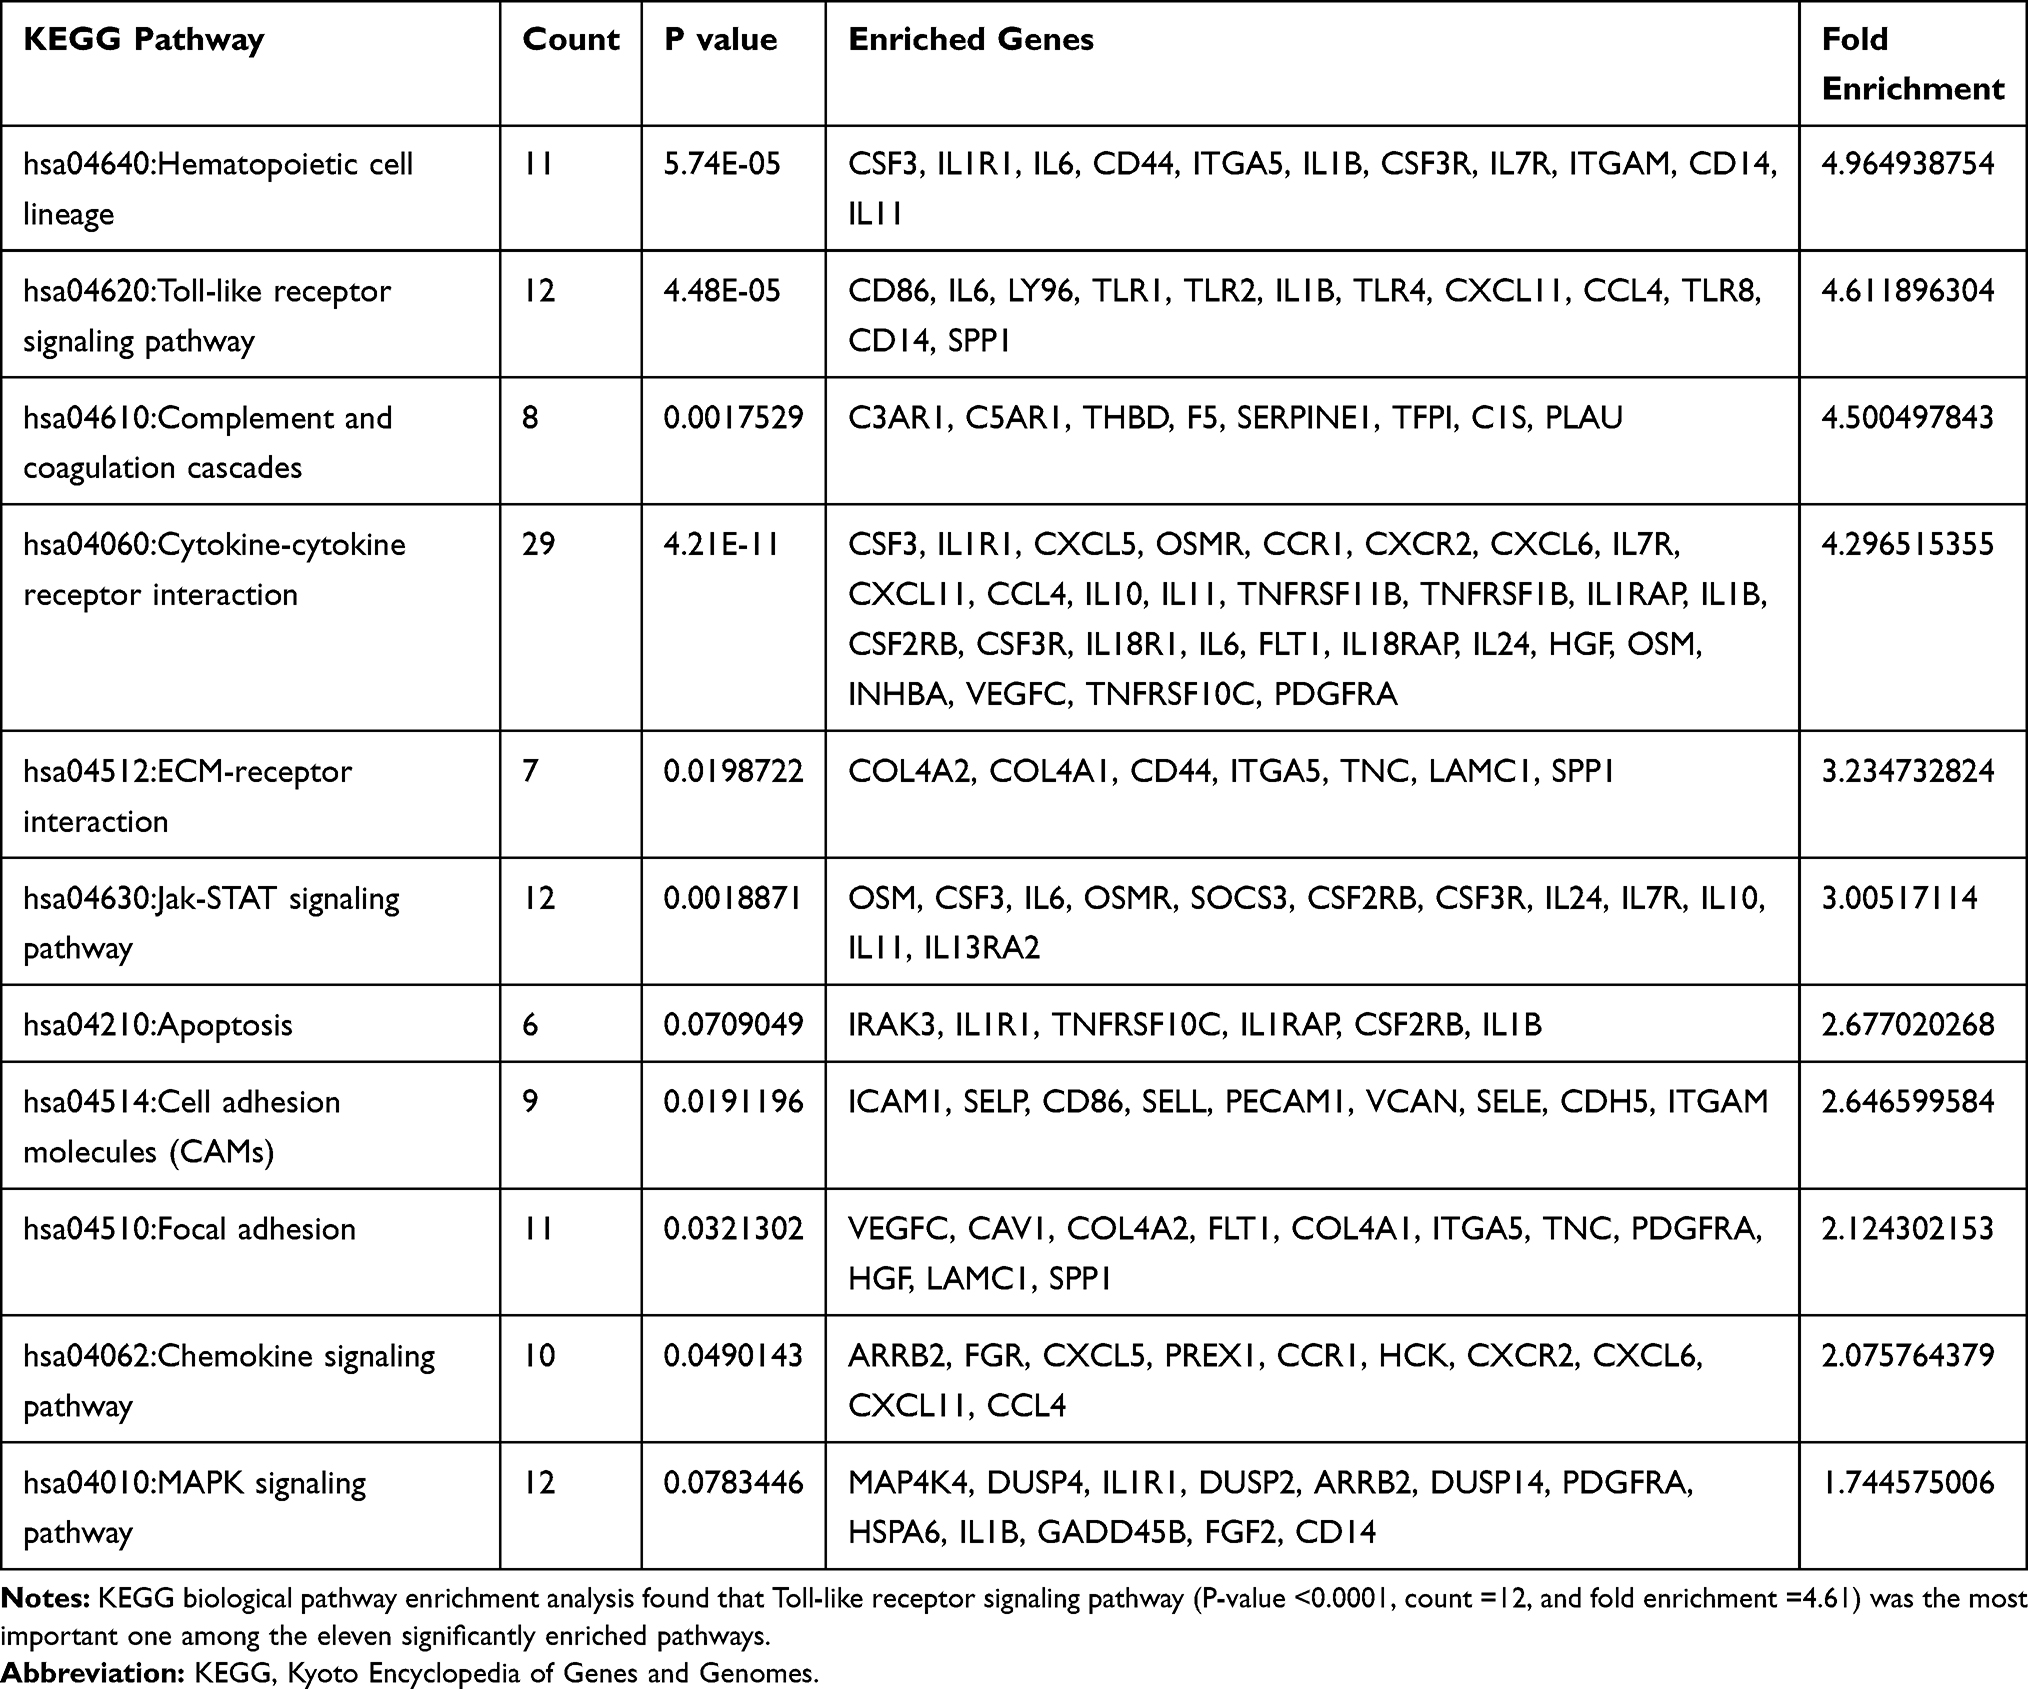 |
Table 3 KEGG Pathway Enrichment Results of DEGs |
Verification and Supplement of DEGs Enrichment Result
IL6 was significant differentially expressed between responders and non-responders (up-regulated in non-responders, adjusted P value<0.01), no significant difference was found in TNF and NOD2 (Figure 3A). IL6 was involved in the DEGs, while TNF and NOD2 were not included in the DEGs. GSEA was applied to verify the main result acquired by DEG enrichment analysis. GSEA result suggested upregulation of “inflammation response”, “Fc-gamma receptor signaling” and “Toll-like signing pathway” of on-response individuals in CD, UC, and IBD separately (p<0.01), which means the stable of DEGs enrichment analysis (Figure 3B–D). Also, whole down-regulated genes were applied to GSEA for search down-regulated function, oxidative phosphorylation was found.
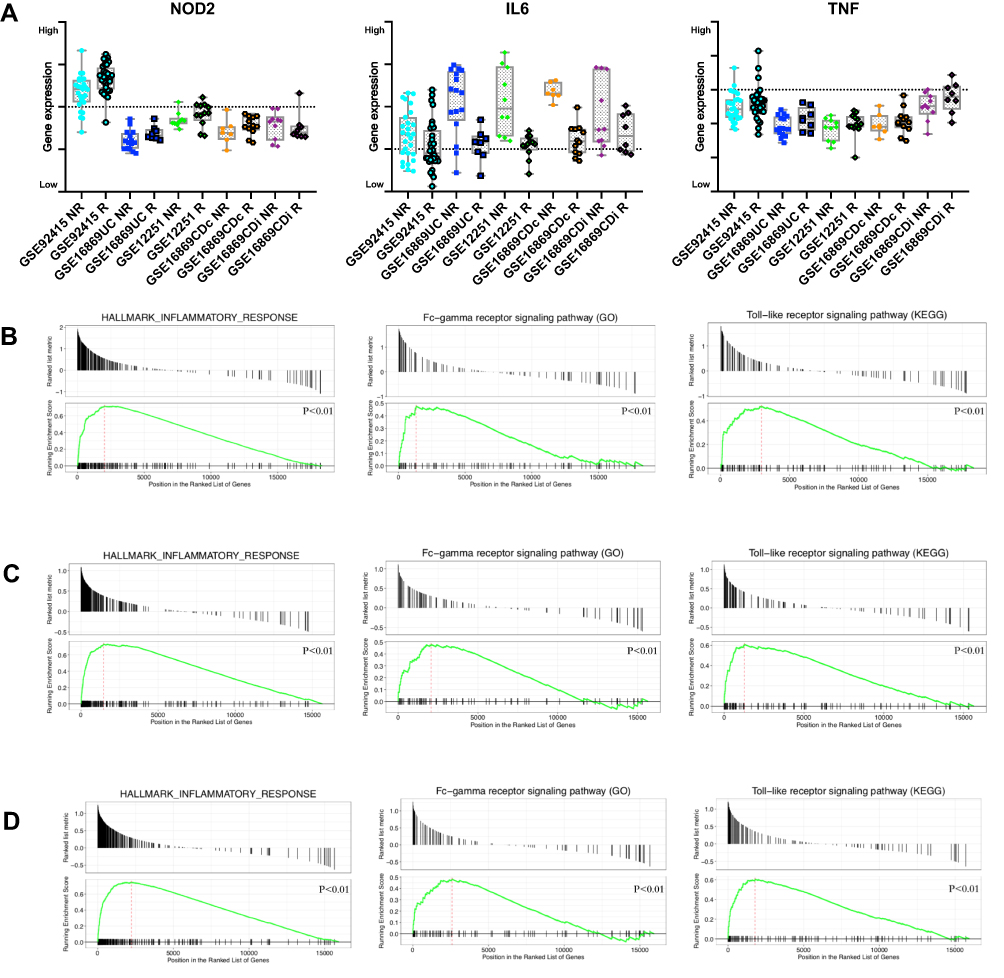 |
Figure 3 Baseline biopsy gene expression and GSEA result between response and non-response in Discovery Cohorts. (A) Box plot indicates intestine tissue IL6, NOD2 and TNF expression. (B) GSEA result of Inflammation response, Fc-gamma receptor signaling and Toll-like signing pathway in CD (GSE16879CDi, GSE16879CDc) patients. (C) GSEA result of Inflammation response, Fc-gamma receptor signaling and Toll-like signing pathway in UC (GSE12251, GSE16879UC, GSE92415) patients. (D) GSEA result of Inflammation response, Fc-gamma receptor signaling and Toll-like signing pathway in IBD (GSE12251, GSE16879UC, GSE16879CDi, GSE16879CDc, GSE92415, GSE23597) patients. Abbreviation: GSEA, Gene Set Enrichment Analysis. |
Composition of Immune Cells Between Response and Non-Response Patients
Cases with a CIBERSORT output of p>0.05 means the estimated result is not accurate, which is not eligible for further analysis. Collectively, a total of 59 (100%), 24 ( 100%), 21 (87.5%) and 12 (63.2%) samples from GSE92415, GSE12251, GSE16869UC and GSE16869CDc were included, respectively. The dataset of GSE16869CDi was excluded, as more than 40% of the sample is not accurate (CIBERSORT output of p>0.05). The composition of immune cells in response and non-response from intestinal tissues was analyzed, and the fraction of 22 immune cells was shown in the violin plot (Figure 4A, also in Table S3). As shown in Figure 4B, the fractions M2 Macrophage is relatively low in the intestinal tissue from non-response patients than those from response patients. The proportions of M1 Macrophage in M1 and M2 Macrophage are also high in non-response individuals (FC 0.19–0.78).
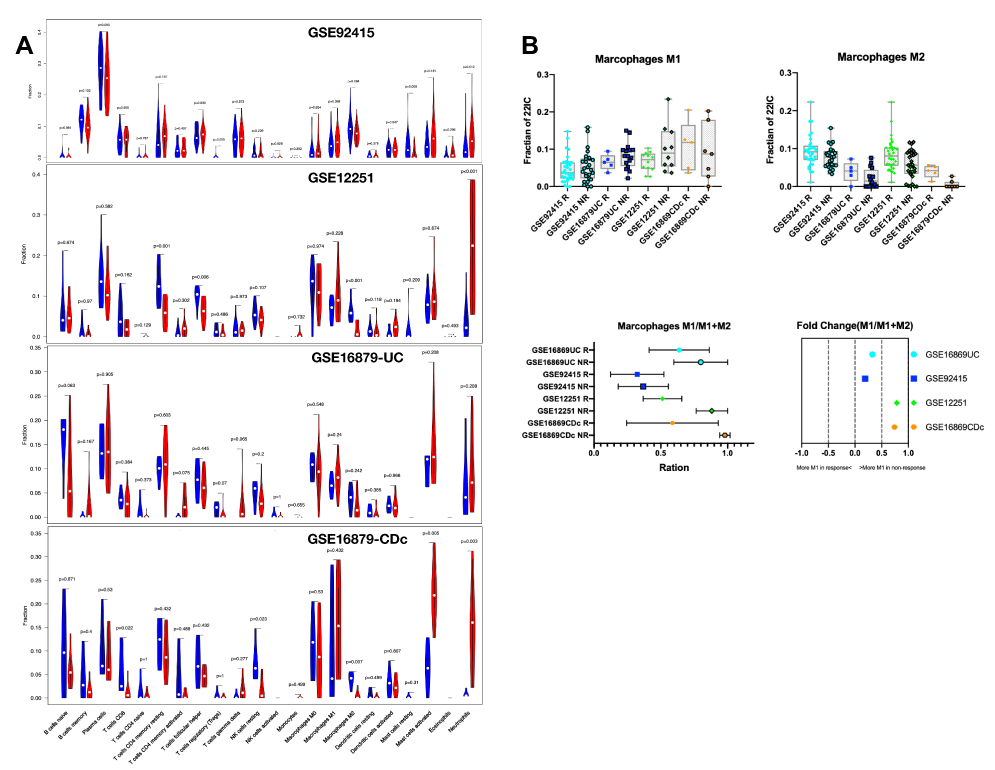 |
Figure 4 Violin and Box plot of immune cell composition between response and non-response individual. (A) The violin plot indicates the composition of 22 immune cells between response and non-response individuals in 4 cohorts with CIBERSORT p < 0.05 for all eligible samples. The blue violin plot indicates non-response individual, and the red violin plot represents response patients. (B) The box plot indicates the composition of M1 macrophage, M2 macrophage, ration of M1/(M1+M2) macrophage, and its fold-change between response and non-response individuals. |
Analyzing the PPI Network and Finding of Hub Genes
We constructed the PPI network involving 140 nodes (DEGs) and 975 edges through Cytoscape. The proteins expressed by DEGs are represented by the nodes and the physical interactions between two nodes means the edges, which is obtained from string v11.0. The most highly connected cluster in the PPI network is extracted by MCODE plug-in in Cytoscape. The Maximal Clique Centrality is an important parameter, and the high score demonstrates the protein act as the center of the network and plays a critical role. The nodes with a higher score were shown as red or orange color, and the node size is related to the fold of change between non-response and response IBD patients (Figure 5A). The most prominent genes in this cluster were at the core of the whole PPI network, including TLR1, TLR2, TLR4, TLR8, FCGR2A, HCK, CD36, CCR1, CCL4, and they were all regulated as inflammation and chemotaxis (Table S4). Therefore, the night genes were considered as the hub gene. Subsequently, we analyzed Hub genes and their neighboring nodes for better visualization (Figure 5B).
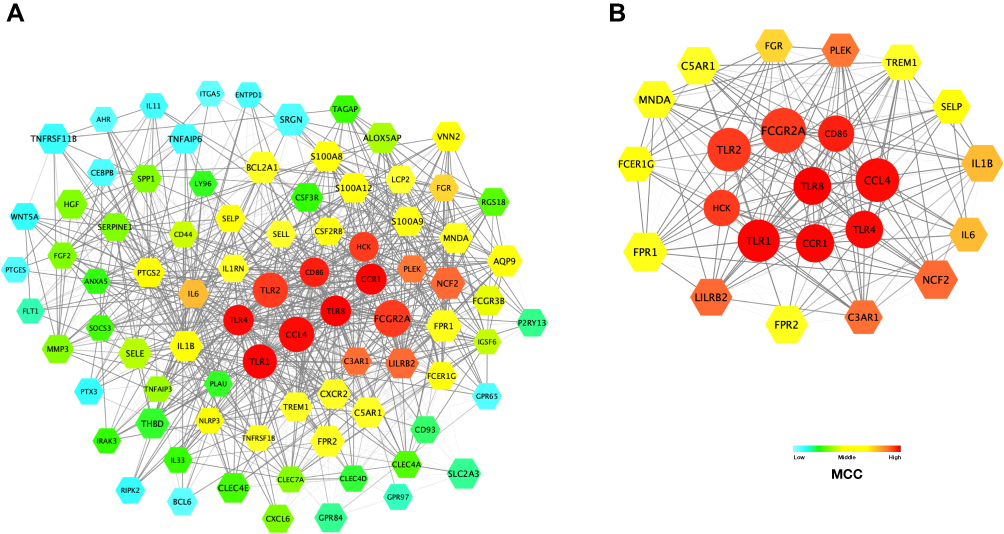 |
Figure 5 The PPI network and the most highly connected cluster. (A) The PPI network consists of 93 nodes and 1163 edges. Color represents the MCC of nodes. And size is related to the FC between non-response and response IBD patients. (B) The most highly MCC connected cluster is composed of nine hub genes and their first neighboring nodes: TLR1, TLR2, TLR4, TLR8, HCK, FCGR2A, CCL4, CCR1, and CD86. Abbreviations: PPI, protein–protein interaction network; MCC, Maximal Clique Centrality, FC, fold-change. |
Exploring Candidate Biomarkers by ROC Curves and Lasso Regression
Firstly, the Lasso regression model for GSE92415 (having the largest number of samples) was conducted to find an optimum linear combination of hub genes in predicting responsiveness (Figure 6A). Then, the ROC curve analysis of each hub gene and LASSO regression model (0.4795 and 0.2864 for CCL4 and FCGR2A) predicting the responsiveness of anti-TNFα agents in IBD patients from six cohorts (GSE12251, GSE16879, GSE23597, GSE92415, all form intestinal tissue) is conducted successfully by PRISM 8.0 (Figure 6B); none of them were less than 0.500. The AUC of LASSO model is 0.7–1.0. Among these hub genes, FCGR2, TLR1, TLR2, and HCK was the distinguish one in intestine with the single gene AUC beyond 0.9 in at least one of study, which suggest it might have outstanding value for predicting the responsiveness in IBD patients. Besides, ROC curve analysis also applied in two cohorts (GSE107865 and GSE42296), FCGR2A (AUC: 0.669–0.706), HCK (AUC: 0.738–0.765), and TLR8 (AUC: 0.643–0.694) might be blood biomarkers (Figure 6C).
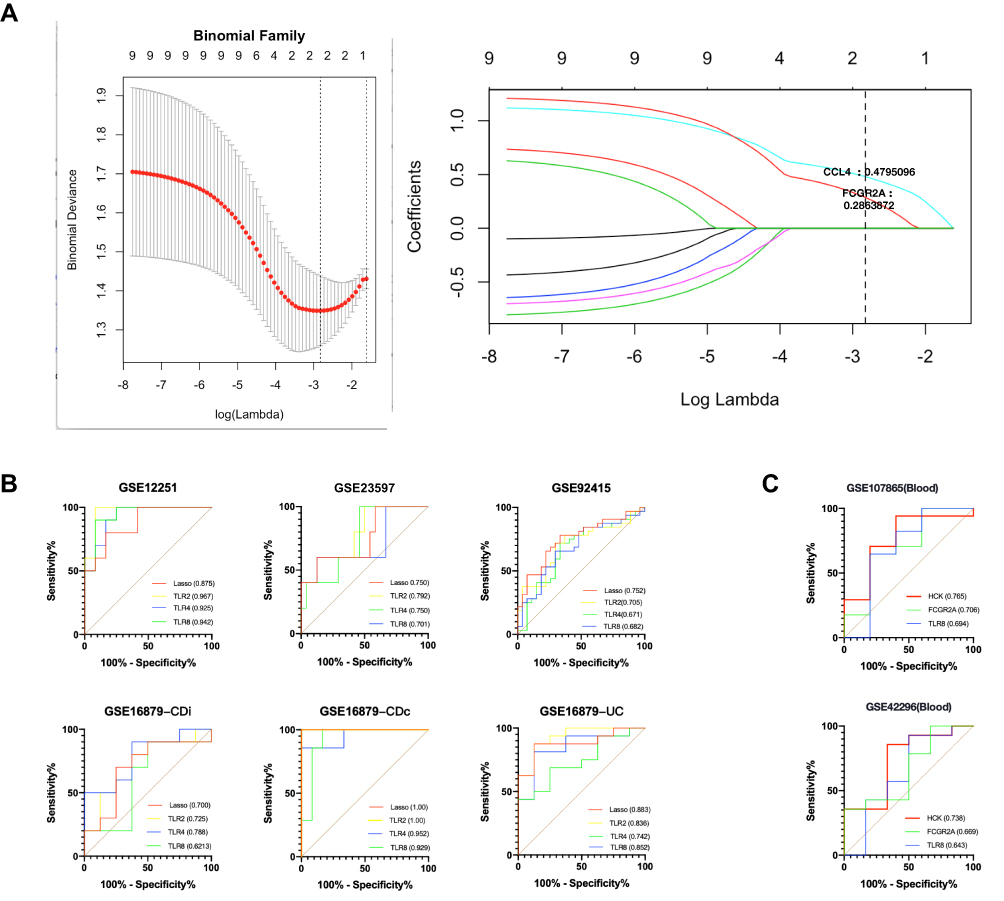 |
Figure 6 Construction of LASSO regression model and ROC curves of hub genes in eight cohorts. (A) The left plot indicates binomial deviance of different numbers of variables revealed by the LASSO regression model for GSE92415. The red dots represent the value of binomial deviance; the grey lines represent the SE; the vertical dotted lines represent optimal values by the minimum criteria and 1-SE criteria. “Lambda” is the tuning parameter. The right plot determines the Coefficient of LASSO regression model 0.4795 and 0.2864 for CCL4 and FCGR2A, respectively. (B) The ROC curves of LASSO regression model (0.4795 and 0.2864 for CCL4 and FCGR2A) and top 3 hub genes in 5 discovery cohorts (GSE12251, GSE16879 and GSE92415) and one external validation cohort (GSE23597). (C) The ROC curves of top 3 hub genes in two cohorts (GSE107865 and GSE42296). Abbreviations: AUC, area under the curve; ROC, receiver operating characteristic; SE, Standard error. |
Discussion
Predicting the responsiveness of anti-TNFα treatment and understanding its molecular mechanism is becoming more and more apparent and urgent. Our finding through integrated analysis of several independently public available datasets of IBD patients before the treatment of anti-TNFα agents suggests that excessive interaction of FcγR signaling and Toll-Like Receptor (TLR) pathway may account for the different response to anti-TNFα agents in IBD patients. Beyond this, the lasso regression model containing FCGR2A and CCL4 can be used as predictive biomarkers.
Several publications have reported gene expression of IBD patients’ intestine biopsies with responsiveness to anti-TNFα agents.11–13,15 Ingrid Timmer et al found that unlike non-responders, the dysregulation of anti-microbial peptides (AMPs) in intestine mucosa almost normalized after Infiximab compared to their baseline samples in responders.11 Others have shown that Infiximab affects TH1, TH2, and TH17-cell differentiation pathways in responders and that non-responders fail to regulate these three pathways.12 Nevertheless, no baseline gene panel to predict responsiveness was determined in the previous two studies. On the other hand, Ingrid Arijs et al also found that 5 top signature genes from a predictive panel of 109 probe sets in UC patients, which contains TNFRSF11B, STC1, PTGS2, IL11 and IL13α2.15 Then, the panel of 109 probe sets was refined in further study to a smaller set of 13 genes signature (CMTM2, C5AR1, FGF2, GK, HGF, L1RN, LILRA2, NAMPT, PAPPA, SNCA, SOD2, STEAP4, ZBED3). However, its accuracy of the 13 genes signature in an external validation was no better than chance, which limits its clinic use.13 The previous signature genes are not robust enough, which may arise from the relatively small sample size. We think it appropriate to reveal more robust and reproducible biological processes and hub genes through merging homogenizes studies. Therefore, 142 moderate-to-severity IBD patients refractory to conventional treatment were involved in our study for in-depth data re-mining.11,13,15
The Gene Ontology (GO) terms of Biological Process (BP) revealed changes in the pathogenesis of non-response patients. IL-6 and TNF are the two most prominent BP terms, indicating that the abundance of inflammatory cytokines in non-response profile.12,18 The GSEA result of inflammation response confirms the involvement of IL-6 and TNF in UC, CD, and whole IBD patients. Noteworthy, because of the lack of random allocation, it has been challenging to determine if the excessive activation of inflammation response in non-response patients is independent of the severity of the disease.
However, the underlying biological process driving positive regulation of pro-inflammation cytokines is more critical. Four terms were directly relevant to pathogen recognition in the top six terms of BP, which is consistent with the previous finding that several genetic variations in pattern recognition receptors (PRRs) loci were associated with anti-TNFα response in autoimmune disease.33 Hence, we reasoned that the changes might contribute to a link between the innate immune cell and intestinal microbial.34 Host PRRs modulate microbial recognition and could thereby alert gut microbe community function and structure broadly. Modulated microbial, in turn, induces abnormal signal, cytokine secretion, and bacterial clearance in innate immune cells, thus highlighting the critical role of balance in the regulation of PRR-initiated outcomes in intestinal tissues.35,36
The Molecular function (MF) terms further bring insight into the relation between PRRs signal and microbial interactions in non-response patients. On the one hand, the “Lipopolysaccharide receptor” acting as one of the significant PRR in detecting gram-negative microbe is the most significant GO terms of MF for up-regulated genes with the highest fold enrichment rate.37 Similarly, “Peptidoglycan” binding both gram-negative and gram-positive microbe is also enrichment.37,38 NOD2, the receptor of muramyl dipeptide (MDP), a fragment of bacterial peptidoglycan, is the first studied susceptibility factor to IBD.3 Although NOD2 mutations show the value of determining the risk of disease development, it is controversial whether NOD2 is related to the efficacy of anti-TNFα therapy.39,40 In our study, no significant differences in baseline NOD2 expression between the response and non-response patients neither in UC nor CD patients, which might be due to the gap between genetic variants and expression. On the other hand, MF terms of “Lgg binding” and “Opsonin binding” have been found. PRRs acting as sensors of microbial stimulation contribute to immunoglobin generation.41,42 Though intestine is a lgA dominant organ, lgG antibodies, critical effectors of anti-microbial, exhibit wide broad microbial reactivity in IBD patients.43,44 Besides, “extracellular space” and “plasma membranes” are the most significant GO Cellular Component (CC) terms for the up-regulated gene, which reveals that pathogenesis may occur in membranes depend on extracellular microbial.
From a cell physiology perspective, Fc gamma receptor (FcγR) signaling, which is downstream of Immunoglobulin G (IgG), appears to be up-regulated and a key effector in non-response individuals.45 Supported by “IgG-mediated activation signaling” is the most significant GO term of MF. Within the colonic mucosa, monocytes, and macrophages (MMP) as the major FcγR-expressing cell types mediate effector functions of immunoglobulin G (IgG) antibodies.46,47 Considering the polarization of M1 macrophages are relatively high in non-response individuals, the verse cycle is likely to occur between polarization and activation of MMP between gut microbe. Overproduction of anti-flagellin IgG, as well as voluminous IgG-opsonized microbes, are believed to lead to pathological IgG-FcγR-dependent immune response.46,48 Also, within the persisting chronic pathological inflammatory states, the balance of MMP Activating and inhibitory FcγR (the A: I ratio) can be destroyed, which reduces the activation threshold of cells upon encounter of immune-complex or opsonized targets.44 As IgG widely emerged and the intrinsic A: I ratio skewed, over-Activated MMP, driven by FcγR signal, determines the magnitude of intestinal inflammation, which might be an essential cause of non-response to the anti-TNFα agents.49
The KEGG analysis further shows changes in the signaling pathways in non-response patients. We prompt that “Toll-like receptor signaling pathway” as the hub KEGG pathway. Almost all DEGs involved in the Toll-like signaling pathway were up-regulated, which was consistent with the recent study found that polymorphisms of TLR pathway are valuable significant predictors for the response to anti-TNFα therapy among patients with autoimmune disease.50,51 Firstly, as motioned above, TLR pathway facility the production of lgG and thereby stimulate the FcγR signal. Secondly, FcγR stimulates phagocytosis.52 Consequently, more antigen is provided for the Toll-like pathway to recognize. Thirdly, the FcγR signaling could cross-link to the Toll-like pathway greatly up-regulates pro-inflammatory chemokines transcriptional, and Toll-like pathway agonist could partially rescue lgG/FcγR induction of inflammation in the setting of deficient chemokines expression.53,54 Furthermore, several studies have highlighted a link between TLR and FcγR co-stimulation and the induction of a Th17 polarizing and pathogenic macrophage phenotype, which is constant to the characteristic of IBD.53–55 Taken together, FcγR stimulated by anti-commensal IgG signaling synergistic cooperating with toll-like pathway derives inappropriate inflammation in the gut, which might be crucial in the pathogenesis of non-response of anti-TNFα agents. These results suggest that the FcγR-TLR axis is responsible for the magnify reciprocal signaling, which ultimately impacts response status.
We constructed the PPI network with up-regulated DEGs lists the top-degree hub genes: TLR4, TLR1, TLR8, CCR1, CD86, CCL4, HCK, and FCGR2A. Unlike the previous way of selecting signature genes through the statistical method of cross-validation, biological behavior has also been considered in the process of PPI construction.15 Thus, we detected nine diverse and non-overlapping hub genes. Importantly, all of the nine hub genes show distinct features that excessive interaction of the FcγR-TLR pathway axis in non-response individuals. FCGR2A, an active FcγR signal receptor, is a good example. One on hand, previous work has suggested that FCGR2A co-stimulate with Toll-Like pathway might massively induce pro-inflammatory cytokines and IgG.55 On the other hand, without the activation of the Toll-like pathway, FCGR2A also mediates beneficial functions via its ability to affinity to anti-TNFα monoclonal antibodies, which is one of the crucial ways for anti-TNFα agent taking effect.56,57 Therefore, given the versatility of FCGR2A and the critical role of the Fc region of anti-TNFα monoclonal antibodies, we speculate the dual role effect of FCGR2A in anti-TNFα treatment IBD patients. Additional studies are needed to confirm the dual role of FCGR2A. Besides, CCR1 is critical for the recruitment of effector immune cells to the site of inflammation. Meanwhile, it involved in IL-6 release of macrophage.58,59 CCL4, also known as macrophage inflammatory protein-1β (MIP-1β), plays a vital role in the migration of macrophage in the gut and can be active by TLR4.60,61 Our data differ from a previous study found that overexpression of CCR2-CCL7 is associated with non-response patients.18 In the future work, the chemokines and its receptor should be examined in terms of the specific type of cell recruited to the gut.
Interestingly, expression HCK, FCGR2A, and TLR8 also show predictive value in peripheral blood mononuclear cells (PBMCs). In particular, HCK might be an essential molecule that has not been thoroughly studied but is of great value to the prediction biomarker. Acting downstream of receptors that bind the Fc region of immunoglobulins, such as FCGR1A and FCGR2A, plays a vital role in the regulation of innate immune responses, phagocytosis, cell survival and proliferation, cell adhesion and migration. Numerous studies showed that active HCK exhibited increased susceptibility to TLR signaling inflammation and elevated innate immune response. Although the expression of HCK was proven to correlate with the development of inflammation positively, the recent investigation of HCK associated with autoimmune disease is that Behçet’s disease (BD) due to the broad regulation of LPS-Induced pathway, many results are contradictory.62,63
From a clinical perspective, one implication of the current study finds biomarkers of anti-TNFα treatment. We have demonstrated a ROC analysis for predicting therapy response with a single hub gene or Lasso linear models. Thus, the model consists of FCGR2A and CCL4 shows great value of prediction in intestinal tissue.
Another clinical implication of the present study is that non-response to anti-TNFα treatment patients may elect an alternative therapy. Our findings suggest that no responders may represent a vicious circle of, including an up-regulated TLR pathway, skewed FcγR signaling, and distribute microbial, which hamper the resolution of inflammation via anti-TNFα agent treatments. Blocking the mechanism that restores the gut microbe community would be helpful, support by the finding that the functional links intestinal microbial ecosystem and therapeutic manipulation.17 Indeed, antibiotic showed that restoring the gut microbe prevent recurrence after surgery.1 Another way of blocking the pathogenic mechanism is to develop new agents with a higher affinity to FCGR2A.
In summary, our study has the merit of assessing transcriptional analysis from several independent cohorts though re-analyzed six publicly available microarray gene expression profiling (origin of samples varies from blood to intestinal) via different methods and gain different conclusions. Importantly, we found polarization from M2 to M1 macrophages in non-response individuals and nine hub genes. Thus, we propose our insight that the cross-talk between FcγR signaling and the TLR axis may be responsible for the different response to anti-TNFα agents in IBD patients. Besides, some hub genes have high predictive value.
Conclusion
The current study aims to explore the molecular mechanism and search for candidate biomarkers in the gene expression profile of IBD patients associated with the response to anti-TNFα agents. Totally 286 DEGs and nine hub genes were screened via bioinformatic approaches. Our prominent finding is that the interaction of the FcγR signaling and TLR axis may be responsible for the different responses to anti-TNFα agents in IBD patients, and the dual role effect of FCGR2A may be the underlying mechanism. However, there were some limitations. It should be noted that none of the cohorts involved in this study reported anti-TNFα agent trough levels of each patient, so it is difficult to figure out whether the non-response was caused by pharmacokinetic or pharmacodynamic. Further studies with therapeutic drug monitoring and dose optimization are needed. Besides, additional studies with a large sample size as well as direct evidence of microbes are useful to validate our results.
Acknowledgments
This project was supported from Natural Science Foundation of Shanghai (19ZR1429700); Research Project of Pudong New Area Health and Family Planning Commission (PW2018D-01); Clinical Research Project of Multi-Disciplinary Team, Shanghai Ninth People's Hospital, Shanghai JiaoTong University School of Medicine (201701008); Clinical Research Program of Shanghai Ninth People's Hospital, Shanghai JiaoTong University School of Medicine (JYLJ022). We also thank the encouragement and biostatistics support from Yeyang Zhu for this project.
Disclosure
The authors report no conflicts of interest in this work.
References
1. Bernstein CN, Eliakim A, Fedail S, et al. World gastroenterology organisation global guidelines inflammatory bowel disease: update August 2015. J Clin Gastroenterol. 2016;50(10):803–818. doi:10.1097/MCG.0000000000000660
2. Ng SC, Shi HY, Hamidi N, et al. Worldwide incidence and prevalence of inflammatory bowel disease in the 21st century: a systematic review of population-based studies. The Lancet. 2017;390(10114):2769–2778. doi:10.1016/S0140-6736(17)32448-0
3. Jostins L, Ripke S, Weersma RK, et al. Host-microbe interactions have shaped the genetic architecture of inflammatory bowel disease. Nature. 2012;491(7422):119–124. doi:10.1038/nature11582
4. Fuyuno Y, Yamazaki K, Takahashi A, et al. Genetic characteristics of inflammatory bowel disease in a Japanese population. J Gastroenterol. 2016;51(7):672–681. doi:10.1007/s00535-015-1135-3
5. Ford AC, Sandborn WJ, Khan KJ, et al. Efficacy of biological therapies in inflammatory bowel disease: systematic review and meta-analysis. Am J Gastroenterol. 2011;106(4):644–59, quiz 660. doi:10.1038/ajg.2011.73
6. Ding NS, Hart A, De Cruz P. Systematic review: predicting and optimising response to anti-TNF therapy in Crohn’s disease - algorithm for practical management. Aliment Pharmacol Ther. 2016;43(1):30–51. doi:10.1111/apt.2016.43.issue-1
7. Levin AD, Wildenberg ME, van den Brink GR. Mechanism of action of anti-TNF therapy in inflammatory bowel disease. J Crohns Colitis. 2016;10(8):989–997. doi:10.1093/ecco-jcc/jjw053
8. Moroi R, Endo K, Kinouchi Y, et al. FCGR3A-158 polymorphism influences the biological response to infliximab in Crohn’s disease through affecting the ADCC activity. Immunogenetics. 2013;65(4):265–271. doi:10.1007/s00251-013-0679-8
9. Biancheri P, Brezski RJ, Di Sabatino A, et al. Proteolytic cleavage and loss of function of biologic agents that neutralize tumor necrosis factor in the mucosa of patients with inflammatory bowel disease. Gastroenterology. 2015;149(6):1564–1574.e3. doi:10.1053/j.gastro.2015.07.002
10. Romero-Cara P, Torres-Moreno D, Pedregosa J, et al. A FCGR3A polymorphism predicts anti-drug antibodies in chronic inflammatory bowel disease patients treated with anti-TNF. Int J Med Sci. 2018;15(1):10–15. doi:10.7150/ijms.22812
11. Timmer A, De Hertogh G, Lemaire K, et al. Mucosal gene expression of antimicrobial peptides in inflammatory bowel disease before and after first infliximab treatment. PLoS One. 2009;4(11):e7984.
12. Toedter G, Li K, Marano C, et al. Gene expression profiling and response signatures associated with differential responses to infliximab treatment in ulcerative colitis. Am J Gastroenterol. 2011;106(7):1272–1280. doi:10.1038/ajg.2011.83
13. Telesco SE, Brodmerkel C, Zhang H, et al. Gene expression signature for prediction of golimumab response in a Phase 2a open-label trial of patients with ulcerative colitis. Gastroenterology. 2018;155(4):1008–1011.e8. doi:10.1053/j.gastro.2018.06.077
14. Mesko B, Poliska S, Váncsa A, et al. Peripheral blood derived gene panels predict response to infliximab in rheumatoid arthritis and Crohn’s disease. Genome Med. 2013;5(6):59. doi:10.1186/gm463
15. Arijs I, Li K, Toedter G, et al. Mucosal gene signatures to predict response to infliximab in patients with ulcerative colitis. Gut. 2009;58(12):1612–1619. doi:10.1136/gut.2009.178665
16. Pavlidis S, Monast C, Loza MJ, et al. I_MDS: an inflammatory bowel disease molecular activity score to classify patients with differing disease-driving pathways and therapeutic response to anti-TNF treatment. PLoS Comput Biol. 2019;15(4):e1006951. doi:10.1371/journal.pcbi.1006951
17. Aden K, Rehman A, Waschina S, et al. Metabolic functions of gut microbes associate with efficacy of tumor necrosis factor antagonists in patients with inflammatory bowel diseases. Gastroenterology. 2019;157:1279–1292.e11. doi:10.1053/j.gastro.2019.07.025
18. Gaujoux R, Starosvetsky E, Maimon N, et al. Cell-centred meta-analysis reveals baseline predictors of anti-TNFα non-response in biopsy and blood of patients with IBD. Gut. 2019;68(4):604–614. doi:10.1136/gutjnl-2017-315494
19. Carvalho BS, Irizarry RA. A framework for oligonucleotide microarray preprocessing. Bioinformatics. 2010;26(19):2363–2367. doi:10.1093/bioinformatics/btq431
20. Irizarry RA, Hobbs B, Collin F, et al. Exploration, normalization, and summaries of high density oligonucleotide array probe level data. Biostatistics. 2003;4:249–264. doi:10.1093/biostatistics/4.2.249
21. Zhou G, Soufan O, Ewald J, et al. NetworkAnalyst 3.0: a visual analytics platform for comprehensive gene expression profiling and meta-analysis. Nucleic Acids Res. 2019;47(W1):W234–W241. doi:10.1093/nar/gkz240
22. Johnson WE, Li C, Rabinovic A. Adjusting batch effects in microarray expression data using empirical Bayes methods. Biostatistics. 2007;8(1):118–127. doi:10.1093/biostatistics/kxj037
23. Xia J, Gill EE, Hancock REW. NetworkAnalyst for statistical, visual and network-based meta-analysis of gene expression data. Nat Protoc. 2015;10(6):823–844. doi:10.1038/nprot.2015.052
24. Ashburner MM, B C, Blake JAJ, et al. Gene ontology: tool for the unification of biology. Nat Genet. 2000;25:10802651. doi:10.1038/75556
25. Kanehisa M, Sato Y, Kawashima M, et al. KEGG as a reference resource for gene and protein annotation. Nucleic Acids Res. 2016;44(D1):D457–62. doi:10.1093/nar/gkv1070
26. Bindea G, Galon J, Mlecnik B. CluePedia Cytoscape plugin: pathway insights using integrated experimental and in silico data. Bioinformatics. 2013;29(5):661–663. doi:10.1093/bioinformatics/btt019
27. Yu G, Wang L-G, Han Y, et al. clusterProfiler: an R package for comparing biological themes among gene clusters. OMICS. 2012;16(5):284–287. doi:10.1089/omi.2011.0118
28. Newman AM, Liu CL, Green MR, et al. Robust enumeration of cell subsets from tissue expression profiles. Nat Methods. 2015;12(5):453–457. doi:10.1038/nmeth.3337
29. Szklarczyk D, Gable AL, Lyon D, et al. STRING v11: protein–protein association networks with increased coverage, supporting functional discovery in genome-wide experimental datasets. Nucleic Acids Res. 2019;47(D1):D607–D613. doi:10.1093/nar/gky1131
30. Bader GD, H. C. An automated method for finding molecular complexes in large protein interaction networks. BMC Bioinformatics. 2003;4:2. doi:10.1186/1471-2105-4-2
31. Chin CH, Chen S-H, Wu -H-H, et al. cytoHubba: identifying hub objects and sub-networks from complex interactome. BMC Syst Biol. 2014;8(Suppl 4:):S11. doi:10.1186/1752-0509-8-S4-S11
32. Friedman J. Regularization paths for generalized linear models via coordinate descent. J Stat Software. 2010;33(1):1.
33. Kuwana M, Vogel U, Bank S, et al. Genetic variations in pattern recognition receptor loci are associated with anti-TNF response in patients with rheumatoid arthritis. PLoS One. 2015;10(10):e0139781.
34. Haag L-M, Siegmund B. Intestinal microbiota and the innate immune system – a crosstalk in crohn’s disease pathogenesis. Front Immunol. 2015;6.
35. Nishida A, Inoue R, Inatomi O, et al. Gut microbiota in the pathogenesis of inflammatory bowel disease. Clin J Gastroenterol. 2018;11(1):1–10. doi:10.1007/s12328-017-0813-5
36. Pickard JM, Zeng MY, Caruso R, et al. Gut microbiota: role in pathogen colonization, immune responses, and inflammatory disease. Immunol Rev. 2017;279(1):70–89. doi:10.1111/imr.12567
37. d’Hennezel E, Abubucker S, Murphy LO, et al. Total lipopolysaccharide from the human gut microbiome silences toll-like receptor signaling. mSystems. 2017;2(6). doi:10.1128/mSystems.00046-17.
38. Sukhithasri V, Nisha N, Biswas L, et al. Innate immune recognition of microbial cell wall components and microbial strategies to evade such recognitions. Microbiol Res. 2013;168(7):396–406. doi:10.1016/j.micres.2013.02.005
39. Wang X, Qin L, Cao J, et al. Impact of NOD2/CARD15 polymorphisms on response to monoclonal antibody therapy in Crohn’s disease: a systematic review and meta-analysis. Curr Med Res Opin. 2016;32(12):2007–2012. doi:10.1080/03007995.2016.1226168
40. Schaffler H, Geiss D, Gittel N, et al. Mutations in the NOD2 gene are associated with a specific phenotype and lower anti-tumor necrosis factor trough levels in Crohn’s disease. J Dig Dis. 2018;19(11):678–684. doi:10.1111/cdd.2018.19.issue-11
41. Pone EJ, Zhang J, Mai T, et al. BCR-signalling synergizes with TLR-signalling for induction of AID and immunoglobulin class-switching through the non-canonical NF-κB pathway. Nat Commun. 2012;3(1). doi:10.1038/ncomms1769.
42. Pone EJ, Jinsong Zhang HZ, Al-Qahtani A, Zhenming X, Casali P. Toll-like receptors and B-cell receptors synergize to induce immunoglobulin class switch DNA recombination: relevance to microbial antibody responses. Crit Rev Immunol. 2010;30(1):1–29. doi:10.1615/CritRevImmunol.v30.i1.10
43. Rengarajan S, Vivio EE, Parkes M. et al. Dynamic immunoglobulin responses to gut bacteria during inflammatory bowel disease. Gut Microbes;2019. 1–16. doi:10.1080/19490976.2019.1626683
44. Castro-Dopico T, Dennison TW, Ferdinand JR, et al. Anti-commensal IgG drives intestinal inflammation and type 17 immunity in ulcerative colitis. Immunity. 2019;50(4):1099–1114.e10. doi:10.1016/j.immuni.2019.02.006
45. Castro-Dopico T, Clatworthy MR. IgG and Fcγ receptors in intestinal immunity and inflammation. Front Immunol. 2019;10.
46. Kobayashi K, Qiao S, Yoshida M, et al. An FcRn-dependent role for anti-flagellin immunoglobulin G in pathogenesis of colitis in mice. Gastroenterology. 2009;137(5):1746–1756.e1. doi:10.1053/j.gastro.2009.07.059
47. Uo M, Hisamatsu T, Miyoshi J, et al. Mucosal CXCR4+IgG plasma cells contribute to the pathogenesis of human ulcerative colitis through FcγR-mediated CD14 macrophage activation. Gut. 2013;62(12):1734–1744. doi:10.1136/gutjnl-2012-303063
48. Panda S, Zhang J, Tan NS, et al. Natural IgG antibodies provide innate protection against ficolin-opsonized bacteria. EMBO J. 2013;32(22):2905–2919. doi:10.1038/emboj.2013.199
49. Gabanyi I, Muller P, Feighery L, et al. Neuro-immune interactions drive tissue programming in intestinal macrophages. Cell. 2016;164(3):378–391. doi:10.1016/j.cell.2015.12.023
50. Bank S, Andersen PS, Burisch J, et al. Associations between functional polymorphisms in the NFκB signaling pathway and response to anti-TNF treatment in Danish patients with inflammatory bowel disease. Pharmacogenomics J. 2014;14(6):526–534. doi:10.1038/tpj.2014.19
51. Bank S, Julsgaard M, Abed OK, et al. Polymorphisms in the NFkB, TNF-alpha, IL-1beta, and IL-18 pathways are associated with response to anti-TNF therapy in Danish patients with inflammatory bowel disease. Aliment Pharmacol Ther. 2019;49(7):890–903. doi:10.1111/apt.15187
52. Fox JM, Kausar F, Day A, et al. CXCL4/platelet factor 4 is an agonist of CCR1 and drives human monocyte migration. Sci Rep. 2018;8(1):9466. doi:10.1038/s41598-018-27710-9
53. Hoepel W, Vogelpoel LT, Hansen IS, et al. FcγR-TLR cross-talk enhances TNF production by human monocyte-derived DCs via IRF5-dependent gene transcription and glycolytic reprogramming. Front Immunol. 2019;10:739.
54. Vogelpoel LT, Hansen IS, Rispens T, et al. Fc gamma receptor-TLR cross-talk elicits pro-inflammatory cytokine production by human M2 macrophages. Nat Commun. 2014;5:5444. doi:10.1038/ncomms6444
55. Vogelpoel LTC, Hansen IS, Visser MW, et al. FcγRIIa cross-talk with TLRs, IL-1R, and IFNγR selectively modulates cytokine production in human myeloid cells. Immunobiology. 2015;220(2):193–199. doi:10.1016/j.imbio.2014.07.016
56. Stover CM, Tornero J, Fernández-Nebro A, et al. Variation at FCGR2A and functionally related genes is associated with the response to anti-TNF therapy in rheumatoid arthritis. PLoS One. 2015;10(4):e0122088.
57. Paiva M, Marques H, Martins Â, et al. FcγRIIa polymorphism and clinical response to rituximab in non-Hodgkin lymphoma patients. Cancer Genet Cytogenet. 2008;183(1):35–40. doi:10.1016/j.cancergencyto.2008.02.001
58. Lee MM, Chui RKS, Tam IYS, et al. CCR1-mediated STAT3 tyrosine phosphorylation and CXCL8 expression in THP-1 macrophage-like cells involve pertussis toxin-insensitive Galpha(14/16)Gα 14/16 signaling and IL-6 release. J Immunol. 2012;189(11):5266–5276. doi:10.4049/jimmunol.1103359
59. DOBRE MARIA, Mănuc TE, Milanesi E, et al. Mucosal CCR1 gene expression as a marker of molecular activity in Crohn’s disease: preliminary data. Rom J Morphol Embryol. 2017;58(4):1263–1268.
60. De la Fuente Lopez M, Landskron G, Parada D, et al. The relationship between chemokines CCL2, CCL3, and CCL4 with the tumor microenvironment and tumor-associated macrophage markers in colorectal cancer. Tumour Biol. 2018;40(11):1010428318810059. doi:10.1177/1010428318810059
61. Amati AL, Zakrzewicz A, Siebers R, et al. Chemokines (CCL3, CCL4, and CCL5) Inhibit ATP-induced release of IL-1betaIL-1 β by monocytic cells. Mediators Inflamm. 2017;2017:1434872. doi:10.1155/2017/1434872
62. Mitchell J, Kim SJ, Seelmann A, et al. Src family kinase tyrosine phosphorylates toll-like receptor 4 to dissociate MyD88 and Mal/ Tirap, suppressing LPS-induced inflammatory responses. Biochem Pharmacol. 2018;147:119–127. doi:10.1016/j.bcp.2017.11.015
63. Irtegun-Kandemir S, Icen-Taskin I, Bozkurt M, et al. mRNA expression profile of SFKs and involvement of SFKs in the regulation of LPS-induced Erk1/2 signaling in PBMCs of active BD patients. Endocr Metab Immune Disord Drug Targets. 2019;19(6):809–817. doi:10.2174/1871530319666190119101756
 © 2020 The Author(s). This work is published and licensed by Dove Medical Press Limited. The
full terms of this license are available at https://www.dovepress.com/terms
and incorporate the Creative Commons Attribution
- Non Commercial (unported, 3.0) License.
By accessing the work you hereby accept the Terms. Non-commercial uses of the work are permitted
without any further permission from Dove Medical Press Limited, provided the work is properly
attributed. For permission for commercial use of this work, please see paragraphs 4.2 and 5 of our Terms.
© 2020 The Author(s). This work is published and licensed by Dove Medical Press Limited. The
full terms of this license are available at https://www.dovepress.com/terms
and incorporate the Creative Commons Attribution
- Non Commercial (unported, 3.0) License.
By accessing the work you hereby accept the Terms. Non-commercial uses of the work are permitted
without any further permission from Dove Medical Press Limited, provided the work is properly
attributed. For permission for commercial use of this work, please see paragraphs 4.2 and 5 of our Terms.