Back to Journals » Pharmacogenomics and Personalized Medicine » Volume 16
Integrated Bioinformatics Analysis and Experimental Verification of Immune Cell Infiltration and the Related Core Genes in Ulcerative Colitis
Authors Zhao D ![]() , Qin D, Yin L, Yang Q
, Qin D, Yin L, Yang Q
Received 23 March 2023
Accepted for publication 26 May 2023
Published 23 June 2023 Volume 2023:16 Pages 629—643
DOI https://doi.org/10.2147/PGPM.S406644
Checked for plagiarism Yes
Review by Single anonymous peer review
Peer reviewer comments 2
Editor who approved publication: Dr Martin H Bluth
Danya Zhao,1 Danping Qin,2 Liming Yin,3 Qiang Yang4
1The First School of Clinical Medicine of Zhejiang Chinese Medical University, Hangzhou, People’s Republic of China; 2Department of Gastroenterology, The First Affiliated Hospital of Zhejiang Chinese Medical University, Hangzhou, People’s Republic of China; 3Institute of Hematology, The First Affiliated Hospital of Zhejiang Chinese Medical University, Hangzhou, People’s Republic of China; 4Department of Gastroenterology, Hangzhou TCM Hospital Affiliated to Zhejiang Chinese Medical University, Hangzhou, People’s Republic of China
Correspondence: Danping Qin, Email [email protected]
Background: Ulcerative colitis is a recurrent autoimmune disease. At present, the pathogenesis of UC is not completely clear. Hence, the etiology and underlying molecular mechanism need to be further investigated.
Methods: Three sets of microarray datasets were included from the Gene Expression Omnibus database. The differentially expressed genes in two sets of datasets were analyzed using the R software, and the core genes of UC were screened using machine learning. The sensitivity and specificity of the core genes were evaluated with the receiver operating characteristic curve in another microarray dataset. Subsequently, the CIBERSORT tool was used to analyze the relationship between UC and its core genes and immune cell infiltration. To verify the relationship between UC and core genes and the relationship between core genes and immune cell infiltration in vivo.
Results: A total of 36 DEGs were identified. AQP8, HMGCS2, and VNN1 were determined to be the core genes of UC. These genes had high sensitivity and specificity in receiver operating characteristic curve analysis. According to the analysis of immune cell infiltration, neutrophils, monocytes, and macrophages were positively correlated with UC. AQP8, HMGCS2, and VNN1 were also correlated with immune cell infiltration to varying degrees. In vivo experiments verified that the expressions of neutrophils, monocytes, and macrophages increased in the UC colon. Furthermore, the expressions of AQP8 and HMGCS2 decreased, whereas that of VNN1 increased. Azathioprine treatment improved all the indicators to different degrees.
Conclusion: AQP8, HMGCS2, and VNN1 are the core genes of UC and exhibit different degrees of correlation with immune cells. These genes are expected to become new therapeutic targets for UC. Moreover, the occurrence and development of UC are influenced by immune cell infiltration.
Keywords: ulcerative colitis, bioinformatics analysis, core genes, immune cells
Ulcerative colitis (UC) is an autoimmune disease characterized by recurrent diarrhea, abdominal pain, and mucous, pus, and blood in the stool. Although various drugs are available to relieve UC, up to 20% of the patients require colectomy.1 Therefore, it is important to find new core genes related to UC and further investigate the pathogenesis of the disease as a clear understanding is still lacking.
Research has shown that UC is closely associated with the activation of the immune system, especially the Th2 immune response. Furthermore, immune cell infiltration contributes to the occurrence and progression of UC. For instance, macrophages are polarized to the M1 proinflammatory phenotype,2 hundreds of neutrophils accumulate and damage the epithelium of the intestinal mucosa.3 In patients with IBD, intestinal inflammation affects the development of tolerogenic macrophages and results in the accumulation of proinflammatory monocytes.4
Various immune pathways and inflammatory genes are known to be involved in the pathogenesis of UC. It is unclear whether other novel genes play a role in the pathogenesis of UC apart from the known genes and whether the new genes are associated with immune cells. Recently, the advancements in bioinformatics, especially the continuous updates in the Gene Expression Omnibus (GEO) database, R software, machine learning, CIBERSORT algorithm, etc, have provided a new means for the study of UC related novel genes and immune cell infiltration. Hence, in this study, the novel genes of UC, infiltration of UC immune cells, and the relationship between the new genes and immune cells were analyzed using bioinformatics tools, which are of immense importance for elucidating the molecular mechanism of UC and identifying new targets for immunotherapy.
In this study, the UC microarray datasets were obtained from the GEO website. After screening the differentially expressed genes (DEGs), the UC core genes were identified by combining machine learning methods. Subsequently, CIBERSORT was used to study the differences in immune cells in 22 immune cell subsets between the UC and the normal group. The association between core genes and immune cells was also studied to understand the molecular immune mechanism involved in the pathogenesis of the disease. Finally, the infiltration of immune cells and the expression of core genes in UC were verified with in vivo experiments.
Materials and Methods
Screening Gene Chip Datasets
GEO is an international database that includes microarray gene expression profiles and high-throughput sequencing data. The term “ulcerative colitis” was used as the search term, while “Series” “Expression profiling by array “Homo sapiens” were used as a qualifier. The screening standards included the following: the microarray dataset involved whole-gene colonic gene expression profiles; the microarray dataset contained UC and healthy samples; drugs were not administered to any of the samples included, and the total number of samples was >20. After data screening, GSE87466, GSE179285, and GSE75214 were selected. Our analysis was limited to samples that were active and healthy and met the inclusion criteria. It was not necessary to obtain ethics approval for the present study, as it was a secondary bioinformatics analysis that was based on a public database (GEO database). All the data of this study are from public databases, an ethical review was exempted from the ethics committee by the Ethics Committee of The First Affiliated Hospital of Zhejiang Chinese Medical University (2023-YBK-001-01).
Differentially Expressed Genes (DEGs) Analysis
The study utilized two different datasets from varying platforms and personnel, resulting in heterogeneity and latent variables. To address this, we batch normalized the combined data sets using the “sva” package in R software. We then analyzed the genetic differences between normal people and UC patients using “Limma”, and identified DEGs using P<0.05 and |log FC|≥1 as screening conditions. Then, the “ggplot2” “ggrepel” “dplyr” and “pheatmap” packages were used to visualize the volcano plot and the heat map of DEGs.
Functional Enrichment of DEGs
DEGs’ biological functions were identified using GO and KEGG pathway enrichment analyses, and the enrichment analysis was performed using clusterProfiler, org.Hs.eg.db, enrichplot, and ggplot2 packages with a cut-off criterion of P < 0.05. DEG-disease associations were identified by the DO analysis.5 The Gene Set Enrichment Analysis (GSEA) program was applied to identify significantly enriched pathways and functional hallmarks, and the top 5 pathways were selected for graphical plotting.
Key Gene Screening and ROC Analysis
Several articles have utilized a method that combines the Least Absolute Shrinkage and Selection Algorithm (LASSO) as well as Support Vector Machine Recursive Feature Elimination (SVM-RFE) algorithm to screen key genes.6–9The key gene screened based on GSE87466 and GSE179285 were validated in GSE75214. In this study, LASSO logistic regression analysis was conducted using the R package “glmne”, with the smallest lambda value considered as optimal. Feature gene selection was performed using the RFE function in the caret package, based on five-fold cross-validation. SVM classification was then constructed using the “e1071”, “kernlab”, and “caret” packages in R. The ROC curves were generated using the R package pROC, and the area under the curve (AUC) was calculated to evaluate the diagnostic accuracy. AUC > 0.9 indicated that the model fit well.
Immune Infiltration Analysis
On the CIBERSORT website, the expression matrix of individual immune cell subtypes can be deconvolved using the linear support vector regression method, which provides a set of gene expression features of 22 immune cell subtypes. The immune cell infiltration matrix was obtained with a cut-off criterion of P < 0.05. Analysis of the correlation between 22 infiltrating immune cells was performed using the “corrplot” package. The results were visualized using “limma”, “reshape2”, “ggpubr” ggExtra, and “vioplot” packages. The characteristic diagnostic marker was compared with the immune-infiltrating cells using these analytical tools.
Animal Experiments
An approval was obtained by the Animal Experimentation Ethics Committee at Zhejiang Chinese Medical University for this study (IACUC-20210517-24). All animal experiments were conducted in accordance with the guidelines of Zhejiang Chinese Medical University. In this study, dextran sulfate sodium (DSS) was used to construct a UC mouse model and explore the expression of immune cells and core genes in UC. Meanwhile, due to the immune regulation of Azathioprine (AZA), the correlation between immune cells and the core genes as well as the pathogenesis of UC was further analyzed by observing the changes in immune cells and core genes.
Male wild-type mice (C57BL/6; 9–12 week-old) were purchased (Slaughter Shanghai). Three groups of mice were used in the experiment: control/WT, DSS/WT, and AZA/WT (n = 6/group). Then, 3.0% DSS was administered in drinking water for 7 days, and saline or 0.01 mL/g AZA was applied via gavage for 10 days, starting from the first day of modeling. The mice were then sacrificed after the experiments, and the colonic tissues were retained for subsequent analyses.
Quantitative Real-Time PCR Assay
According to the manufacturer’s instructions, total RNA was extracted from samples with the Trizol reagent (TAKARA, Japan). Reverse transcription was performed by using the Reverse Transcription Kit (ThermoFisher Scientific, USA). Quantitative PCR was performed with the PowerUp SYBR Green Reagent (ThermoFisher Scientific) on the Roche LightCycler® 480. The primer sequences used in the study are shown in Table S1. The 2−ΔΔCt method was used and the relative levels of gene expression (mRNA) were calculated.
Immunohistochemical Analyses
The distal colon tissues were fixed with 4% paraformaldehyde before embedding in paraffin, sectioned at a thickness of 4 um, dewaxed, and subjected to antigen repair with citric acid (VECTOR Laboratories, USA) at a high temperature, and then blocked with 5% bovine serum albumin (Absin, China) for 30 min. The dilution solution of the primary antibody was incubated at 4°C overnight, and the dilution ratios of the anti-Ly6C antibody, anti-F4/80 antibody, and anti-Ly6G antibody were 1:300. The antibodies were purchased from HUABIO (Zhejiang, China). Immunohistochemical secondary antibodies were incubated with enhanced HRP-labeled sheep anti-mouse/rabbit IgG polymer (ZSBB-Bio, CHINA) for 30 min at room temperature, followed by treatment for 10 min with DAB, counterstaining with hematoxylin, and finally sealing with neutral resin. ImageJ analysis was used to calculate the positive results of the images captured with the VS120 microscope (Olympus, Tokyo).
Results
Screening of DEGs in Different Datasets
The sample distribution of the three genes in the microarray datasets is shown in Table S2. A total of 36 DEGs were identified after considering the intersection of GSE87466 and GSE179285, including 20 upregulated genes and 16 downregulated genes (Appendix 1), and the DEGs were plotted using volcano and heat maps (Figure 1).
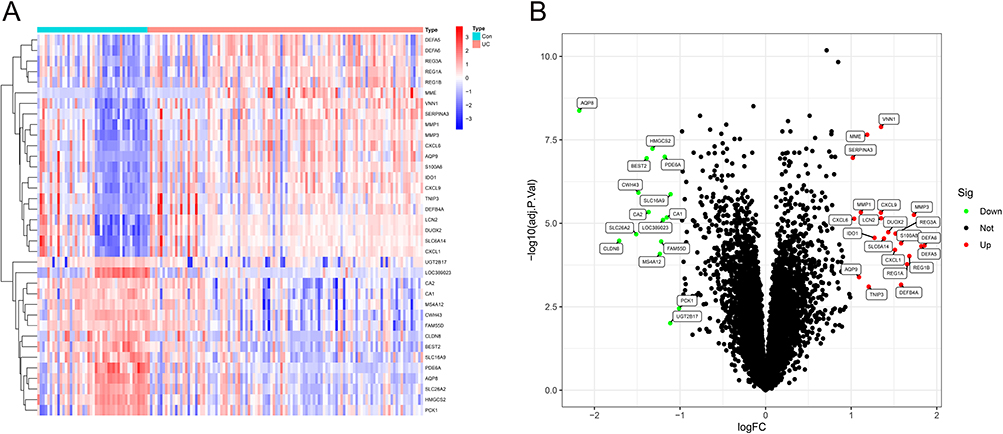 |
Figure 1 (A) Volcano map of DEGs in GSE87466 and GSE179285, red dots represent the upregulated genes and the green dots represent the downregulated genes; (B) Heat map of DEGs. |
Functional Correlation Analysis
In the present study, 36 DEGs were predicted to serve specific functions. GO enrichment analysis showed that BP was mainly enriched in antibacterial humoral response and humoral immunity, MF in secretory granules and vesicles, and CC in chemokine receptors, transmembrane transport, and other molecular functions (Figure 2A). The pathways involved in the KEGG enrichment pathway were chiefly the IL-17 signaling pathway, bile secretion, NOD-like receptor signaling pathway, and PPAR signaling pathway (Figure 2B). Moreover, the enrichment analysis of DO revealed a significant connection between intestinal disease and inflammatory bowel disease (Figure 2C). The GSEA results indicated that the UC active group was predominantly enriched in the pathways of chemokine signaling, cytokine–cytokine receptor interaction, and toll-like receptor signaling (Figure 2D).
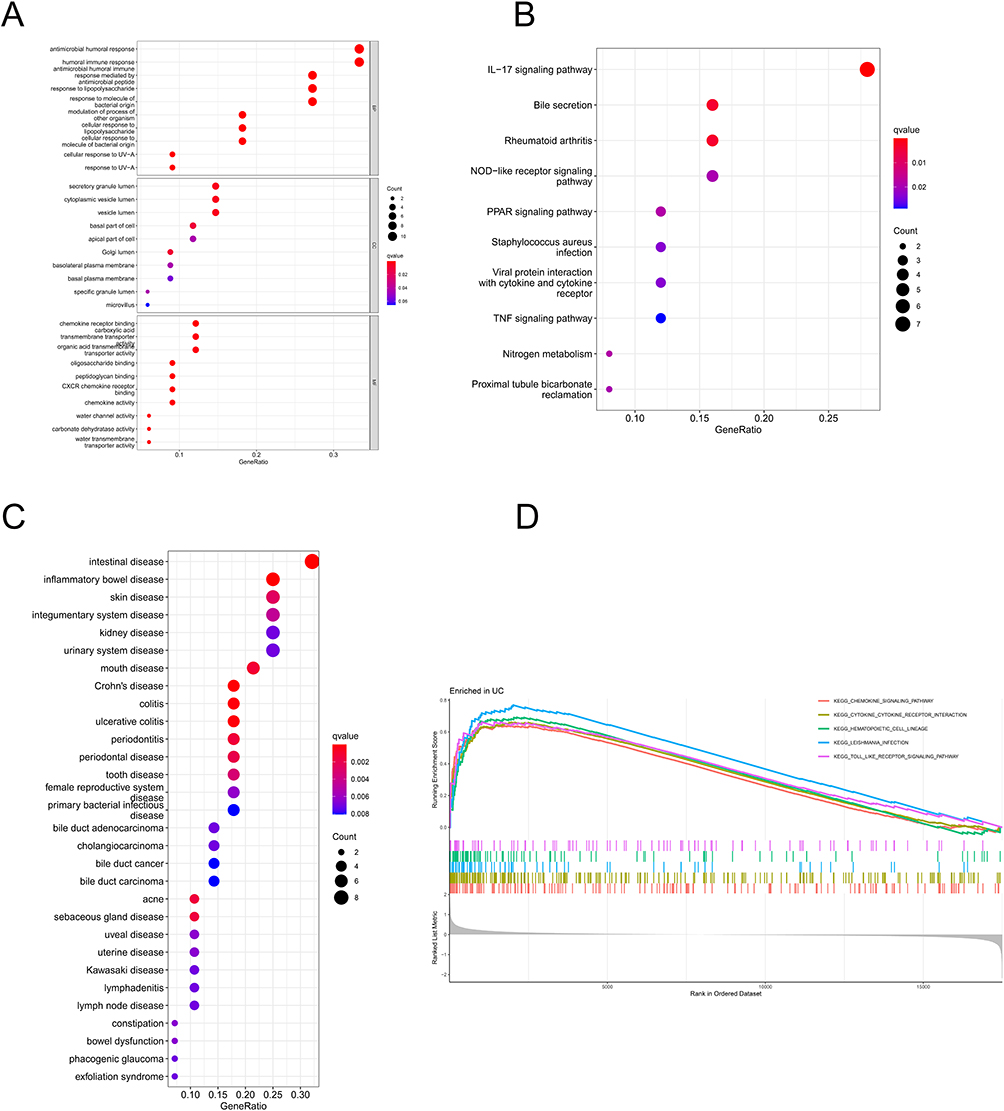 |
Figure 2 (A) Results of GO enrichment analysis; (B) results of KEGG enrichment analysis; (C) results of DO analysis; (D) GSEA analysis results displaying the top 5 signaling pathways. |
Screening Core Genes and Data Set Validation
In this study, 13 key genes were identified from the DEGs using the LASSO logistic regression algorithm (Figure 3A). Eight genes were recognized as the key genes from the DEGs using the SVM-RFE algorithm (Figure 3B). AQP8, VNN1, MME, HMGCS2, and LOC389023 were the overlapping genes in both algorithms (Figure 3C). ROC analysis was conducted and the AUCs for AQP8 (Figures 4A), HMGCS2 (Figures 4B), VNN1 (Figures 4C), and MME (Figures 4D) were found to be 0.963, 0.955, 0.963, and 0.399, respectively. However, LOC389023 was not present in the dataset GSE75214. In the validation set, AQP8 (Figures 5A), HMGCS2 (Figures 5B), and VNN1 (Figures 5C) showed significant differences, while MME did not (Figures 5D). These findings suggest that only AQP8, VNN1, and HMGCS2 may be considered as the core genes of UC.
 |
Figure 3 (A) LASSO logistic regression algorithm used to analyze the feature genes; (B) SVM-RFE algorithm used to analyze the feature genes; (C) Venn diagram of the intersection of two sets of feature genes. |
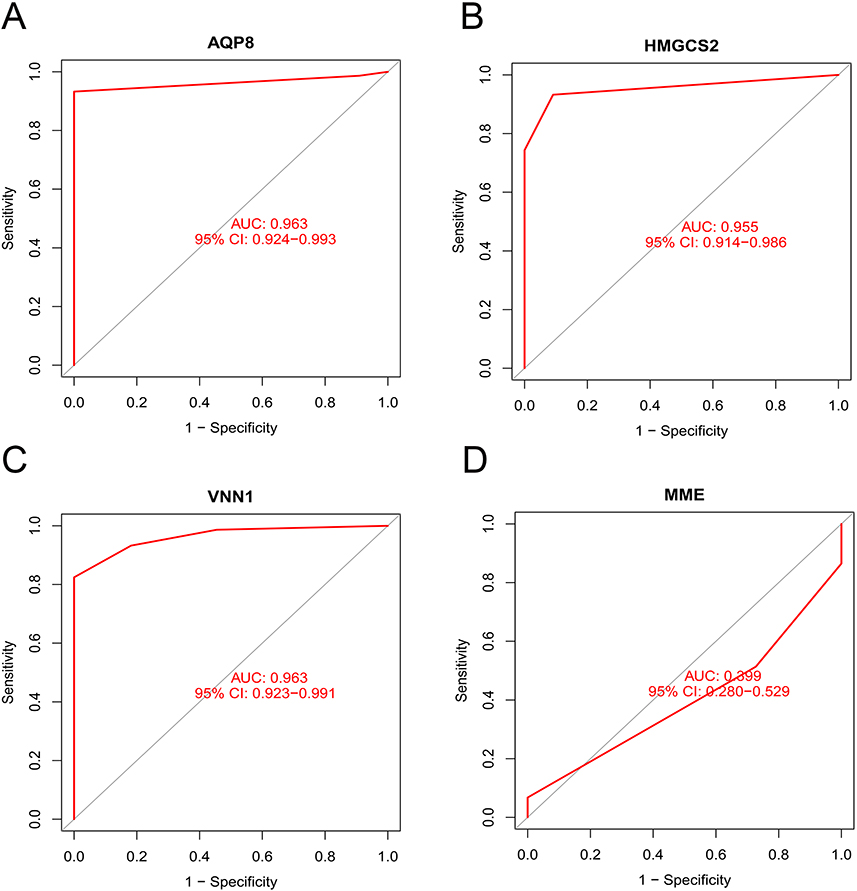 |
Figure 4 ROC analysis of AQP8 (A), HMGCS2 (B), VNN1 (C), and MME (D) in GSE75214. |
 |
Figure 5 The validation results of AQP8 (A), HMGCS2 (B), VNN1 (C), and MME (D) in GSE75214. |
Infiltration of Immune Cells
The results of GSE87466 and GSE179285 (44 normal controls and 110 patients with UC) were summed up using the CIBERSORT algorithm. The proportions of the immune cell composition showed clustering and individual differences (Figure 6A). Based on the gene expression matrix comprising 22 immune cells, their abundance in GSE87466 and GSE179285 in the relevant samples was calculated using the R software. See Appendix 2A–D for original files and codes. The strongest positive correlation was observed between neutrophils and monocytes, with a correlation coefficient of 0.52, and the strongest negative correlation was noted between mast cells and CD8 T cells with a correlation coefficient of 0.64 (Figure 6B). In comparison with normal samples, UC samples contained a higher proportion of memory B cells and M1 macrophages (P < 0.05) (Figure 6C).
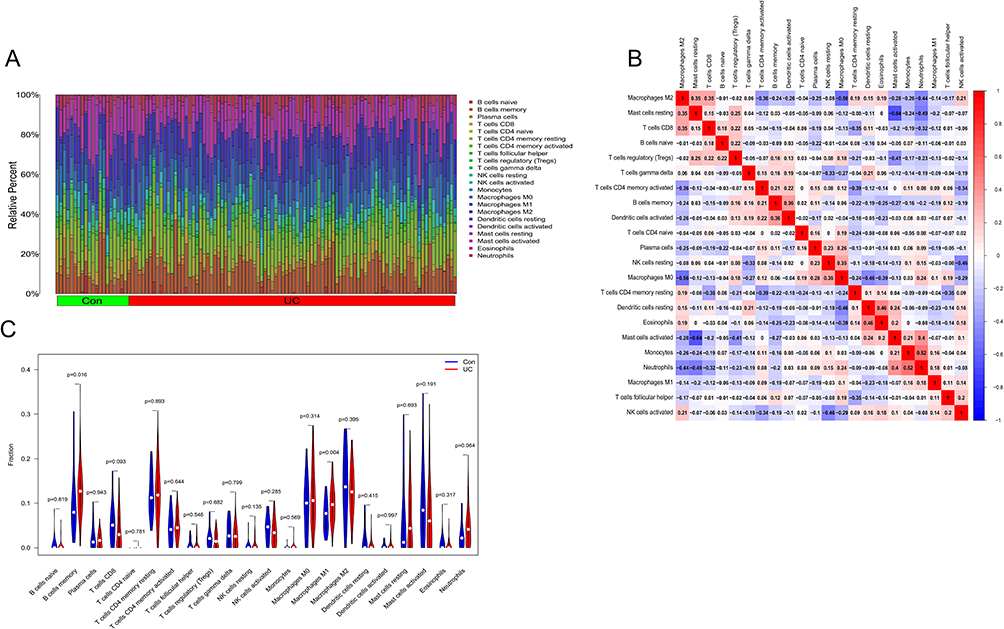 |
Figure 6 (A) Results of immune cell infiltration in the colon of UC patients and normal subjects; (B) heat map of the correlation of 22 immune cell species in UC; (C) the violin plot of the ratio of 22 immune cell species. |
Correlation Analysis of Core Genes and Infiltration-Related Immune Cells
According to the results of correlation analysis, AQP8 (Figure 7A) was positively correlated with M2 macrophages (R=0.52, p=7.7E-09), eosinophils (R=0.33, p= 0.00045), and resting mast cells (R=0.29, p=0.0017). On the contrary, the gene was negatively correlated with M0 macrophages (R=−0.51, p=8.8e−09), neutrophils (R=−0.48, p= 7e−08), and M1 macrophages (R=−0.34, p=3e−04). HMGCS2 (Figure 7B) was positively correlated with M2 macrophages (R=0.62, p=2.2e−16), eosinophils (R=0.36, p=0.00011), and resting mast cells (R=0.33, p=4e−04). The gene was negatively correlated with M0 macrophages (R=−0.65, p=5.6e−15), neutrophils (R=−0.44, p=1.5e−06), and M1 macrophages (R=−0.38, p=4e−05). VNN1 (Figure 7C) was positively correlated with neutrophils (R=0.27, p=0.0035), plasma cells (R=0.26, p=0.0063), and M0 macrophages (R=0.21, p=0.026) and negatively correlated with CD8+ T cells, B cells, and M2 macrophages, but without statistical difference.
 |
Figure 7 Correlation among AQP8 (A), HMGCS2 (B), VNN1 (C), and infiltrating immune cells. |
Verification of Core Genes
To further verify the relationship between AQP8, HMGCS2, VNN1 and UC, the mouse model of UC was constructed with the DSS-free drinking water method and treated with AZA gavage. The results showed that the expressions of AQP8 (Figures 8A) and HMGCS2 (Figures 8B) mRNA decreased significantly in the UC mouse model group and increased after AZA treatment. However, VNN1 (Figures 8C) and TNF-α (Figures 8D) mRNA increased in the UC mouse model group and decreased after AZA treatment. Furthermore, the infiltration of macrophages, monocytes, and neutrophils improved (Figure 9).
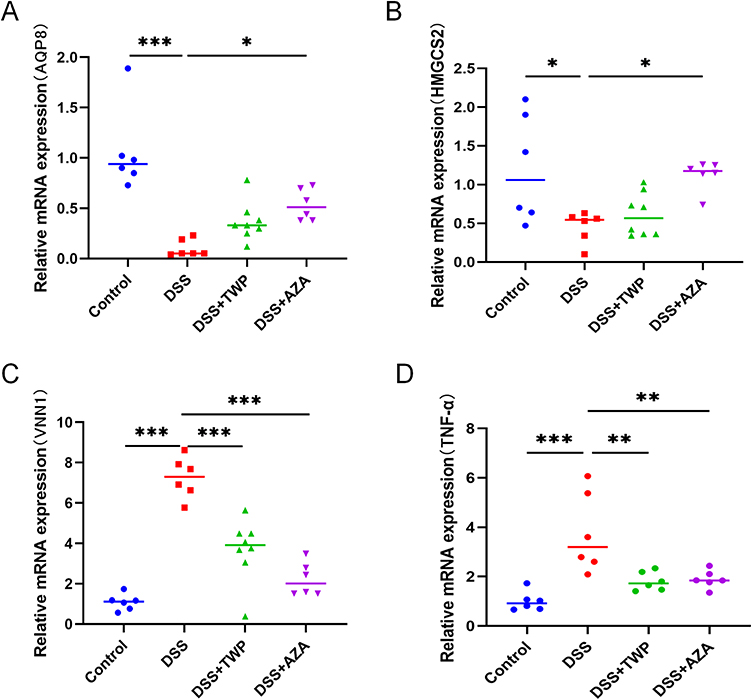 |
Figure 8 Expression of AQP8 (A), HMGCS2 (B), and VNN1 (C) and TNF-α (D) mRNA in UC mice. *P<0.05, **P<0.01, ***P<0.001. |
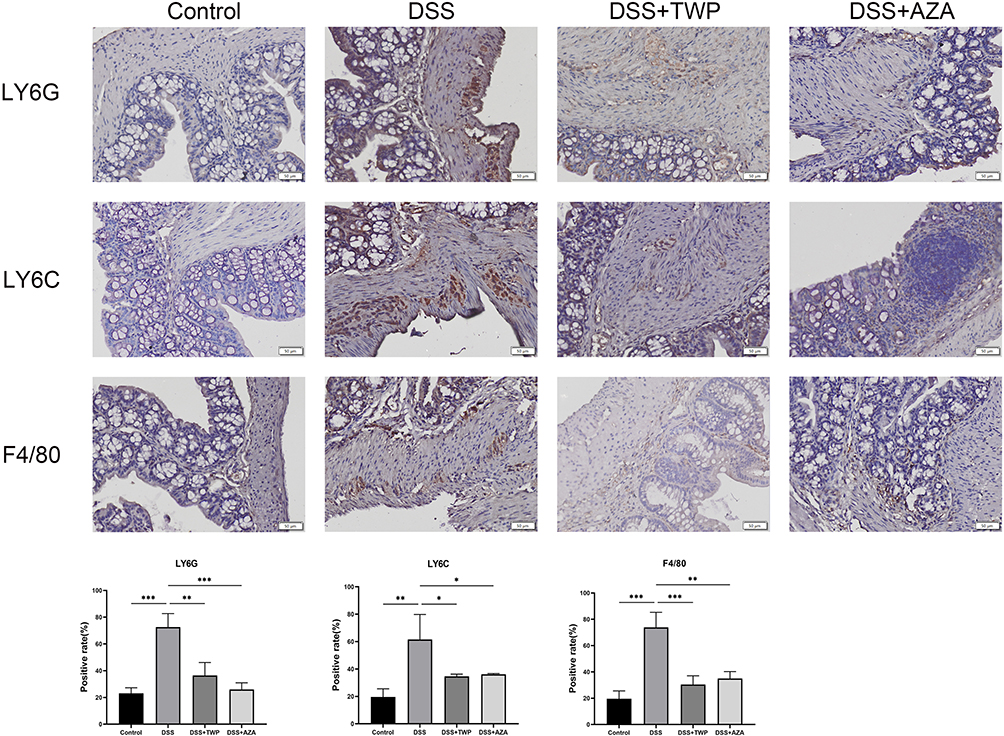 |
Figure 9 Expression of Ly6G, Ly6C and F4/80 in mouse colon. Scale bar: 50μm. Each data represents at least three independent experiments. *P<0.05, **P<0.01, ***P<0.001. |
Discussion
UC is a disease of the colon that causes inflammation, and its exact cause is not yet fully understood. The inflammation affects the mucosa and can lead to chronic intestinal inflammation, colectomy, and even cancer. Research suggests that the infiltration of immune inflammatory cells plays a key role in the development and progression of UC. Identifying novel core genes associated with UC and investigating their correlation with immune cells is crucial for understanding the underlying immune molecular mechanisms of UC. The effects of TWP and AZA interventions can shed light on the differential regulation of core genes and immune cell infiltration.
For the integration of two groups of microarray datasets, this study selected 36 DEGs including 20 upregulated and 16 downregulated genes. The results revealed that, after enrichment, the DEGs were closely related to immune responses, inflammation, and signaling pathways. The presence of a strong immune activation process in UC was observed, and the participation of several immune cells eventually caused intestinal inflammation and damage to the intestinal mucosal barrier. After machine learning screening and verification, AQP8, HMGCS2 and VNN1 were found to be the likely core genes of UC, and they exhibited different degrees of correlation with neutrophils, macrophages, and monocytes.
Aquaporins (AQP) belong to a family of integrated membrane proteins that reside in the apical membrane of colonic epithelial cells and mediate passive transmembrane transport of water.10–12 Hence, AQP8 plays an important role in the absorption of intestinal water. When the expression of AQP8 in the UC intestine is downregulated,13 its distribution is altered,14,15 and the polarity of the epithelium is destroyed, which ultimately leads to intestinal barrier damage and water absorption impairment.16 However, when AQP8 expression is upregulated, intestinal barrier repair is promoted.17 AQP8 is positively correlated with M2 macrophages, eosinophils, and resting mast cells and negatively correlated with M0 macrophages, neutrophils, and M1 macrophages. A study has noted that AQPs are correlated with macrophage infiltration,18 but their relationship with other immune cells is less studied and needs to be further explored.
Mitochondrial 3-hydroxy-3-methylglutaryl CoA synthase 2 (HMGCS2) belongs to the HMG-CoA synthase family, and this protein is a key mitochondrial enzyme that is involved in ketogenesis.19 HMGCS2 is expressed in the most differentiated areas of the intestinal mucosa and promotes the differentiation of intestinal cells into goblet cells, Paneth cell, and epithelial cells. The decrease in the level of HMGCS2 in the intestine induces the development of UC, thereby resulting in an imbalance in the differentiation and proliferation of enterocytes.20–23 More importantly, HMGCS2-mediated fatty acid β-oxidation-ketogenesis acts as a protective mechanism, inhibiting M1 macrophage activation and attenuating TNF-α-induced intestinal cell apoptosis, CXCL3 expression, and ROS production.24,25 A negative correlation was perceived between HMGCS2 and M0 macrophages, neutrophils, and M1 macrophages in this study. M2 macrophages, eosinophils, and resting mast cells were positively correlated with HMGCS2 but M0 macrophages were negatively correlated with HMGCS2, which further confirms that HMGCS2 has a protective effect on UC. Therefore, HMGCS2 is expected to become one of the potential targets for the treatment of UC.
Vascular noninflammatory molecule 1 (VNN1) is a glycosylphosphatidylinositol anchored pan-enzyme, which is expressed by intestinal epithelial cells and induces macrophage polarization. When catalyzed to cysteamine, VNN1 in turn promotes chemokine secretion by neutrophils, which plays pertinent role in oxidative stress, inflammation, and cell migration.26–29 VNN1 is highly expressed in UC colon, and three single nucleotide polymorphisms in VNN1 were found to be associated with genetic susceptibility to IBD.30 VNN1-KO mice can resist oxidative stress-induced intestinal injury,31,32 with significantly decreases the expression of inflammatory factors and reduces intestinal inflammation, which may be related to the inhibition of the PPAR-γ pathway.33 This study showed that VNN1 was positively correlated with neutrophils, plasma cells, and M0 macrophages but not negatively correlated with other immune cells. Therefore, the proinflammatory effect of VNN1 may be one of the potential mechanisms in the pathogenesis of UC. Hence, treatment targeting VNN1 may alleviate the intestinal immune inflammatory response in UC.
Currently, there is no conclusive evidence indicating a direct functional relationship between AQP8, HMGCS2, and VNN1 in relation to ulcerative colitis (UC). However, each of these proteins represents distinct functions within the context of UC. AQP8 is involved in intestinal water absorption, HMGCS2 serves as a protective factor against UC, and VNN1 acts as a pro-inflammatory factor. Notably, KEGG analysis has identified the IL-17 signaling pathway as being significantly enriched in UC. IL-17 is a crucial effector factor produced by Th17 cells that can stimulate the release of pro-inflammatory factors and neutrophil chemokines, ultimately regulating tissue inflammatory response. Its role in the immune regulation network and its association with inflammation and autoimmune diseases is well-established. Therefore, it is plausible to assume that a correlation exists between the three genes and the IL-17 signaling pathway, although further confirmation is required.
UC is an autoimmune disease caused by the over activation of the immune system. To better illustrate the impact of immune cell infiltration in UC, immune infiltration was assessed using CIBERSORT. Increased infiltration of neutrophils, activated mast cells, monocytes, and M0/M1 type macrophages and decreased infiltration of M2 type macrophages, resting mast cells, and CD8+ T cells were noted in this study. The above immune cells may be associated with the development of UC. In the early stage of UC inflammation, neutrophils are activated and get accumulated in the damaged area, thus forming neutrophil extracellular traps to destroy the intestinal pathogens, relieve the intestinal mucosal inflammation, repair the intestinal mucosa, and maintain the intestinal homeostasis.3 If inflammation persists, excessive accumulation and activation of neutrophils can impede the recovery of the intestinal mucosa. Mast cells (MC) are usually associated with type I hypersensitivity, but MCs also have a key role in UC. MCs induce IL-33 secretion, thereby creating a proinflammatory microenvironment in the intestine by producing histamine, aggregating neutrophils, and exacerbating inflammation.34,35 Blood monocytes play an important role in innate immune defense by phagocytosing pathogens and digesting, processing, and presenting antigens. Moreover, monocytes are the sole source of intestinal macrophages.36 Macrophages are crucial for innate immunity and microenvironmental homeostasis in the intestine.37 They are polarized into different phenotypes upon stimulation, with M1-type macrophages playing a significant proinflammatory role in UC.
In this study, macrophages, monocytes, and neutrophils were selected for verification in vivo. Ly6G is a marker of neutrophils, Ly6C is a marker of proinflammatory monocytes, and F4/80 is a surface marker of mouse macrophages. Several studies have confirmed that the expressions of the three markers are increased in the UC colon.38–41 This finding was demonstrated in the present study too, where the expressions of neutrophils, monocytes, and macrophages were increased in the UC intestine. This increase was accompanied by an increase in the inflammatory factor TNF-α. Simultaneously, the expressions of AQP8 and HMGCS2 decreased in the UC model group, whereas that of VNN1 increased. As a commonly used immunosuppressive agent in the treatment of UC, AZA has a good immunosuppressive effect and can effectively reduce the infiltration of various immune cells.42,43 This study showed that after AZA treatment, the infiltration of neutrophils, monocytes, and macrophages was significantly lowered, TNF-α was decreased, AQP8 and HMGCS2 were increased compared with the model group, and VNN1 was decreased compared with the model group. This finding indicates that immune cells and AQP8, HMGCS2, and VNN1 are involved in the pathways of AZA. This observation further suggests that immune cells, AQP8, HMGCS2, and VNN1 are involved in the pathogenesis of UC.
Intestinal inflammation in UC is commonly associated with immune inflammatory cell infiltration. This study highlights AQP8, HMGCS2, and VNN1 as core genes in UC that are linked to immune cells. TWP has been found to have a significant therapeutic effect on UC and also exhibits immunoregulatory properties. AZA, a commonly used immunosuppressant for UC treatment, has been observed to reduce the infiltration of various immune inflammatory cells (33–35). In vivo studies have shown that TWP and AZA have an impact on immune cells, but they have different mechanisms of immune regulation. TWP targets pro-inflammatory genes like VNN1 and has limited regulatory effects on protective genes such as AQP8 and HMGCS2. On the other hand, AZA affects all three genes and regulates them. The study highlights the differences in immune regulatory mechanisms between TWP and AZA in reducing immune cell infiltration. It also suggests that AQP8, HMGCS2, and VNN1 may be associated with immune cell infiltration, indicating a potential pathogenesis of UC immune inflammation.
Hence, further experimental validation is required. Although lacking direct experimental verification, the significance of the three genes in immune inflammation warrants further investigation. Our future research will focus on exploring their relationship with immune cells and underlying mechanisms.
Conclusion
This study identified AQP8, HMGCS2, and VNN1 as the central genes associated with UC. These genes are linked to the infiltration of neutrophils, monocytes, and macrophages, and potentially play a role in the IL-17 signaling pathway, contributing to the development of UC. Identifying the immunotherapy targets and optimizing immunomodulatory therapy for patients with UC may be achieved with an in-depth exploration of immune cells.
Abbreviations
UC, ulcerative colitis; GEO, gene expression omnibus; LASSO, least absolute shrinkage and selection operator; SVM, support vector machine; GO, gene Ontology; KEGG, Kyoto encyclopedia of genes and genomes; ROC, receiver operating characteristic; AUC, area under ROC curve; DEGs, differentially expressed genes; GSEA, Gene Set Enrichment Analysis; DSS, dextran sulfate sodium; AZA, azathioprine; AQP, aquaporins; HMGCS2, mitochondrial 3-hydroxy-3-methylglutaryl CoA synthase 2; VNN1, vascular noninflammatory molecule 1; MC, mast cells.
Acknowledgments
This study benefited from the GEO website, and we thank the GEO website for generously sharing a large amount of data. The authors would like to thank all the reviewers who participated in the review, as well as MJEditor (www.mjeditor.com) for providing English editing services during the preparation of this manuscript.
Author Contributions
DPQ: responsible for project planning and implementation, review of manuscripts; DYZ: bioinformatics analysis, experimental validation, and manuscript drafting; LMY: article conception, data processing, and manuscript revision; QY: data review, revision and translation of manuscripts. All authors made substantial contributions to conception and design, acquisition of data, or analysis and interpretation of data; took part in drafting the article or revising it critically for important intellectual content; agreed to submit to the current journal; gave final approval of the version to be published; and agree to be accountable for all aspects of the work.
Funding
National Natural Science Foundation of China (No. 81973617). The Research Fund Project of Zhejiang Chinese Medical University (2022YKJ02).
Disclosure
This study has no conflict of interest.
References
1. Magro F, Rodrigues A, Vieira AI, et al. Review of the disease course among adult ulcerative colitis population-based longitudinal cohorts. Inflamm Bowel Dis. 2012;18(3):573–583. doi:10.1002/ibd.21815
2. Na YR, Stakenborg M, Seok SH, Matteoli G. Macrophages in intestinal inflammation and resolution: a potential therapeutic target in IBD. Nat Rev Gastroenterol Hepatol. 2019;16(9):531–543. doi:10.1038/s41575-019-0172-4
3. Nicolás-ávila JÁ, Adrover JM, Hidalgo A. Neutrophils in homeostasis, immunity, and cancer. Immunity. 2017;46(1):15–28. doi:10.1016/j.immuni.2016.12.012
4. Leonardi I, Li X, Iliev ID. Macrophage interactions with fungi and bacteria in inflammatory bowel disease. Curr Opin Gastroenterol. 2018;34(6):392–397. doi:10.1097/MOG.0000000000000479
5. Schriml LM, Munro JB, Schor M, et al. The human disease ontology 2022 update. Nucleic Acids Res. 2022;50(D1):D1255–D1261. doi:10.1093/nar/gkab1063
6. Ruiz de Morales JMG, Puig L, Daudén E, et al. Critical role of interleukin (IL)-17 in inflammatory and immune disorders: an updated review of the evidence focusing in controversies. Autoimmun Rev. 2020;19(1):102429. doi:10.1016/j.autrev.2019.102429
7. Li J, Liu C, Chen Y, et al. Tumor characterization in breast cancer identifies immune-relevant gene signatures associated with prognosis. Front Genet. 2019;10:1119. doi:10.3389/fgene.2019.01119
8. Bai Z, Luo Y, Tian L. ERCC5, HES6 and RORA are potential diagnostic markers of coronary artery disease. FEBS Open Bio. 2022;12(10):1814–1827. doi:10.1002/2211-5463.13469
9. Tang Y, Liang M, Tao L, Deng M, Li T. Machine learning–based diagnostic evaluation of shear-wave elastography in BI-RADS category 4 breast cancer screening: a multicenter, retrospective study. Quant Imaging Med Surg. 2022;12(2):1223–1234. doi:10.21037/qims-21-341
10. Zahn A, Moehle C, Langmann T, et al. Aquaporin-8 expression is reduced in ileum and induced in colon of patients with ulcerative colitis. World J Gastroenterol. 2007;13(11):1687–1695. doi:10.3748/wjg.v13.i11.1687
11. Zhao GX, Dong PP, Peng R, et al. Expression, localization and possible functions of aquaporins 3 and 8 in rat digestive system. Biotech Histochem. 2016;91(4):269–276. doi:10.3109/10520295.2016.1144079
12. Wu DQ, Yang ZF, Wang KJ, et al. AQP8 inhibits colorectal cancer growth and metastasis by down-regulating PI3K/AKT signaling and PCDH7 expression. Am J Cancer Res. 2018;8(2):266–279.
13. Planell N, Lozano JJ, Mora-Buch R, et al. Transcriptional analysis of the intestinal mucosa of patients with ulcerative colitis in remission reveals lasting epithelial cell alterations. Gut. 2013;62(7):967–976. doi:10.1136/gutjnl-2012-303333
14. Hardin JA, Wallace LE, Wong JFK, et al. Aquaporin expression is downregulated in a murine model of colitis and in patients with ulcerative colitis, Crohn’s disease and infectious colitis. Cell Tissue Res. 2004;318(2):313–323. doi:10.1007/s00441-004-0932-4
15. Zhao G, Li J, Wang J, Shen X, Sun J. Aquaporin 3 and 8 are down-regulated in TNBS-induced rat colitis. Biochem Biophys Res Commun. 2014;443(1):161–166. doi:10.1016/j.bbrc.2013.11.067
16. Koyama Y, Yamamoto T, Tani T, et al. Expression and localization of aquaporins in rat gastrointestinal tract. Am J Physiol. 1999;276(3):C621–627. doi:10.1152/ajpcell.1999.276.3.C621
17. Qu Y, Zhang SX, Fu LY, et al. 荆芥、防风对溃疡性结肠炎大鼠结肠黏膜AQP4和AQP8表达的影响 [Effect of Schizonepetae Herba and Saposhnikoviae Radix on expression of AQP4 and AQP8 in colonic mucosa of rats with ulcerative colitis]. Zhongguo Zhong Yao Za Zhi. 2020;45(15):3719–3725. Chinese. doi:10.19540/j.cnki.cjcmm.20200220.401
18. Yang J, Yu S, Zhang G, et al. Different expressions of aquaporin water channels and macrophages infiltration in human cervix remodeling during pregnancy. Biol Reprod. 2022;106(1):173–184. doi:10.1093/biolre/ioab191
19. Low END, Mokhtar NM, Wong Z, Raja Ali RA. Colonic mucosal transcriptomic changes in patients with long-duration ulcerative colitis revealed colitis-associated cancer pathways. J Crohns Colitis. 2019;13(6):755–763. doi:10.1093/ecco-jcc/jjz002
20. Kim JT, Li C, Weiss HL, et al. Regulation of Ketogenic Enzyme HMGCS2 by Wnt/β-catenin/PPARγ pathway in intestinal cells. Cells. 2019;8(9):E1106. doi:10.3390/cells8091106
21. Schniers A, Goll R, Pasing Y, Sørbye SW, Florholmen J, Hansen T. Ulcerative colitis: functional analysis of the in-depth proteome. Clin Proteomics. 2019;16:4. doi:10.1186/s12014-019-9224-6
22. Wang Q, Zhou Y, Rychahou P, et al. Ketogenesis contributes to intestinal cell differentiation. Cell Death Differ. 2017;24(3):458–468. doi:10.1038/cdd.2016.142
23. Camarero N, Mascaró C, Mayordomo C, Vilardell F, Haro D, Marrero PF. Ketogenic HMGCS2 Is a c-Myc target gene expressed in differentiated cells of human colonic epithelium and down-regulated in colon cancer. Mol Cancer Res. 2006;4(9):645–653. doi:10.1158/1541-7786.MCR-05-0267
24. Zhang L, Shi J, Du D, et al. Ketogenesis acts as an endogenous protective programme to restrain inflammatory macrophage activation during acute pancreatitis. EBioMedicine. 2022;78:103959. doi:10.1016/j.ebiom.2022.103959
25. Kim JT, Napier DL, Kim J, et al. Ketogenesis alleviates TNFα-induced apoptosis and inflammatory responses in intestinal cells. Free Radic Biol Med. 2021;172:90–100. doi:10.1016/j.freeradbiomed.2021.05.032
26. Kang M, Qin W, Buya M, et al. VNN1, a potential biomarker for pancreatic cancer-associated new-onset diabetes, aggravates paraneoplastic islet dysfunction by increasing oxidative stress. Cancer Lett. 2016;373(2):241–250. doi:10.1016/j.canlet.2015.12.031
27. Takai T. A novel recognition system for MHC class I molecules constituted by PIR. Adv Immunol. 2005;88:161–192. doi:10.1016/S0065-2776(05)88005-8
28. Martin F, Malergue F, Pitari G, et al. Vanin genes are clustered (human 6q22-24 and mouse 10A2B1) and encode isoforms of pantetheinase ectoenzymes. Immunogenetics. 2001;53(4):296–306. doi:10.1007/s002510100327
29. Giessner C, Millet V, Mostert KJ, et al. Vnn1 pantetheinase limits the Warburg effect and sarcoma growth by rescuing mitochondrial activity. Life Sci Alliance. 2018;1(4):e201800073. doi:10.26508/lsa.201800073
30. Gensollen T, Bourges C, Rihet P, et al. Functional polymorphisms in the regulatory regions of the VNN1 gene are associated with susceptibility to inflammatory bowel diseases. Inflamm Bowel Dis. 2013;19(11):2315–2325. doi:10.1097/MIB.0b013e3182a32b03
31. Martin F, Penet MF, Malergue F, et al. Vanin-1(-/-) mice show decreased NSAID- and Schistosoma-induced intestinal inflammation associated with higher glutathione stores. J Clin Invest. 2004;113(4):591–597. doi:10.1172/JCI19557
32. Berruyer C, Martin FM, Castellano R, et al. Vanin-1-/- mice exhibit a glutathione-mediated tissue resistance to oxidative stress. Mol Cell Biol. 2004;24(16):7214–7224. doi:10.1128/MCB.24.16.7214-7224.2004
33. Berruyer C, Pouyet L, Millet V, et al. Vanin-1 licenses inflammatory mediator production by gut epithelial cells and controls colitis by antagonizing peroxisome proliferator-activated receptor gamma activity. J Exp Med. 2006;203(13):2817–2827. doi:10.1084/jem.20061640
34. Wechsler JB, Szabo A, Hsu CL, et al. Histamine drives severity of innate inflammation via histamine 4 receptor in murine experimental colitis. Mucosal Immunol. 2018;11(3):861–870. doi:10.1038/mi.2017.121
35. Lyons DO, Pullen NA. Beyond IgE: alternative mast cell activation across different disease states. Int J Mol Sci. 2020;21(4):E1498. doi:10.3390/ijms21041498
36. Gren ST, Grip O. Role of monocytes and intestinal macrophages in Crohn’s disease and ulcerative colitis. Inflamm Bowel Dis. 2016;22(8):1992–1998. doi:10.1097/MIB.0000000000000824
37. Zhang J, Zhao Y, Hou T, et al. Macrophage-based nanotherapeutic strategies in ulcerative colitis. J Control Release. 2020;320:363–380. doi:10.1016/j.jconrel.2020.01.047
38. Chulkina MM, Pichugin AV, Ataullakhanov RI. Pharmaceutical grade synthetic peptide Thr-Glu-Lys-Lys-Arg-Arg-Glu-Thr-Val-Glu-Arg-Glu-Lys-Glu ameliorates DSS-induced murine colitis by reducing the number and pro-inflammatory activity of colon tissue-infiltrating Ly6G+ granulocytes and Ly6C+ monocytes. Peptides. 2020;132:170364. doi:10.1016/j.peptides.2020.170364
39. Kang ZP, Wang MX, Wu TT, et al. Curcumin Alleviated Dextran Sulfate Sodium-Induced Colitis by Regulating M1/M2 Macrophage Polarization and TLRs Signaling Pathway. Evid Based Complement Alternat Med. 2021;2021:3334994. doi:10.1155/2021/3334994
40. Qu S, Shen Y, Wang M, Wang X, Yang Y. Suppression of miR-21 and miR-155 of macrophage by cinnamaldehyde ameliorates ulcerative colitis. Int Immunopharmacol. 2019;67:22–34. doi:10.1016/j.intimp.2018.11.045
41. Qiu S, Li P, Zhao H, Li X. Maresin 1 alleviates dextran sulfate sodium-induced ulcerative colitis by regulating NRF2 and TLR4/NF-kB signaling pathway. Int Immunopharmacol. 2020;78:106018. doi:10.1016/j.intimp.2019.106018
42. Ginestal R, Pérez-Köhler B, Pérez-López P, et al. Comparing the influence of two immunosuppressants (fingolimod, azathioprine) on wound healing in a rat model of primary and secondary intention wound closure. Wound Repair Regen. 2019;27(1):59–68. doi:10.1111/wrr.12685
43. Marinković G, Hamers AAJ, de Vries CJM, de Waard V. 6-Mercaptopurine reduces macrophage activation and gut epithelium proliferation through inhibition of GTPase Rac1. Inflamm Bowel Dis. 2014;20(9):1487–1495. doi:10.1097/MIB.0000000000000122
 © 2023 The Author(s). This work is published and licensed by Dove Medical Press Limited. The
full terms of this license are available at https://www.dovepress.com/terms
and incorporate the Creative Commons Attribution
- Non Commercial (unported, 3.0) License.
By accessing the work you hereby accept the Terms. Non-commercial uses of the work are permitted
without any further permission from Dove Medical Press Limited, provided the work is properly
attributed. For permission for commercial use of this work, please see paragraphs 4.2 and 5 of our Terms.
© 2023 The Author(s). This work is published and licensed by Dove Medical Press Limited. The
full terms of this license are available at https://www.dovepress.com/terms
and incorporate the Creative Commons Attribution
- Non Commercial (unported, 3.0) License.
By accessing the work you hereby accept the Terms. Non-commercial uses of the work are permitted
without any further permission from Dove Medical Press Limited, provided the work is properly
attributed. For permission for commercial use of this work, please see paragraphs 4.2 and 5 of our Terms.