Back to Journals » Diabetes, Metabolic Syndrome and Obesity » Volume 19
Integrated Bioinformatic and Experimental Identification of DHCR24 and NRG1 as Key Cellular Aging Genes in Diabetic Cardiomyopathy
Authors Xiao WW ![]() , Gao X
, Gao X ![]() , Zhang XR, Li HY, Zou ALZ, Miao ZM, Zou SP, Chen HJ
, Zhang XR, Li HY, Zou ALZ, Miao ZM, Zou SP, Chen HJ ![]() , Yu SM
, Yu SM
Received 16 November 2025
Accepted for publication 13 March 2026
Published 23 June 2026 Volume 2026:19 578414
DOI https://doi.org/10.2147/DMSO.S578414
Checked for plagiarism Yes
Review by Single anonymous peer review
Peer reviewer comments 2
Editor who approved publication: Dr Rebecca Baqiyyah Conway
Wei-Wei Xiao,1,2,* Xue Gao,3,* Xin-Ru Zhang,1,* Hou-Yu Li,1 An-Ling-Zi Zou,1 Zhuo-Meng Miao,1 Shuang-peng Zou,1 Hong-Jin Chen,4,5 Shao-Mei Yu1,5,6
1Department of Ultrasound Medicine, The Affiliated Hospital of Guizhou Medical University, Guiyang, Guizhou, 550004, People’s Republic of China; 2Cancer Laboratory, Affiliated Cancer Hospital, Guizhou Medical University, Guiyang, Guizhou, 550004, People’s Republic of China; 3Department of Ultrasound Medicine, Shanghai Seventh People’s Hospital, Shanghai, Shanghai, 200137, People’s Republic of China; 4Translational Medicine Research Center, Guizhou Medical University, Guiyang, Guizhou, 550004, People’s Republic of China; 5Guizhou Provincial Key Laboratory of Pathogenesis & Drug Research on Common Chronic Diseases, Guizhou Medical University, Guiyang, Guizhou, 550004, People’s Republic of China; 6Guizhou Institute of Precision Medicine, Affiliated Hospital of Guizhou Medical University, Guiyang, Guizhou, 550004, People’s Republic of China
*These authors contributed equally to this work
Correspondence: Shao-Mei Yu, Department of Ultrasound Medicine, the Affiliated Hospital of Guizhou Medical University, No. 28, Guiyi Road, Yunyan District, Guiyang, Guizhou, 550004, People’s Republic of China, Email [email protected] Hong-Jin Chen, Translational Medicine Research Center, Guizhou Medical University, No. 9, Beijing Road, Yunyan District, Guiyang, Guizhou, 550004, People’s Republic of China, Email [email protected]
Purpose: Cell aging (CA) is increasingly recognized as a determinant in the pathogenesis of diabetic cardiomyopathy (DCM), yet the molecular mechanisms underlying this process remain unclear. This study aimed to identify aging-associated targets in diabetic cardiac cells and analyze alterations in intercellular ligand–receptor communication.
Methods: Integrative bioinformatic analysis and single-cell transcriptomics were employed. Differentially expressed genes (DEGs) were extracted from a DCM-related dataset and intersected with 543 aging-associated genes, yielding five candidate genes (NRG1, IGFBP5, IL6, DHCR24, and CDKN1A). These candidates were further screened through Gene Ontology (GO) and Kyoto Encyclopedia of Genes and Genomes (KEGG) pathway enrichment analyses. Subsequent validation involved TF–mRNA–miRNA network construction. The expression and functional roles of the final key genes were investigated using both in vivo (DCM mouse model) and in vitro (myocardial microvascular endothelial cells) models.
Results: Exploratory single-cell transcriptomic profiling suggested NRG1 upregulation in monocytes from the DCM sample, while DHCR24 showed a trend of enrichment in endothelial cells in the single DCM sample analyzed. These preliminary observations, derived from a limited sample without biological replicates, serve to generate hypotheses regarding cell type-specific expression patterns that warrant validation in independent cohorts. In monocytes from DCM samples, while DHCR24 was primarily enriched in endothelial cells of the DCM group. In DCM mouse hearts, qRT-PCR and Western blot analyses confirmed that DHCR24 mRNA and protein levels were significantly downregulated (by approximately 2.89-fold and 1.82-fold, respectively), whereas NRG1 showed an upward trend. In vitro, silencing DHCR24 with siRNA in myocardial microvascular endothelial cells under high-glucose/high-lipid stress significantly reduced cell viability (eg, by 50% in CCK-8 assay) and exacerbated cellular aging phenotypes, including increased senescence-associated β-galactosidase (SA-β-Gal) activity and elevated expression of p21/p16, confirming its protective functional role in DCM pathogenesis.
Conclusion: DHCR24 contributes to the fundamental molecular mechanisms driving DCM and represents a potential therapeutic target for diabetes-related cardiac microvascular injury. These findings, derived from a comprehensive approach spanning bioinformatics to in vivo and in vitro validation, provide robust experimental evidence advancing the understanding of DCM pathogenesis.
Keywords: diabetic cardiomyopathy, cell aging, DHCR24, NRG1, single-cell RNA sequencing
Introduction
Diabetic cardiomyopathy (DCM) is a serious cardiac complication of diabetes mellitus. In 2024, the European Society of Cardiology (ESC) expert consensus redefined DCM as impaired myocardial systolic or diastolic function in diabetic patients, independent of other comorbidities.1 Globally, approximately 12% of patients with long-standing type 2 diabetes mellitus (T2DM) developing clinical or subclinical DCM, and these patients have a significantly higher risk of cardiovascular mortality and hospitalization for heart failure compared to those without DCM.2,3 Therefore, elucidating the early molecular mechanisms of DCM is crucial.
At the molecular level, DCM is closely linked to insulin resistance (IR), a defining feature of T2DM that impairs glucose utilization and disrupts cardiomyocyte metabolism.4 Persistent hyperglycemia activates multiple signaling pathways that promote oxidative stress, endothelial dysfunction, inflammation, and fibrosis in the cardiovascular system.5 Moreover, diabetes-related dyslipidemia accelerate atherogenesis and aggravates myocardial dysfunction.6 Mitochondrial impairment further disrupts energy homeostasis, worsening cardiomyocyte performance. In short, IR creates a permissive environment for cardiovascular injury.7 Although hyperglycemia and IR are recognized as major contributors, the precise mechanisms underlying DCM remain incompletely elucidated. Identification of novel molecular targets is therefore essential to advance innovative therapeutic strategies for DCM.
Cell aging (CA) is defined by irreversible cell cycle arrest driven by DNA damage, gene mutations, or microenvironmental disturbances during signal transduction.8 Hyperglycemia-induced AGE accumulation restricts the removal of senescent cells. Premature senescence of cardiomyocytes constitutes a central pathogenic driver of cardiomyopathy.9,10 Collectively, CA-associated genes represent promising therapeutic targets for DCM management.
Single-cell RNA sequencing (scRNA-Seq) enables transcriptomic profiling at single-cell resolution, capturing both transcriptional states and signaling processes across heterogeneous populations. This approach classifies cell types and functional states through high-resolution expression signatures, delineates intercellular heterogeneity, and reveals dynamic patterns of cell–cell communication.11 By offering comprehensive insights into transcriptional regulation, scRNA-Seq has considerable potential to deepen understanding of genetic mechanisms and to inform novel strategies for disease prevention and therapeutic intervention.12
This study aimed to identify genes associated with CA-related genes (CARGs) in type 2 DCM that are simultaneously implicated in IR, through transcriptomic and scRNA-seq analyses of Gene Expression Omnibus (GEO) datasets. Beyond gene identification, the investigation systematically analyzed related biological pathways, functional roles, molecular regulatory networks, and potential pharmacological targets. Their biological relevance was further verified through extensive in vivo and in vitro experiments, establishing a robust theoretical framework for clarifying pathogenic mechanisms and discovering novel therapeutic targets. Moreover, the influence of these genes on the onset and progression of DCM was delineated, providing new perspectives for advancing both mechanistic research and therapeutic development.
Materials and Methods
Data Source
The DCM datasets were retrieved from the publicly available National Center for Biotechnology Information (NCBI) GEO repository13 using the search terms “diabetic cardiomyopathy” and “diabetic heart”. Selection was refined according to sample source, sequencing approach, research purpose, and modeling duration, resulting in the inclusion of GSE26887,14 GSE161052,15 and GSE213337.16 The GSE26887 dataset, generated by microarray analysis on the GPL6244 platform ([HuGene-1_0-st] Affymetrix Human Gene 1.0 ST Array), served as the training cohort and comprised 7 DCM patients and 5 matched controls.14 Validation was conducted using GSE161052, obtained through high-throughput sequencing on the GPL21273 platform (HiSeq X Ten, Mus musculus),15 encompassing 3 DCM and 3 control mouse samples. Additionally, the GSE213337 dataset, produced with the GPL24247 platform (Illumina NovaSeq 6000, Mus musculus),17 was incorporated, comprising two independent biological samples: one from a control mouse and one from a DCM mouse. However, due to the absence of biological replicates within each group (n=1 per condition), this dataset cannot support statistically robust inter-group comparisons at the single-cell level. Furthermore, because sample identity is perfectly confounded with disease status (ie, all cells from one mouse belong to one condition), potential batch effects cannot be fully disentangled from true biological signals. Furthermore, 543 CARGs were extracted from Supplementary Table 1 of Zhou et al18 For external validation, two additional datasets were analyzed: GSE141910 (human cardiac tissues, n=366) and GSE132176 (congenital heart disease samples, n=20). All datasets were publicly accessible.
Differential Expression and Functional Enrichment Analysis
Initially, by constructing a comparison matrix, a comparison was made between the DCM and control groups. Then, differential expression analysis was applied to the training set using the R package “limma” (v 3.54.0).19 Differential expression analysis employed an intercept-free linear model implemented in the “limma” package, appropriate for direct group comparisons without baseline reference. To address the high dimensionality of transcriptomic data and control false discoveries, raw P-values were adjusted using the Benjamini-Hochberg (BH) procedure to estimate the False Discovery Rate (FDR). We applied dual stringent criteria to define biologically and statistically significant DEGs: (1) FDR-adjusted P-value < 0.05 to minimize false positives arising from multiple testing, and (2) |log2 fold change| > 1 to ensure meaningful biological effect size. This combined threshold balances statistical rigor with biological relevance in high-throughput screening. When plotting the heatmap of the aforementioned results, the expression data were subjected to Z-score normalization to ensure a uniform distribution. The p-values were subjected to multiple test correction using the empirical Bayes correction combined with the False Discovery Rate (FDR) method. Differentially expressed genes (DEGs) obtained from this step were intersected with the 543 CARGs to identify overlapping genes as candidate targets. After the gene IDs were converted from SYMBOL to ENTREZID using bitr function, subsequent functional annotation involved Gene Ontology (GO) and Kyoto Encyclopedia of Genes and Genomes (KEGG) analyses, performed using the R package “clusterProfiler” (v 4.2.2)).20 Candidate genes with enrichment results meeting the cutoff of p.adjust < 0.05 were retained for downstream interpretation of biological functions and signaling pathways implicated in DCM. The p-values were also corrected using the FDR method.
Differential expression results were systematically documented in two complementary tables: (1) a comprehensive list of all tested genes with full statistical metrics (Supplementary Table 2), and (2) a filtered list of significant DEGs meeting dual thresholds of |log2FC| > 1 and FDR-adjusted P-value < 0.05 (Supplementary Table 3). This approach ensures both transparency of the complete analysis and clarity of biologically relevant findings.
Identification of Key Genes
To further assess the expression dynamics of candidate genes in DCM, gene expression levels were compared between DCM and control samples within both the training and validation cohorts. Genes meeting the significance threshold (P < 0.05) and exhibiting concordant expression trends across datasets were designated as key genes.
Gene Set Enrichment Analysis (GSEA)
The functional implications of key genes in DCM progression were evaluated by calculating Spearman correlation coefficients between each key gene and the remaining genes in the DCM samples of the training set using the R package “psych” (v 2.3.6, https://CRAN.R-project.org/package=psych). Correlation values were ordered in descending magnitude to generate a ranked gene list corresponding to each key gene. Using the Molecular Signatures Database (MSigDB, https://www.gsea-msigdb.org/gsea/msigdb), the “c2.cp.kegg.v2023.1.Hs.symbols.gmt” gene set was applied for single-gene GSEA, and pathways with FDR < 0.05 were regarded as significantly enriched.
Construction of Molecular Regulatory Networks
To identify additional genes functionally linked to the key genes, GeneMANIA (http://www.genemania.org/) was applied to predict interacting genes within a gene-gene interaction (GGI) network using DHCR24 and NRG1 as seed genes. Upstream regulation by miRNAs was investigated using the TargetScan (https://www.targetscan.org/vert_80/) and miRNet (https://www.mirnet.ca/miRNet/home.xhtml) databases to predict microRNAs (miRNAs) targeting DHCR24 and NRG1, and intersecting results from both platforms were analyzed to establish common mRNA–miRNA regulatory associations. Furthermore, transcription factors (TFs) associated with DHCR24 and NRG1 were predicted through the miRNet database. The integrated set of predicted miRNAs and TFs was then used to construct an mRNA–miRNA regulatory network, which was visualized in Cytoscape (v 3.8.2).21
Single-Cell Data Analysis
The original data were standardized using the CreateSeuratObject function from the “Seurat” package (v 4.1.0).22 The cell retention criterion was that the number of detected genes should be between 200 and 5000, and the total number of molecules per cell should be less than 20,000. The mitochondrial gene proportion was calculated using the PercentageFeatureSet function, and only cells with a mitochondrial gene expression ratio lower than 5% were retained. The quality control threshold was determined based on the distribution characteristics of key cell indicators. The quality control threshold is determined based on the distribution characteristics of key cell indicators. To remove environmental RNA contamination from single-cell sequencing data, this study used the DecontX algorithm from the celda R package (v 1.26.0) to correct the data that has passed quality control. This method can distinguish the inherent expression profile of cells from the environmental RNA characteristics captured in empty droplets. It uses the expectation-maximization algorithm to iteratively estimate the contamination proportion of each cell and generates a corrected gene expression matrix. The maximum number of iterations is set to 500, and the convergence threshold delta is set to c(10,1) to ensure the stability of parameter estimation. The contamination rate estimated by the DecontX algorithm and the corrected sparse expression matrix presented in sparse matrix format are integrated into the Seurat object for subsequent dimensionality reduction and clustering analysis. The normalization operation was performed using the NormalizeData and FindVariableFeatures functions in Seurat, and 2000 highly variable genes were selected. The selection of dimensionality was verified through three complementary methods: (i) statistical significance test using JackStrawPlot; (ii) ElbowPlot analysis; (iii) biological correlation assessment based on the loadings of marker genes. Subsequently, unsupervised clustering was performed using FindNeighbors and FindClusters. Non-linear dimensionality reduction was achieved using Uniform Manifold Approximation and Projection (UMAP) to cluster and group the cells; cell type annotation was performed using the SingleR package (v 1.831)23 in conjunction with published literature;18 the main cell types in the heart were identified by comparing the gene expression profiles between the DCM group and the control group. Cell-to-cell communication analysis was conducted using the cellchat package (v 1.5.0)24 and presented in the form of a network diagram to show the frequency and intensity of cell interactions.
Cell Culture and Treatments
Mouse heart microvascular endothelial cells (MCECs; Creative Bioarray, Shanghai, China) were maintained in Dulbecco’s Modified Eagle’s Medium (DMEM, Gibco, USA) containing 25 mmol/L glucose and 10% fetal bovine serum (Gibco, USA), under 37°C and 5% CO2. All cellular experiments were performed with at least three independent biological replicates, defined as cells cultured and treated in separate passages on different days. Within each biological replicate, technical triplicates were performed for assays requiring multiple wells (eg, CCK-8, SA-β-Gal). MCECs were seeded in six-well plates and cultured under medium glucose (25 mmol/L), high glucose with high palmitic acid (33.3 mmol/L and 200 µmol/L, respectively), and/or D-mannitol treatment (33.3 mmol/L) once cells reached 60–70% confluence. D-Mannitol served as the osmolality control.
siRNA Transfection
Cells were seeded in 6-well plates (2 × 10⁵ cells/well) and cultured overnight until reaching 60–70% confluence. siRNA specific for [dhcr24] and negative control siRNA (si-NC) were diluted in Opti-MEM® (Thermo Fisher) to 50 nM. Lipofectamine™ 3000 (Invitrogen) was mixed with Opti-MEM® at a 1:50 ratio (v/v), incubated for 5 minutes at room temperature, and subsequently combined with the diluted siRNA in a 1:1 ratio. The resulting complexes were added dropwise to cells and maintained for 6 hours at 37°C, after which the medium was replaced with complete culture medium. Transfection efficiency was confirmed by Western blot analysis 48 hours after transfection. The sequences (5′ to 3′) were as follows:
si-Dhcr24-mouse-1233 (si-1-DHCR24):
Justice chain: GAGAUGAAGCAGAGCUCUATT
ntisense chain: UAGAGCUCUGCUUCAUCUCTT
si-Dhcr24-mouse-1342(si-2-DHCR24):
Justice chain: GCACGGGUUCCAAAUGUUATT
ntisense chain: UAACAUUUGGAACCCGUGCTT
si-Dhcr24-mouse-796(si-3-DHCR24):
Justice chain: GGUCAUGACGGACGACGUATT
ntisense chain: UACGUCGUCCGUCAUGACCTT
Negative control (NC):
Justice chain: AGAAUGGGAAGCUUGUCAUCAATT
Antisense chain: UUGAUGACAAGCUUCCCAUUCUTT
Cell Counting Kit-8 (CCK-8) Assay
Cell viability was determined using the CCK-8 assay kit (HY-K0301, MCE). MCECs pretreated with high glucose and high palmitic acid were incubated with 10 µL of CCK-8 solution for 2 hours at 37°C, and absorbance was recorded at 450 nm with a microplate reader. Data are presented as mean ± SD from three independent biological replicates, each performed in technical triplicate.
Construction of Animal Models with DCM
Male C57BL/6 mice (20–25 g, 4 weeks old) were obtained from the Experimental Animal Center of Guizhou Medical University. All procedures were approved by the Animal Experiment Center Committee of Guizhou Medical University. Mice were randomly allocated to control or DCM groups (n = 10 each) and maintained under specific pathogen-free conditions. After one month of high-fat diet feeding, diabetes was induced in the DCM group via intraperitoneal injection of streptozotocin (STZ, 45 mg/kg/day) for five consecutive days, with successful induction confirmed by fasting blood glucose levels >11.1 mmol/L one week post-injection. The total study duration was 28 weeks (16 weeks of modeling plus 12 additional weeks of observation). During this period, body weight and blood glucose were monitored biweekly. Due to natural attrition during the prolonged protocol, the final cohort for echocardiographic assessment at the endpoint consisted of 10 control and 5 DCM mice. Prior to tissue collection, mice were anesthetized with an intraperitoneal injection of pentobarbital sodium (2% solution, 20 mg/mL) to monitor physiological status. Following echocardiography, euthanasia was performed by a higher dose of pentobarbital sodium (60 mg/mL). Death was confirmed by the complete cessation of respiration and heartbeat, along with the absence of all neurological reflexes. Hearts were then rapidly excised. For histological analysis (HE, Masson, and Sirius Red staining), tissues from all 5 DCM mice and 5 randomly selected control mice were fixed in 4% paraformaldehyde. For Western blotting, left ventricular tissues from 3 randomly selected mice per group were snap-frozen for protein extraction; all three biological replicates per group were analyzed, and representative blots are shown.
Glucose Tolerance Test (GTT) and Insulin Tolerance Test (ITT)
Prior to euthanasia, mice were subjected to a 12-hour fast and subsequently underwent a glucose tolerance test. Baseline glucose concentrations were determined from tail blood using a glucometer strip, after which mice received an intraperitoneal injection of 20% glucose at 2 mg/g body weight (P0013B, BioFroxx). Blood glucose was monitored at 15, 30, 60, 90, and 120 minutes following injection. For the insulin tolerance test, mice were fasted for 6 hours, baseline glucose values were recorded, and an intraperitoneal injection of human insulin at 0.7 mU/g body weight (I2643, Sigma) was administered. Blood glucose levels were then assessed at 15, 30, 60, 90, and 120 minutes after insulin administration.
Quantitative Reverse Transcriptase PCR (qRT-PCR)
Total RNA was isolated from cardiac tissue using Trizol reagent (Invitrogen; Thermo Fisher Scientific, Inc.) and reverse transcribed into cDNA with a reverse transcription kit (R223-01, Vazyme). qRT-PCR was conducted with SYBR Green dye (MD101-02, Vazyme) under the following cycling parameters: initial denaturation at 95°C for 30 seconds, followed by 40 amplification cycles of 95°C for 10 seconds and 60°C for 30 seconds. Relative expression of DHCR24 and NRG1 mRNA in myocardial tissue was quantified using the 2−∆∆Cq method with β-actin as the internal reference. Primer sequences (5′–3′) were as follows:
DHCR24 forward: GATGAATGGTCAACGCGAGC;
DHCR24 reverse: TTTGGGTGACACAGGTTGCT;
NRG1 forward: CGGGAGATGCGAGCATAGAC;
NRG1 reverse: CTCGGGGCTACTCTTGTGTC;
β-actin forward: CACGATGGAGGGGCCGGACTCATC;
β-actin reverse: TAAAGACCTCTATGCCAACACAGT.
Western Blot Analysis
Cardiac tissue was lysed in RIPA buffer (#R0010, Solarbio) supplemented with phosphatase and protease inhibitors (#P1261, Solarbio), with vortexing on ice every 10 minutes for a total of 30 minutes. Lysates were centrifuged at 12,000 × g for 15 minutes, and the supernatants were collected, followed by denaturation in loading buffer. Proteins were separated on 10% SDS-PAGE gels and subsequently transferred to PVDF membranes using cold transfer buffer. Membranes were incubated overnight at 4°C with primary antibodies, including β-actin (1:1000, 66,009-1-IG, ProteinTech), NRG1 (1:1000, 10,527-1-AP, ProteinTech), and DHCR24 (1:1000, 10,471-1-AP, ProteinTech) After washing, membranes were treated with HRP-conjugated secondary antibodies for 1 hour at room temperature, and signals were visualized by the ECL detection system.
Immunohistochemistry
Formalin-fixed, paraffin-embedded tissue sections were subjected to dewaxing, rehydration, and antigen retrieval. Endogenous peroxidase activity was quenched with methanol for 15 minutes, followed by blocking with 5% BSA for 1 hour. Sections were incubated overnight at 4°C with primary antibodies against DHCR24 (1:50,10,471-1-AP, ProteinTech) and NRG1 (1:50, 10,527-1-AP, ProteinTech), then incubated with secondary antibodies for 1 hour at 37°C. Visualization was achieved using a DAB Detection Kit, with hematoxylin counterstaining.
SA-β-Gal Staining
Senescence-associated β-galactosidase (SA-β-Gal) activity was examined using a commercial staining kit (BC2585, Solarbio) in accordance with the manufacturer’s instructions. Staining outcomes were assessed under a light microscope in six randomly selected fields. Quantification was performed across three independent biological replicates, with ≥100 cells counted per replicate.
Statistical Analysis
Statistical analyses were conducted using Prism 8.0 and R software (v4.1.0). Data are expressed as mean ± standard deviation. For non-genomic data (eg, qRT-PCR, Western blot, CCK-8 assay), normality was assessed using the Shapiro–Wilk test, and homogeneity of variance was evaluated using Levene’s test. When both assumptions were met, group comparisons were performed using two-tailed unpaired Student’s t-tests (for two groups) or one-way ANOVA with Tukey’s honestly significant difference (HSD) post-hoc test (for ≥3 groups). If assumptions were violated, non-parametric alternatives were used: Mann–Whitney U-test (two groups) or Kruskal–Wallis test with Dunn’s post-hoc correction (≥3 groups). All tests were two-sided, and P < 0.05 was considered statistically significant.
For differential expression analysis, the R package “limma” (v 3.54.0) was employed. This specialized pipeline implements an empirical Bayes moderated t-test, which is specifically designed for high-dimensional genomic data with small sample sizes. We constructed an intercept-free linear model where the gene expression matrix from the GSE26887 dataset was used as the dependent variable, with sample grouping (“DCM” vs. “Control”) as the categorical independent variable. The linear model was fitted using the lmFit function for each gene independently, followed by the makeContrasts function to establish the comparison between DCM and Control groups (DCM - Control). The contrasts.fit function was then applied to extract the contrast coefficients, and the eBayes function was used to perform empirical Bayes shrinkage of gene-specific standard errors to enhance statistical stability in small sample sizes. This approach inherently assumes that log2-transformed expression values approximate a normal distribution, which is standard practice in microarray/RNA-seq analysis. This process yielded log2 fold change (log2FC) values and corresponding raw P-values for each gene.
Subsequently, the raw P-values from the limma analysis were subjected to false discovery rate (FDR) correction using the Benjamini-Hochberg (BH) method, which is the default method implemented in the eBayes function. The corrected P-values (q-values) were stored in the adj.P.Val column of the results object. We applied dual stringent criteria to identify significant differentially expressed genes (DEGs): |log2FC| > 1 (indicating a ≥2-fold change in expression) and FDR-adjusted P-value < 0.05 (adj.P.Val < 0.05). All statistical tests for genomic data were two-sided. Genes meeting these criteria were further categorized as upregulated (log2FC > 1) or downregulated (log2FC < −1). Biological vs. technical replicates were explicitly distinguished in all analyses: Animal experiments used individual mice as biological replicates; cellular experiments used independently cultured cell passages as biological replicates, with technical replicates averaged within each biological replicate prior to statistical testing.
All high-throughput genomic analyses (eg, DEG detection, GSEA) used FDR-adjusted P-values (q-values) to control for multiple testing, whereas low-dimensional assays (eg, qRT-PCR, WB) reported unadjusted P-values with explicit acknowledgment of exploratory nature when applicable.
Results
The 105 DEGs Were Intersected with 543 CARGs to Yield 5 Candidate Genes
The overall data filtering procedure is presented in Figure 1. In the training cohort, 105 DEGs were identified between DCM and control samples (|log2FC| > 1, FDR-adjusted P-value < 0.05), comprising 61 upregulated and 44 downregulated genes. Full DEG lists with gene symbols, log2 fold changes, raw P-values, and FDR-adjusted P-values are provided in Supplementary Table 2 (all DEGs) and Supplementary Table 3 (significant DEGs only). Visualization of the top 10 genes in each category was achieved through volcano plots and density heatmaps (Figure 2A and B). Intersection of these 105 DEGs with 543 CARGs resulted in five candidate genes (NRG1, IGFBP5, IL6, DHCR24, and CDKN1A), defined as aging-related differential genes (Figure 2C). Functional enrichment using GO and KEGG analyses demonstrated 365 biological process (BP) terms, largely associated with regulation of smooth muscle cell proliferation and Ras protein signaling. Thirty-two molecular function (MF) terms were related to protein kinase activator activity and kinase activator activity, while four cellular component (CC) terms were linked to the endoplasmic reticulum lumen and the cyclin-dependent protein serine/threonine kinase complex. Moreover, twelve significantly enriched KEGG pathways were identified, including the “ErbB signaling pathway”, “HIF-1 signaling pathway”, and “cellular senescence”. The top 15 enriched GO terms and the top 10 KEGG pathways are displayed in Figure 2D and Supplementary Figure 1.
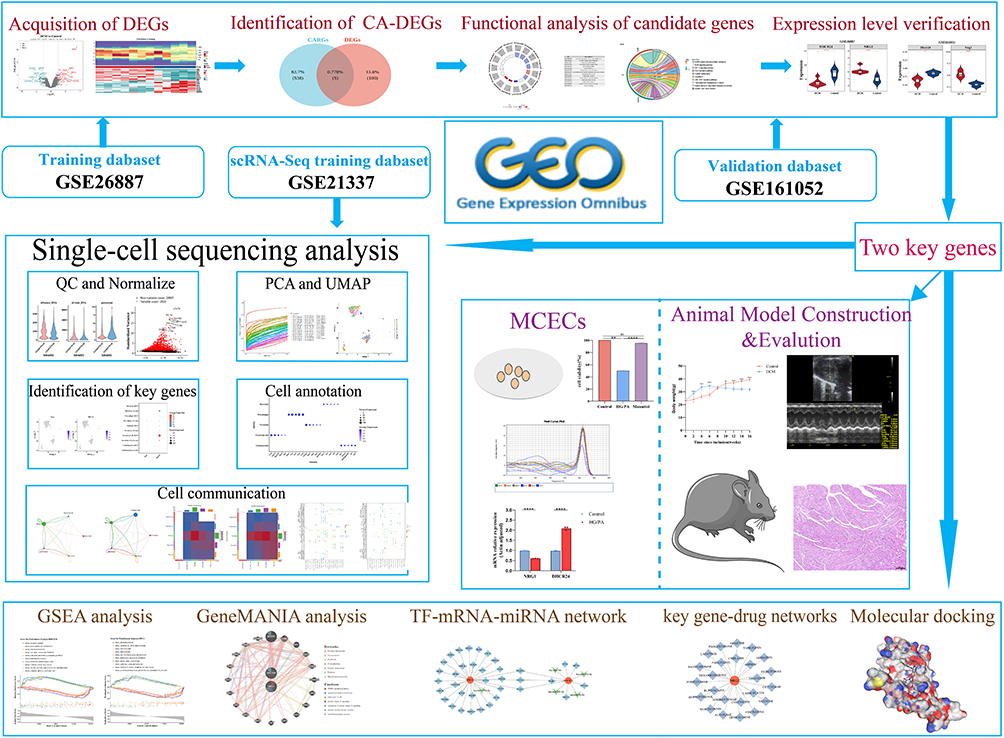 |
Figure 1 Flowchart of the multistep screening strategy on bioinformatics data. |
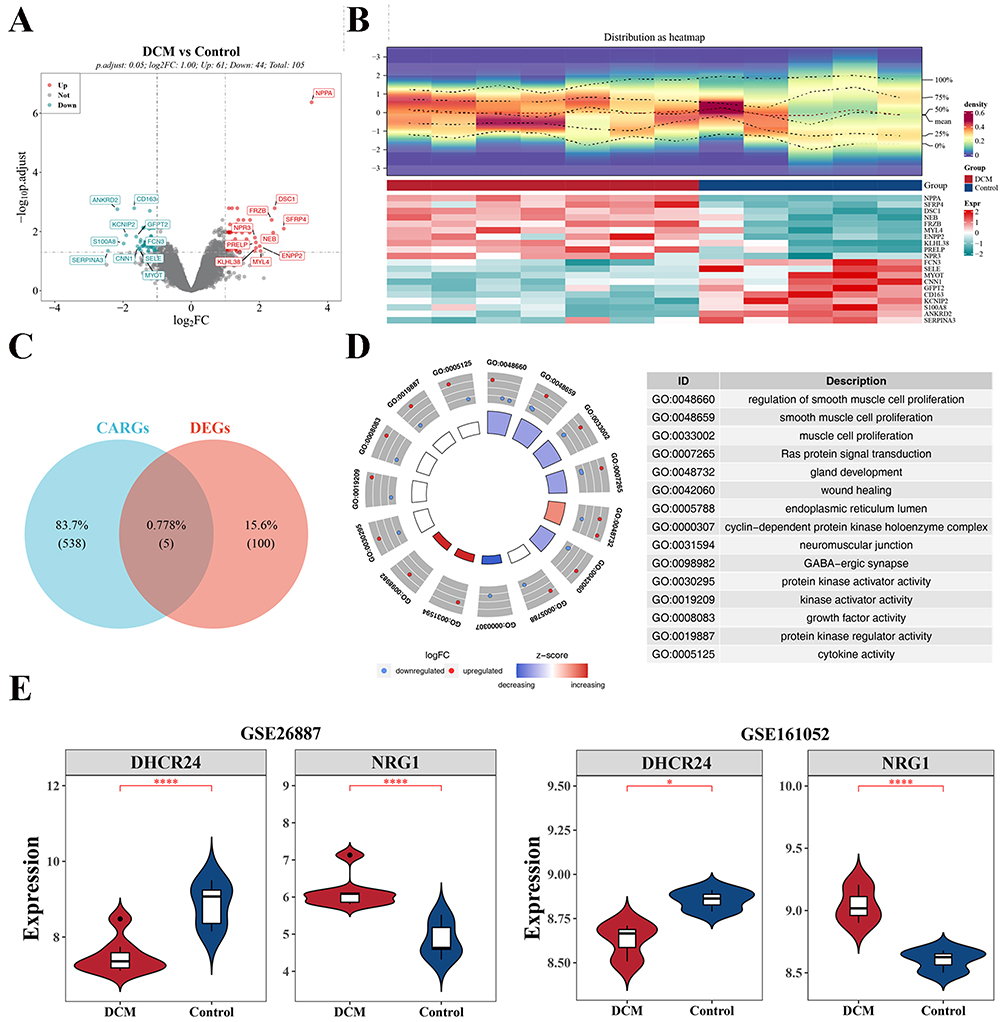 |
Figure 2 Screening and analysis of candidate genes. (A and B) Volcano map and heat map. (C) Describes the Venn diagram of intersecting genes of deg and 543 carg. (D) GO analysis of candidate genes. (E) Boxplot of expression levels of key genes in GSE26887 (left) and GSE161052 (right) (*P<0.05, ****P<0.0001). |
To further delineate expression characteristics, the five candidate genes were examined in both DCM and control groups across the training and validation cohorts, and box plots were constructed to illustrate expression differences (Figure 2E). The results indicated consistent expression patterns of DHCR24 and NRG1 in both datasets, with statistically significant variation (P < 0.05) between DCM and control samples. Specifically, NRG1 was significantly upregulated in DCM samples compared to controls (log2FC = 1.29, P < 0.001), while DHCR24 was significantly downregulated (log2FC = −1.37, P < 0.001). DHCR24 was significantly downregulated in DCM samples (P < 0.05), while NRG1 was significantly upregulated (P < 0.05). The expression levels of the other candidate genes (IGFBP5, IL6, and CDKN1A) did not meet the screening criteria for significant differential expression. Therefore, these two genes were consequently designated as key genes.
GGI and TF-mRNA-miRNA Networks for Key Genes
The biological roles of the key genes implicated in disease progression were examined through multiple analytical approaches. GSEA indicated that DHCR24 participated in 22 signaling pathways, with pronounced involvement in “protein export”, “TGF-BETA signaling pathway”, and “oxidative phosphorylation” (Figure 3A). NRG1 was mapped to 39 pathways, including “protein export”, “aminoacyl tRNA biosynthesis”, and “linoleic acid metabolism” (Figure 3A). The GGI network further connected DHCR7, ERBB3, and GPC1 with the functional spectrum of these genes (Figure 3B), highlighting associations with the “ERBB signaling pathway”, “basolateral plasma membrane”, and “basal part of cell”. TargetScan predicted 151 miRNAs targeting DHCR24 and 24 miRNAs targeting NRG1, while miRNet identified 11 and 32 miRNAs, respectively. Intersection analysis revealed 5 shared mRNA–miRNA interactions. In addition, miRNet predicted 8 TFs regulating DHCR24 and 31 regulating NRG1. Integration of these elements produced a TF–mRNA–miRNA network composed of 43 nodes and 44 edges, incorporating the two key genes, 5 miRNAs, and 36 TFs (Supplementary Figure 2). Among the miRNAs, 4 were linked to DHCR24 and 1 to NRG1, with both genes under the regulation of TFAP2A, GATA2, and FOXF2.
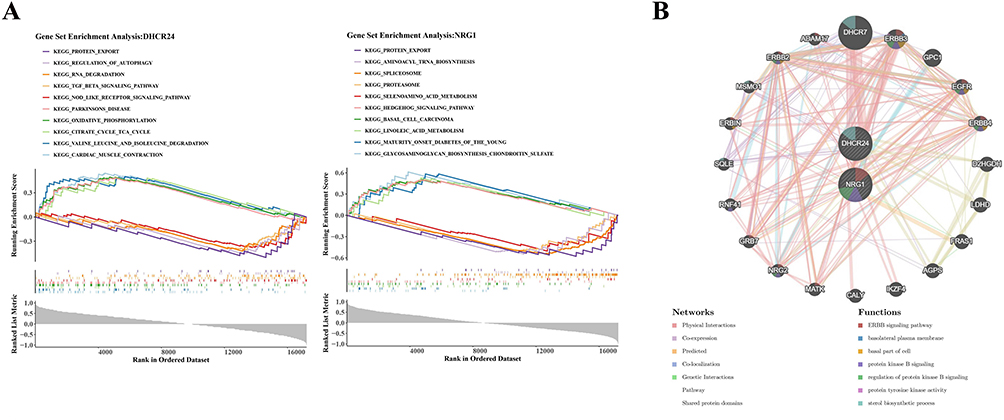 |
Figure 3 Characteristics of key genes. (A) KEGG enrichment pathways of DHCR24 (left) and NRG1 (right). (B) GeneMANIA network diagram of key genes functions. |
Four Cell Types Were Annotated in the Single-Cell Dataset
After quality control of the single-cell sequencing data, 1517 cells and 30,905 genes (Supplementary Figure 3A) were retained. Based on the quality control, the DecontX algorithm was further used to remove environmental RNA contamination and correct the data. After correction, the expression of environmental RNA markers such as ribosomes and mitochondria decreased slightly, and the proportion of zero gene expression remained stable, verifying the effect of the algorithm in specifically removing environmental background noise. 2000 highly variable genes were selected from the corrected data for principal component analysis (Supplementary Figure 3B). The inflection point of the principal component scatter plot appeared at the 30th principal component. The JackStrawPlot analysis confirmed that the first 30 principal components were all statistically significant (P < 0.05) (Supplementary Figure 3C and D). Therefore, the first 30 principal components were selected for downstream analysis.
Using a resolution of 0.8 for unsupervised clustering, the cells were divided into 12 cell clusters. The clusters 0,5,9,11 corresponded to endothelial cells (ECs), cluster 11 to cardiomyocytes, clusters 1, 2, 3, 6, 7, and 8 to fibroblasts, cluster 4 to macrophages (Figure 4A and B). In this exploratory scRNA-seq dataset, preliminary analysis suggested that DHCR24 appeared to be relatively elevated in ECs from the DCM sample compared to the control sample. Among all cell types, ECs represented the highest expression level of this gene (Figure 4C). However, these observations are derived from a single sample per group and should be considered hypothesis-generating pending validation.
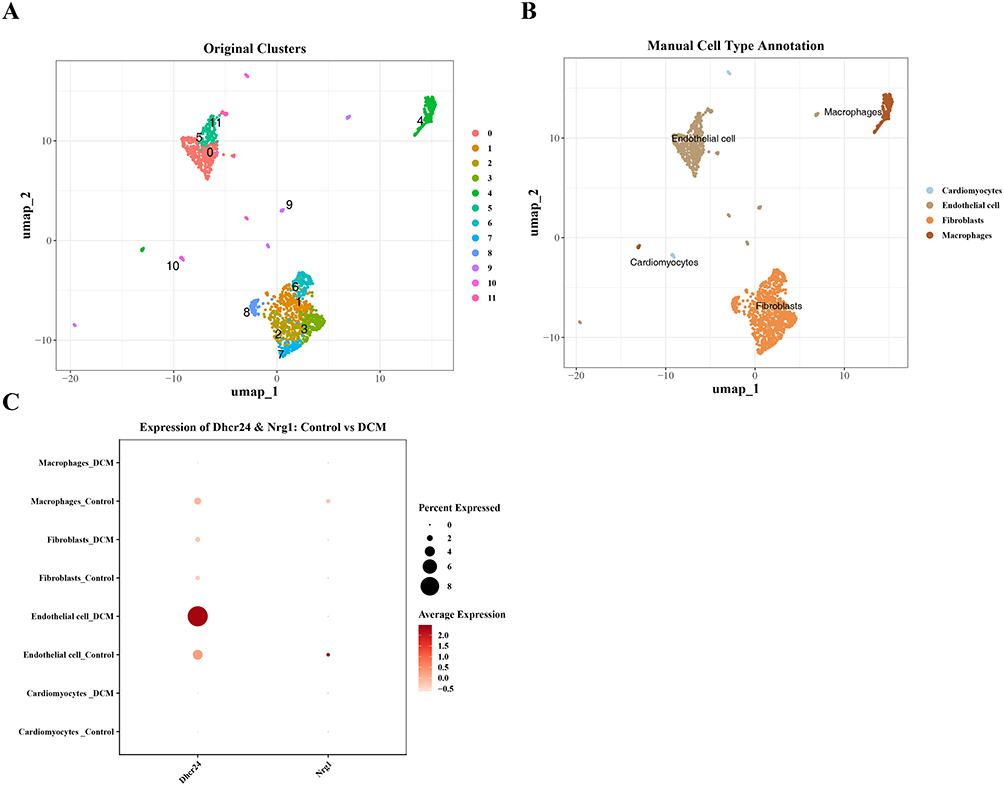 |
Figure 4 Structure and expression of key genes in diabetic mouse cardiomyocytes as shown by single-cell analysis. (A) UMAP dimensionality reduction map of different cell subpopulations, colored by annotated cell types. (B) Bubble plot of marker genes in GSE213337 in different cell types. (C) Bubble plot of expression levels of DHCR24 and NRG1 genes in different cell types. |
The analysis of cell communication networks revealed that there was similarity in the patterns of intercellular interactions between the normal group and the disease group: In the normal group, the number of cell communications and the weight were the highest for fibroblasts (Figure 5A); while in the disease group, fibroblasts became the main cell type involved in cell communication, with the highest number and weight of communications (Figure 5B). The interaction weights between fibroblasts and macrophages, as well as between endothelial cells, were the highest in both groups. The receptor-ligand interaction analysis further clarified the key communication pathways of macrophages: In the normal group, when endothelial cells acted as signal senders, the probability of communicating with fibroblasts through the Cxcl12 - Ackr3 pathway was the highest (Figure 5C). In the disease group, the C3 - C3ar1 pathway became the main receptor-ligand combination (Figure 5D).
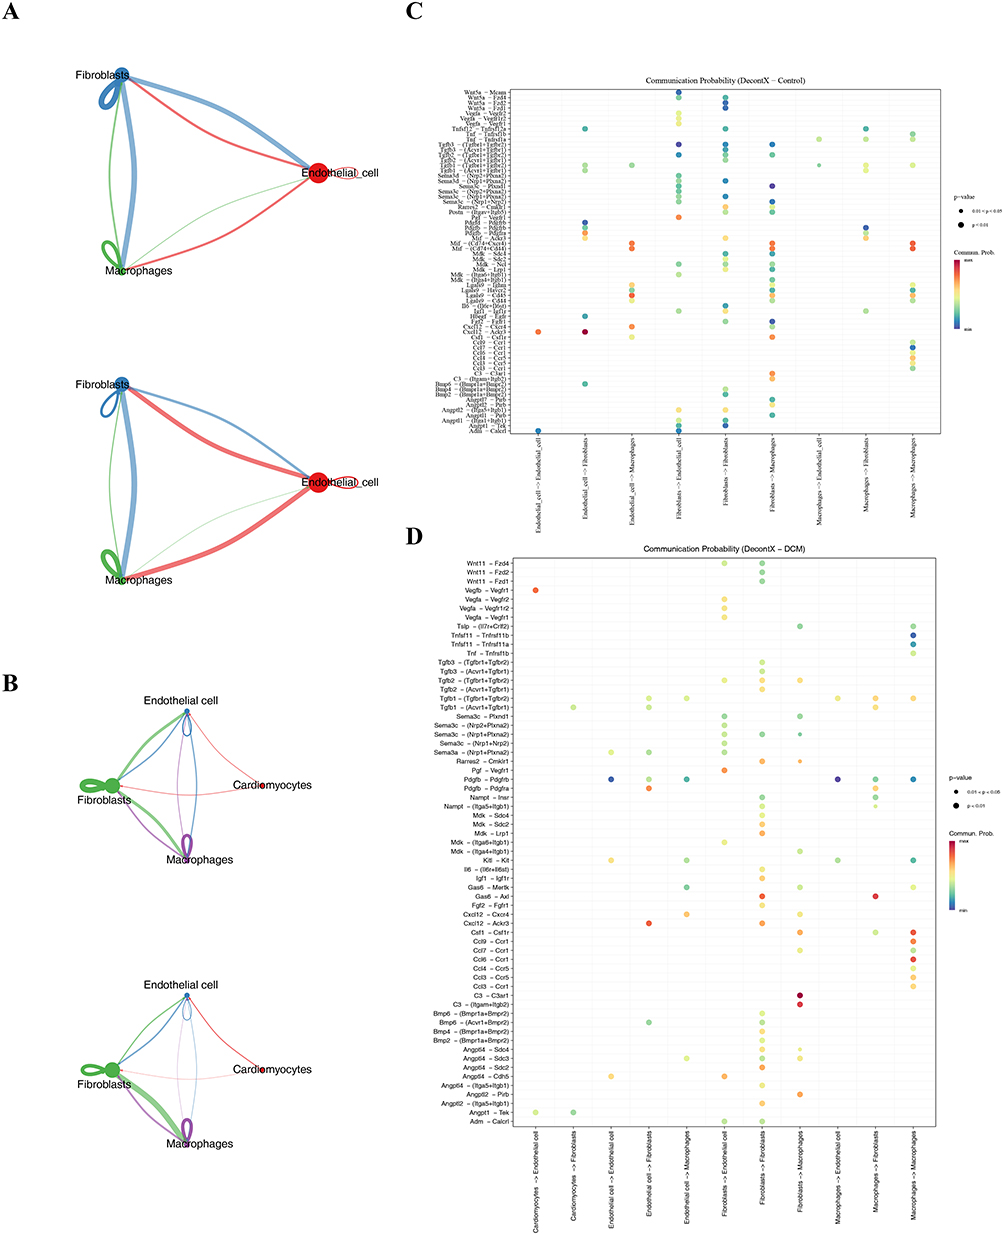 |
Figure 5 Cellular communication analysis. (A) Diagram showing the intensity and weight of cell communication in the normal group. (B) Diagram showing the intensity and weight of cell communication in the disease group. (C) Bubble chart analyzing the receptor-ligand interaction in the normal group. (D) Bubble chart analyzing the receptor-ligand interaction in the disease group. |
Type 2 DCM Mice Showed Significant Hyperglycemia, Insulin Resistance, and Cardiac Dysfunction
During model establishment, mice in the DCM group fed a high-fat diet exhibited significantly greater body weight than controls. Following STZ injection, body weight progressively declined after three weeks and eventually fell below that of the control group (Supplementary Figure 4A). Blood glucose levels began to rise one week after STZ induction and remained persistently elevated in the DCM group throughout the experimental period (Supplementary Figure 4B). Glucose and insulin tolerance tests demonstrated that, at each measurement point after glucose or insulin administration, blood glucose levels in the DCM group were consistently higher than in controls, indicating impaired glucose and insulin responsiveness (P < 0.05) (Supplementary Figure 4C and D). Echocardiographic assessment revealed reduced EF% and FS% (P < 0.05), accompanied by increased LVIDs and LVIDd (P < 0.05) in the DCM group (Supplementary Figure 4E and H). Ratios of HW/BW and HW/TL were also significantly elevated in the DCM group relative to controls (P < 0.05) (Supplementary Figure 4I and J). Histological analysis with HE staining showed greater structural disorganization and loosening of cardiomyocytes in the DCM group. Masson and Sirius Red staining further demonstrated augmented collagen accumulation, indicative of myocardial fibrosis (P < 0.05) (Supplementary Figure 4K–M).
Dysregulated Expression of DHCR24 and NRG1 in the Myocardium of DCM Mice
To validate the expression of the key senescence‑associated genes identified in DCM, we first examined myocardial tissues from DCM and control mice. Immunohistochemistry, qRT‑PCR, and Western blot analyses revealed that both mRNA and protein levels of DHCR24 were significantly downregulated in the DCM group, while NRG1 expression showed an upward trend (P < 0.05) (Figure 6A–F, L). Concurrently, the expression of senescence‑associated secretory phenotype (SASP) factors, including IL‑6, TNF‑α, and α‑SMA, was elevated in DCM myocardial tissues (P < 0.05) (Figure 6D, I–K), consistent with cellular aging characteristics. Furthermore, Western blot analysis confirmed increased expression of collagen I and collagen III, indicating the presence of myocardial fibrosis in DCM mice (Figure 6D, G–H).
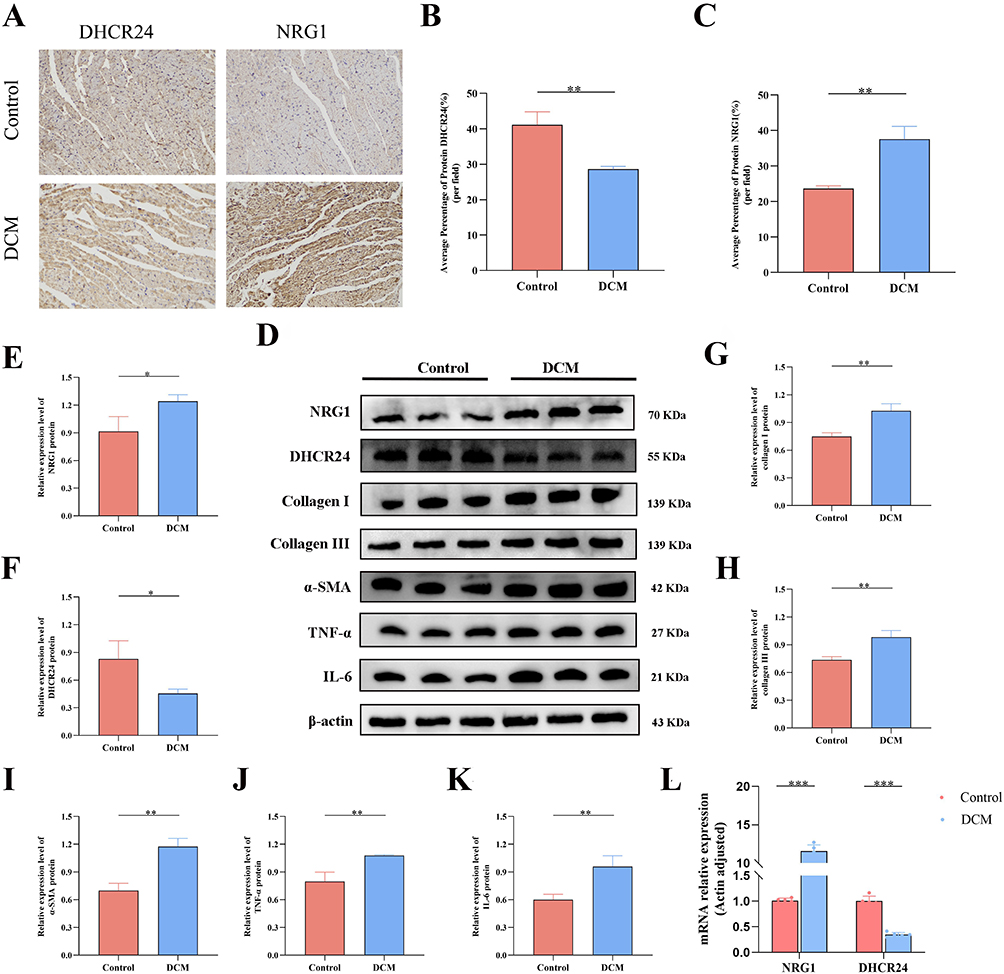 |
Figure 6 The expression of key genes, aging-related marker proteins and the level of fibrosis increased in the myocardium of DCM mice. (A–C) Immunohistochemical staining and quantitative analysis (n=5). (D) Representative Western blot bands of DHCR24, NRG1, Collagen I, Collagen III, IL-6, TNF-α, α-SMA and internal reference β-actin in myocardial tissues. (E–K) Western blot detection of protein levels and quantitative analysis in heart tissue and quantitative analysis.(n=3). (L) qRT-PCR detection of NRG1 and DHCR24 mRNA levels in heart tissue (n=3). (*P<0.05,**P<0.01, ***P<0.001, compared with the control group). |
Silencing of DHCR24 Exacerbates Cellular Aging in Cardiac Microvascular Endothelial Cells Under Diabetic Conditions
Given that single‑cell analysis identified endothelial cells (ECs) as the second most abundant cell population exhibiting high DHCR24 expression, we next performed in vitro functional validation using mouse cardiac microvascular ECs exposed to high glucose and palmitate to mimic the diabetic milieu. This treatment significantly reduced MCEC viability, accelerated cellular senescence, increased the proportion of SA‑β‑gal‑positive (blue‑stained) cells and ROS accumulation, and upregulated the senescence‑associated proteins P21 and P16 (Fig. 7A, B, D, E, H and I). Interestingly, under these diabetic‑mimicking conditions, qRT‑PCR and Western blotting showed that NRG1 expression was downregulated, whereas DHCR24 expression was significantly upregulated at both the mRNA and protein levels (P < 0.05) (Figure 7C, E–G). To assess cross-dataset consistency of our key findings, we performed external validation using two independent clinical cohorts from GEO: GSE132176 and GSE141910. In the large-scale GSE141910 dataset (n=366 samples), both DHCR24 (log2FC = −1.84, P < 0.001) and NRG1 (log2FC = 1.52, P < 0.001) showed highly significant differential expression consistent with our primary findings (Supplementary Figure 5). Although GSE132176 contains only congenital heart disease samples (ASD/TOF; Supplementary Table 1), DHCR24 still exhibited significant downregulation (P < 0.01; Supplementary Figure 6), supporting its role as a conserved cardiac stress-response gene across diverse pathological contexts. These validations confirm the robustness of DHCR24/NRG1 dysregulation in human cardiac pathologies. To clarify the role of DHCR24 in DCM pathogenesis, the most effective DHCR24-targeting siRNA was used to transfect ECs (Figure 7J and K). Following exposure to high glucose and palmitic acid, the cell viability of MCECS further decreased, intensified ROS generation, and enhanced the expression of senescence-associated markers. These results indicate that DHCR24 downregulation may promote cellular senescence by augmenting ROS levels (Figure 7L–Q).
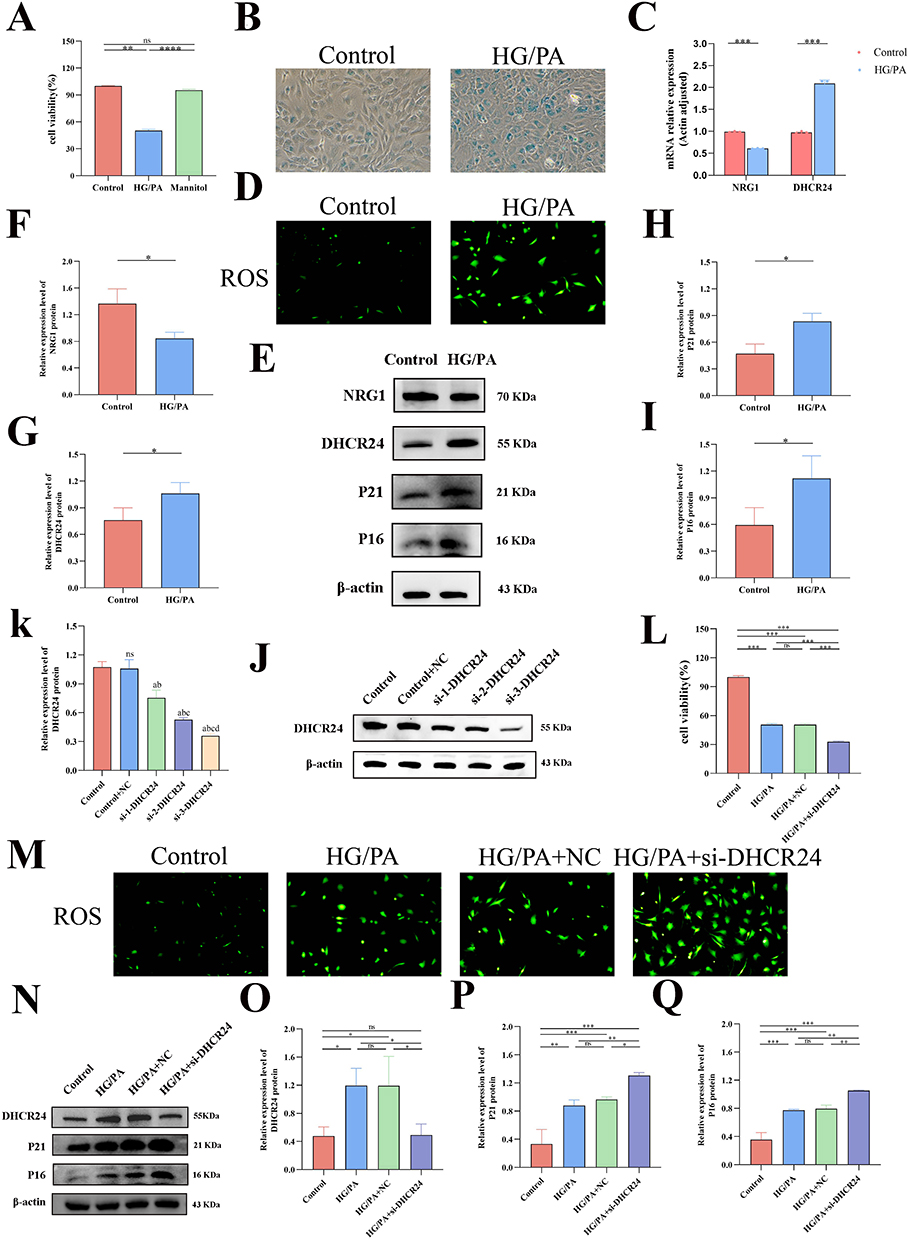 |
Figure 7 Knocking down DHCR24 can increase the expression of key aging genes in MCEC stimulated by high sugar and palmitic acid. (A and I) Cell viability experiments. (B) Representative images of SA-β-Gal staining. (C) qRT-PCR detection of NRG1 and DHCR24 mRNA levels in cells. (D and M) Intracellular ROS level staining map. (E–K) Western blot detection of protein levels and quantitative analysis in MCECs treated with high glucose and palmitic acid. (J–K) Verification of DHCR24 siRNA transfection efficiency in MCECs by Western blot and quantitative analysis. (L) Representative SA-β-Gal staining images of MCECs transfected with si-NC or DHCR24 siRNA under high glucose and palmitic acid stimulation (blue-stained cells are senescence-positive cells). (N–Q) Western blot detection of protein levels and quantitative analysis in MCECs transfected with si-NC or DHCR24 siRNA under high glucose and palmitic acid stimulation (n=3 per group, *P<0.05,**P<0.01, ***P<0.001, compared with the control group; a: compared with Control, P <0.05; b: compared with Control+NC, P <0.05; c: compared with si-1-DHCR24, P <0.05; d: compared with si-1-DHCR24, P <0.05). |
Discussion
From the DCM training dataset, 105 DEGs were intersected with 543 CARGs, yielding five candidate genes (NRG1, IGFBP5, IL6, DHCR24, CDKN1A), which participate in Ras protein signal transduction, growth factor signaling, kinase regulation, and cytokine activity, consistent with previous reports.25–28 Functional analyses indicated their strong connection with cellular senescence. Through an integrated approach combining single-cell transcriptomics, multi-dataset validation, and rigorous in vivo/in vitro functional assays, we provide the first evidence that DHCR24 exerts protective effects specifically in cardiac microvascular endothelial cells, while NRG1 shows compensatory upregulation in monocytes during DCM. Silencing of DHCR24 intensified senescence in cardiac microvascular endothelial cells, indicating a protective effect. Multi-layered regulatory analyses clarified the mechanistic context of these genes. Validation across animal models and cellular experiments confirmed the consistency of the results. Collectively, the study positions DHCR24 as a potential therapeutic target for attenuating diabetes-related cardiac microvascular injury.
DHCR24 (DelTA24-dehydrocholesterol reductase) is a multifunctional protein with enzymatic, antioxidant, and anti-apoptotic properties. It participates in cholesterol biosynthesis by converting deaminsterols into cholesterol and has been implicated in pancreatic β-cell dysfunction, IR,29 and maintenance of cytoplasmic membrane stability.30 DCM is characterized by myocardial energy imbalance, mitochondrial dysfunction, and elevated oxidative stress.31 Through antioxidation, inhibition of mitochondrial-dependent apoptosis pathways, and anti-endoplasmic reticulum stress effects, along with regulation of cholesterol and energy homeostasis,32 DHCR24 supports myocardial contractility and mitigates injury and cellular aging. Notably, its anti-apoptotic function is particularly critical in the diabetic heart. The downregulation of DHCR24 observed in our DCM model. Our DCM model mice exhibited myocardial injury, fibrosis, and senescence, accompanied by marked reduction of DHCR24 expression, consistent with the bioinformatic predictions. This downregulation indicates that DHCR24 may act as a direct target of diabetic pathological injury, reflecting the detrimental influence of hyperglycemia and oxidative stress on intrinsic protective pathways. Consistently, Giannini et al reported that intermittent high glucose exposure, simulating poorly controlled diabetes, suppressed DHCR24/seladin-1 expression in neuronal cell cultures.33
Neuregulin 1 (NRG1), a fundamental component of the ErbB signaling cascade, regulates cellular proliferation, differentiation, and survival.34 Under stress conditions, it further contributes to direct inhibition of cardiomyocyte apoptosis through Akt-mediated suppression of pro-apoptotic proteins such as Bax and caspase-3, enhances myocardial regeneration, and improves metabolic function.35 Cardiac NRG1 expression was markedly elevated in DCM mice, accompanied by accelerated myocardial senescence. This upregulation likely reflects a systemic compensatory adaptation, aligning with evidence from a diabetic mouse model, which demonstrated that ventricular NRG1 upregulation enhanced NRG1/ErbB2/4/Akt signaling activity, thereby reducing cardiomyocyte apoptosis and preserving left ventricular contractility.36
The present study constructed a regulatory network integrating TFs, miRNAs, and mRNAs. DHCR24 and NRG1 were predicted to be targeted by four and one miRNAs, respectively, with transcriptional regulation involving TFAP2A, GATA2, and FOXF2. For example, HCV response elements located in the 5′ genomic region of DHCR24 mRNA in hepatocytes, including TFAP2A binding sites, have been shown to markedly increase DHCR24 transcription during HCV infection, thereby enhancing p53-mediated cellular responses and contributing to hepatocarcinogenesis.37 Detailed investigation of this regulatory network and its mechanistic contribution to DCM will constitute the principal focus of subsequent research.
Single-cell analysis identified marked alterations in ECs, cardiomyocytes, fibroblasts, macrophages, and monocytes between DCM and control groups. Among these, ECs contribute substantially to the progression of DCM.38 Endothelial-mesenchymal transition (EndMT) has been implicated in both DCM and diabetic cardiac fibrosis.39,40 Based on these observations, validation experiments were conducted using mouse cardiac microvascular ECs. In both single-cell datasets and experimental validation, DHCR24 expression was downregulated in DCM myocardium but upregulated in endothelial cells under acute metabolic stress in vitro appears to contrast with some studies reporting consistent downregulation in chronic diabetic models. This discrepancy may reflect: (1) cell type-specific responses (bulk tissue vs. purified ECs), (2) differences in disease stage (chronic adaptation in vivo vs. acute injury in vitro), or (3) compensatory upregulation in surviving endothelial cells facing transient stress. The apparent increase in single-cell data likely represents an early protective response, whereas the bulk tissue reduction denotes exhaustion of this compensatory capacity in advanced DCM. Specifically, This divergence largely reflects cellular heterogeneity and differences between in vivo and in vitro contexts. Single-cell data capture the immediate response of ECs exposed to high-glucose and high-lipid stress: DHCR24 upregulation represents an early compensatory defense, while NRG1 downregulation reflects direct suppression of its synthesis by hyperglycemia, indicating a stressed cellular state during the initial disease phase. Conversely, bulk tissue data represent the integrated outcome of advanced DCM, where overall DHCR24 reduction likely denotes the exhaustion of compensatory capacity, potentially compounded by the loss of DHCR24-expressing ECs. The apparent increase in NRG1 expression in bulk tissue is interpreted as compensatory overproduction from other cardiac cell types, such as activated fibroblasts or repair-attempting cardiomyocytes, with this strong signal concealing the reduction of endothelial-derived NRG1. To substantiate this interpretation, functional assays were performed. Silencing DHCR24 intensified high-glucose and high-fat-induced ROS accumulation and cellular senescence in myocardial microvascular endothelial cells, indicating a protective role of DHCR24 in DCM pathogenesis, primarily through regulation of cardiomyocyte apoptosis and senescence via ROS. Previous evidence has demonstrated that DHCR24 knockdown increases NF-κB expression and induces mitochondrial dysfunction.41 Excessive ROS generation and the ensuing oxidative stress are major drivers of T2DM and cardiovascular aging, contributing to endothelial dysfunction.42 The present experiments confirmed that the essential role of DHCR24 was protective, as its knockdown aggravated senescence independent of expression trends. Downregulation observed in DCM patients or models is more plausibly a consequence of the diabetic pathological milieu impairing intrinsic cardioprotective mechanisms rather than a primary disease trigger. Loss of DHCR24 diminishes the cellular capacity to resist oxidative and endoplasmic reticulum stress, accelerating senescence and dysfunction. Accordingly, therapeutic strategies aimed at restoring or enhancing DHCR24 expression may provide a promising avenue for DCM intervention.
This study presents several limitations. The absence of detailed clinical information for individual heart samples restricted evaluation of the relationship between gene expression patterns and clinical characteristics. While our key findings were validated across multiple human datasets (GSE141910/GSE132176) and consistent in STZ-DCM mice, future studies should extend validation to alternative models (eg, db/db mice) and diverse metabolic stressors (eg, high cholesterol, advanced glycation end-products) to confirm the universality of DHCR24/NRG1 mechanisms. In cellular assays, exposure to high glucose or free fatty acids (eg, palmitate) only partially reproduces metabolic disturbances in cardiomyocytes and fails to recapitulate the complex in vivo microenvironment. Such simplified conditions do not reflect the intricate interplay among cardiomyocytes, fibroblasts, immune cells, and other cell populations in diabetic hearts, nor do they capture systemic metabolic alterations and neuroendocrine regulation. Future studies should directly evaluate the impact of DHCR24 and NRG1 modulation on cardiomyocyte and endothelial cell apoptosis/necrosis rates in vivo, and determine whether rescuing their expression or activity can prevent cell death and improve survival in preclinical models of DCM, ultimately translating to preserved cardiac function. These constraints inherent to the models employed may limit the translational relevance of the results to human T2DM-related DCM. Single-cell findings were used primarily to generate hypotheses regarding potential cell type–enriched expression, which subsequently guided our targeted in vitro experiments, rather than serving as standalone validation. Future validation in larger cohorts with true biological replicates, combined with complementary approaches such as spatial transcriptomics and standardized clustering benchmarks, will be essential to confirm the precise cellular localization, regulatory dynamics, and functional relevance of DHCR24 and NRG1 in DCM.
Conclusion
Through integrated bioinformatics, exploratory single-cell RNA sequencing analysis, and experimental validation, we identify DHCR24 and NRG1 as stage- and cell type–specific regulators in DCM. The single-cell findings, while hypothesis-generating due to limited sample size, provided initial cell type-resolved insights that guided subsequent functional validation. DHCR24 is significantly downregulated in human and murine DCM hearts, with its loss strongly correlating with myocardial fibrosis, cardiomyocyte senescence, and systolic dysfunction. In cardiac microvascular endothelial cells, DHCR24 is transiently induced early under diabetic stress, and its knockdown directly exacerbates oxidative stress–induced senescence and apoptosis, establishing its non-redundant role in microvascular resilience. Conversely, NRG1 is upregulated in cardiomyocytes during established DCM, activating ErbB2/4–Akt signaling as a compensatory survival mechanism—yet this response is insufficient to prevent disease progression. Together, these findings reveal DHCR24 deficiency as a driver of microvascular damage and NRG1 induction as an overwhelmed adaptive signal, positioning both molecules as functionally validated, context-dependent targets in DCM pathogenesis.
Abbreviations
ESC, European Society of Cardiology; CA, Cell aging; CARGs, Cell aging related genes; NCBI, National Center for Biotechnology Information; GEO, Gene expression omnibus; T2DM, Type 2 diabetes; IR, Insulin resistance; DEGs differentially expressed genes; FC, Fold change; FDR, False Discovery Rate; PKC, Protein kinase C; DGidb, Drug-Gene Interaction Database; scRNA-Seq, Single-cell RNA sequencing; LDL, Low-density lipoprotein; UMAP, Uniform Manifold Approximation and Projection; MSigDB, Molecular signatures database; GO, Gene ontology; KEGG, Kyoto encyclopedia of genes and genomes; GGI, Gene-gene interaction; PDB, Protein data bank; GTT, Glucose tolerance test; ITT, Insulin tolerance test; qRT-PCR, Quantitative reverse transcriptase PCR; ROS, Reactive Oxygen Species; EndMT, Endothelial-mesenchymal transition.
Institutional Review Board Statement
According to the Guide for the Care and Use of Laboratory Animals (Approval Code: 2402640), the experimental protocol and procedures were approved by the Animal Experiment Ethics Committee of Guizhou Medical University on March 4, 2024. All public datasets used were generated by others who had obtained ethical approval. This study complies with the provisions of Article 32, Item 1 of the Ethical Review Measures for Life Sciences and Medical Research Involving Humans, dated February 18, 2023. This study was conducted in accordance with the Declaration of Helsinki. The experiment followed the ARRIVE guidelines.
Data Sharing Statement
The transcriptome sequencing datasets and PCR datasets generated and analyzed during this study are available from the corresponding author upon reasonable request.
Acknowledgments
Thank you to the providers of the datasets used in this study.
Author Contributions
HongJin Chen & ShaoMei Yu: Conceptualization, Methodology, Supervision, Funding acquisition; WeiWei Xiao: Software, Formal analysis, Visualization, Writing – Original Draft, Investigation; Xue Gao & XinRu Zhang: Software, Formal analysis, Visualization, Writing – Original Draft; HouYu Li & AnLingZi Zou: Investigation, Formal analysis; ZhuoMeng Miao & Shuangpeng Zou: Investigation. All authors: Writing – Review & Editing. All authors gave final approval of the version to be published; have agreed on the journal to which the article has been submitted; and agree to be accountable for all aspects of the work.
Funding
This work was funded by Guizhou Medical University Affiliated Hospital Doctoral Research Start-up Fund Project (gyfybsky-2021-19), 2023 Guizhou Provincial Science and Technology Plan Project (Guizhou Science and Technology Foundation-ZK[2023] General 373) and 2024 Guizhou Provincial Science and Technology Plan Project (Guizhou Science and Technology Foundation-LC[2024] 092).
Disclosure
The authors report no conflicts of interest in this work.
References
1. Seferović PM, Paulus WJ, Rosano G, et al. Diabetic myocardial disorder. A clinical consensus statement of the heart failure association of the ESC and the ESC working group on myocardial & pericardial diseases. Eur J Heart Fail. 2024;26(9):1893–19. doi:10.1002/ejhf.3347
2. Jia G, Whaley-Connell A, Sowers JR. Diabetic cardiomyopathy: a hyperglycaemia- and insulin-resistance-induced heart disease. Diabetologia. 2018;61(1):21–28. doi:10.1007/s00125-017-4390-4
3. Mann C, Braunwald E, Zelniker TA. Diabetic cardiomyopathy revisited: the interplay between diabetes and heart failure. Int J Cardiol. 2025;438:133554. doi:10.1016/j.ijcard.2025.133554
4. Galis P, Bartosova L, Farkasova V, Bartekova M, Ferenczyova K, Rajtik T. Update on clinical and experimental management of diabetic cardiomyopathy: addressing current and future therapy. Front Endocrinol. 2024;15:1451100. doi:10.3389/fendo.2024.1451100
5. Luan Y, Zhang J, Wang M, Fu G, Zhang W. Advanced glycation end products facilitate the proliferation and reduce early apoptosis of cardiac microvascular endothelial cells via PKCβ signaling pathway: insight from diabetic cardiomyopathy. Anatol J Cardiol. 2020;23(3):141–150. doi:10.14744/AnatolJCardiol.2019.21504
6. Zhang Y, Wang JH, Zhang YY, et al. Deletion of interleukin-6 alleviated interstitial fibrosis in streptozotocin-induced diabetic cardiomyopathy of mice through affecting TGFβ1 and miR-29 pathways. Sci Rep. 2016;6:23010. doi:10.1038/srep23010
7. Sanganalmath SK, Dubey S, Veeranki S, Narisetty K, Krishnamurthy P. The interplay of inflammation, exosomes and Ca(2+) dynamics in diabetic cardiomyopathy. Cardiovasc Diabetol. 2023;22(1):37. doi:10.1186/s12933-023-01755-1
8. Thompson EL, Pitcher LE, Niedernhofer LJ, Robbins PD. targeting cellular senescence with senotherapeutics: development of new approaches for skin care. Plast Reconstr Surg. 2022;150:12s–19s. doi:10.1097/prs.0000000000009668
9. Zheng DL, Wu QR, Zeng P, et al. Advanced glycation end products induce senescence of atrial myocytes and increase susceptibility of atrial fibrillation in diabetic mice. Aging Cell. 2022;21(12):e13734. doi:10.1111/acel.13734
10. Liu R, Meng J, Lou D. Adiponectin inhibits D‑gal‑induced cardiomyocyte senescence via AdipoR1/APPL1. Mol Med Rep. 2021;24(4). doi:10.3892/mmr.2021.12358
11. Jovic D, Liang X, Zeng H, Lin L, Xu F, Luo Y. Single-cell RNA sequencing technologies and applications: a brief overview. Clin Transl Med. 2022;12(3):e694. doi:10.1002/ctm2.694
12. Su Q, Huang W, Huang Y, et al. Single-cell insights: pioneering an integrated atlas of chromatin accessibility and transcriptomic landscapes in diabetic cardiomyopathy. Cardiovasc Diabetol. 2024;23(1):139. doi:10.1186/s12933-024-02233-y
13. Barrett T, Wilhite SE, Ledoux P, et al. NCBI GEO: archive for functional genomics data sets--update. Nucleic Acids Res. 2013;41(Database issue):D991–5. doi:10.1093/nar/gks1193
14. Greco S, Fasanaro P, Castelvecchio S, et al. MicroRNA dysregulation in diabetic ischemic heart failure patients. Diabetes. 2012;61(6):1633–1641. doi:10.2337/db11-0952
15. Cai W, Chong K, Huang Y, Huang C, Yin L. Empagliflozin improves mitochondrial dysfunction in diabetic cardiomyopathy by modulating ketone body metabolism and oxidative stress. Redox Biol. 2024;69:103010. doi:10.1016/j.redox.2023.103010
16. Li H, Zhu X, Cao X, Lu Y, Zhou J, Zhang X. Single-cell analysis reveals lysyl oxidase (Lox)(+) fibroblast subset involved in cardiac fibrosis of diabetic mice. J Adv Res. 2023;54:223–237. doi:10.1016/j.jare.2023.01.018
17. Huang X, Zhang KJ, Jiang JJ, Jiang SY, Lin JB, Lou YJ. Identification of crucial genes and key functions in type 2 diabetic hearts by bioinformatic analysis. Front Endocrinol. 2022;13:801260. doi:10.3389/fendo.2022.801260
18. Zhou J, Huang J, Li Z, et al. Identification of aging-related biomarkers and immune infiltration characteristics in osteoarthritis based on bioinformatics analysis and machine learning. Front Immunol. 2023;14:1168780. doi:10.3389/fimmu.2023.1168780
19. Ritchie ME, Phipson B, Wu D, et al. limma powers differential expression analyses for RNA-sequencing and microarray studies. Nucleic Acids Res. 2015;43(7):e47. doi:10.1093/nar/gkv007
20. Wu T, Hu E, Xu S, et al. clusterProfiler 4.0: a universal enrichment tool for interpreting omics data. Innovation. 2021;2(3):100141. doi:10.1016/j.xinn.2021.100141
21. Smoot ME, Ono K, Ruscheinski J, Wang PL, Ideker T. Cytoscape 2.8: new features for data integration and network visualization. Bioinformatics. 2011;27(3):431–432. doi:10.1093/bioinformatics/btq675
22. Hao Y, Hao S, Andersen-Nissen E, et al. Integrated analysis of multimodal single-cell data. Cell. 2021;184(13):3573–3587.e29. doi:10.1016/j.cell.2021.04.048
23. Aran D, Looney AP, Liu L, et al. Reference-based analysis of lung single-cell sequencing reveals a transitional profibrotic macrophage. Nat Immunol. 2019;20(2):163–172. doi:10.1038/s41590-018-0276-y
24. Jin S, Guerrero-Juarez CF, Zhang L, et al. Inference and analysis of cell-cell communication using CellChat. Nat Commun. 2021;12(1):1088. doi:10.1038/s41467-021-21246-9
25. Tuersuntuoheti M, Zhou L, Li J, Yang S, Zhou S, Gong H. Investigation of crucial genes and mitochondrial function impairment in diabetic cardiomyopathy. Gene. 2024;923:148563. doi:10.1016/j.gene.2024.148563
26. Ge X, Slütter B, Lambooij JM, et al. DHCR24 inhibitor SH42 increases desmosterol without preventing atherosclerosis development in mice. iScience. 2024;27(6):109830. doi:10.1016/j.isci.2024.109830
27. Banerjee A, Singla DK. MSC exosomes attenuate sterile inflammation and necroptosis associated with TAK1-pJNK-NFKB mediated cardiomyopathy in diabetic ApoE KO mice. Front Immunol. 2024;15:1348043. doi:10.3389/fimmu.2024.1348043
28. Chen X, Ren L, Liu X, et al. Ranolazine protects against diabetic cardiomyopathy by activating the NOTCH1/NRG1 pathway. Life Sci. 2020;261:118306. doi:10.1016/j.lfs.2020.118306
29. Li Y, Wang X, Yang B, et al. 3β-hydroxysteroid-Δ24 reductase (DHCR24) protects pancreatic β cells from endoplasmic reticulum stress-induced apoptosis by scavenging excessive intracellular reactive oxygen species. J Diabetes Res. 2020;2020:3426902. doi:10.1155/2020/3426902
30. Rampersaud E, Damcott CM, Fu M, et al. Identification of novel candidate genes for type 2 diabetes from a genome-wide association scan in the Old Order Amish: evidence for replication from diabetes-related quantitative traits and from independent populations. Diabetes. 2007;56(12):3053–3062. doi:10.2337/db07-0457
31. Peng ML, Fu Y, Wu CW, Zhang Y, Ren H, Zhou SS. Signaling pathways related to oxidative stress in diabetic cardiomyopathy. Front Endocrinol. 2022;13:907757. doi:10.3389/fendo.2022.907757
32. Rodríguez-Acebes S, de la Cueva P, Fernández-Hernando C, et al. Desmosterol can replace cholesterol in sustaining cell proliferation and regulating the SREBP pathway in a sterol-Delta24-reductase-deficient cell line. Biochem J. 2009;420(2):305–315. doi:10.1042/bj20081909
33. Giannini S, Benvenuti S, Luciani P, et al. Intermittent high glucose concentrations reduce neuronal precursor survival by altering the IGF system: the involvement of the neuroprotective factor DHCR24 (Seladin-1). J Endocrinol. 2008;198(3):523–532. doi:10.1677/joe-07-0613
34. Lemmens K, Doggen K, De Keulenaer GW. Role of neuregulin-1/ErbB signaling in cardiovascular physiology and disease: implications for therapy of heart failure. Circulation. 2007;116(8):954–960. doi:10.1161/circulationaha.107.690487
35. Timolati F, Ott D, Pentassuglia L, et al. Neuregulin-1 beta attenuates doxorubicin-induced alterations of excitation-contraction coupling and reduces oxidative stress in adult rat cardiomyocytes. J Mol Cell Cardiol. 2006;41(5):845–854. doi:10.1016/j.yjmcc.2006.08.002
36. Mikami Y, Iwase F, Ohshima D, Tomida T, Adachi-Akahane S. Compensatory role of neuregulin-1 in diabetic cardiomyopathy. J Pharmacol Sci. 2023;153(3):130–141. doi:10.1016/j.jphs.2023.08.009
37. Saito M, Kohara M, Tsukiyama-Kohara K. Hepatitis C virus promotes expression of the 3β-hydroxysterol δ24-reductase through Sp1. J Med Virol. 2012;84(5):733–746. doi:10.1002/jmv.23250
38. Pinto AR, Ilinykh A, Ivey MJ, et al. Revisiting cardiac cellular composition. Circ Res. 2016;118(3):400–409. doi:10.1161/circresaha.115.307778
39. Wang E, Chen S, Wang H, Chen T, Chakrabarti S. Non-coding RNA-mediated endothelial-to-mesenchymal transition in human diabetic cardiomyopathy, potential regulation by DNA methylation. Cardiovasc Diabetol. 2023;22(1):303. doi:10.1186/s12933-023-02039-4
40. Feng B, Cao Y, Chen S, Chu X, Chu Y, Chakrabarti S. miR-200b mediates endothelial-to-mesenchymal transition in diabetic cardiomyopathy. Diabetes. 2016;65(3):768–779. doi:10.2337/db15-1033
41. Ganesh Yerra V, Negi G, Sharma SS, Kumar A. Potential therapeutic effects of the simultaneous targeting of the Nrf2 and NF-κB pathways in diabetic neuropathy. Redox Biol. 2013;1(1):394–397. doi:10.1016/j.redox.2013.07.005
42. Lu X, Kambe F, Cao X, et al. 3beta-Hydroxysteroid-delta24 reductase is a hydrogen peroxide scavenger, protecting cells from oxidative stress-induced apoptosis. Endocrinology. 2008;149(7):3267–3273. doi:10.1210/en.2008-0024
 © 2026 The Author(s). This work is published and licensed by Dove Medical Press Limited. The
full terms of this license are available at https://www.dovepress.com/terms
and incorporate the Creative Commons Attribution
- Non Commercial (unported, 4.0) License.
By accessing the work you hereby accept the Terms. Non-commercial uses of the work are permitted
without any further permission from Dove Medical Press Limited, provided the work is properly
attributed. For permission for commercial use of this work, please see paragraphs 4.2 and 5 of our Terms.
© 2026 The Author(s). This work is published and licensed by Dove Medical Press Limited. The
full terms of this license are available at https://www.dovepress.com/terms
and incorporate the Creative Commons Attribution
- Non Commercial (unported, 4.0) License.
By accessing the work you hereby accept the Terms. Non-commercial uses of the work are permitted
without any further permission from Dove Medical Press Limited, provided the work is properly
attributed. For permission for commercial use of this work, please see paragraphs 4.2 and 5 of our Terms.