Back to Journals » OncoTargets and Therapy » Volume 11
Integrated bioinformatic analysis unveils significant genes and pathways in the pathogenesis of supratentorial primitive neuroectodermal tumor
Authors Wang G, Li L, Liu B, Han X, Wang CH ![]() , Wang JW
, Wang JW
Received 10 August 2017
Accepted for publication 25 October 2017
Published 4 April 2018 Volume 2018:11 Pages 1849—1859
DOI https://doi.org/10.2147/OTT.S148776
Checked for plagiarism Yes
Review by Single anonymous peer review
Peer reviewer comments 2
Editor who approved publication: Dr Carlos E Vigil
Guang-Yu Wang,1,* Ling Li,2,* Bo Liu,1 Xiao Han,1 Chun-Hua Wang,1 Ji-Wen Wang3
1Department of Neurosurgery, 2Department of Pediatrics, Qilu Children’s Hospital of Shandong University, Jinan, Shandong, 3Department of Neurology, Shanghai Children’s Medical Center, Shanghai Jiaotong University School of Medicine, Pudong New District, Shanghai, People’s Republic of China
*These authors contributed equally to this work
Purpose: This study aimed to explore significant genes and pathways involved in the pathogenesis of supratentorial primitive neuroectodermal tumor (sPNET).
Materials and methods: Gene expression profile of GSE14295 was downloaded from publicly available Gene Expression Omnibus (GEO) database. Differentially expressed genes (DEGs) were screened out in primary sPNET samples compared with normal fetal and adult brain reference samples (sPNET vs fetal brain and sPNET vs adult brain). Pathway enrichment analysis of these DEGs was conducted, followed by protein–protein interaction (PPI) network construction and significant module selection. Additionally, transcription factors (TFs) regulating the common DEGs in the two comparison groups were identified, and the regulatory network was constructed.
Results: In total, 526 DEGs (99 up- and 427 downregulated) in sPNET vs fetal brain and 815 DEGs (200 up- and 615 downregulated) in sPNET vs adult brain were identified. DEGs in sPNET vs fetal brain and sPNET vs adult brain were associated with calcium signaling pathway, cell cycle, and p53 signaling pathway. CDK1, CDC20, BUB1B, and BUB1 were hub nodes in the PPI networks of DEGs in sPNET vs fetal brain and sPNET vs adult brain. Significant modules were extracted from the PPI networks. In addition, 64 upregulated and 200 downregulated overlapping DEGs were identified in both sPNET vs fetal brain and sPNET vs adult brain. The genes involved in the regulatory network upon overlapping DEGs and the TFs were correlated with calcium signaling pathway.
Conclusion: Calcium signaling pathway and several genes (CDK1, CDC20, BUB1B, and BUB1) may play important roles in the pathogenesis of sPNET.
Keywords: primitive neuroectodermal tumor, microarray analysis, protein-protein interaction, transcription factors
Introduction
Primitive neuroectodermal tumors (PNETs), which are primarily composed of undifferentiated or poorly differentiated round neuroepithelial cells, are highly malignant embryonal neoplasms arising mostly in children (although they can also occur in adults).1 PNETs include supratentorial primitive neuroectodermal tumor (sPNET; also called central nervous system [CNS]-PNET) and medulloblastoma. Although sPNET is histologically indistinguishable from medulloblastoma, there is growing evidence showing different molecular characteristics between sPNET and medulloblastoma.1 The progress on sPNETs has been relatively modest compared with medulloblastoma, partly because of the scarcity of good material for biological studies. sPNETs are associated with poor prognosis, with a 5-year disease free survival of 15%–50% depending on treatment modality.2 Additionally, up to 80% of the children still die from recurrent disease using current standard therapy.2 Therefore, gaining more insights into the underlying molecular mechanisms of sPNETs is of great importance.
In recent years, knowledge about the molecular events contributing to the development and progression of PNETs has increased dramatically.3 A study showed that SMARCB1/INI1 could be a potential tumor suppressor gene in CNS-PNET, with the loss of INI1 protein expression being a marker of poor prognosis.4 Koch et al5 reported the presence of catenin beta-1 (CTNNB1) mutations in a small subset of sporadic cerebellar and cerebral PNETs and suggested that WNT/wingless signaling pathway may be involved in the molecular pathogenesis of PNETs. In addition, the investigation of Phi et al6 showed that the proportion of phosphorylated signal transducer and activator of transcription 3α (STAT3α) relative to STAT3α in sPNET was significantly greater than that in medulloblastoma, which suggested that the JAK/STAT3 pathway was activated in sPNET. Besides, Rogers et al7 showed that WNT/β-catenin pathway could be used as a potential prognostic marker of sPNET, which could be used to stratify disease risk for patients with sPNET. However, the exact molecular mechanisms responsible for pathogenesis of PNET, especially of sPNET, are still poorly understood.
In the present study, we downloaded a gene expression profile from publicly available database and carried out systematic bioinformatics analysis. Differentially expressed genes (DEGs) were screened out in primary sPNET samples compared with normal fetal and adult brain reference samples, respectively, forming two comparison groups (sPNET vs fetal brain and sPNET vs adult brain). Pathway enrichment analysis of these DEGs was conducted, followed by protein–protein interaction (PPI) network construction and significant module selection. Besides, transcription factors (TFs) regulating the common DEGs in the two comparison groups were identified, and the regulatory network was constructed. The aim of this study was to identify significant genes and pathways involved in the pathogenesis of sPNET, which may facilitate the understanding of molecular mechanisms underlying sPNET development and open up new avenues for developing novel targets for diagnostic and therapeutic intervention.
Materials and methods
Microarray data
Gene expression profile of GSE14295 (accession number), deposited by Li et al,8 was downloaded from the public repository, Gene Expression Omnibus (GEO; http://www.ncbi.nlm.nih.gov/geo/).9 The platform is GPL6102, Illumina human-6 v2.0 expression beadchip. This dataset consisted of 33 primary sPNET samples with good RNA quality. Additionally, seven normal fetal and seven adult brain reference samples were also included in GSE14295.
Data preprocessing and screening of DEGs
The normalized gene expression matrix and platform annotation profiles were downloaded. Based on the annotation information, the probes were matched to the gene symbols. For multiple probes corresponding to one gene symbol, we calculated the gene expression values by averaging across all the matched probe sets of a gene. Finally, 20,057 gene expression matrices were obtained.
After data preprocessing, we used the bioconductor limma package10 to calculate the level of gene differential expression in the two groups, sPNET vs fetal brain and sPNET vs adult brain. Benjamini–Hochberg (BH)11 multiple testing correction was applied to control the false-positive results, adjusting the raw p-values into false discovery rate (FDR).12 A combination of FDR <0.05 and the |log2 fold change (FC)| ≥2 was used as the stringent cutoff to determine the significance of gene expression difference. Additionally, hierarchical clustering of the identified DEGs was carried out to construct a dendrogram based on their expression values.
Pathway enrichment analysis of DEGs
The Database for Annotation, Visualization and Integrated Discovery (DAVID) bioinformatics resources (http://david.niaid.nih.gov) can enable the researchers to interpret the biological mechanisms associated with large gene lists and is the most common tool for functional enrichment analysis.13 In this study, the Kyoto Encyclopedia of Genes and Genomes (KEGG) pathways enriched by DEGs in sPNET vs fetal brain and sPNET vs adult brain were identified using DAVID (version 6.8). KEGG pathways with DEGs ≥2 and p-value <0.05 were considered to be significantly enriched.
PPI network construction of DEGs and module selection
The Search Tool for the Retrieval of Interacting Genes (STRING; http://www.string-db.org/) provides a critical assessment and integration of PPIs, including known and predicted associations.14 Using STRING, users can inspect the interaction evidence by adjusting interaction confidence scores.14 In this study, STRING was applied to select the interactions among the identified DEGs in sPNET vs fetal brain and sPNET vs adult brain, respectively. Besides, the confidence score >0.9 (indicating highest confidence) was chosen for the PPI network construction. Besides, Cytoscape software15 was used to create network visualizations. Analysis of topological properties of nodes in the network helps to describe the importance of nodes in the PPI network. Three methods including degree centrality, betweenness centrality, and closeness centrality were used to analyze network topological features of nodes in the PPI network using the CytoNCA plug-in (http://apps.cytoscape.org/apps/cytonca)16 in Cytoscape software. Hub nodes with higher topology scores were identified. Significant modules (densely connected subnetwork regions) in the PPI network were selected using the Cytoscape plug-in MCODE.17 Modules were selected based on the MCODE cluster score (ie, connectivity density). In this study, we selected the modules with a score >6.
Quantitative Venn diagram distribution analysis of DEGs in two comparison groups
VennPlex (http://www.irp.nia.nih.gov/bioinformatics/vennplex.html), with its novel feature of visualizing contraregulated data points, can be used for comparing and visualizing datasets with differentially regulated data points, facilitating a more comprehensive and interconnected appreciation.18 In this study, Venn diagrams were constructed to identify common and contraregulated genes in PNET vs fetal brain and PNET vs adult brain using VennPlex.
Identification of TFs potentially regulating the common DEGs and construction of regulatory network
iRegulon (http://iregulon.aertslab.org), a Cytoscape plug-in, provides position weight matrices (PWMs) that have been collected from various sources and species and enables to construct regulatory network by linking them to candidate TFs.19 In this study, TFs potentially regulating the common DEGs identified in sPNET vs fetal brain and sPNET vs adult brain were examined using iRegulon. The lists of common DEGs identified were subjected to iRegulon and used to predict the TFs with the following parameters – minimum identity between orthologous genes: 0.05 and maximum FDR on motif similarity: 0.001. The predicted regulatory relationship with normalized enrichment scores (NESs) >3 was used for further analysis. The corresponding regulatory network was constructed. Moreover, genes enriched in the regulatory network were subjected to pathway enrichment analysis.
Results
Analysis of DEGs
After preprocessing, a stringent differential gene expression analysis (FDR <0.05 and |log2 FC| ≥2) revealed 526 DEGs in sPNET vs fetal brain, of which 99 genes displayed increased expression and 427 genes displayed decreased expression. In addition, we got 815 DEGs in sPNET samples compared with adult brain samples, which included 200 upregulated genes and 615 downregulated genes. The expression values of these DEGs were hierarchical as shown in Figure 1A and B.
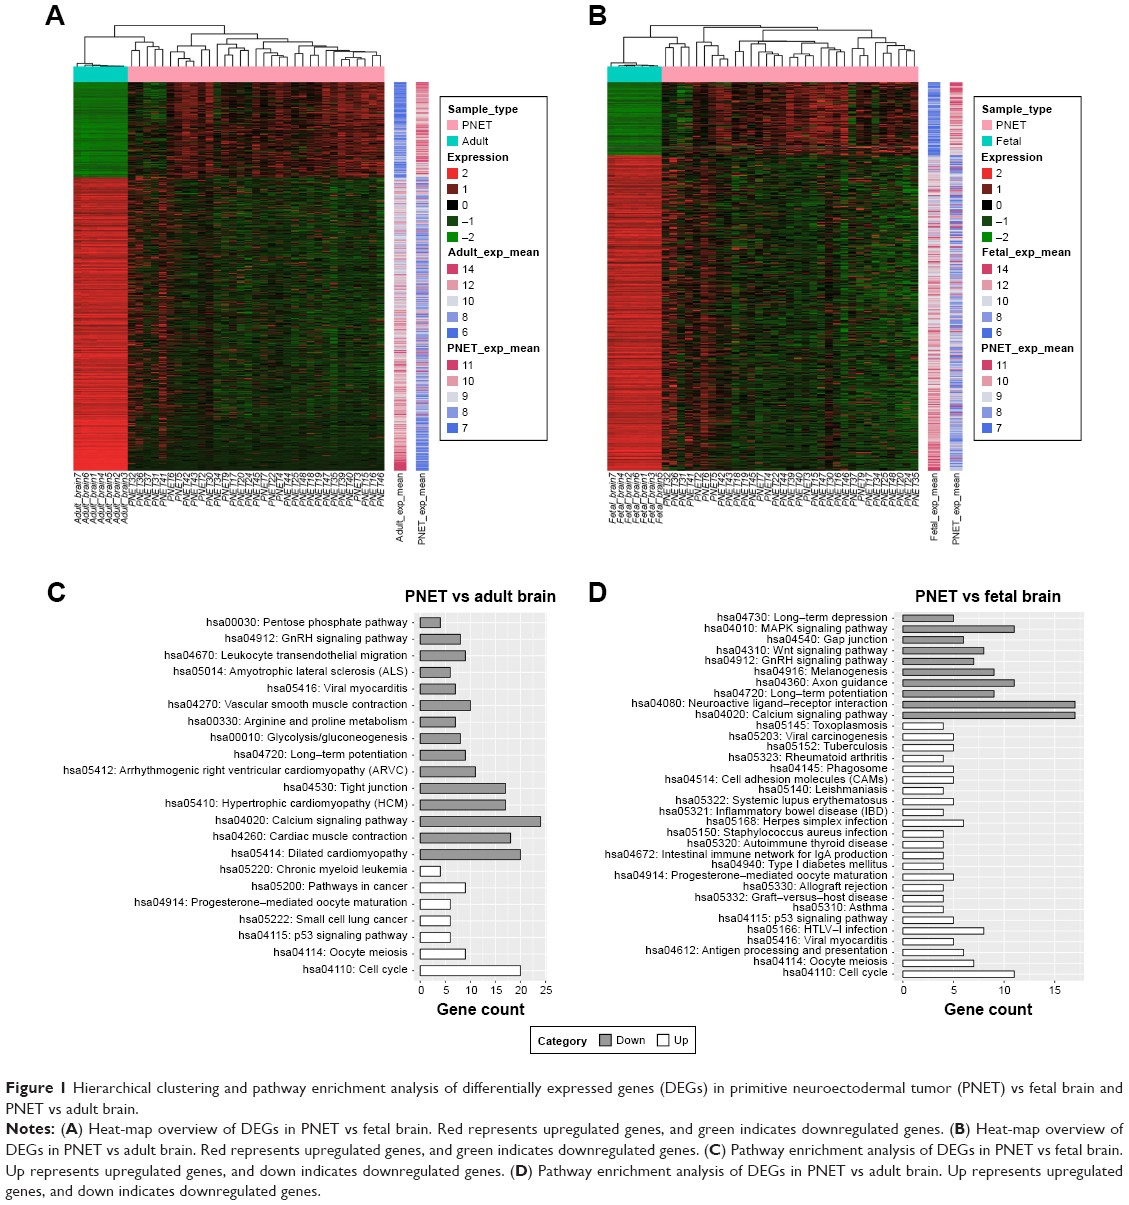 | Figure 1 Hierarchical clustering and pathway enrichment analysis of differentially expressed genes (DEGs) in primitive neuroectodermal tumor (PNET) vs fetal brain and PNET vs adult brain. |
Pathway enrichment analysis of DEGs
Pathway annotation was used to screen out the altered biological functions arising from the identified DEGs. Pathway enrichment of the up- and downregulated genes was carried out separately. As shown in Figure 1C and D, the downregulated genes in sPNET vs adult brain were mainly enriched in 15 pathways, including calcium signaling pathway and tight junction. The upregulated genes in sPNET vs adult brain were mainly enriched in seven pathways, such as cell cycle and p53 signaling pathway. By contrast, the downregulated genes in sPNET vs fetal brain were mainly enriched in 10 pathways, which included neuroactive ligand–receptor interaction and the calcium signaling pathway. The upregulated genes in sPNET vs adult brain were associated with 24 pathways, such as cell cycle and p53 signaling pathway.
PPI network construction and module selection
The PPI networks upon the DEGs in sPNET vs fetal brain and sPNET vs adult brain are shown in Figures 2 and 3, respectively. The PPI network of DEGs in PNET vs fetal brain was composed of 155 nodes (proteins) and 241 edges (interactions; Figure 2). The PPI network of DEGs in PNET vs adult brain consisted of 290 nodes and 733 edges (Figure 3). Top 20 nodes with higher topology scores in the PPI networks are shown in Table 1. The results of topological analysis showed that cyclin-dependent kinase 1 (CDK1), cell division cycle 20 (CDC20), adenylate cyclase 2 (ADCY2), adenylate cyclase 8 (ADCY8), MAD2 mitotic arrest deficient-like 1 (MAD2L1), aurora kinase A (AURKA), BUB1 mitotic checkpoint serine/threonine kinase B (BUB1B), and BUB1 mitotic checkpoint serine/threonine kinase (BUB1) were hub proteins with a higher degree centrality, betweenness centrality, and closeness centrality in the PPI network of DEGs in PNET vs fetal brain. On the other hand, CDK1, aurora kinase B (AURKB), CDC20, BUB1B, and BUB1 were hub proteins with a higher degree centrality, betweenness centrality and closeness centrality in the PPI network of DEGs in PNET vs adult brain.
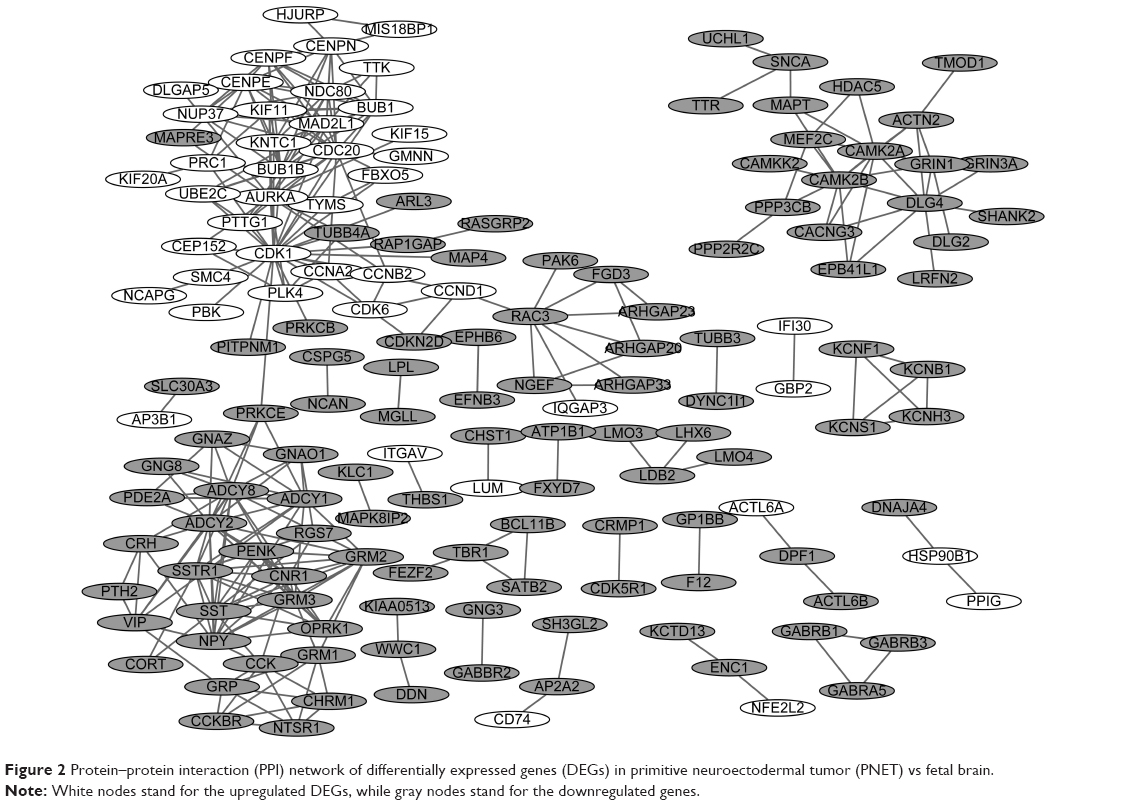 | Figure 2 Protein–protein interaction (PPI) network of differentially expressed genes (DEGs) in primitive neuroectodermal tumor (PNET) vs fetal brain. |
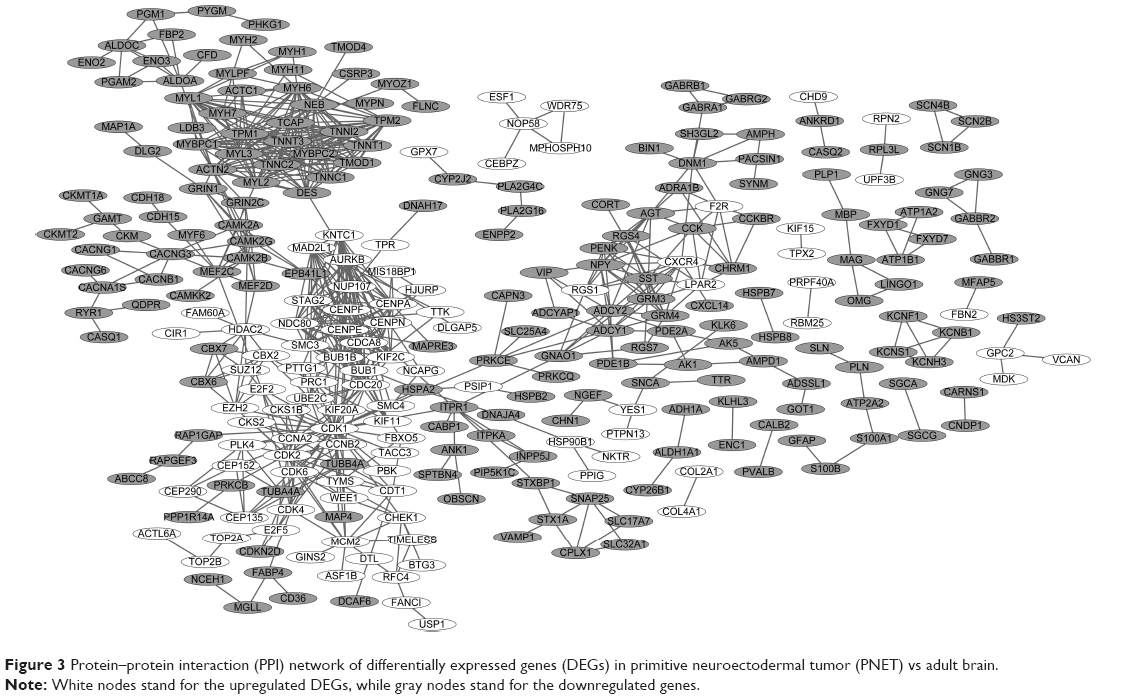 | Figure 3 Protein–protein interaction (PPI) network of differentially expressed genes (DEGs) in primitive neuroectodermal tumor (PNET) vs adult brain. |
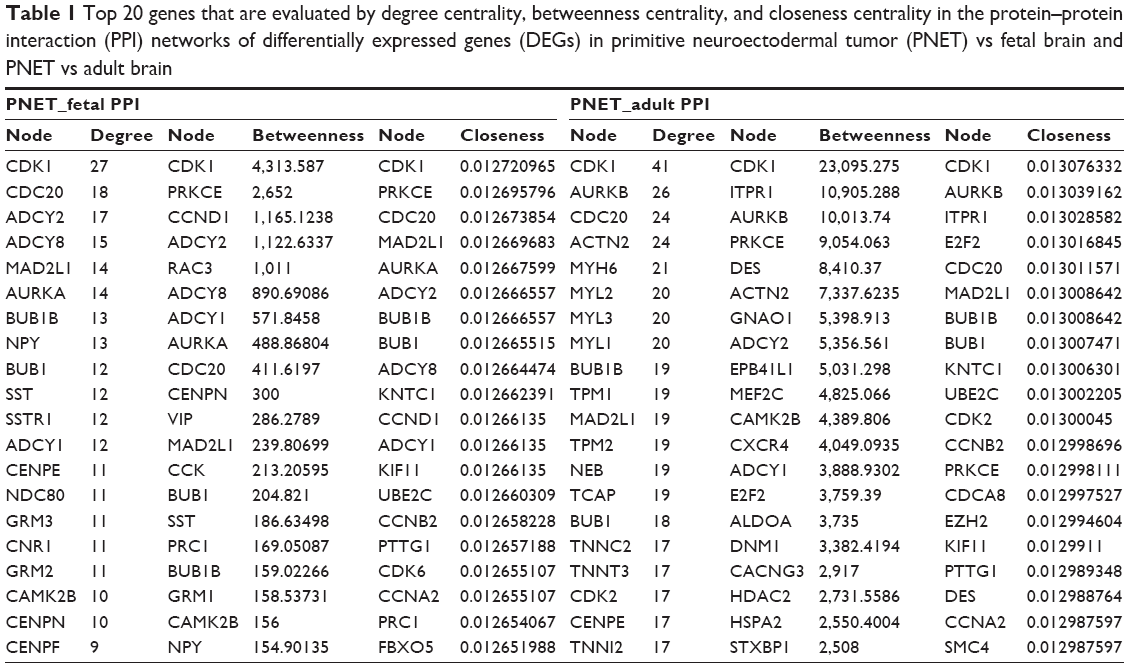 | Table 1 Top 20 genes that are evaluated by degree centrality, betweenness centrality, and closeness centrality in the protein–protein interaction (PPI) networks of differentially expressed genes (DEGs) in primitive neuroectodermal tumor (PNET) vs fetal brain and PNET vs adult brain |
In addition, two significant modules were selected from the PPI network of DEGs in sPNET vs fetal brain (Figure 4A and B), and two significant modules were selected from the PPI network of DEGs in sPNET vs adult brain (Figure 4C and D). Besides, we performed pathway enrichment analysis of genes enriched in the significant modules (Table 2; A, B, C, and D corresponded to the modules in Figure 4). The results showed that the upregulated genes in sPNET vs fetal brain, such as CDC20 and MAD2L1, were associated with cell cycle. The downregulated genes in PNET vs fetal brain, such as metabotropic glutamate receptor 3 (GRM3), ADCY2, and ADCY8, were involved in neuroactive ligand–receptor interaction and glutamatergic synapse. By contrast, the downregulated genes in sPNET vs adult brain such as ACTN2 and MYH6 were concerned with tight junction. The upregulated genes in PNET vs adult brain such as CDC20, BUB1, and BUB1B were correlated with cell cycle.
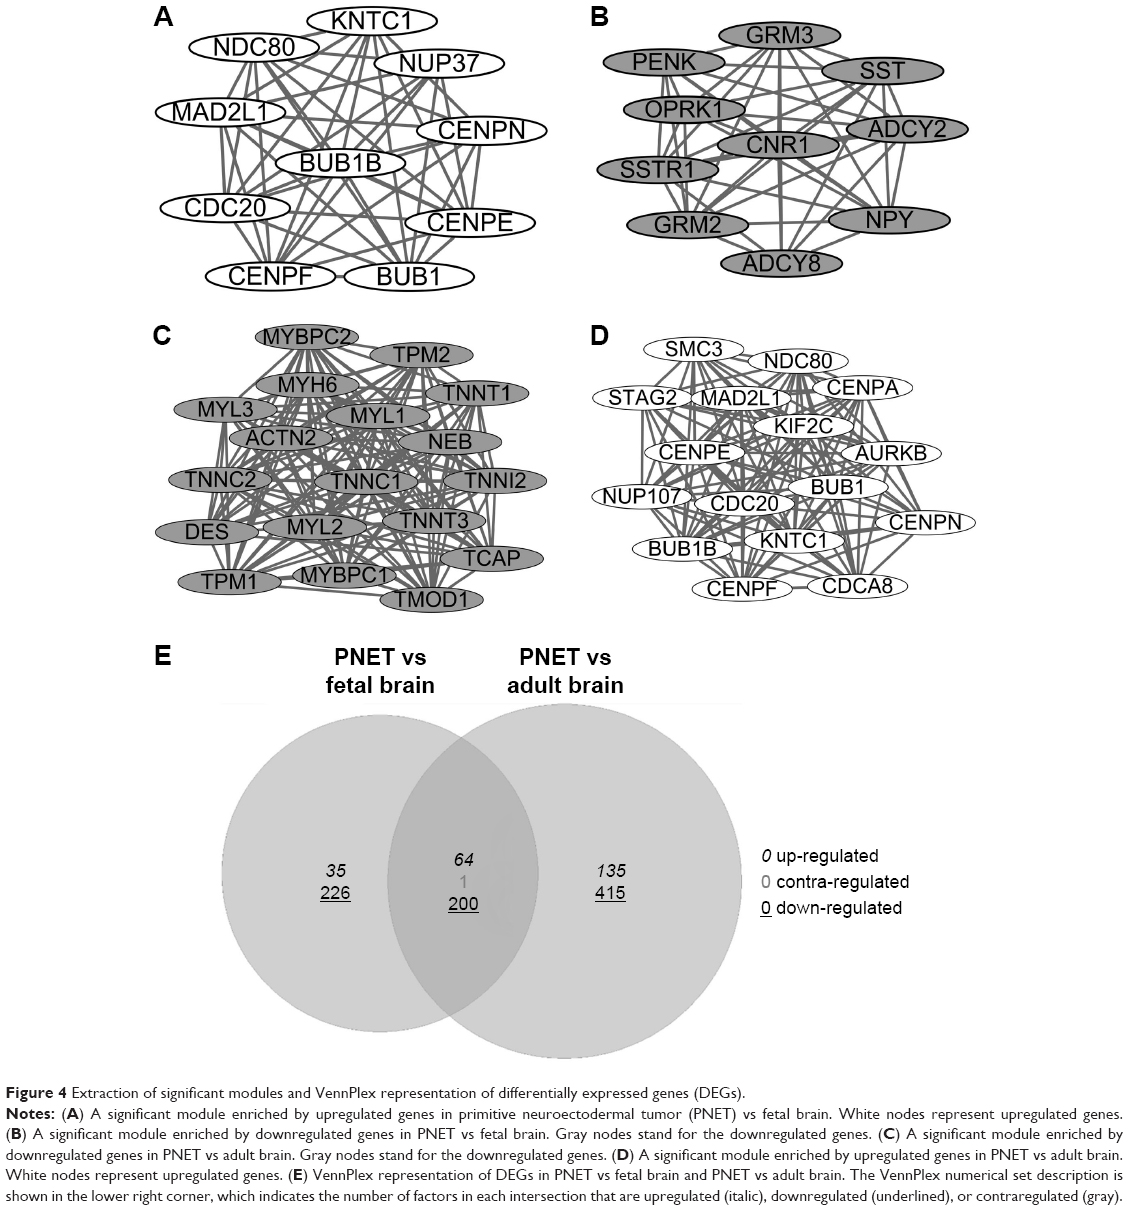 | Figure 4 Extraction of significant modules and VennPlex representation of differentially expressed genes (DEGs). |
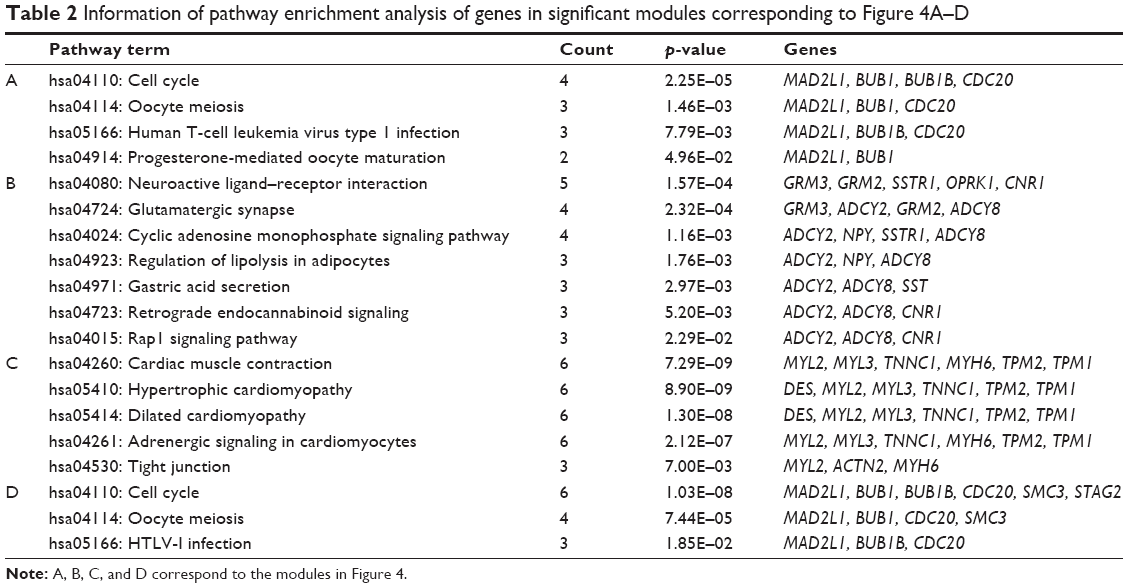 | Table 2 Information of pathway enrichment analysis of genes in significant modules corresponding to Figure 4A–D |
Identification of common DEGs in PNET vs fetal brain and PNET vs adult brain
As shown in Figure 4E, 64 common upregulated genes and 200 common downregulated genes were identified in sPNET vs fetal brain and PNET vs adult brain. Besides, one gene was identified to be a contraregulated gene. These common DEGs identified were all with |log2 FC| >2.
Identification of TFs potentially regulating the common DEGs and construction of regulatory network
Based on the common DEGs identified using VennPlex, iRegulon identified three TFs potentially regulating these common DEGs in sPNET vs fetal brain and sPNET vs adult brain. The regulatory network was constructed as shown in Figure 5A, consisting of 114 common DEGs, three TFs (transcription factor 12 [TCF12], zinc finger protein 260 [ZNF260], and glycerol-3-phosphate dehydrogenase 1 [GPD1]), and 175 interaction pairs. The |log2 FC| values of these three TFs (TCF12, ZNF260, and GPD1) in sPNET vs adult brain were all >2. The log2 FC values of TCF12, ZNF260, and GPD1 in sPNET vs fetal brain were 1.9880, 1.2513, and −0.6292, respectively. On the other hand, as shown in Figure 5B, the genes enriched in the regulatory network were involved in 28 pathways, such as hsa04024: cyclic adenosine monophosphate (cAMP) signaling pathway and hsa04020: calcium signaling pathway.
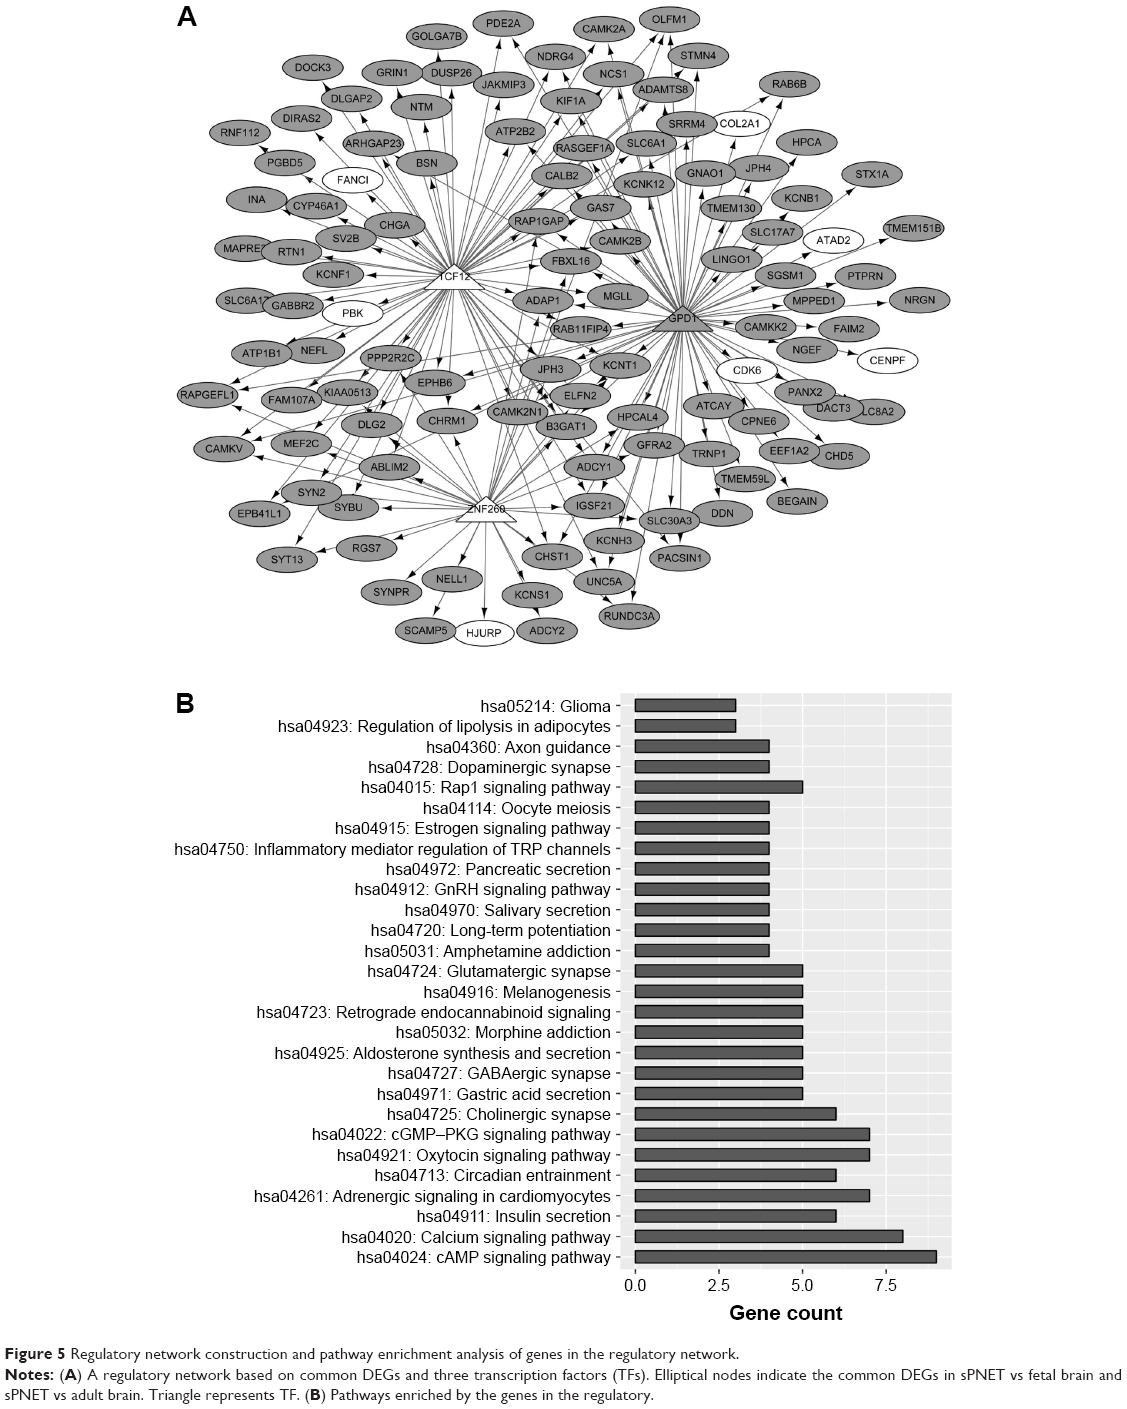 | Figure 5 Regulatory network construction and pathway enrichment analysis of genes in the regulatory network. |
Discussion
To advance sPNET therapeutics, it is of significance to delineate the cellular and molecular pathogenesis of sPNET. In the current study, we identified 526 DEGs (99 up- and 427 downregulated) in sPNET vs fetal brain and 815 DEGs (200 up- and 615 downregulated) in sPNET vs adult brain. DEGs in sPNET vs fetal brain and sPNET vs adult brain were associated with calcium signaling pathway, cell cycle, and p53 signaling pathway. CDK1, CDC20, BUB1B, and BUB1 were hub proteins in the PPI network of DEGs in sPNET vs fetal brain and sPNET vs adult brain. Two modules enriched by DEGs in sPNET vs fetal brain and two modules enriched by DEGs in sPNET vs adult brain were extracted from the PPI networks. A total of 264 overlapping DEGs (64 upregulated and 200 downregulated) were identified in both sPNET vs fetal brain and sPNET vs adult brain. The genes involved in the regulatory network, which was constructed based on the overlapping DEGs and the identified TFs, were significantly correlated with the calcium signaling pathway and cAMP signaling pathway.
Ca2+ signals impact nearly every aspect of cellular life and are a core regulator of cellular responses to the environment.20 Evidence have shown that altered expression of specific Ca2+ pumps and channels are characterizing features of some diseases and cancers.21 The findings of Mattson and Chan22 demonstrated that perturbed cellular calcium homeostasis played a pivotal role in the pathogenesis of Alzheimer’s disease. Besides, several known molecular players such as stromal interaction molecule 1 (STIM1), calcium release-activated calcium channel protein 1 (ORAI1), and transient receptor potential (TRP) channels, which are involved in cellular Ca2+ homeostasis, have been implicated in tumor cell migration and tumor metastasis.23 Davis et al24 reported the role of the intracellular calcium signal in the induction of epithelial–mesenchymal transition (EMT) in human breast cancer cells. Moreover, specific Ca2+ signals decoded by different Ca2+ sensor proteins allow a fine-tuning of the Ca2+ signaling, and Ca2+ signaling pathway is involved in early neural development.25 In this study, the overlapping DEGs of sPNET vs fetal brain and sPNET vs adult brain were significantly concerned with calcium signaling pathway, suggesting abnormalities in calcium regulation. In this context, it is surmised that calcium signaling pathway may play a prominent role in pathology of sPNET and may shed light on the discovery of new therapeutic targets of sPNET.
The cAMP signaling pathway is an important intracellular system for signal transmission that is involved in many cell types.26 Numerous studies indicate cAMP as central players underlying the pathogenesis of many diseases and show treatment strategies targeting cAMP signaling.27,28 A study demonstrated that a cAMP-dependent pathway was activated during astrocyte differentiation.29 Moreover, activation of cAMP signaling pathway is a key determinant of neuronal differentiation and plasticity.30 In this study, we found that overlapping DEGs in sPNET vs fetal brain and sPNET vs adult brain were involved in the cAMP signaling pathway. In this context, we suggested alteration of the cAMP signaling pathway as a potential mechanism in sPNET pathogenesis.
The protein encoded by CDK1 is a member of the Ser/Thr protein kinase family and is a central regulator that drives cells through the G2 phase and mitosis.31 The cyclin-dependent kinases, such as cyclin-dependent kinase 5 (Cdk5), is shown to play important roles in brain development and disease.32 A recent published study demonstrated that CDK1 could induce the activation of pre-mitotic nuclear envelope dynein recruitment and apical nuclear migration in neural stem cells.33 Besides, multiple CDK/CYCLIND genes are identified to be amplified in sPNET and medulloblastoma.34 In addition, CDK1 was found to be one of hub proteins in the PPI network of DEGs in sPNET vs fetal brain and sPNET vs adult brain. Thus, we suggested that dysregulation of CDK1 expression may be correlated with the development of sPNET through participating in cell-cycle regulation. However, more related investigations are needed to check the result.
On the other hand, CDC20 was another hub protein of the PPI networks in this study. CDC20 is an essential cell-cycle regulator interacting with several other proteins at multiple points in the cell cycle.35 Ras association domain family member 1 (RASSF1A) can inhibit APC-CDC20 activity through its D-box domains at early mitosis.36 Evidence demonstrated that the inactivation of the RASSF1A gene may play an essential role in the tumorigenesis of PNET of the central nervous sytem.37 Besides, CDC20 was identified to be upregulated in samples of sPNET and was a hub protein with a higher degree centrality, betweenness centrality, and closeness centrality in the PPI networks. Taken together, these data provided a potential link between CDC20 and the pathogenesis of sPNET.
Moreover, BUB1B and BUB1 were also hub proteins with higher topology scores in the PPI network of DEGs in sPNET vs fetal brain and sPNET vs adult brain. BUB1B and BUB1 are essential components of the mitotic checkpoint. The human brain tumor, glioblastoma multiforme, was reported for the requirement for BUB1B to suppress lethal consequences of altered kinetochore function.38 Morales et al39 showed that inhibition of BUB1 and BUBR1 decreased cell proliferation and colony formation in pediatric glioblastoma cells and enhanced radiation sensitivity. In this study, BUB1B and BUB1 were upregulated DEGs. It is tempting to speculate that BUB1B and BUB1 play critical roles in the development and progression of sPNET.
Despite merits, our study had several limitations. First, the sample size was small, which may limit our power to detect real differences in gene expression. Further studies with a larger simple size should be performed. Second, the study lacked experimental validations and cross-checking with other datasets. Pooling data from similar studies and performing experimental validations will be the focus of our future investigations.
Conclusion
Our study suggested that calcium signaling pathway, cAMP signaling pathway, and several DEGs (CDK1, CDC20, BUB1B, and BUB1) may play important roles in the pathogenesis of sPNET. Further research is warranted to determine these findings.
Acknowledgments
This work was supported by the Special Foundation for Taishan Scholars (No ts20110814) and Science and Technology Program (2014GSF118179), a project of Shandong province.
Disclosure
The authors report no conflicts of interest in this work.
References
Jones DTW, Korshunov A, Pfister SM, Taylor MD, Northcott PA. Medulloblastoma and CNS primitive neuroectodermal tumors. In: Karajannis M, Zagzag D, editors. Molecular Pathology of Nervous System Tumors. Molecular Pathology Library, Vol 8. New York, NY: Springer; 2015:121–142. | ||
Vermeulen JF, Hecke WV, Spliet WGM, et al. Pediatric primitive neuroectodermal tumors of the central nervous system differentially express granzyme inhibitors. PLoS One. 2016;11(3):e0151465. | ||
Sturm D, Orr B, Toprak U, et al. New brain tumor entities emerge from molecular classification of CNS-PNETs. Cell. 2016;164(5):1060–1072. | ||
Miller S, Ward JH, Rogers HA, Lowe J, Grundy RG. Loss of INI1 protein expression defines a subgroup of aggressive central nervous system primitive neuroectodermal tumors. Brain Pathol. 2012;23(1):19–27. | ||
Koch A, Waha A, Tonn JC, et al. Somatic mutations of WNT/wingless signaling pathway components in primitive neuroectodermal tumors. Int J Cancer. 2001;93(3):445–449. | ||
Phi JH, Kim JH, Eun KM, et al. Upregulation of SOX2, NOTCH1, and ID1 in supratentorial primitive neuroectodermal tumors: a distinct differentiation pattern from that of medulloblastomas. J Neurosurg Pediatr. 2010;5(6):608–614. | ||
Rogers HA, Ward JH, Miller S, Lowe J, Coyle B, Grundy RG. The role of the WNT/β-catenin pathway in central nervous system primitive neuroectodermal tumours (CNS PNETs). Br J Cancer. 2013;108(10):2130–2141. | ||
Li M, Lee KF, Lu Y, et al. Frequent amplification of a chr19q13.41 microRNA polycistron in aggressive primitive neuroectodermal brain tumors. Cancer Cell. 2009;16(6):533–546. | ||
Barrett T, Wilhite SE, Ledoux P, et al. NCBI GEO: archive for functional genomics data sets – update. Nucleic Acids Res. 2013;41(Database issue):991–995. | ||
Ritchie ME, Phipson B, Wu D, et al. limma powers differential expression analyses for RNA-sequencing and microarray studies. Nucleic Acids Res. 2015;43(7):e47. | ||
Benjamini Y, Hochberg Y. Controlling the false discovery rate – a practical and powerful approach to multiple testing. J R Stat Soc. 1995;57(57):289–300. | ||
Reiner–Benaim A. FDR control by the BH procedure for two-sided correlated tests with implications to gene expression data analysis. Biom J. 2007;49(1):107–126. | ||
Huang DW, Sherman BT, Tan Q, et al. DAVID bioinformatics resources: expanded annotation database and novel algorithms to better extract biology from large gene lists. Nucleic Acids Res. 2007;35 (Web Server issue):169–175. | ||
Szklarczyk D, Franceschini A, Wyder S, et al. STRING v10: protein–protein interaction networks, integrated over the tree of life. Nucl Acids Res. 2015;43(Database issue):447–452. | ||
Smoot ME, Ono K, Ruscheinski J, Wang PL, Ideker T. Cytoscape 2.8: new features for data integration and network visualization. Bioinformatics. 2011;27(3):431–432. | ||
Tang Y, Li M, Wang J, Pan Y, Wu F-X. CytoNCA: a cytoscape plugin for centrality analysis and evaluation of protein interaction networks. Biosystems. 2015;127:67–72. | ||
Saito R, Smoot ME, Ono K, et al. A travel guide to cytoscape plugins. Nat Methods. 2012;9(11):1069–1076. | ||
Cai H, Chen H, Yi T, et al. VennPlex – a novel Venn diagram program for comparing and visualizing datasets with differentially regulated datapoints. PLoS One. 2012;8(1):e53388. | ||
Janky RS, Verfaillie A, Imrichová H, et al. iRegulon: from a gene list to a gene regulatory network using large motif and track collections. PLoS Comput Biol. 2014;10(7):e1003731. | ||
Dodd AN, Kudla J, Sanders D. The language of calcium signaling. Annu Rev Plant Biol. 2010;61(1):593–620. | ||
Chen YF, Chen YT, Chiu WT, Shen MR. Remodeling of calcium signaling in tumor progression. J Biomed Sci. 2013;20(1):1–10. | ||
Mattson MP, Chan SL. Neuronal and glial calcium signaling in Alzheimer’s disease. Cell Calcium. 2003;34(4–5):385–397. | ||
Prevarskaya N, Skryma R, Shuba Y. Calcium in tumour metastasis: new roles for known actors. Nat Rev Cancer. 2011;11(8):609–618. | ||
Davis FM, Azimi I, Faville RA, et al. Induction of epithelial-mesenchymal transition (EMT) in breast cancer cells is calcium signal dependent. Oncogene. 2014;33(18):2307–2316. | ||
Leclerc C, Néant I, Moreau M. The calcium: an early signal that initiates the formation of the nervous system during embryogenesis. Front Mol Neurosci. 2012;5:3. | ||
Lefkimmiatis K, Zaccolo M. cAMP signaling in subcellular compartments. Pharmacol Ther. 2014;143(3):295–304. | ||
Torres VE, Harris PC. Strategies targeting cAMP signaling in the treatment of polycystic kidney disease. J Am Soc Nephrol. 2014;25(1):18–32. | ||
Andric SA, Janjic MM, Stojkov NJ, Kostic TS. Sildenafil treatment in vivo stimulates Leydig cell steroidogenesis via the cAMP/cGMP signaling pathway. Am J Physiol Endocrinol Metab. 2010;299(4):E544–E550. | ||
Vallejo M. PACAP signaling to DREAM: a cAMP-dependent pathway that regulates cortical astrogliogenesis. Mol Neurobiol. 2009;39(2):90–100. | ||
Stachowiak E, Fang X, Myers J, Dunham S, Stachowiak M. cAMP-induced differentiation of human neuronal progenitor cells is mediated by nuclear fibroblast growth factor receptor-1 (FGFR1). J Neurochem. 2003;84(6):1296–1312. | ||
Diril MK, Ratnacaram CK, Padmakumar VC, et al. Cyclin-dependent kinase 1 (Cdk1) is essential for cell division and suppression of DNA re-replication but not for liver regeneration. Proc Natl Acad Sci U S A. 2012;109(10):3826–3831. | ||
Su SC, Tsai LH. Cyclin-dependent kinases in brain development and disease. Ann Rev Cell Dev Biol. 2010;27(1):465–491. | ||
Baffet A, Hu D, Vallee R. Cdk1 activates pre-mitotic nuclear envelope dynein recruitment and apical nuclear migration in neural stem cells. Dev Cell. 2015;33(6):703–716. | ||
Li M, Lockwood W, Zielenska M, et al. Multiple CDK/CYCLIND genes are amplified in medulloblastoma and supratentorial primitive neuroectodermal brain tumor. Cancer Genet. 2012;205(5):220–231. | ||
Wolthuis R, Clay-Farrace L, Van ZW, et al. Cdc20 and Cks direct the spindle checkpoint-independent destruction of cyclin A. Mol Cell. 2008;30(3):290–302. | ||
Chow C, Wong N, Pagano M, et al. Regulation of APC/CCdc20 activity by RASSF1A-APC/CCdc20 circuitry. Oncogene. 2012;31(15):1975–1987. | ||
Inda MDM, Castresana JS. RASSF1A promoter is highly methylated in primitive neuroectodermal tumors of the central nervous system. Neuropathology. 2007;27(4):341–346. | ||
Ding Y, Hubert CG, Herman J, et al. Cancer-Specific requirement for BUB1B/BUBR1 in human brain tumor isolates and genetically transformed cells. Cancer Discov. 2013;3(2):198–211. | ||
Morales AG, Pezuk JA, Brassesco MS, et al. BUB1 and BUBR1 inhibition decreases proliferation and colony formation, and enhances radiation sensitivity in pediatric glioblastoma cells. Childs Nerv Syst. 2013;29(12):2241–2248. |
 © 2018 The Author(s). This work is published and licensed by Dove Medical Press Limited. The
full terms of this license are available at https://www.dovepress.com/terms
and incorporate the Creative Commons Attribution
- Non Commercial (unported, 3.0) License.
By accessing the work you hereby accept the Terms. Non-commercial uses of the work are permitted
without any further permission from Dove Medical Press Limited, provided the work is properly
attributed. For permission for commercial use of this work, please see paragraphs 4.2 and 5 of our Terms.
© 2018 The Author(s). This work is published and licensed by Dove Medical Press Limited. The
full terms of this license are available at https://www.dovepress.com/terms
and incorporate the Creative Commons Attribution
- Non Commercial (unported, 3.0) License.
By accessing the work you hereby accept the Terms. Non-commercial uses of the work are permitted
without any further permission from Dove Medical Press Limited, provided the work is properly
attributed. For permission for commercial use of this work, please see paragraphs 4.2 and 5 of our Terms.