Back to Journals » Journal of Inflammation Research » Volume 14
Integrated Bioinformatic Analysis of SARS-CoV-2 Infection Related Genes ACE2, BSG and TMPRSS2 in Aerodigestive Cancers
Authors He C ![]() , Hua X
, Hua X ![]() , Sun S, Li S
, Sun S, Li S ![]() , Wang J, Huang X
, Wang J, Huang X ![]()
Received 8 January 2021
Accepted for publication 23 February 2021
Published 10 March 2021 Volume 2021:14 Pages 791—802
DOI https://doi.org/10.2147/JIR.S300127
Checked for plagiarism Yes
Review by Single anonymous peer review
Peer reviewer comments 2
Editor who approved publication: Professor Ning Quan
Chaobin He,1– 3,* Xin Hua,1,2,4,* Shuxin Sun,1– 3,* Shaolong Li,1,2 Jun Wang,1– 3 Xin Huang1– 3
1Sun Yat-Sen University Cancer Center, State Key Laboratory of Oncology in South China, Collaborative Innovation Center for Cancer Medicine, Guangzhou, 510060, People’s Republic of China; 2Department of Experimental Research, Sun Yat-Sen University Cancer Center, Guangzhou, 510060, People’s Republic of China; 3Department of Pancreatobiliary Surgery, Sun Yat-Sen University Cancer Center, Guangzhou, 510060, People’s Republic of China; 4Department of Medical Oncology, Sun Yat-Sen University Cancer Center, Guangzhou, 510060, People’s Republic of China
*These authors contributed equally to this work
Correspondence: Xin Huang
Department of Pancreatobiliary Surgery, Sun Yat-Sen University Cancer Center, Guangzhou, Guangdong, People’s Republic of China
Email [email protected]
Background: Cancer patients are more vulnerable to severe acute respiratory syndrome coronavirus 2 (SARS-CoV-2) infection than the general population, with lung epithelial cells or enterocytes being the main targets. However, the expressions of SARS-CoV-2 entry-related genes in aerodigestive cancers have not been fully elucidated.
Methods: In this study, the expressions of SARS-CoV-2 receptors and cofactors, including angiotensin I-converting enzyme 2 (ACE2), basigin (BSG) and transmembrane serine protease 2 (TMPRSS2), were comprehensively assessed. We compared BSG and TMPRSS2 expressions between aerodigestive cancers and matched normal tissues through Gene Expression Profiling Interactive Analysis 2 (GEPIA2). Furthermore, expressions in healthy colon tissues at different anatomical locations were explored using the Genotype-Tissue Expression (GTEx) dataset. In addition, expressions among different tumor stages and the prognostic values were detected through GEPIA2. Moreover, the correlation between gene expression and immune infiltration was explored via Tumor Immune Estimation Resource (TIMER). Finally, expressions in primary colorectal cancer (CRC), lung metastasis and liver metastasis were investigated using the Gene Expression Omnibus (GEO) dataset GSE41258.
Results: Similar to ACE2, TMPRSS2 and BSG were also highly expressed in the digestive tracts. Intriguingly, BSG/TMPRSS2 expression in adjacent normal colon tissue or lung tissue was higher than that in corresponding healthy tissue, whereas they varied not among different tumor stages and correlated not with prognosis in aerodigestive cancers. Moreover, ACE2 was expressed at higher levels in lung metastases from CRC than in normal lung tissues.
Conclusion: SARS-CoV-2 entry genes were highly expressed in CRC, and we reported for the first time higher expression of ACE2 in lung metastases from CRC than in normal lung, indicating that these patients may be more susceptible to extrapulmonary or pulmonary SARS-CoV-2 infection. Since our study is a bioinformatic analysis, further experimental evidences and clinical data are urgently needed.
Keywords: ACE2, BSG, TMPRSS2, COVID-19, aerodigestive cancers
Introduction
Severe acute respiratory syndrome coronavirus 2 (SARS-CoV-2) is the cause of coronavirus disease 2019 (COVID-19), which has been declared to be a pandemic in 2020. As of 06 February 2021, 105,915,287 cases and 2,309,033 deaths have been reported globally (https://www.worldometers.info/coronavirus/).
Angiotensin I-converting enzyme 2 (ACE2) is a functional receptor that plays a crucial role in SARS-CoV-2 infection, and transmembrane serine protease 2 (TMPRSS2) plays a main supporting role;1–3 recently basigin (BSG) has been identified as another host receptor.4,5 Cancer patients are more susceptible to infections because of the immunosuppression caused by malignancy or anticancer treatments,6 such as chemotherapy. Through bioinformatic analysis, many studies have indicated that cancer tissues expressed ACE2, BSG or TMPRSS2 at higher levels than matched healthy tissues in lung adenocarcinoma (LUAD),2,7,8 stomach adenocarcinoma (STAD) and colon adenocarcinoma (COAD).9,10 This evidences provide the rationale for the high susceptibility of cancer patients to SARS-CoV-2.11,12 However, not all cancer patients are similarly at risk for COVID-19.13,14
SARS-CoV-2 is transmitted mainly through the respiratory or digestive route:3 the lungs are in direct contact with the external environment, although the expression of ACE2 in lung tissues was generally lower than that in the digestive tract, pulmonary epithelial cells are the main targets of SARS-CoV-2.3,15,16 Moreover, another study identified SARS-CoV-2 in resected specimens from colorectal cancer (CRC).17 Gastrointestinal cancers mainly metastasize to the liver and to a lesser extent the lung; therefore, the susceptibility of patients with aerodigestive cancers, including lung metastases from CRC, is worth discussing.
Materials and Methods
Gene Expression Analysis
The gene expressions in normal tissues were downloaded from the Genotype-Tissue Expression (GTEx), and the difference between men and women was explored using the R package ggpubr.10 Expressions of BSG and TMPRSS2 in human cancer tissues or cell lines were downloaded from the Gene Expression Profiling Interactive Analysis 2 (GEPIA2; http://gepia2.cancer-pku.cn/)18 or the Cancer Cell Line Encyclopedia (CCLE; https://portals.broadinstitute.org/ccle).19
Comparisons of SARS-CoV-2 Related Genes Among Different Tissues and Tumor Stages
Comparison of BSG and TMPRSS2 expressions between cancer and matched normal tissues was performed through GEPIA2, which has incorporated RNA-Seq data from The Cancer Genome Atlas (TCGA) and GTEx datasets. Likewise, we have compared gene expressions among COAD, adjacent normal colon and healthy colon; or lung cancer, adjacent normal lung and healthy lung.10 As previously reported,10,20 data were normalized in R environment using NormalizeBetweenArrays.
In addition, we explored the expression levels among different tumor stages using GEPIA2.
Immune Cell Infiltration Analysis
Tumor Immune Estimation Resource (TIMER; http://timer.cistrome.org/) is adopted for the analysis of immune cell infiltration in cancer (including B cell, CD8+ T cell, CD4+ T cell, macrophage, neutrophil and dendritic cell),21 as reported previously.22
OncoVar Analysis
OncoVar is an integrated database and analysis platform (https://oncovar.org/), by reanalyzing 10,769 exomes from 33 cancer types in TCGA and 1942 genomes from 18 cancer types in International Cancer Genome Consortium (ICGC), it could be used to identify driver mutations and driver genes.23 Genes were classified into four grades from non-pathogenic to pathogenic: level 0 (non-pathogenic, score = 0), level 1 (possible pathogenic, score = 1), level 2 (likely pathogenic, 1 < score ≤ 10), level 3 (probable pathogenic, 10 < score < 20) and level 4 (pathogenic, score ≥ 20).
Prognostic Analysis
The relationship between BSG/TMPRSS2 expression and the prognosis, including overall survival (OS) and disease-free survival (DFS), was analyzed using GEPIA2 by the Log-rank test.
Expression of SARS-CoV-2 Infection Related Genes in Metastases from CRC
ACE2, BSG and TMPRSS2 expressions in primary CRC at different anatomical sites, lung metastases and liver metastases were explored using the TCGA or Gene Expression Omnibus (GEO) dataset GSE41258, with the exclusion of repeats and 28 metastases that exhibited high levels of stromal contamination.24
Statistical Analysis
Comparisons were performed using Kruskal–Wallis tests or unpaired t-test (GraphPad Prism 7.0 software). The strength of the correlation was determined with the following guide: 0.00–0.19, very weak; 0.20–0.39, weak; 0.40–0.59, moderate; 0.60–0.79, strong; 0.80–1.0, very strong.25 Two-side p < 0.05 was considered statistically significant.
Results
Expression of BSG and TMPRSS2 in Normal and Cancer Tissues
There have been reports about ACE2, BSG or TMPRSS2 expression in humans under physiological or pathological conditions.5,9,10,26 We have previously reported the high expression of ACE2 in normal or cancerous tissues of the digestive, urinary and male reproductive tracts;10 herein we found that BSG and TMPRSS2 were also highly expressed in the normal digestive tract, and there was no big difference between men and women across different tissues (Figure 1A and B). Likewise, gastrointestinal cancer tissues (from TCGA; Figure 1C and D) or cancer cell lines (from CCLE; Figure 1E and F) expressed BSG and TMPRSS2 at relatively high levels across different cancer types.
 |
Figure 1 BSG and TMPRSS2 expressions in normal human tissues and cancers. (A and B) Difference in BSG or TMPRSS2 expression between men and women from GTEx data. The y-axis represents transformed log2 (FPKM+1). (C and D) Overview of BSG or TMPRSS2 expression in different cancers from TCGA, as obtained from GEPIA2. (E and F) Box plot showing the mRNA expression levels of BSG or TMPRSS2 in human cancer cell lines from the CCLE database. Within each box, the median is a solid line, while the mean is a dashed line. Unpaired t-test were performed. Abbreviations: BSG, basigin; TMPRSS2, transmembrane serine protease 2; GTEx, Genotype-Tissue Expression; FPKM, number of fragments per kilobase of exon per million reads; TCGA, The Cancer Genome Atlas; GEPIA2, Gene Expression Profiling Interactive Analysis 2; TPM, transcripts per million; CCLE, Cancer Cell Line Encyclopedia; CHOL, cholangiocarcinoma; COAD, colon adenocarcinoma; ESCA, esophageal carcinoma; LIHC, liver hepatocellular carcinoma; PAAD, pancreatic adenocarcinoma; READ, rectum adenocarcinoma; STAD, stomach adenocarcinoma; LUAD, lung adenocarcinoma; LUSC, lung squamous cell carcinoma. Notes: *p < 0.05; **p < 0.01; ***p < 0.001. |
Differential Expression of BSG and TMPRSS2 Between Cancer and Matched Normal Tissues in Aerodigestive Cancers
In the comparison between cancer tissues and adjacent normal tissues by using the Gene Expression Profiling Interactive Analysis 2 (GEPIA2) (from TCGA; Figure S1), cancer tissues expressed BSG at a higher level than adjacent normal tissues in CHOL, ESCA, LIHC and STAD, but at a lower level in COAD (Figure S1A and C); the level of TMPRSS2 in COAD, READ, LUAD and LUSC was lower than that in matched adjacent normal tissues (Figure S1B and D). After a combination of healthy tissues from the Genotype-Tissue Expression (GTEx) (Figure 2A–D), results showed that cancer tissues expressed BSG at a higher level than matched normal tissues in CHOL, ESCA, LIHC and pancreatic adenocarcinoma (PAAD); cancer tissues expressed TMPRS2 at a higher level in COAD and READ, but at a lower level in ESCA, PAAD, LUAD and LUSC. These results indicated a different expression pattern between adjacent normal tissues in TCGA and healthy tissues in GTEx, especially TMPRSS2 expression in the colon and rectum. It should be noted that the matched GTEx data for READ were from the healthy colon, therefore we compared the expression of BSG and TMPRSS2 among cancer, adjacent normal tissue and healthy tissue in the colon or lung. Results showed that adjacent normal colon expressed BSG and TMPRSS2 at different levels compared with a healthy colon, and transverse colon expressed TMPRSS2 at higher levels than sigmoid colon (Figure 2E and F); BSG and TMPRSS2 expressions in the adjacent normal lung were generally higher than in healthy lung (Figure 2G and H). In addition, we analyzed the correlation between BSG/TMPRSS2 expression and immune infiltration in COAD and lung cancers (LUAD and LUSC), and found a weak correlation between BSG/TMPRSS2 expression and immune cells infiltration (including B cell, CD4+ T cell, neutrophil and Dendritic cell; Figure 3A–F). Moreover, there were no statistically significant differences in the expression levels among different stages of aerodigestive cancers, except for ESCA, PAAD and LUAD for BSG (Figure 4A–I); LIHC and PAAD for TMPRSS2 (Figure 5A–I).
 |
Figure 2 Differential expressions of BSG or TMPRSS2 among aerodigestive cancers, adjacent normal tissues and healthy tissues. (A and B) Boxplot showing differential BSG or TMPRSS2 expression between human digestive cancer and matched normal tissue (TCGA normal + GTEx normal), as obtained from GEPIA2. (C and D) Boxplot showing differential BSG or TMPRSS2 expression between lung cancer and matched normal lung (TCGA normal + GTEx normal), as obtained from GEPIA2. |log2 (fold change)| cutoff, 0.5; p-value cutoff, 0.05; jitter size, 0.4 (red color: cancer; gray color: normal). (E and F) Differential BSG or TMPRSS2 expression among COAD, adjacent normal colon and healthy colon (including transverse and sigmoid colon). (G and H) Differential BSG or TMPRSS2 expression among lung cancer, adjacent normal lung and healthy lung. Kruskal–Wallis tests with post hoc using Dunn’s method were performed. Abbreviations: BSG, basigin; TMPRSS2, transmembrane serine protease 2; TCGA, The Cancer Genome Atlas; GTEx, Genotype-Tissue Expression; GEPIA2, Gene Expression Profiling Interactive Analysis 2; TPM, transcripts per million; FPKM, number of fragments per kilobase of exon per million reads; CHOL, cholangiocarcinoma; COAD, colon adenocarcinoma; ESCA, esophageal carcinoma; LIHC, liver hepatocellular carcinoma; PAAD, pancreatic adenocarcinoma; READ, rectum adenocarcinoma; STAD, stomach adenocarcinoma; LUAD, lung adenocarcinoma; LUSC, lung squamous cell carcinoma. Notes: *p < 0.05; **p < 0.01; ***p < 0.001; ****p < 0.0001. |
 |
Figure 3 Correlation between BSG or TMPRSS2 expression and tumor purity or immune infiltration in COAD, LUAD or LUSC through TIMER. (A and B) Scatter plots showing the correlations between BSG/TMPRSS2 expression and tumor purity or immune cell infiltration in COAD. (C and D) Scatter plots showing the correlations between BSG/TMPRSS2 expression and tumor purity or immune cell infiltration in LUAD. (E and F) Scatter plots showing the correlations between BSG/TMPRSS2 expression and tumor purity or immune cell infiltration in LUSC. Abbreviations: BSG, basigin; TMPRSS2, transmembrane serine protease 2; COAD, colon adenocarcinoma; LUAD, lung adenocarcinoma; LUSC, lung squamous cell carcinoma; TIMER, Tumor Immune Estimation Resource; TPM, transcripts per million. |
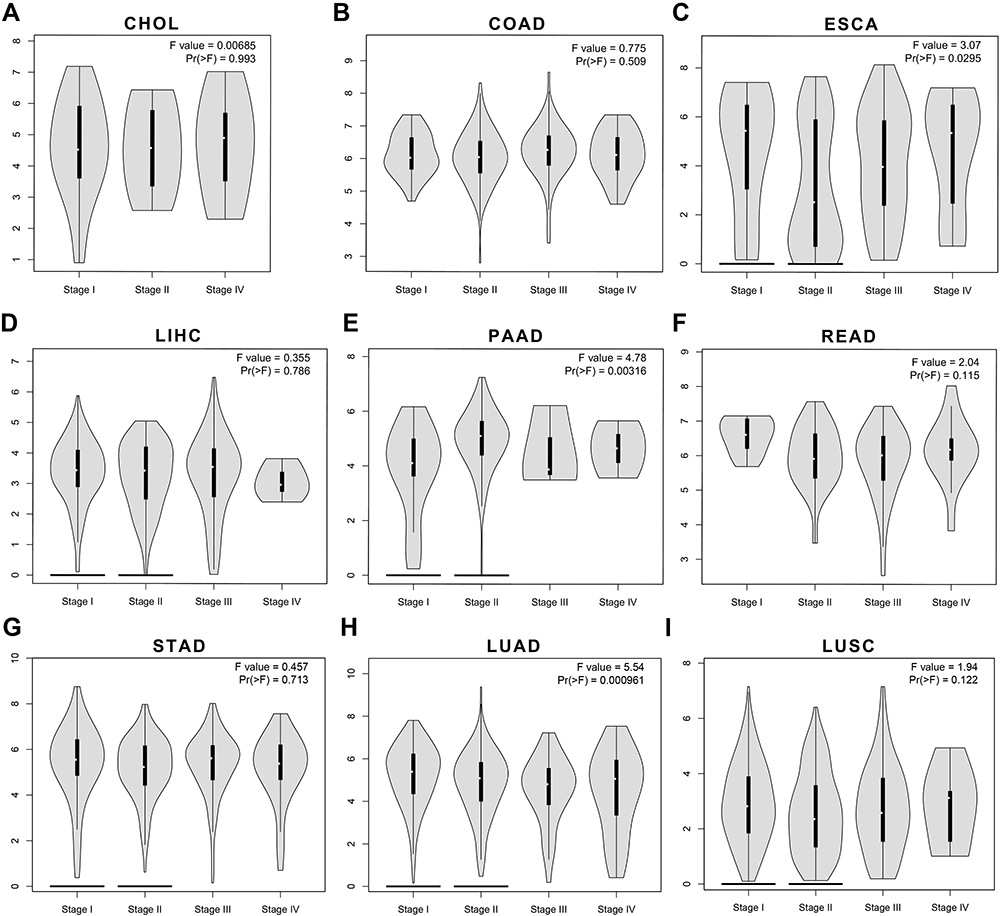 |
Figure 4 The correlations between BSG expression and tumor stages in aerodigestive cancers through GEPIA2. (A–G) Violin plots showing BSG expression at different stages of CHOL, COAD, ESCA, LIHC, PAAD, READ and STAD (cancers of the digestive tracts). (H–I) Violin plots showing BSG expression at different stages of lung cancers, including LUAD and LUSC. Abbreviations: BSG, basigin; GEPIA2, Gene Expression Profiling Interactive Analysis 2; CHOL, cholangiocarcinoma; COAD, colon adenocarcinoma; ESCA, esophageal carcinoma; LIHC, liver hepatocellular carcinoma; PAAD, pancreatic adenocarcinoma; READ, rectum adenocarcinoma; STAD, stomach adenocarcinoma; LUAD, lung adenocarcinoma; LUSC, lung squamous cell carcinoma. |
 |
Figure 5 The correlations between TMPRSS2 expression and tumor stages in aerodigestive cancers through GEPIA2. (A–G) Violin plots showing TMPRSS2 expression at different stages of CHOL, COAD, ESCA, LIHC, PAAD, READ and STAD (cancers of the digestive tracts). (H–I) Violin plots showing TMPRSS2 expression at different stages of lung cancers, including LUAD and LUSC. Abbreviations: TMPRSS2, transmembrane serine protease 2; GEPIA2, Gene Expression Profiling Interactive Analysis 2; CHOL, cholangiocarcinoma; COAD, colon adenocarcinoma; ESCA, esophageal carcinoma; LIHC, liver hepatocellular carcinoma; PAAD, pancreatic adenocarcinoma; READ, rectum adenocarcinoma; STAD, stomach adenocarcinoma; LUAD, lung adenocarcinoma; LUSC, lung squamous cell carcinoma. |
The Prognosis Value and Driver Gene Analysis of ACE2, BSG or TMPRSS2 in Aerodigestive Cancers
The prognosis of BSG and TMPRSS2 in aerodigestive cancers were explored. As shown in Figure 6, BSG correlated negatively with OS and DFS in LIHC and LUAD (Figure 6A–D), whereas there was no significant correlation with prognosis (OS or PFS) in TMPRSS2 expression (Figure 6E and F). In addition, we found that none of ACE2, BSG or TMPRSS2 was candidate cancer driver gene in the aerodigestive cancers (Table S1).
 |
Figure 6 Prognostic value of BSG or TMPRSS2 in aerodigestive cancers. (A and B) Survival significance map of BSG showed the survival analysis results, including OS and DFS, in aerodigestive cancers through GEPIA2 (the red or blue blocks denote higher or lower risks; the rectangles with frames indicate p < 0.05). (C and D) Kaplan-Meier plots of OS and DFS in LIHC and LUAD. Median BSG expression values were adopted as the cutoff. (E and F) Survival significance map of TMPRSS2 showed the survival analysis results in aerodigestive cancers. Abbreviations: BSG, basigin; TMPRSS2, transmembrane serine protease 2; OS, overall survival; DFS; disease-free survival; GEPIA2, Gene Expression Profiling Interactive Analysis 2; CHOL, cholangiocarcinoma; COAD, colon adenocarcinoma; ESCA, esophageal carcinoma; LIHC, liver hepatocellular carcinoma; PAAD, pancreatic adenocarcinoma; READ, rectum adenocarcinoma; STAD, stomach adenocarcinoma; LUAD, lung adenocarcinoma; LUSC, lung squamous cell carcinoma. |
Lung Metastases from Colorectal Cancer (CRC) Expressed More ACE2 Than Normal Lung Tissues
Since ACE2, BSG and TMPRSS2 were expressed at high levels in gastrointestinal cancers. First, we investigated their expression in CRC at different anatomical locations using TCGA data or GSE41258 dataset. The results showed that there was little difference in the expression of ACE2 (Figure 7A and D), BSG (Figure 7B and E) or TMPRSS2 (Figure 7C and F). We next compared the expression levels among primary CRC, liver metastasis, normal liver tissue, lung metastasis and normal lung tissue. The comparative analysis between metastases and related normal tissues (the lung or liver) showed that ACE2 was expressed at a higher level in lung metastasis than in normal lung tissue, whereas the difference between liver metastasis and normal liver tissue did not reach statistical significance (Figure 7G); liver metastases expressed BSG at a higher level than normal liver (Figure 7H); although TMPRSS2 expression in liver/lung metastases was higher than that in matched normal liver/lung, the differences did not reach statistical significance (Figure 7I). In addition, there were no statistically significant differences in ACE2, BSG or TMPRSS2 expression among primary CRC, liver metastasis and lung metastasis (Figure 7G–I).
 |
Figure 7 ACE2, BSG and TMPRSS2 expressions in CRC, liver metastasis, normal liver, lung metastasis and normal lung. (A–F) Differential expression of ACE2, BSG or TMPRSS2 among CRC at different anatomical locations, using data from TCGA (A–C) or GSE41258 (D–F). (G–I) Differential expression of ACE2, BSG or TMPRSS2 among primary CRC, liver metastasis, normal liver, lung metastasis and normal lung. All samples were taken from CRC patients. Kruskal–Wallis tests with post hoc using Dunn’s method were performed. Abbreviations: ACE2, angiotensin I-converting enzyme 2; BSG, basigin; TMPRSS2, transmembrane serine protease 2; CRC, colorectal cancer; TCGA, The Cancer Genome Atlas; FPKM, number of fragments per kilobase of exon per million reads. Notes: *p < 0.05; **p < 0.01; ****p < 0.0001. |
Discussion
Patients with cancers are immunocompromised and vulnerable to severe infections, including SARS-CoV-2. For cancer patients with COVID-19, increased age, male sex and comorbidity were associated with mortality.27,28
First, SARS-CoV-2 invaded host cells through receptor ACE2 or BSG, and cofactors, such as TMPRSS2.5,26 ACE2, BSG and TMPRSS2 were both highly expressed in human colon tissues, including normal and cancerous tissues; and there were no big differences between male and female (Figure 1).10 Therefore, the gender differences in morbidity and mortality may be attributed to the sex differences in immune.29–31
Second, we found that both BSG and TMPRSS2 expression levels in adjacent normal tissue were generally higher than corresponding cancer or healthy tissue in colon or lung (Figure 2), which could be partially explained by the immune cells infiltration (Figure 3), since TMPRSS2 correlated with immune cell infiltration and there were differences in immune infiltration among cancers, adjacent normal tissues and healthy tissues.32–34 These findings were roughly consistent with that others have detected SARS-CoV-2 in enterocytes from adjacent normal colorectal tissues resected from CRC patients with COVID-19.17 In addition, different anatomical sites of the colon expressed ACE2, BSG or TMPRSS2 at different levels (Figure 2E and F).10 However, they were not significantly different among different stages (Figures 4 and 5), and were not related to prognosis (Figure 6) in COAD or READ, which was consistent with the negative results of OncoVar analysis (Table S1).
Third, based on the abovementioned results, we aimed to explore the expression levels of SARS-CoV-2 entry-related genes in lung metastases from CRC, since CRC expressed high levels of ACE2, BSG and TMPRSS2, whereas lung presented the most commonly affected site. Intriguingly, there was little difference in ACE2, BSG or TMPRSS2 expression among CRC from different anatomical sites (Figure 7A–C, from TCGA; Figure 7D–F, from GSE41258), given that there were differences between normal transverse and sigmoid colon (Figure 2E and F).10 In addition, results showed that lung metastasis expressed ACE2, but not BSG or TMPRSS2 at higher levels than normal lung (Figure 7G–I), since ACE2 was the most important gene for SARS-CoV-2 entry, our study suggested that patients with lung metastases could be more vulnerable to SARS-CoV-2 than the general population. Supportively, others have improved SARS-CoV-2 infection by transducing A549 cells (human adenocarcinomic alveolar basal epithelial) with a vector over-expressing human ACE2.35 Moreover, the little difference among primary CRC, liver metastasis and lung metastasis indicated that ACE2, BSG or TMPRSS2 should be not relevant to the metastatic capacity, which was consistent with the finding that they were not significantly related to prognosis in COAD or READ (including OS and DFS; Figure 6).10
In conjunction with our previous publication,10 the results of this study showed that patients with aerodigestive cancers could be more susceptible to SARS-CoV-2; these findings were consistent with other clinical observations that lung cancer and CRC were the most common types in COVID-19 patients;36–38 in addition, ACE2 expression in lung metastases from CRC was higher than that in the normal lung (Figure 7), raising the possibility that these patients may be more vulnerable to pulmonary SARS-CoV-2 infection regardless of immunosuppression caused by malignancy or anticancer therapeutics, and lung metastases or circulating CRC cells could serve as a reservoir or transporter of SARS-CoV-2 for replication and dissemination. Moreover, the COVID-19 pandemic had a hysteresis effect on cancer diagnosis and treatment, and there was a report that SARS-CoV-2 infection could induce epithelial to mesenchymal transition in lung cancer cells,39 which could induce cancer progression and metastasis.
Besides lung cells, SARS-CoV-2 can infect enterocytes,15 cholangiocytes40 and cardiomyocytes.41 However, to this date, there is only limited evidence that SARS-CoV-2 could infect cancer cells.39 Although studies have reported the morbidity of primary cancers to SARS-CoV-2,11 we presented the rational of high susceptibility to SARS-CoV-2 in patients with aerodigestive cancers.
Conclusion
SARS-CoV-2 infection-related genes ACE2, BSG and TMPRSS2 were relatively highly expressed in aerodigestive cancers. To the best of our knowledge, this is the first study suggesting the genetic susceptibility of lung metastases to SARS-CoV-2. Patients with lung metastases of CRC should be more cautious to SARS-CoV-2, and be given more supervision. Since our data and other studies mainly depend on bioinformatics analysis, further validation with real-world or experimental data is needed.
Abbreviations
ACE2, angiotensin I-converting enzyme 2; BSG, basigin; CCLE, Cancer Cell Line Encyclopedia; CHOL, cholangiocarcinoma; COAD, colon adenocarcinoma; COVID-19, coronavirus diseases 2019; CRC, colorectal cancer; ESCA, esophageal carcinoma; FPKM, number of fragments per kilobase of exon per million reads; GEO, Gene Expression Omnibus; GEPIA2, Gene Expression Profiling Interactive Analysis 2; GTEx, Genotype-Tissue Expression; ICGC, International Cancer Genome Consortium; LIHC, liver hepatocellular carcinoma; LUAD, lung adenocarcinoma; LUSC, lung squamous cell carcinoma; PAAD, pancreatic adenocarcinoma; READ, rectum adenocarcinoma; SARS-CoV-2, severe acute respiratory syndrome coronavirus 2; STAD, stomach adenocarcinoma; TCGA, The Cancer Genome Atlas; TIMER, Tumor Immune Estimation Resource; TMPRSS2, transmembrane serine protease 2; TPM, transcripts per million.
Data Sharing Statement
All data are available in the manuscript or upon request to the corresponding author.
Disclosure
All authors report no conflicts of interest in this work.
References
1. Hoffmann M, Kleine-Weber H, Schroeder S, et al. SARS-CoV-2 cell entry depends on ACE2 and TMPRSS2 and is blocked by a clinically proven protease inhibitor. Cell. 2020;181(2):271–280 e278. doi:10.1016/j.cell.2020.02.052
2. Kong Q, Xiang Z, Wu Y, Gu Y, Guo J, Geng F. Analysis of the susceptibility of lung cancer patients to SARS-CoV-2 infection. Mol Cancer. 2020;19(1):80. doi:10.1186/s12943-020-01209-2
3. Wiersinga WJ, Rhodes A, Cheng AC, Peacock SJ, Prescott HC. Pathophysiology, transmission, diagnosis, and treatment of Coronavirus disease 2019 (COVID-19): a review. JAMA. 2020;324:782. doi:10.1001/jama.2020.12839
4. Wang K, Chen W, Zhou Y-S, et al. SARS-CoV-2 invades host cells via a novel route: CD147-spike protein. bioRxiv. 2020.
5. Qiao J, Li W, Bao J, et al. The expression of SARS-CoV-2 receptor ACE2 and CD147, and protease TMPRSS2 in human and mouse brain cells and mouse brain tissues. Biochem Biophys Res Commun. 2020;533:867–871. doi:10.1016/j.bbrc.2020.09.042
6. Sica A, Massarotti M. Myeloid suppressor cells in cancer and autoimmunity. J Autoimmun. 2017;85:117–125. doi:10.1016/j.jaut.2017.07.010
7. Zhang H, Quek K, Chen R, Chen J, Chen B. Expression of the SAR2-Cov-2 receptor ACE2 reveals the susceptibility of COVID-19 in non-small cell lung cancer. J Cancer. 2020;11(18):5289–5292. doi:10.7150/jca.49462
8. Ilikci Sagkan R, Akin-Bali DF. Structural variations and expression profiles of the SARS-CoV-2 host invasion genes in lung cancer. J Med Virol. 2020;92:2637–2647. doi:10.1002/jmv.26107
9. Katopodis P, Anikin V, Randeva HS, et al. Pan‑cancer analysis of transmembrane protease serine 2 and cathepsin L that mediate cellular SARS‑CoV‑2 infection leading to COVID-19. Int J Oncol. 2020;57(2):533–539. doi:10.3892/ijo.2020.5071
10. Huang X, He C, Hua X, et al. Bioinformatic analysis of correlation between immune infiltration and COVID-19 in cancer patients. Int J Biol Sci. 2020;16(13):2464–2476. doi:10.7150/ijbs.48639
11. Liang W, Guan W, Chen R, et al. Cancer patients in SARS-CoV-2 infection: a nationwide analysis in China. Lancet Oncol. 2020;21(3):335–337. doi:10.1016/S1470-2045(20)30096-6
12. Tian Y, Qiu X, Wang C, et al. Cancer associates with risk and severe events of COVID-19: a systematic review and meta-analysis. Int J Cancer. 2020;148:363–374. doi:10.1002/ijc.33213
13. Chamilos G, Lionakis MS, Kontoyiannis DP. Are all patients with cancer at heightened risk for severe Coronavirus Disease 2019 (COVID-19)? Clin Infect Dis. 2020. doi:10.1093/cid/ciaa1079
14. Lee LYW, Cazier JB, Starkey T, et al. COVID-19 prevalence and mortality in patients with cancer and the effect of primary tumour subtype and patient demographics: a prospective cohort study. Lancet Oncol. 2020;21(10):1309–1316. doi:10.1016/S1470-2045(20)30442-3
15. Lamers MM, Beumer J, van der Vaart J, et al. SARS-CoV-2 productively infects human gut enterocytes. Science (New York, NY). 2020;369(6499):50–54. doi:10.1126/science.abc1669
16. Harmer D, Gilbert M, Borman R, Clark KL. Quantitative mRNA expression profiling of ACE 2, a novel homologue of angiotensin converting enzyme. FEBS Lett. 2002;532(1–2):107–110. doi:10.1016/S0014-5793(02)03640-2
17. Liu YL, Ren J, Yuan JP, et al. Postoperative onset and detection of SARS-CoV-2 in surgically resected specimens from gastrointestinal cancer patients with pre/asymptomatic COVID-19. Ann Surg. 2020;272(6):e321–e328. doi:10.1097/SLA.0000000000004362
18. Tang Z, Kang B, Li C, Chen T, Zhang Z. GEPIA2: an enhanced web server for large-scale expression profiling and interactive analysis. Nucleic Acids Res. 2019;47(W1):W556–w560. doi:10.1093/nar/gkz430
19. Barretina J, Caponigro G, Stransky N, et al. The cancer cell line encyclopedia enables predictive modelling of anticancer drug sensitivity. Nature. 2012;483(7391):603–607. doi:10.1038/nature11003
20. Cao T, Pan W, Sun X, Shen H. Increased expression of TET3 predicts unfavorable prognosis in patients with ovarian cancer-a bioinformatics integrative analysis. J Ovarian Res. 2019;12(1):101. doi:10.1186/s13048-019-0575-4
21. Li T, Fan J, Wang B, et al. TIMER: a web server for comprehensive analysis of tumor-infiltrating immune cells. Cancer Res. 2017;77(21):e108–e110. doi:10.1158/0008-5472.CAN-17-0307
22. Huang X, He C, Lin G, et al. Induced CD10 expression during monocyte-to-macrophage differentiation identifies a unique subset of macrophages in pancreatic ductal adenocarcinoma. Biochem Biophys Res Commun. 2020;524(4):1064–1071. doi:10.1016/j.bbrc.2020.02.042
23. Wang T, Ruan S, Zhao X, et al. OncoVar: an integrated database and analysis platform for oncogenic driver variants in cancers. Nucleic Acids Res. 2021;49(D1):D1289–d1301. doi:10.1093/nar/gkaa1033
24. Sheffer M, Bacolod MD, Zuk O, et al. Association of survival and disease progression with chromosomal instability: a genomic exploration of colorectal cancer. Proc Natl Acad Sci U S A. 2009;106(17):7131–7136. doi:10.1073/pnas.0902232106
25. Pan JH, Zhou H, Cooper L, et al. LAYN is a prognostic biomarker and correlated with immune infiltrates in gastric and colon cancers. Front Immunol. 2019;10:6. doi:10.3389/fimmu.2019.00006
26. Matusiak M, Schürch CM. Expression of SARS-CoV-2 entry receptors in the respiratory tract of healthy individuals, smokers and asthmatics. Respir Res. 2020;21(1):252. doi:10.1186/s12931-020-01521-x
27. Lee LY, Cazier JB, Angelis V, et al. COVID-19 mortality in patients with cancer on chemotherapy or other anticancer treatments: a prospective cohort study. Lancet (London, England). 2020;395(10241):1919–1926. doi:10.1016/S0140-6736(20)31173-9
28. Kuderer NM, Choueiri TK, Shah DP, et al. Clinical impact of COVID-19 on patients with cancer (CCC19): a cohort study. Lancet (London, England). 2020;395(10241):1907–1918. doi:10.1016/S0140-6736(20)31187-9
29. Womersley K, Ripullone K, Peters SA, Woodward M. Covid-19: male disadvantage highlights the importance of sex disaggregated data. BMJ. 2020;370:m2870. doi:10.1136/bmj.m2870
30. Takahashi T, Ellingson MK, Wong P, et al. Sex differences in immune responses that underlie COVID-19 disease outcomes. Nature. 2020;588:315–320. doi:10.1038/s41586-020-2700-3
31. Kopel J, Perisetti A, Roghani A, Aziz M, Gajendran M, Goyal H. Racial and gender-based differences in COVID-19. Front Public Health. 2020;8:418. doi:10.3389/fpubh.2020.00418
32. Bernardi S, Zennaro C, Palmisano S, et al. Characterization and significance of ACE2 and Mas receptor in human colon adenocarcinoma. JRAAS. 2012;13(1):202–209. doi:10.1177/1470320311426023
33. Aran D, Lasry A, Zinger A, et al. Widespread parainflammation in human cancer. Genome Biol. 2016;17(1):145. doi:10.1186/s13059-016-0995-z
34. Ying L, Yan F, Meng Q, et al. Understanding immune phenotypes in human gastric disease tissues by multiplexed immunohistochemistry. J Transl Med. 2017;15(1):206. doi:10.1186/s12967-017-1311-8
35. Blanco-Melo D, Nilsson-Payant BE, Liu WC, et al. Imbalanced host response to SARS-CoV-2 drives development of COVID-19. Cell. 2020;181(5):1036–1045.e1039. doi:10.1016/j.cell.2020.04.026
36. Dai M, Liu D, Liu M, et al. Patients with cancer appear more vulnerable to SARS-CoV-2: a multicenter study during the COVID-19 outbreak. Cancer Discov. 2020;10(6):783–791. doi:10.1158/2159-8290.CD-20-0422
37. Zhang H, Wang L, Chen Y, et al. Outcomes of novel coronavirus disease 2019 (COVID-19) infection in 107 patients with cancer from Wuhan, China. Cancer. 2020;126(17):4023–4031. doi:10.1002/cncr.33042
38. Wang B, Huang Y. Which type of cancer patients are more susceptible to the SARS-COX-2: evidence from a meta-analysis and bioinformatics analysis. Crit Rev Oncol Hematol. 2020;153:103032. doi:10.1016/j.critrevonc.2020.103032
39. Stewart CA, Gay CM, Ramkumar K, et al. SARS-CoV-2 infection induces EMT-like molecular changes, including ZEB1-mediated repression of the viral receptor ACE2, in lung cancer models. bioRxiv. 2020. doi:10.1101/2020.05.28.122291
40. Zhao B, Ni C, Gao R, et al. Recapitulation of SARS-CoV-2 infection and cholangiocyte damage with human liver ductal organoids. Protein Cell. 2020;1–5.
41. Sharma A, Garcia G, Wang Y, et al. Human iPSC-derived cardiomyocytes are susceptible to SARS-CoV-2 infection. Cell Rep Med. 2020;1(4):100052. doi:10.1016/j.xcrm.2020.100052
 © 2021 The Author(s). This work is published and licensed by Dove Medical Press Limited. The
full terms of this license are available at https://www.dovepress.com/terms
and incorporate the Creative Commons Attribution
- Non Commercial (unported, 3.0) License.
By accessing the work you hereby accept the Terms. Non-commercial uses of the work are permitted
without any further permission from Dove Medical Press Limited, provided the work is properly
attributed. For permission for commercial use of this work, please see paragraphs 4.2 and 5 of our Terms.
© 2021 The Author(s). This work is published and licensed by Dove Medical Press Limited. The
full terms of this license are available at https://www.dovepress.com/terms
and incorporate the Creative Commons Attribution
- Non Commercial (unported, 3.0) License.
By accessing the work you hereby accept the Terms. Non-commercial uses of the work are permitted
without any further permission from Dove Medical Press Limited, provided the work is properly
attributed. For permission for commercial use of this work, please see paragraphs 4.2 and 5 of our Terms.