Back to Journals » Cancer Management and Research » Volume 10
Integrated analysis reveals key genes with prognostic value in lung adenocarcinoma
Authors Song YJ, Tan J, Gao XH, Wang LX
Received 19 March 2018
Accepted for publication 4 August 2018
Published 21 November 2018 Volume 2018:10 Pages 6097—6108
DOI https://doi.org/10.2147/CMAR.S168636
Checked for plagiarism Yes
Review by Single anonymous peer review
Peer reviewer comments 3
Editor who approved publication: Dr Antonella D'Anneo
Ying-Jian Song,1 Juan Tan,2 Xin-Huai Gao,1 Li-Xin Wang1
1Department of Respiratory Medicine, The Affiliated Huaian No. 1 People’s Hospital of Nanjing Medical University, Huai’an, Jiangsu, People’s Republic of China; 2Department of Gerontology, The Affiliated Huaian No. 1 People’s Hospital of Nanjing Medical University, Huai’an, Jiangsu, People’s Republic of China
Background: Lung cancer is one of the most common malignant tumors. Despite advances in lung cancer therapies, prognosis of non-small-cell lung cancer is still unfavorable. The aim of this study was to identify the prognostic value of key genes in lung tumorigenesis.
Methods: Differentially expressed genes (DEGs) were screened out by GEO2R from three Gene Expression Omnibus cohorts. Common DEGs were selected for Kyoto Encyclopedia of Genes and Genomes pathway analysis and Gene Ontology enrichment analysis. Protein–protein interaction networks were constructed by the STRING database and visualized by Cytoscape software. Hub genes, filtered from the CytoHubba, were validated using the Gene Expression Profiling Interactive Analysis database, and their genomic alterations were identified by performing the cBioportal. Finally, overall survival analysis of hub genes was performed using Kaplan–Meier Plotter.
Results: From three datasets, 169 DEGs (70 upregulated and 99 downregulated) were identified. Gene Ontology and Kyoto Encyclopedia of Genes and Genomes pathway analyses showed that upregulated DEGs were significantly enriched in cell cycle, p53 pathway, and extracellular matrix–receptor interactions; the downregulated DEGs were significantly enriched in PPAR pathway and tyrosine metabolism. The protein–protein interaction network consisted of 71 nodes and 305 edges, including 49 upregulated and 22 downregulated genes. The hub genes, including AURKB, BUB1B, KIF2C, HMMR, CENPF, and CENPU, were overexpressed compared with the normal group by Gene Expression Profiling Interactive Analysis analysis, and associated with reduced overall survival in lung cancer patients. In the genomic alterations analysis, two hotspot mutations (S2021C/F and E314K/V) were identified in Pfam protein domains.
Conclusion: DEGs, including AURKB, BUB1B, KIF2C, HMMR, CENPF, and CENPU, might be potential biomarkers for the prognosis and treatment of lung adenocarcinoma.
Keywords: lung adenocarcinoma, prognosis, gene expression profiling, differentially expressed, bioinformatics analysis
Introduction
Lung cancer is the leading cause of cancer-related death in men and the second leading cause in women worldwide; it is also the most common cause of cancer death in both men and women in the United States.1 Lung cancer is classified as small-cell or non-small-cell lung cancer (NSCLC) for the purposes of treatment. NSCLC constitutes about 85% of all lung cancers, and lung adenocarcinoma (LAC) is the most diagnosed histological subtype of NSCLC, followed by squamous cell carcinoma. The high incidence of lung cancer is due to tobacco smoking, indoor air pollution,2 outdoor pollution,3 genetic alterations,4 and other factors. The genetic alterations associated with lung cancer include epidermal growth factor receptor (EGFR) mutations, anaplastic lymphoma kinase (ALK) fusion or rearrangement,5,6 and other aberrations. Targeted therapy, such as tyrosine-kinase inhibitors can suppress the kinase activity of oncogenic EGFR and ALK proteins.7 Despite advances in chemotherapy, radiation therapy, surgery, and targeted therapy for lung cancer, the 5-year survival rates for NSCLC are only 21%.8 Therefore, it is important to investigate molecular mechanisms and biomarkers in LAC to develop more effective diagnostic and therapeutic strategies.
Through the rapid development of molecular biology and bioinformatics, such as microarray technology – a high-throughput platform for gene expression analysis – we can now explore differentially expressed genes (DEGs) involved in tumorigenesis. For example, through a comprehensive bioinformatics analysis, Shi et al9 identified that CDCA2 was dramatically upregulated in LAC tissues, where it promotes proliferation and predicts poor prognosis.9 Zhang et al10 demonstrated that HOXA11–AS overexpression was associated with lung cancer development and progression also using an integrated bioinformatics analysis. Li et al11 found that CD44 overexpression was associated with the occurrence and migration of NSCLC using a combined bioinformatics technology. Despite the recent advances in targeted therapies for lung cancer, including agents targeting EGFR, VEGF, and ALK, organometallics and antimitotics are still largely used for treatment.12 Thus, more work is needed to discover the underlying molecular mechanisms in lung cancer.
In this study, we identified key genes in LAC by combining bioinformatics analyses. DEGs, Gene Ontology (GO) terms, and Kyoto Encyclopedia of Genes and Genomes (KEGG) pathways associated with lung cancer were investigated. Subsequently, the expression of key genes related to lung cancer was validated. Furthermore, survival analyses correlated with the expression of the key genes were carried out. We investigated the potential candidate biomarkers for their utility in diagnosis, prognosis, and drug targeting in LAC.
Materials and methods
Microarray data
Three gene expression profiles GSE18842, GSE21933, and GSE89039 were downloaded from the National Center for Biotechnology Information Gene Expression Omnibus (GEO, http://www.ncbi.nlm.nih.gov/geo) database. GSE18842 included 46 NSCLC tissue samples and 45 paired nontumor samples. GSE21933 consisted of 21 NSCLC tissue samples and 21 corresponding normal samples. GSE89039 comprised eight LAC tissues samples and eight corresponding nontumor samples.
DEG screening
GEO2R (http://www.ncbi.nlm.nih.gov/geo/geo2r/) is an interactive web tool that compares two groups of samples under the same experimental conditions and can analyze almost any GEO series.13 This tool uses established Bioconductor R packages to analyze GEO data. In this study, GEO2R was used to screen DEGs between lung cancer and normal tissue samples. An adjusted P-value (adj. P) <0.05 and |logFC| >2 were set as the cut-off criteria. Common DEGs from the three datasets were selected for functional annotation.
Functional and pathway enrichment analysis
The GO (http://www.geneontology.org) database includes three categories: biological process (BP), cellular component (CC), and molecular function (MF).14 The KEGG (http://www.genome.ad.jp/kegg/) database collects genomic, chemical, and systematic functional information.15 The Database for Annotation, Visualization and Integrated Discovery (DAVID, http://david.abcc.ncifcrf.gov/) provides a set of functional annotation tools to analyze the biological roles of genes.16 In this study, GO terms and KEGG pathways were analyzed using the DAVID online tool with the enrichment threshold of P<0.05.
PPI network construction and analysis of modules
The STRING database (http://string-db.org/) provides a significant association of protein–protein interactions (PPIs).17 Cytoscape is used for the visual exploration of interaction networks.18 In this study, DEG PPI networks were analyzed by the STRING database and subsequently visualized using Cytoscape. A combined score >0.9 was set as the cut-off criterion. A novel Cytoscape plugin CytoHubba19 was used to identify the hub genes by finding the intersection of the top 30 genes from 12 topological analysis methods. Then, Molecular Complex Detection (MCODE) was performed to screen modules of PPI networks with degree cut-off =2, node score cut-off =0.2, k-core =2, and max depth =100. The functional enrichment analysis of genes in the module was performed using DAVID. A P-value <0.05 was set as the cut-off criterion.
Validation of hub genes
The Gene Expression Profiling Interactive Analysis (GEPIA) database (http://gepia.cancer-pku.cn/) is a web-based tool to deliver fast and customizable functionalities based on The Cancer Genome Atlas (TCGA) and GTEx data.20 In this study, we used the GEPIA database to validate the expression of hub genes identified in the PPI network and module, and analyze the association of their expression levels with LAC TNM stage. We selected P<0.05 and fold change >2 as a threshold.
Exploring cancer genomics data by cBioportal
The cBioPortal for Cancer Genomics (http://cbioportal.org) provides a resource for visualization and analyzing multidimensional cancer genomics data.20 In the present study, alteration frequencies of hub genes were performed based on Mutation and DNA copy-number alterations in four selected lung cancer subtypes (Pan-Lung Cancer-TCGA, Nat Genet 2016; Lung Adenocarcinoma-TCGA, Provisional; Lung Squamous Cell Carcinoma-TCGA, Provisional; Small-Cell Lung Cancer, U Cologne, Nature 2015).
Survival analysis of DEGs
A Kaplan–Meier plotter (www.kmplot.com) was used to assess the effect of 54,675 genes on survival using 10,461 samples, including 5,143 breast, 1,816 ovarian, 2,437 lung, and 1,065 gastric cancer patients.21 We further investigated whether the overexpression of hub genes was associated with overall survival using the Kaplan–Meier method with log-rank test. The HR with 95% CI and log-rank P-value were calculated. We selected P<0.05 as a threshold.
Results
DEG identification
A total of 2,623 DEGs were identified from the GSE18842, GSE21993 and GSE89039 datasets. Among them, 169 genes presented identical expression trends in all three datasets (Figure 1), including 70 upregulated genes and 99 downregulated genes in lung cancer tissues compared with normal tissues. A heat map demonstrated the significant differential distribution of the DEGs using data profile GSE18842 as a reference (Figure 2).
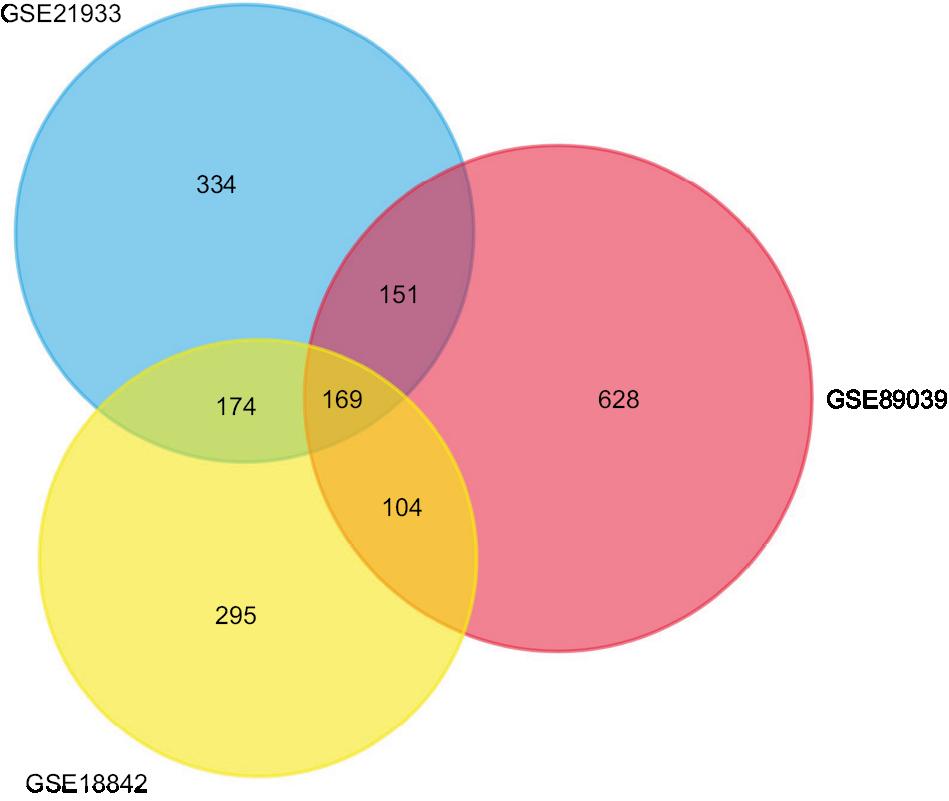 | Figure 1 Identification of DEGs in mRNA expression profiling datasets GSE18842, GSE21993, and GSE89039. Notes: The areas of overlap meant the commonly DEGs. Abbreviations: DEGs, differentially expressed genes. |
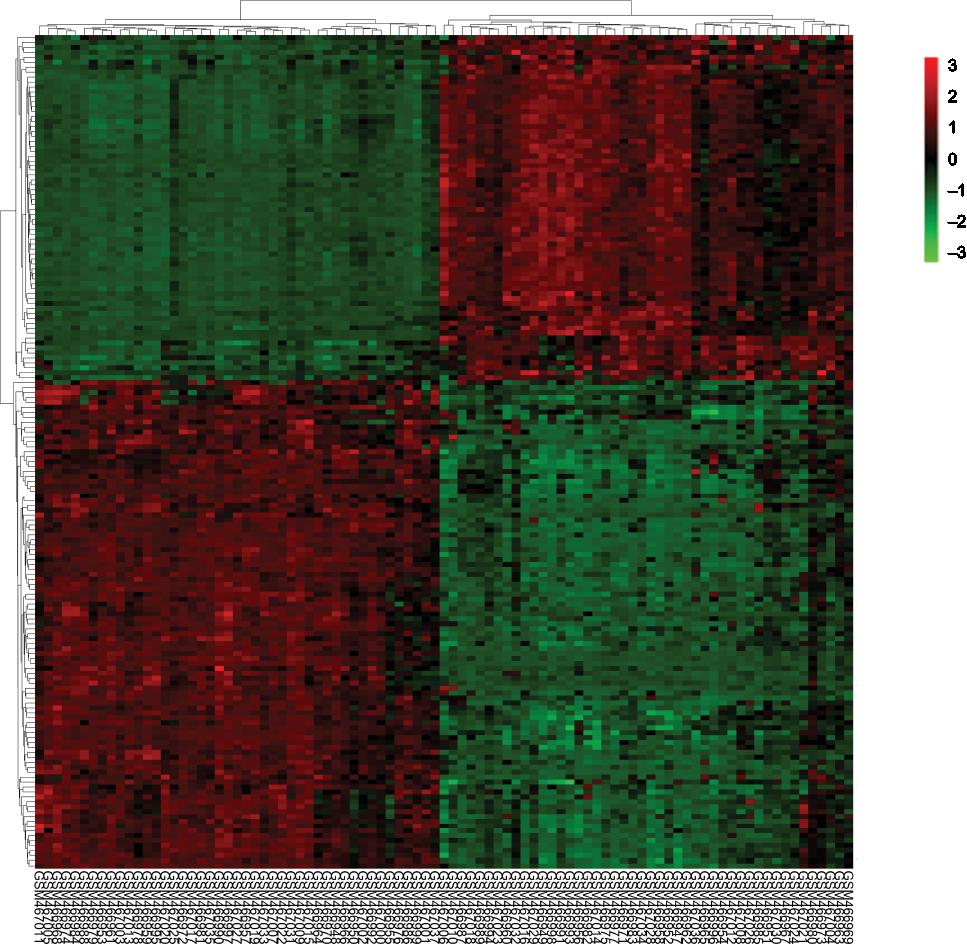 | Figure 2 Heatmap plot of the 169 overlapped DEGs between lung cancer and normal samples in dataset GSE18842. Notes: Red represents higher expression and green represents lower expression. Abbreviation: DEGs, differentially expressed genes. |
Functional and pathway enrichment analysis
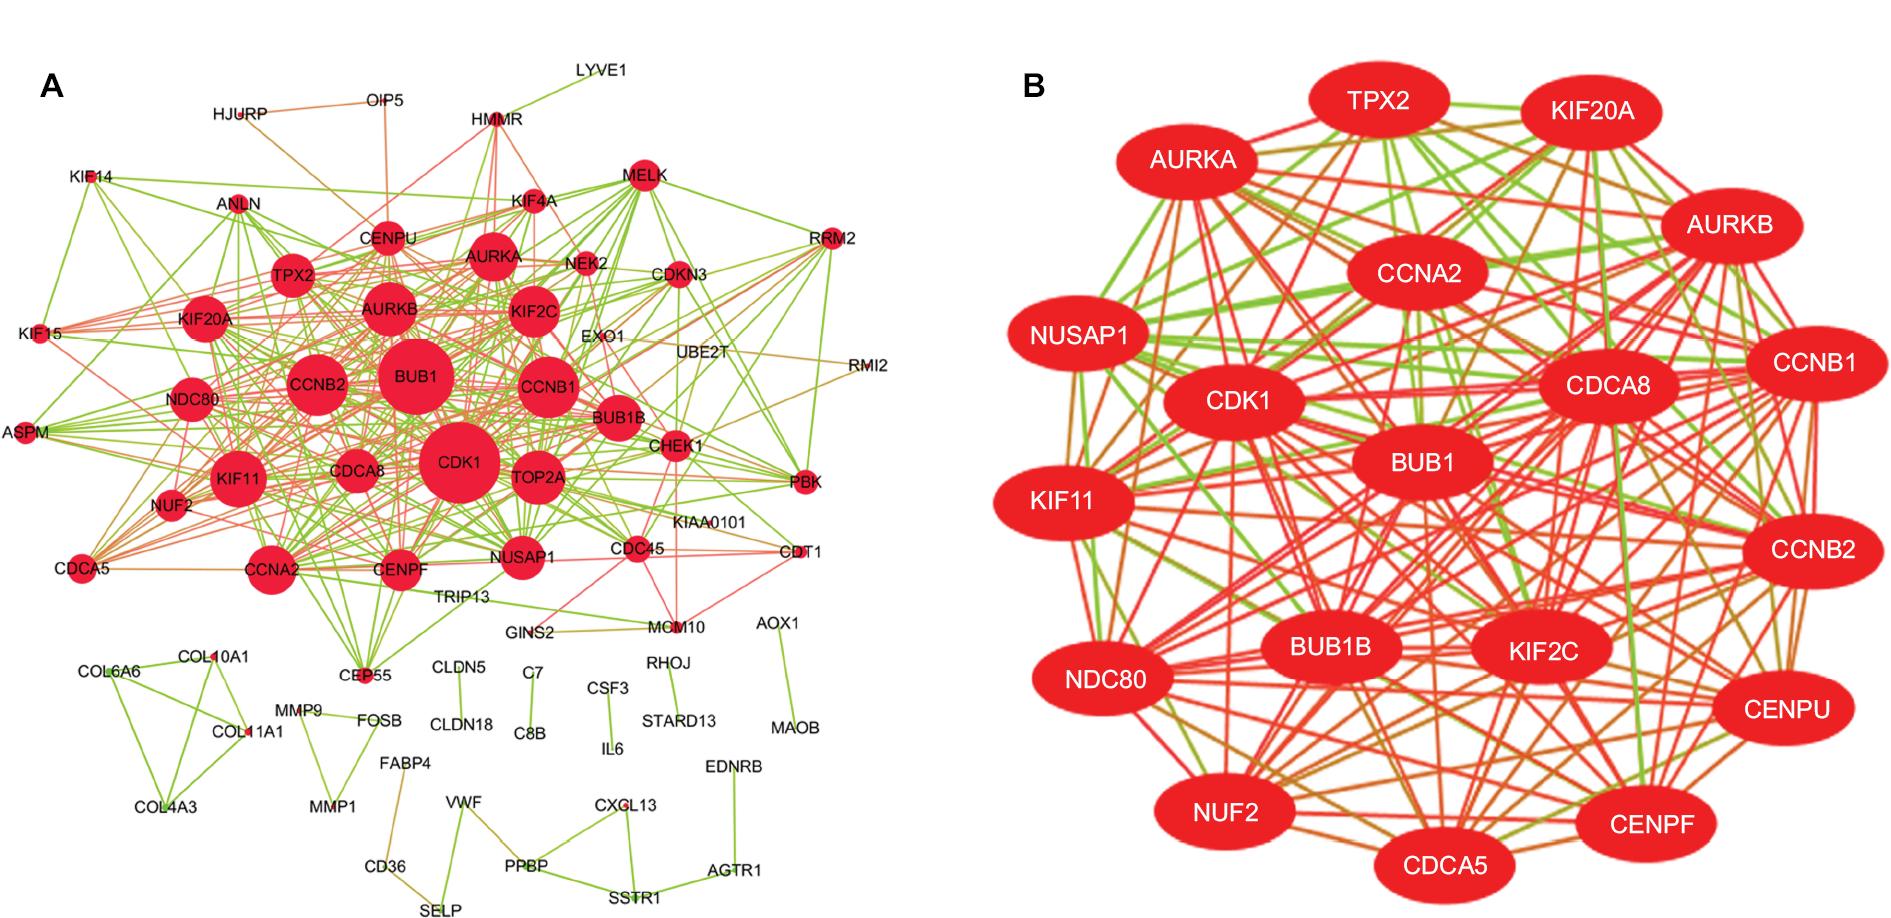
To further understand the function and mechanism of the identified DEGs, GO and KEGG enrichment analyses were performed using DAVID (Table 1). The upregulated genes were mainly associated with the BP terms mitotic nuclear division, cell division, chromosome segregation, and DNA replication, while the downregulated genes were mainly enriched in cell adhesion, inflammatory response, and immune response. Additionally, CC analysis showed that the upregulated genes were associated with chromosome, midbody, nucleoplasm, and spindle microtubule, and the downregulated genes were mainly found in the extracellular region, proteinaceous extracellular matrix, integral component of plasma membrane, membrane raft, and extracellular space. Moreover, for upregulated genes, MF terms contained ATP binding, protein binding, microtubule motor activity, protein kinase activity, and protein serine/threonine kinase activity, while the downregulated genes were relevant to heparin binding, flavin adenine dinucleotide binding, integrin binding, carbohydrate binding, and ion channel binding. DEGs, such as AURKB, KIF2C, BUB1B, CENPF, and CENPU, were discovered in the GO term analysis.
 | Table 1 Functional and pathway enrichment analysis of upregulated and downregulated genes in lung cancer Notes: If there were more than five terms enriched in this category, top five terms were selected according to P-value. Count: the number of enriched genes in each term. Abbreviations: BP, biological process; CC, cellular component; GO, Gene Ontology; KEGG, Kyoto Encyclopedia of Genes and Genomes; MF, molecular function. |
Furthermore, three KEGG pathways were significantly correlated with upregulated genes, including cell cycle, p53 pathway, and extracellular matrix (ECM)–receptor interaction, while two pathways were significantly related to the downregulated genes: PPAR pathway and tyrosine metabolism. Cell cycle-related genes, such as CCNB1, CDK1, and BUB1B, were identified in this KEGG analysis. DEGs including COL11A1, SPP1, and HMMR were identified in the ECM–receptor interaction pathway.
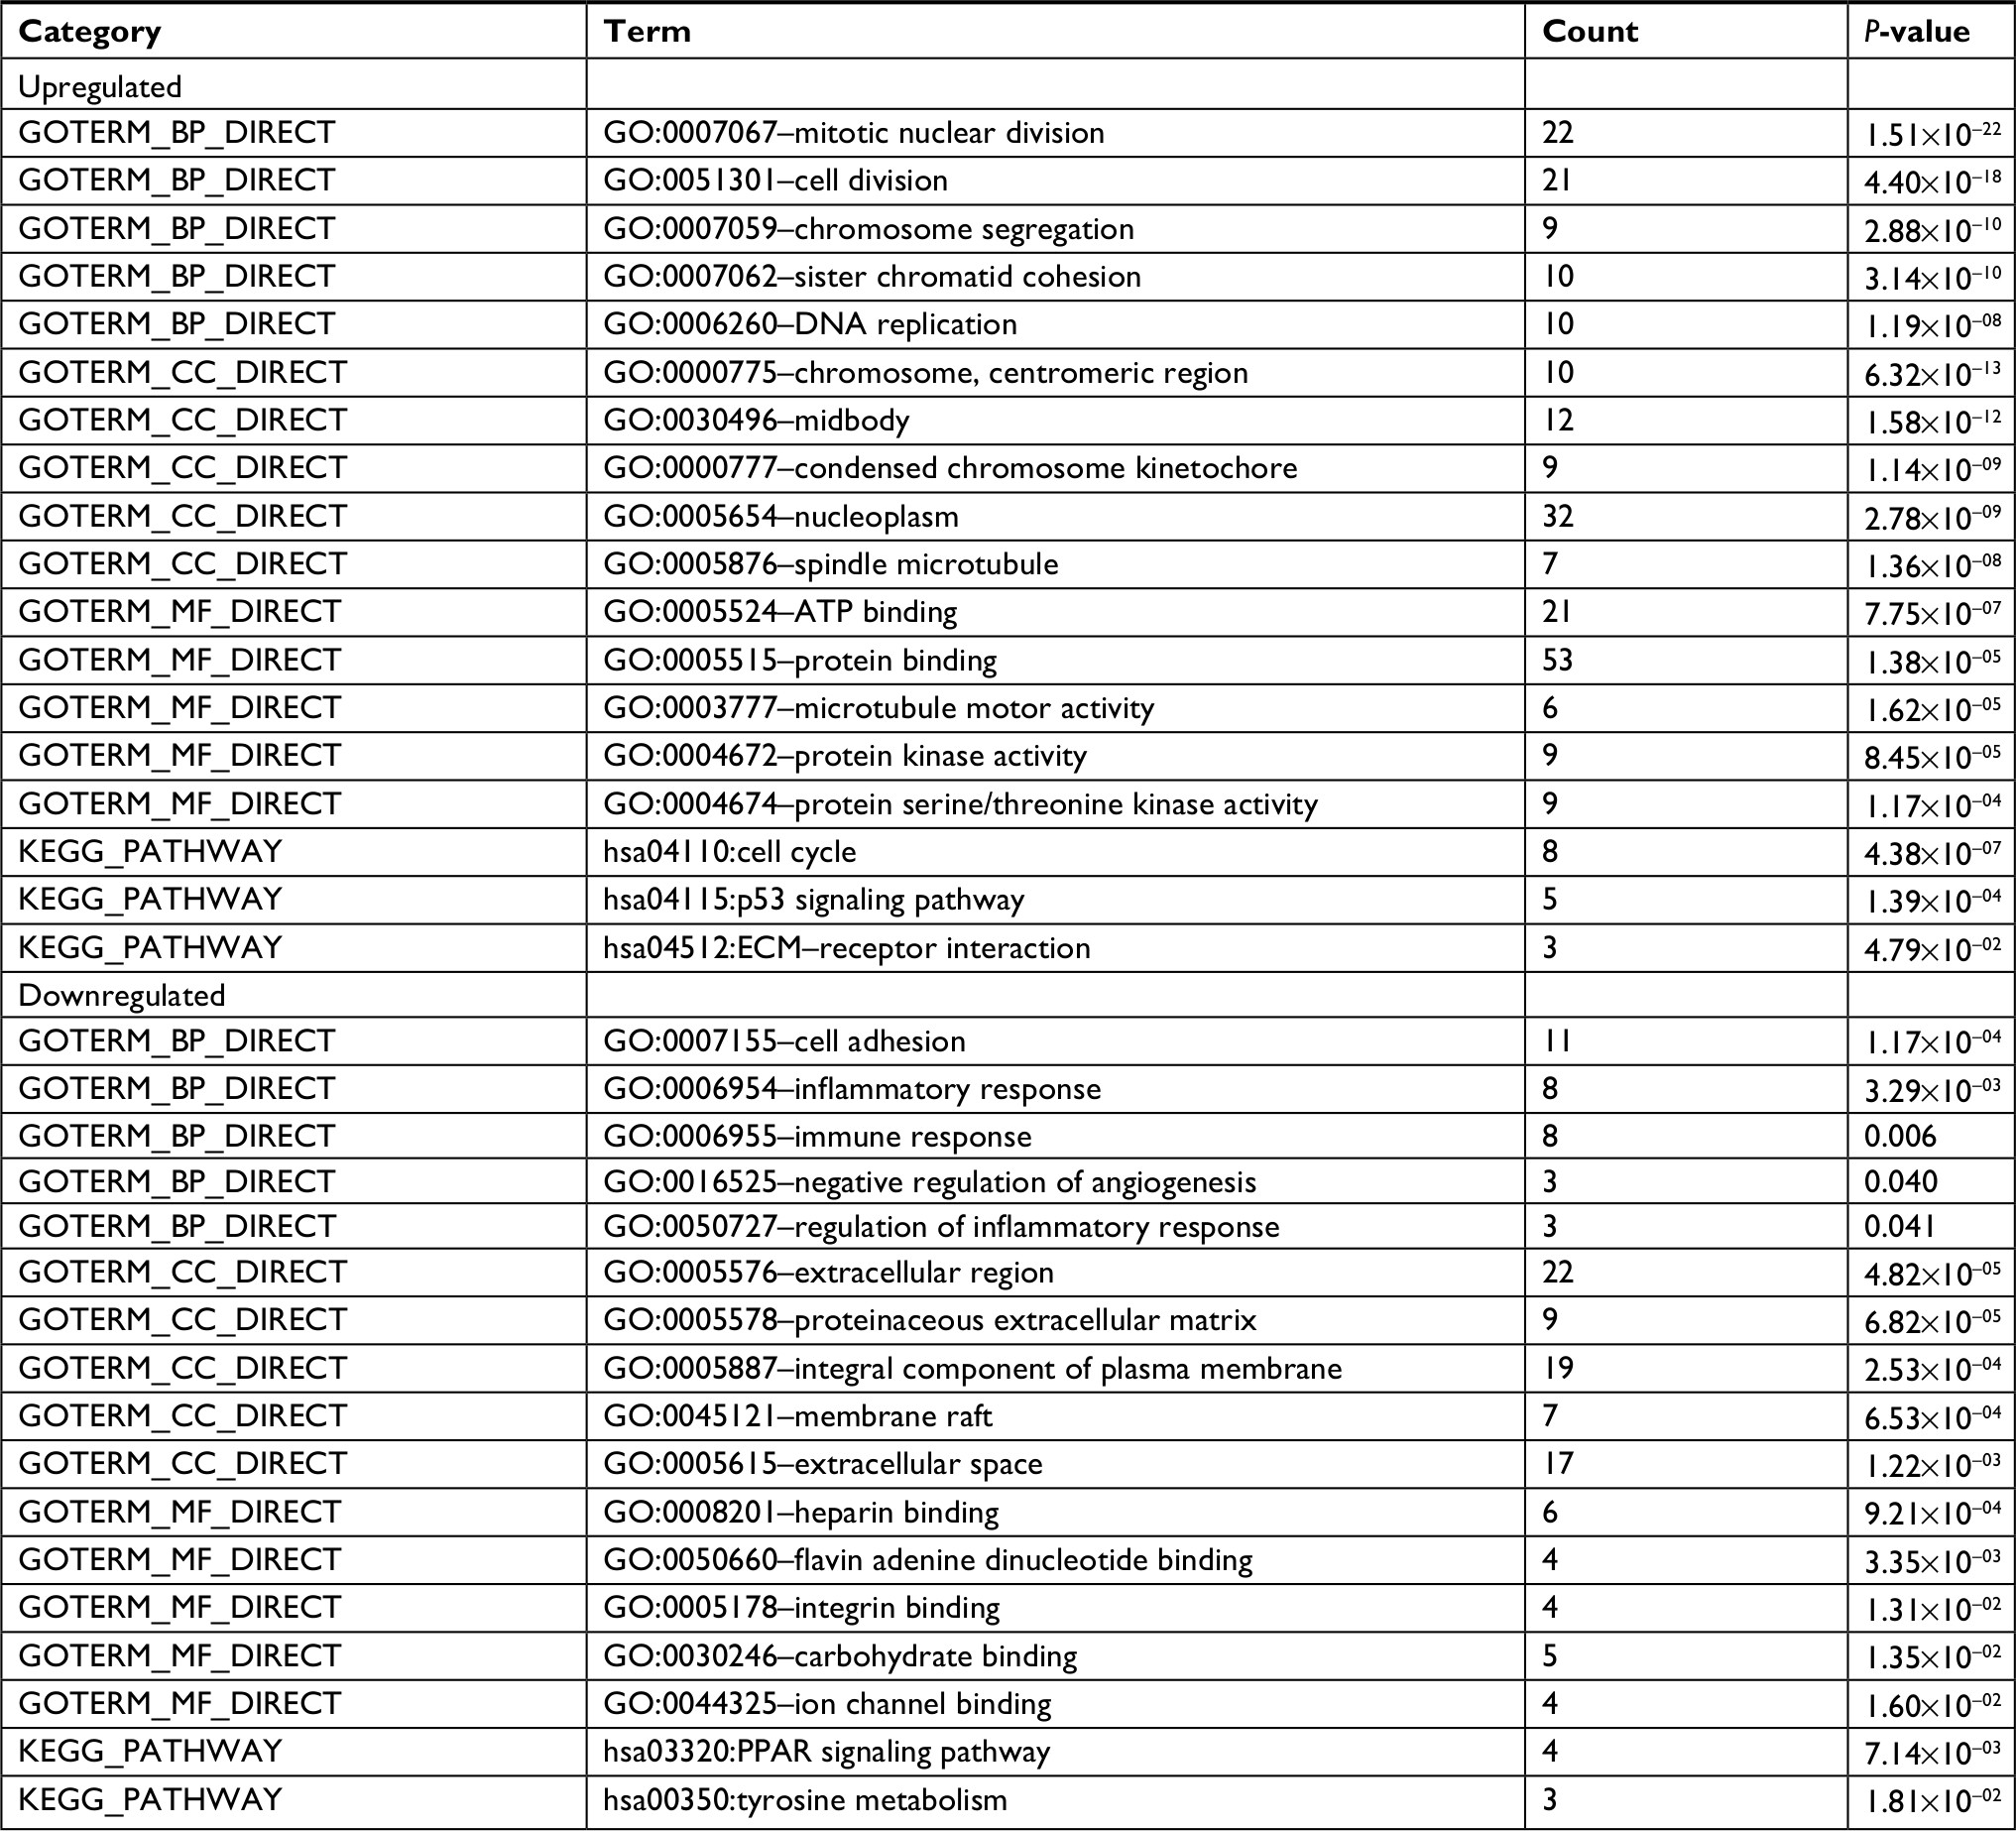
The DEG PPI network consisted of 71 nodes and 305 edges, including 49 upregulated genes and 22 downregulated genes (Figure 3A). A total of 12 hub genes were selected by the intersection of the top 30 genes from 12 algorithms using CytoHubba, including AURKB, KIF2C, NDC80, BUB1B, CDCA8, NUSAP1, CENPF, CENPU, MELK, CDKN3, PBK, and HMMR. A significant module was obtained from the DEG PPI network using MCODE, including 19 nodes and 143 edges (Figure 3B). Functional and KEGG pathway enrichment analyses revealed that genes in this module were mainly associated with cell cycle and p53 pathway (Figure 4). Furthermore, we found that AURKB, KIF2C, BUB1B, HMMR, CENPF, and CENPU were involved in the GO, KEGG, and module analyses.
 | Figure 3 (A) PPI network of DEGs, (B) A significant module selected from PPI network. Notes: (A) Red nodes stand for upregulated genes, while green nodes stand for downregulated genes. The larger the size, the greater the gene is differentially expressed between the lung cancer and normal tissue samples. (B) The red lines represent strong interaction relationship between nodes, while green lines represent weak relationship. Abbreviations: DEGs, differentially expressed genes; PPI, protein–protein interaction. |
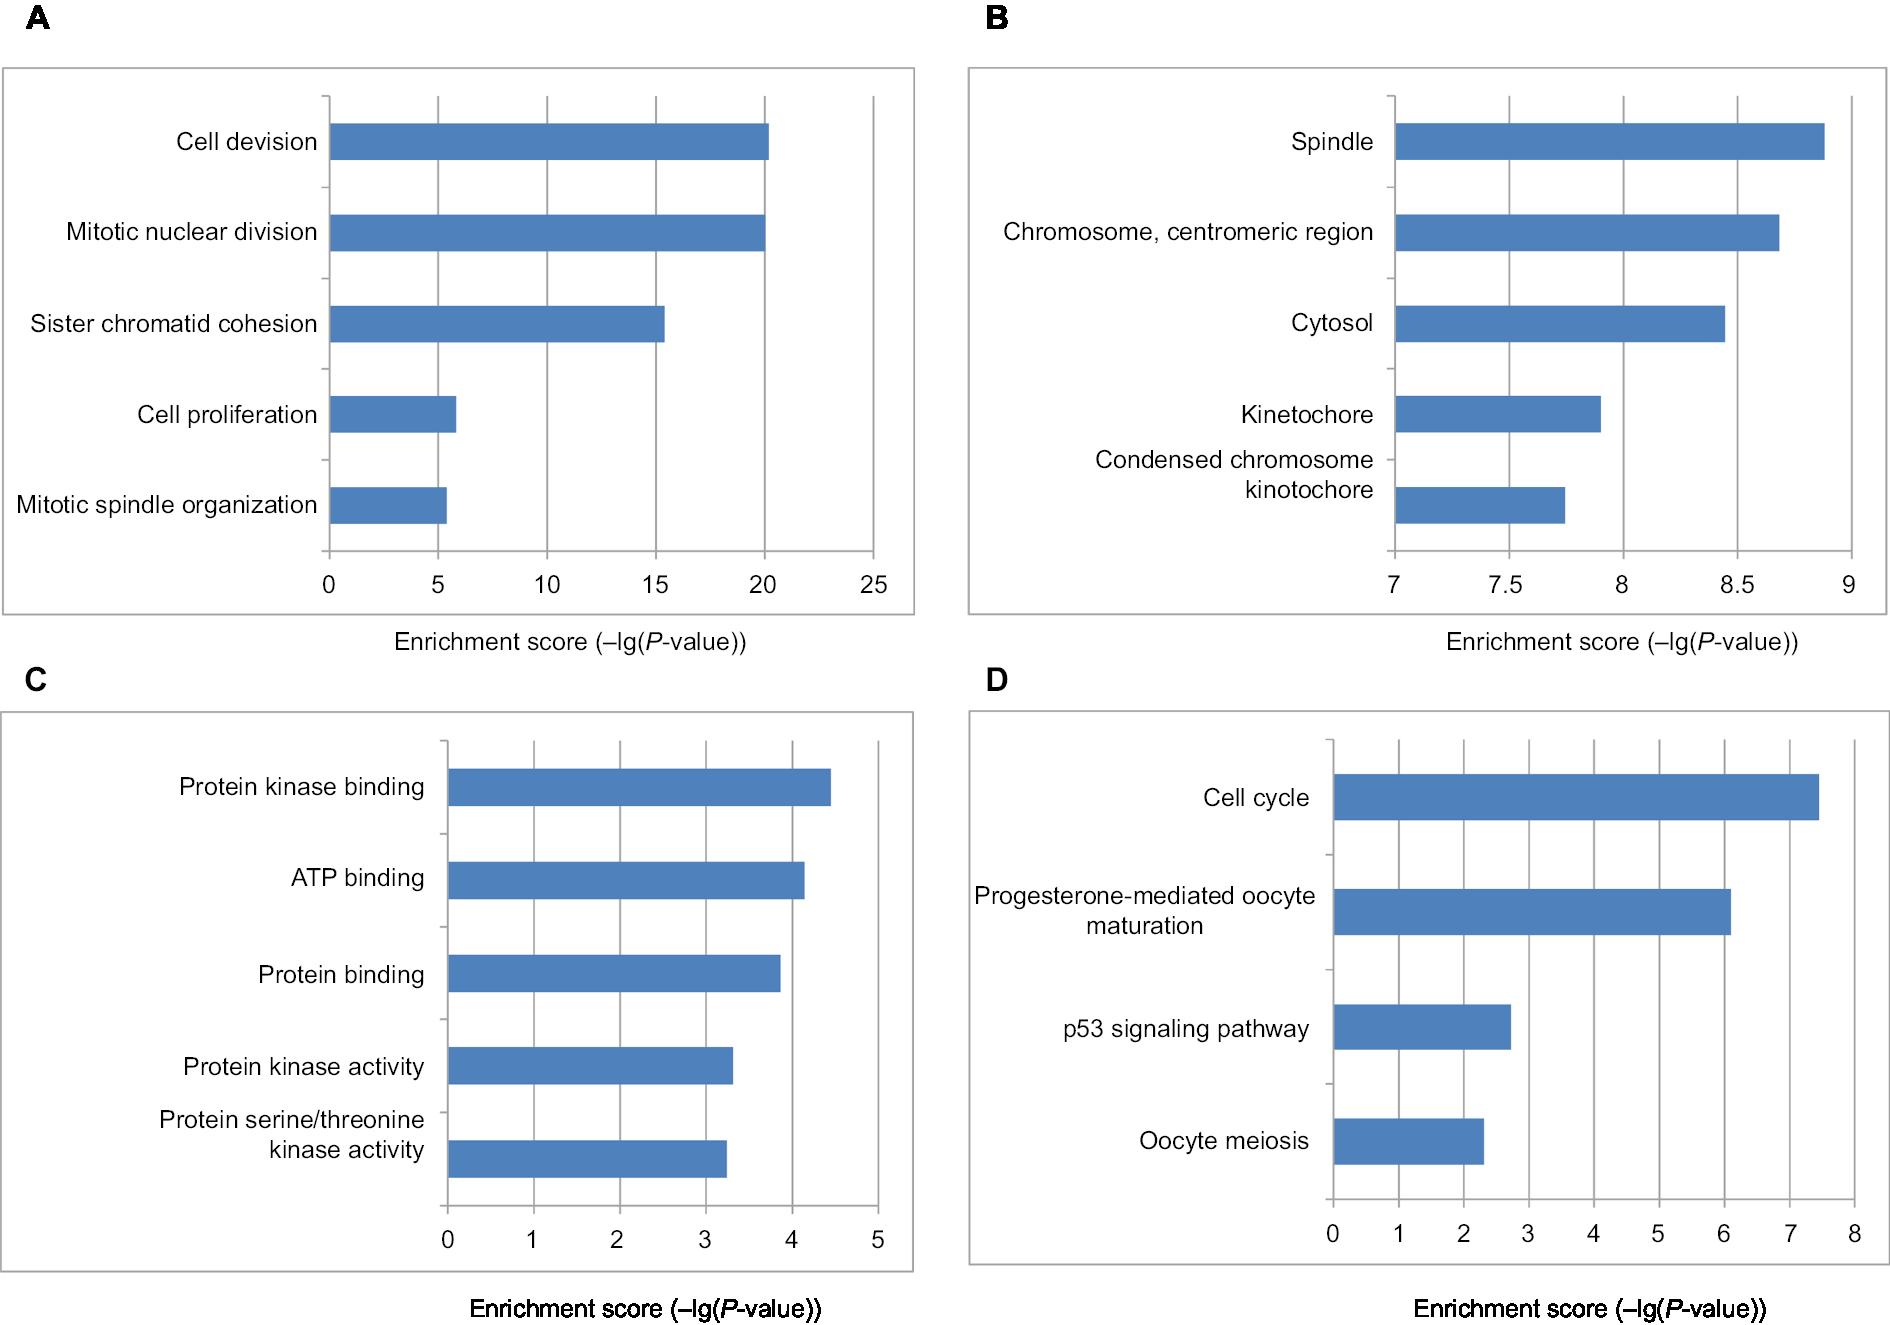 | Figure 4 The bar plot showing the enrichment scores (–log10[P-value]) of the significant enrichment GO terms and KEGG pathways in module. Notes: If there were more than five terms enriched in this category, top five terms were selected according to P-value. (A) Enrichment of BP; (B) enrichment of CC; (C) enrichment of MF; (D) KEGG pathways. Abbreviations: BP, biological process; CC, cellular component; GO, Gene Ontology; KEGG, Kyoto Encyclopedia of Genes and Genomes; MF, molecular function. |
Validation of hub genes
Hub genes were further validated using the GEPIA database. GEPIA provides box plots, violin plots based on pathological stages, dot plots, and matrix plots in the “Expression DIY” tab. Consistent with the GEO analysis, GEPIA box plots of key gene expression levels showed that six hub genes were overexpressed in lung cancer samples compared with normal tissues (Figure 5). In addition, GEPIA violin plots of gene expression by pathological stages based on the TCGA clinical annotation revealed their high expression levels significantly associated with advanced TNM stage (P-value <0.05) (Figure 6).
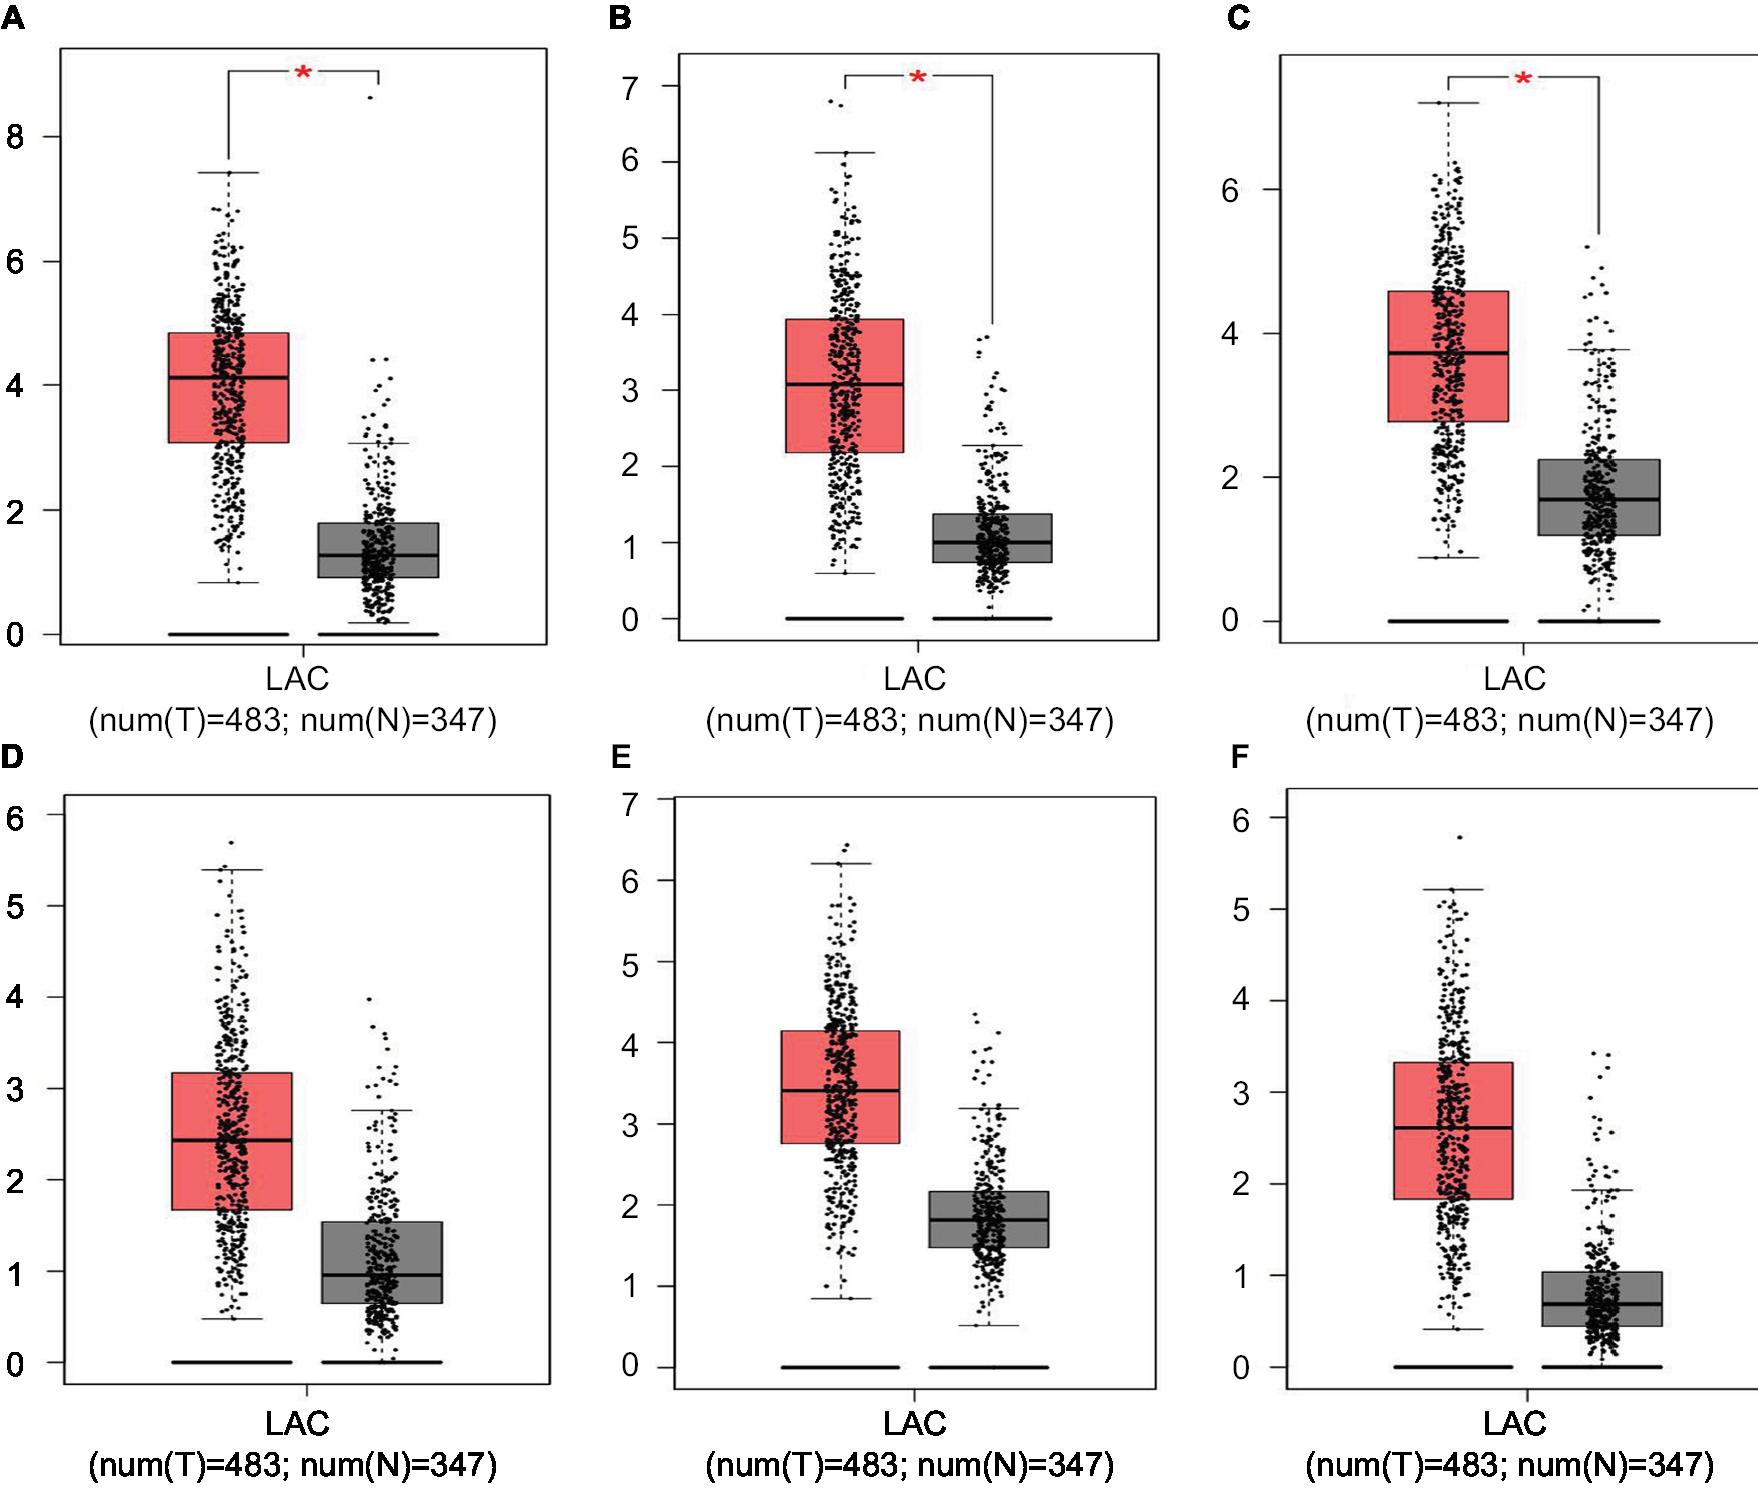 | Figure 5 GEPIA boxed plots of key genes (A) CENPF; (B) KIF2C; (C) AURKB; (D) BUB1B; (E) CENPU; (F) HMMR in human LAC and normal lungs. Notes: *P<0.05. Abbreviations: GEPIA, Gene Expression Profiling Interactive Analysis; LAC, lung adenocarcinoma. |
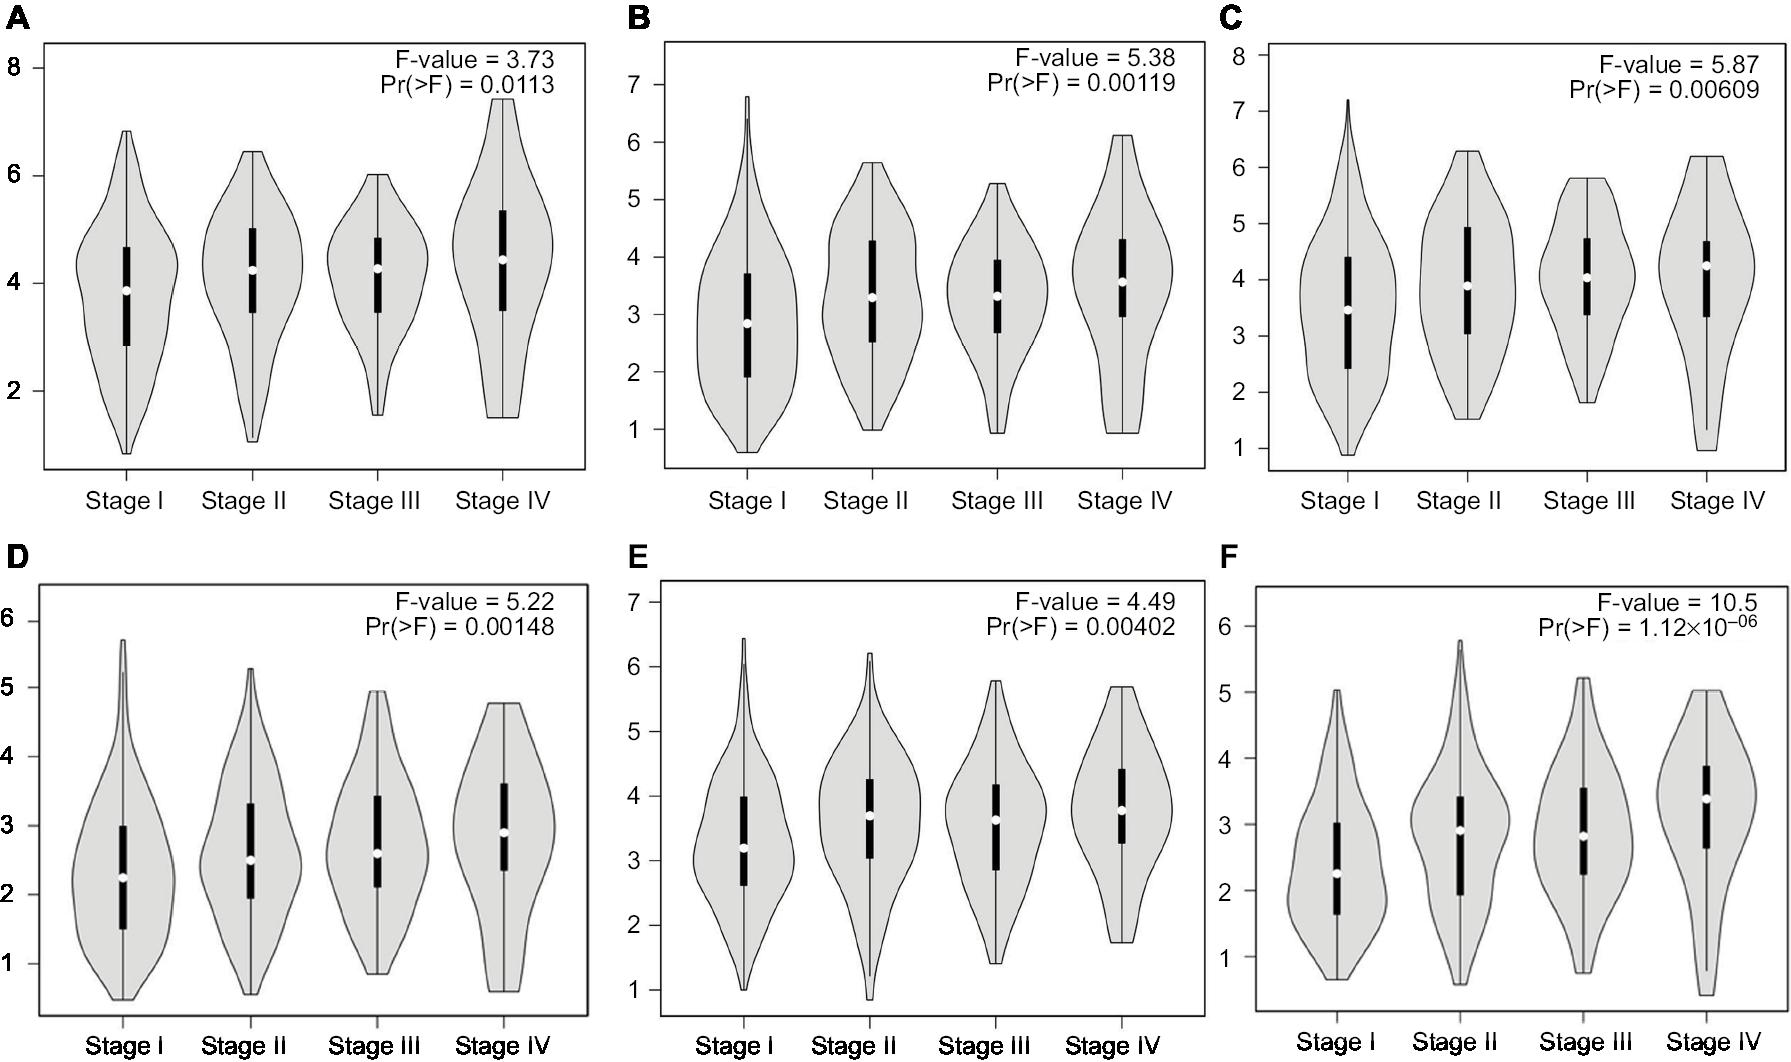 | Figure 6 GEPIA violin plots based on pathological stages (A) CENPF; (B) KIF2C; (C) AURKB; (D) BUB1B; (E) CENPU; (F) HMMR in human LAC. Abbreviations: GEPIA, Gene Expression Profiling Interactive Analysis; LAC, lung adenocarcinoma. |
Genomic alterations of hub genes
We used cBioportal tool to explore the specific alterations of hub genes in four selected lung cancer datasets with 1,662 samples. From the OncoPrint, percentages of alterations in AURKB, KIF2C, BUB1B, HMMR, CENPF, and CENPU genes among lung cancer ranged from 1.3% to 9% in individual genes (AURKB, 1.3%; KIF2C, 2.1%; BUB1B, 3%; HMMR, 1.9%; CENPF, 9%; CENPU, 4%) (Figure 7). In addition, cancer type summary analysis showed that the ratio of alteration of six genes varied from 5.45% to 21.24%, with lowest to highest level as small-cell lung cancer, lung squamous cell carcinoma, and LAC in four lung cancer datasets (Figure 8A). Further, the graphical summary of mutations showed that there were 113 CENPF nonsynonymous mutations in lung cancer samples, and 3 of them were S2021C/F in the CENPF domain (Figure 8B). There were six CENPU nonsynonymous mutations in lung cancer samples, two of them being E314K/V in the CENPU domain (Figure 8C).
 | Figure 7 Matrix heatmap shows genomic alterations of hub genes in four selected lung datasets (Pan-Lung Cancer-TCGA, Nat Genet 2016; Lung Adenocarcinoma-TCGA, Provisional; Lung Squamous Cell Carcinoma-TCGA, Provisional; Small Cell Lung Cancer, U Cologne, Nature 2015). Notes: Each row represents a gene, and each column represents a tumor sample. Red bars indicate gene amplifications, blue bars are deep deletion, green squares are missense mutation, and red bars indicate no alterations. Downloaded from cBioPortal for Cancer Genomics (http://cbioportal.org).20,60 Abbreviation: TCGA, The Cancer Genome Atlas. |
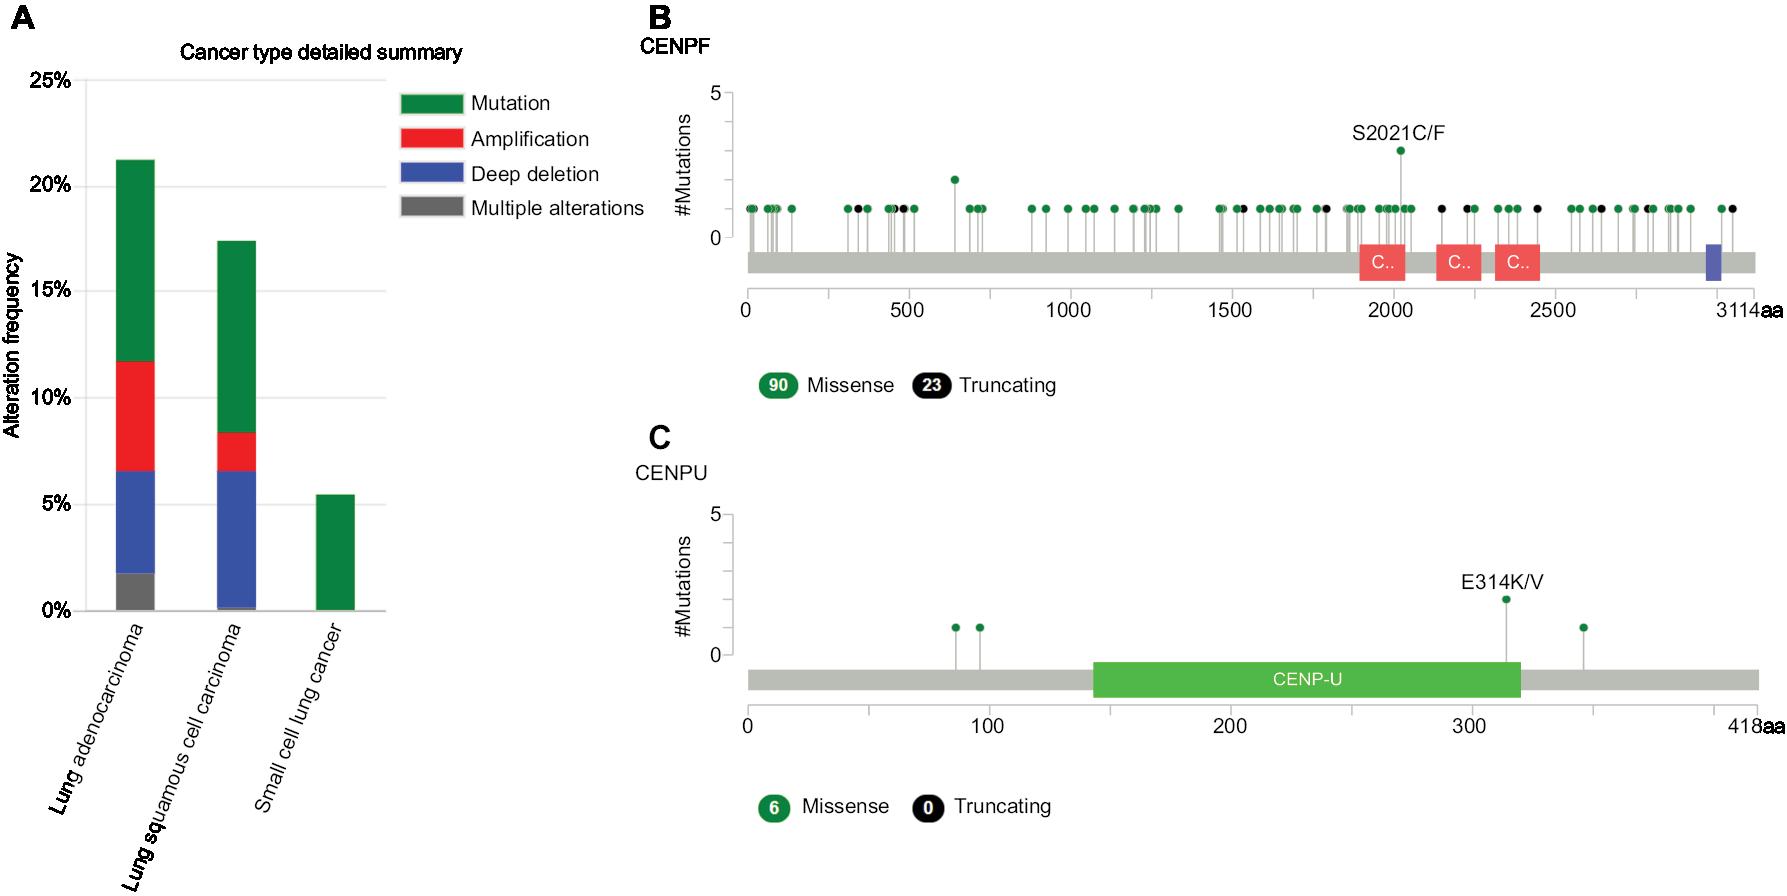 | Figure 8 The alteration frequencies of hub genes across four different cancer studies. Notes: (A) A histogram of the alteration frequencies of hub genes across four lung cancer datasets (Pan-Lung Cancer-TCGA, Nat Genet 2016; Lung Adenocarcinoma-TCGA, Provisional; Lung Squamous Cell Carcinoma-TCGA, Provisional; Small Cell Lung Cancer, U Cologne, Nature 2015). (B) Mutation diagram of CENPF in different cancer types across protein domains in lung cancer across protein domains. (C) Mutation diagram of CENPU mutations in lung cancer across protein domains. Downloaded from cBioPortal for Cancer Genomics (http://cbioportal.org).20,60 Abbreviations: CENPF, Centromere Protein; CENPU, Centromere Protein U; TCGA, The Cancer Genome Atlas. |
Survival analysis of DEGs
Finally, overall survival analysis of hub genes was performed using the Kaplan–Meier plotter online tool. The results showed that high AUARB mRNA expression (HR =1.84 [1.62–2.1], log-rank P<1×10–16) was associated with worse overall survival for lung cancer patients, as were KIF2C (HR =1.78 [1.57–2.03], log-rank P<1×10–16), BUB1B (HR =1.71 [1.5–1.94], log-rank P=2.2×10⁻¹⁶), HMMR (HR =1.44 [1.27–1.64], log-rank P=1.5×10–08), CENPF (HR =1.57 [1.38–1.78], log-rank P=3.4×10⁻¹²), and CENPU (HR =1.86 [1.58–2.21], log-rank P=1.5×10⁻¹³) (Figure 9).
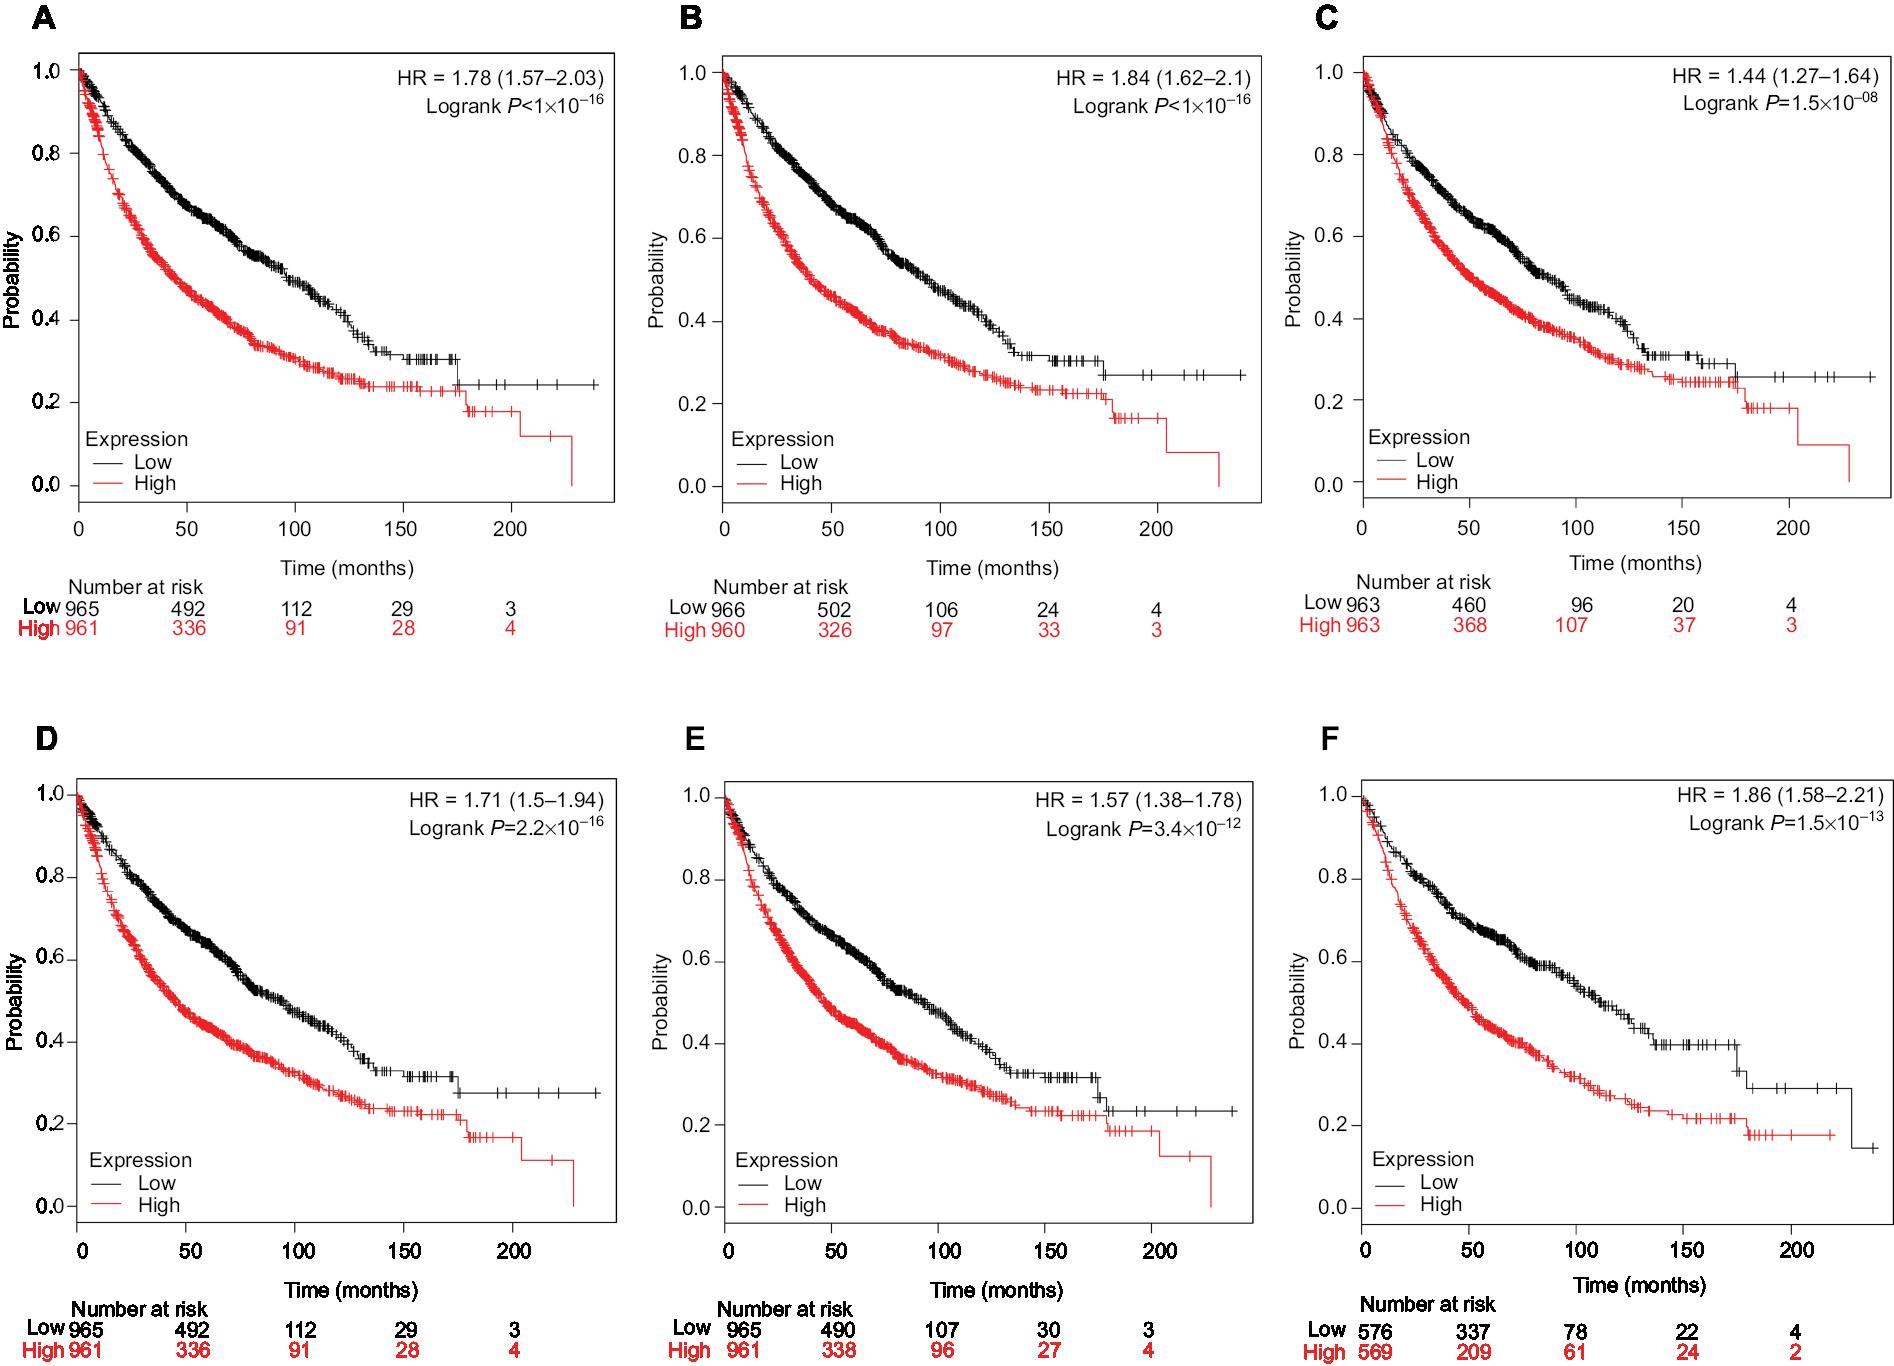 | Figure 9 Prognostic value of six key genes (A: KIF2C; B: AURKB; C: HMMR; D: BUB1B; E: CENPF; F: CENPU) in lung cancer patients from TCGA and GEO database. Notes: Log-rank test was performed to evaluate the survival differences between the two curves. Abbreviations: GEO, Gene Expression Omnibus; TCGA, The Cancer Genome Atlas. |
Discussion
In this study, we identified significant DEGs between LAC and normal samples. Furthermore, we performed a series of bioinformatics analysis to screen key genes and pathways.
A total of 169 DEGs were found, consisting of 70 upregulated genes and 99 downregulated genes. The upregulated genes were mainly enriched in cell cycle, p53 pathway, and ECM–receptor interaction, which are closely related to cancer, while the downregulated genes were mainly associated with PPAR pathway and tyrosine metabolism. Among these DEGs, the top 12 hub genes selected in the PPI network were all overexpressed. Functional and pathway enrichment analyses revealed that the 19 genes in the significant module were mainly enriched in cell cycle, progesterone-mediated oocyte maturation, p53 pathway, and oocyte meiosis.
Based on these findings, DEGs including AURKB, KIF2C, BUB1B, HMMR, CENPF, and CENPU were identified in these functions. These genes were also hub nodes in PPI networks. Then, we found the expression of six key genes in LAC were higher than in control group, and their high expression levels were significantly associated with advanced TNM stage using the GEPIA database. Furthermore, we applied cBioPortal web recourse to explore the genomic alterations of hub genes in lung cancer cases from TCGA databases. We found hub genes mutation frequencies were the highest in LAC. CENPF and CENPU have higher alteration frequency of 4% and 9%, respectively, compared with other hub genes in lung cancer samples. Two hotspot mutations (S2021C/F and E314K/V) were identified in Pfam protein domains, illustrating that these may be potential targets for lung cancer.
Finally, survival analysis of these six key genes showed that these genes were significantly associated with worse overall survival in lung cancer patients. Thus, these DEGs and their related functions may be involved in the development and progression of lung cancer.
Aurora Kinase B (AURKB) is a critical regulator of mitosis that belongs to a new family of serine/threonine kinases.22 Aurora B provides catalytic activity to the chromosome passenger complex. Overexpression of an inactive form of Aurora B results in multinucleation and polyploidy, and tetraploidy has been shown to increase the frequency of chromosomal alterations and promote tumorigenesis of p53-deficient cells. In this study, we show that AURKB upregulation was associated with poor prognosis in lung cancer. Consistently, previous studies have identified an association between AURKB expression and lung cancer progression. Hayama et al23 demonstrated that AURKB overexpression promotes lung carcinogenesis and increases invasiveness in vivo. Additionally, Takeshita et al reported that AURKB overexpression was correlated with aneuploidy and poor prognosis in NSCLC.24 Another recent study showed that AURKB was an important KRAS target in lung cancer, suggesting that AURKB inhibition could be a novel approach for KRAS-driven lung cancer therapy.25 Moreover, Al-Khafaji et al26 revealed that AURKB activity is an important modulator of taxane response in NSCLC cells. Therefore, we speculate that AURKB may play an important role in the progression of lung cancer as a regulator of mitotic spindle assembly, and thus may be a potential therapeutic target for lung cancer.
Kinesin Family Member 2C (KIF2C) also known as mitotic centromere associated kinesin, is a member of the kinesin family of microtubule motor proteins that stimulates microtubule depolymerization and ensures proper chromosome segregation during mitosis.27 The abnormal expression of KIF2C is associated with abnormal mitosis, chromosomal aberrations, and malignant transformation. Therefore, the deregulation of KIF2C expression can contribute to cancer development and progression. Previous studies have suggested that KIF2C overexpression is associated with tumor progression in esophageal squamous cell carcinoma,28 breast cancer,29 colorectal cancer,30,31 gastric cancer,32 and glioma.33 However, there is little data for KIF2C in lung cancer. Bidkhori et al34 reported that KIF2C overexpression is connected with tumor progression in LAC using an integrated genome-scale coexpression network. In this study, we found that KIF2C was involved in the GO BP terms mitotic nuclear division, cell division, and sister chromatid cohesion. It is evident that cell cycle regulatory factors play an important role in cancer development. Uncontrolled cell proliferation is common to patients with different types of cancer. KIF2C overexpression was significantly associated with poor prognosis in lung cancer patients. These observations suggest that KIF2C may be a cell cycle regulatory factor with therapeutic potential for lung cancer treatment.
BUB1 Mitotic Checkpoint Serine/Threonine Kinase B (BUB1B) is a key component of the spindle assembly checkpoint that is required for accurately segregating chromosomes based on its function in the mitotic checkpoint and the establishment of proper microtubule–kinetochore attachments.35 The function of BUB1B in mitosis includes activation, maintenance, and silencing the spindle assembly checkpoint as well as regulating chromosome–spindle attachment, and it is also required for controlling mitotic timing. Aberrant expression or mutations of BUB1B can cause aneuploidy. Several studies have revealed that BUB1B overexpression is associated with the progression and recurrence of bladder cancer,36 gastric cancer,37 breast cancer,38,39 prostate cancer,40 and other malignancies. There is currently no clear evidence for the relationship between BUB1B and lung cancer. Chen et al41 reported that BUB1B overexpression is associated with disease progression and poor survival in human LAC patients from TCGA project. In this study, we found that BUB1B was enriched in cell cycle pathway. Cell cycle dysregulation underlies the aberrant cell proliferation that characterizes cancer, and the loss of cell cycle checkpoint control promotes genetic instability. BUB1B was highly expressed in lung cancer and markedly correlated with poor prognosis in accordance with previous findings. Thus, our findings suggest that BUB1B may be a promising diagnostic and therapeutic target in lung cancer.
Hyaluronan Mediated Motility Receptor (HMMR) also known as RHAMM and IHABP, is a multifunctional protein with both intracellular and extracellular roles in cell motility and proliferation. Previous studies have indicated that HMMR expression was elevated in most human cancers, and is linked to aggressive disease and poor clinical outcomes in breast cancer,42 prostate cancer,43 bladder cancer,44 acute myeloid leukemia,45 gastric cancer,46 and cervical cancer.47 Recently, Wang et al48 reported that RHAMM expression correlates with poor prognosis and metastasis in NSCLC; Stevens et al49 revealed upregulated HMMR potentiates lung and brain metastatic outgrowths through coopting inflammatory ECM components in dissemination-competent LAC cells. Consistent with previous studies, we found that HMMR overexpression was significantly associated with poor clinical outcomes. Additionally, HMMR was enriched in the ECM–receptor interaction pathway. This evidence suggested that HMMR may play an important role in lung cancer progression.
Centromere Protein F (CENPF) is a member of the centromere protein family and plays an important role in critical chromosomal segregation processes. CENPF is dynamically expressed throughout the cell cycle. Accumulating evidence has shown that CENPF overexpression is associated with cancer progression and prognosis in prostate cancer,50 breast cancer,51 hepatocellular carcinoma,52 esophageal squamous cell carcinoma,53 and nasopharyngeal carcinoma.54 Andriani et al55 reported that lung cancers with both FHIT and p53 inactivation displayed high levels of CENPF expression. However, the oncogenic role and clinical significance of CENPF in lung cancer have not been adequately explored. In this study, we found that CENPF was associated with the GO BP terms mitotic nuclear division, cell division, chromosome segregation, and sister chromatid cohesion. Furthermore, we demonstrated that CENPF was highly expressed in lung cancer and significantly related to poor clinical outcomes, suggesting a potential role in tumorigenesis.
Centromere Protein U (CENPU), also known as MLF1IP, is a transcription suppressor that is also required for proper chromosome segregation. CENPU plays an important role in assembly of kinetochore proteins, mitotic progression, and chromosome segregation. Studies have revealed that CENPU upregulation is correlated with progression and prognosis in luminal breast cancer,56 familial colorectal cancer,57 and bladder cancer.58 Additionally, CENPU promotes prostate cancer cell proliferation and colony formation and significantly inhibits apoptosis; however, no clear change in CENPU expression has been identified.59 Moreover, no data are available regarding the oncogenic role and clinical significance of CENPU in lung cancer. In this study, we found that CENPU was associated with the GO BP term sister chromatid cohesion, and CENPU overexpression was significantly associated with poor prognosis in lung cancer. These observations suggested that CENPU abnormalities may contribute to the risk of developing lung cancer.
Conclusion
Compared with previous studies, this study identified several novel genes with prognostic value involved in LAC, such as KIF2C, CENPF and CENPU. These genes could potentially be used in the molecular diagnosis or treatment of LAC. Nevertheless, further investigations are required to establish the mechanisms of these genes in LAC.
Disclosure
The authors report no conflicts of interest in this work.
References
Siegel RL, Miller KD, Jemal A. Cancer Statistics, 2017. CA Cancer J Clin. 2017;67(1):7–30. | ||
IARC Working Group on the Evaluation of Carcinogenic Risks to Humans. Personal habits and indoor combustions. Volume 100 E. A review of human carcinogens. IARC Monogr Eval Carcinog Risks Hum. 2012;100(Pt E):1–538. | ||
Hamra GB, Guha N, Cohen A, et al. Outdoor particulate matter exposure and lung cancer: a systematic review and meta-analysis. Environ Health Perspect. 2014;122(9):906–911. | ||
Sato M, Shames DS, Gazdar AF, Minna JD. A translational view of the molecular pathogenesis of lung cancer. J Thorac Oncol. 2007;2(4):327–343. | ||
Saito M, Shiraishi K, Kunitoh H, Takenoshita S, Yokota J, Kohno T. Gene aberrations for precision medicine against lung adenocarcinoma. Cancer Sci. 2016;107(6):713–720. | ||
Xu CW, Cai XY, Shao Y, et al. A case of lung adenocarcinoma with a concurrent EGFR mutation and ALK rearrangement: A case report and literature review. Mol Med Rep. 2015;12(3):4370–4375. | ||
Pasche B, Grant SC. Non-small cell lung cancer and precision medicine: a model for the incorporation of genomic features into clinical trial design. JAMA. 2014;311(19):1975–1976. | ||
Miller KD, Siegel RL, Lin CC, et al. Cancer treatment and survivorship statistics, 2016. CA Cancer J Clin. 2016;66(4):271–289. | ||
Shi R, Zhang C, Wu Y, et al. CDCA2 promotes lung adenocarcinoma cell proliferation and predicts poor survival in lung adenocarcinoma patients. Oncotarget. 2017;8(12):19768–19779. | ||
Zhang Y, He RQ, Dang YW, et al. Comprehensive analysis of the long noncoding RNA HOXA11-AS gene interaction regulatory network in NSCLC cells. Cancer Cell Int. 2016;16:89. | ||
Li G, Gao Y, Cui Y, et al. Overexpression of CD44 is associated with the occurrence and migration of non-small cell lung cancer. Mol Med Rep. 2016;14(4):3159–3167. | ||
Camidge DR, Pao W, Sequist LV. Acquired resistance to TKIs in solid tumours: learning from lung cancer. Nat Rev Clin Oncol. 2014;11(8):473–481. | ||
Barrett T, Wilhite SE, Ledoux P, et al. NCBI GEO: archive for functional genomics data sets--update. Nucleic Acids Res. 2013;41(Database issue):D991–995. | ||
Ashburner M, Ball CA, Blake JA, et al. Gene ontology: tool for the unification of biology. The Gene Ontology Consortium. Nat Genet. 2000;25(1):25–29. | ||
Kanehisa M, Sato Y, Kawashima M, Furumichi M, Tanabe M. KEGG as a reference resource for gene and protein annotation. Nucleic Acids Res. 2016;44(D1):D457–D462. | ||
Dennis G, Sherman BT, Hosack DA, et al. DAVID: Database for Annotation, Visualization, and Integrated Discovery. Genome Biol. 2003;4(5):P3. | ||
Szklarczyk D, Franceschini A, Kuhn M, et al. The STRING database in 2011: functional interaction networks of proteins, globally integrated and scored. Nucleic Acids Res. 2011;39(Database issue):D561–D568. | ||
Smoot ME, Ono K, Ruscheinski J, Wang PL, Ideker T. Cytoscape 2.8: new features for data integration and network visualization. Bioinformatics. 2011;27(3):431–432. | ||
Chin CH, Chen SH, Wu HH, Ho CW, Ko MT, Lin CY. cytoHubba: identifying hub objects and sub-networks from complex interactome. BMC Syst Biol. 2014;8(Suppl 4):S11. | ||
Gao J, Aksoy BA, Dogrusoz U, et al. Integrative analysis of complex cancer genomics and clinical profiles using the cBioPortal. Sci Signal. 2013;6(269):pl1. | ||
Gyorffy B, Lánczky A, Szállási Z. Implementing an online tool for genome-wide validation of survival-associated biomarkers in ovarian-cancer using microarray data from 1287 patients. Endocr Relat Cancer. 2012;19(2):197–208. | ||
Goldenson B, Crispino JD. The aurora kinases in cell cycle and leukemia. Oncogene. 2015;34(5):537–545. | ||
Hayama S, Daigo Y, Yamabuki T, et al. Phosphorylation and activation of cell division cycle associated 8 by aurora kinase B plays a significant role in human lung carcinogenesis. Cancer Res. 2007;67(9):4113–4122. | ||
Takeshita M, Koga T, Takayama K, et al. Aurora-B overexpression is correlated with aneuploidy and poor prognosis in non-small cell lung cancer. Lung Cancer. 2013;80(1):85–90. | ||
dos Santos EO, Carneiro-Lobo TC, Aoki MN, Levantini E, Bassères DS. Aurora kinase targeting in lung cancer reduces KRAS-induced transformation. Mol Cancer. 2016;15:12. | ||
Al-Khafaji AS, Davies MP, Risk JM, et al. Aurora B expression modulates paclitaxel response in non-small cell lung cancer. Br J Cancer. 2017;116(5):592–599. | ||
Wordeman L, Wagenbach M, von Dassow G. MCAK facilitates chromosome movement by promoting kinetochore microtubule turnover. J Cell Biol. 2007;179(5):869–879. | ||
Duan H, Zhang X, Wang FX, et al. KIF-2C expression is correlated with poor prognosis of operable esophageal squamous cell carcinoma male patients. Oncotarget. 2016;7(49):80493–80507. | ||
Shimo A, Tanikawa C, Nishidate T, et al. Involvement of kinesin family member 2C/mitotic centromere-associated kinesin overexpression in mammary carcinogenesis. Cancer Sci. 2008;99(1):62–70. | ||
Gnjatic S, Cao Y, Reichelt U, et al. NY-CO-58/KIF2C is overexpressed in a variety of solid tumors and induces frequent T cell responses in patients with colorectal cancer. Int J Cancer. 2010;127(2):381–393. | ||
Ishikawa K, Kamohara Y, Tanaka F, et al. Mitotic centromere-associated kinesin is a novel marker for prognosis and lymph node metastasis in colorectal cancer. Br J Cancer. 2008;98(11):1824–1829. | ||
Nakamura Y, Tanaka F, Haraguchi N, et al. Clinicopathological and biological significance of mitotic centromere-associated kinesin overexpression in human gastric cancer. Br J Cancer. 2007;97(4):543–549. | ||
Bie L, Zhao G, Wang YP, Zhang B. Kinesin family member 2C (KIF2C/MCAK) is a novel marker for prognosis in human gliomas. Clin Neurol Neurosurg. 2012;114(4):356–360. | ||
Bidkhori G, Narimani Z, Hosseini Ashtiani S, Moeini A, Nowzari-Dalini A, Masoudi-Nejad A. Reconstruction of an integrated genome-scale co-expression network reveals key modules involved in lung adenocarcinoma. PLoS One. 2013;8(7):e67552. | ||
Baker DJ, Dawlaty MM, Wijshake T, et al. Increased expression of BubR1 protects against aneuploidy and cancer and extends healthy lifespan. Nat Cell Biol. 2013;15(1):96–102. | ||
Yamamoto Y, Matsuyama H, Chochi Y, et al. Overexpression of BUBR1 is associated with chromosomal instability in bladder cancer. Cancer Genet Cytogenet. 2007;174(1):42–47. | ||
Ando K, Kakeji Y, Kitao H, et al. High expression of BUBR1 is one of the factors for inducing DNA aneuploidy and progression in gastric cancer. Cancer Sci. 2010;101(3):639–645. | ||
Mansouri N, Movafagh A, Sayad A, et al. Targeting of BUB1b Gene Expression in Sentinel Lymph Node Biopsies of Invasive Breast Cancer in Iranian Female Patients. Asian Pac J Cancer Prev. 2016;17(S3):317–321. | ||
Mukherjee A, Joseph C, Craze M, Chrysanthou E, Ellis IO. The role of BUB and CDC proteins in low-grade breast cancers. Lancet. 2015;385(Suppl 1):S72. | ||
Fu X, Chen G, Cai ZD, et al. Overexpression of BUB1B contributes to progression of prostate cancer and predicts poor outcome in patients with prostate cancer. Onco Targets Ther. 2016;9:2211–2220. | ||
Chen H, Lee J, Kljavin NM, et al. Requirement for BUB1B/BUBR1 in tumor progression of lung adenocarcinoma. Genes Cancer. 2015;6(3-4):106–118. | ||
Schwertfeger KL, Cowman MK, Telmer PG, Turley EA, Mccarthy JB. Hyaluronan, Inflammation, and Breast Cancer Progression. Front Immunol. 2015;6:236. | ||
Korkes F, de Castro MG, de Cassio Zequi S, Nardi L, del Giglio A, de Lima Pompeo AC. Hyaluronan-mediated motility receptor (RHAMM) immunohistochemical expression and androgen deprivation in normal peritumoral, hyperplasic and neoplastic prostate tissue. BJU Int. 2014;113(5):822–829. | ||
Niedworok C, Kretschmer I, Röck K, et al. The impact of the receptor of hyaluronan-mediated motility (RHAMM) on human urothelial transitional cell cancer of the bladder. PLoS One. 2013;8(9):e75681. | ||
Tzankov A, Strasser U, Dirnhofer S, et al. In situ RHAMM protein expression in acute myeloid leukemia blasts suggests poor overall survival. Ann Hematol. 2011;90(8):901–909. | ||
Ishigami S, Ueno S, Nishizono Y, et al. Prognostic impact of CD168 expression in gastric cancer. BMC Cancer. 2011;11:106. | ||
Villegas-Ruíz V, Salcedo M, Zentella-Dehesa A, et al. A case of cervical cancer expressed three mRNA variant of Hyaluronan-mediated motility receptor. Int J Clin Exp Pathol. 2014;7(5):2256–2264. | ||
Wang D, Narula N, Azzopardi S, et al. Expression of the receptor for hyaluronic acid mediated motility (RHAMM) is associated with poor prognosis and metastasis in non-small cell lung carcinoma. Oncotarget. 2016;7(26):39957–39969. | ||
Stevens LE, Cheung WKC, Adua SJ, et al. Extracellular Matrix Receptor Expression in Subtypes of Lung Adenocarcinoma Potentiates Outgrowth of Micrometastases. Cancer Res. 2017;77(8):1905–1917. | ||
Zhuo YJ, Xi M, Wan YP, et al. Enhanced expression of centromere protein F predicts clinical progression and prognosis in patients with prostate cancer. Int J Mol Med. 2015;35(4):966–972. | ||
O’Brien SL, Fagan A, Fox EJ, et al. CENP-F expression is associated with poor prognosis and chromosomal instability in patients with primary breast cancer. Int J Cancer. 2007;120(7):1434–1443. | ||
Dai Y, Liu L, Zeng T, et al. Characterization of the oncogenic function of centromere protein F in hepatocellular carcinoma. Biochem Biophys Res Commun. 2013;436(4):711–718. | ||
Mi YJ, Gao J, Xie JD, et al. Prognostic relevance and therapeutic implications of centromere protein F expression in patients with esophageal squamous cell carcinoma. Dis Esophagus. 2013;26(6):636–643. | ||
Cao JY, Liu L, Chen SP, et al. Prognostic significance and therapeutic implications of centromere protein F expression in human nasopharyngeal carcinoma. Mol Cancer. 2010;9:237. | ||
Andriani F, Roz E, Caserini R, et al. Inactivation of both FHIT and p53 cooperate in deregulating proliferation-related pathways in lung cancer. J Thorac Oncol. 2012;7(4):631–642. | ||
Huang DP, Luo RC. MLF1IP is correlated with progression and prognosis in luminal breast cancer. Biochem Biophys Res Commun. 2016;477(4):923–926. | ||
Dominguez-Valentin M, Therkildsen C, Veerla S, et al. Distinct gene expression signatures in lynch syndrome and familial colorectal cancer type x. PLoS One. 2013;8(8):e71755. | ||
Wang S, Liu B, Zhang J, et al. Centromere protein U is a potential target for gene therapy of human bladder cancer. Oncol Rep. 2017;38(2):735–744. | ||
Zhang L, Ji G, Shao Y, et al. MLF1 interacting protein: a potential gene therapy target for human prostate cancer? Med Oncol. 2015;32(2):454. | ||
Cerami E, Gao J, Dogrusoz U, et al. The cBio cancer genomics portal: an open platform for exploring multidimensional cancer genomics data. Cancer Discov. 2012;2(5):401–404. |
 © 2018 The Author(s). This work is published and licensed by Dove Medical Press Limited. The
full terms of this license are available at https://www.dovepress.com/terms
and incorporate the Creative Commons Attribution
- Non Commercial (unported, 3.0) License.
By accessing the work you hereby accept the Terms. Non-commercial uses of the work are permitted
without any further permission from Dove Medical Press Limited, provided the work is properly
attributed. For permission for commercial use of this work, please see paragraphs 4.2 and 5 of our Terms.
© 2018 The Author(s). This work is published and licensed by Dove Medical Press Limited. The
full terms of this license are available at https://www.dovepress.com/terms
and incorporate the Creative Commons Attribution
- Non Commercial (unported, 3.0) License.
By accessing the work you hereby accept the Terms. Non-commercial uses of the work are permitted
without any further permission from Dove Medical Press Limited, provided the work is properly
attributed. For permission for commercial use of this work, please see paragraphs 4.2 and 5 of our Terms.