Back to Journals » International Journal of General Medicine » Volume 15
Integrated Analysis of Single-Cell RNA-seq and Bulk RNA-seq in the Identification of a Novel ceRNA Network and Key Biomarkers in Diabetic Kidney Disease
Authors Wang Y ![]() , Zhao M, Zhang Y
, Zhao M, Zhang Y
Received 14 December 2021
Accepted for publication 11 February 2022
Published 23 February 2022 Volume 2022:15 Pages 1985—2001
DOI https://doi.org/10.2147/IJGM.S351971
Checked for plagiarism Yes
Review by Single anonymous peer review
Peer reviewer comments 2
Editor who approved publication: Dr Scott Fraser
Yuejun Wang,1 Mingming Zhao,2 Yu Zhang2
1Department of Nephrology, Zhejiang Aged Care Hospital, Hangzhou Normal University, Hangzhou, Zhejiang, People’s Republic of China; 2Department of Nephrology, Xiyuan Hospital, China Academy of Chinese Medical Sciences, Beijing, People’s Republic of China
Correspondence: Yu Zhang, Tel +86 18801199545, Email [email protected]
Purpose: This study aimed to generate a competitive endogenous RNA (ceRNA) network and identify novel biomarkers for diabetic kidney disease by combining single-cell RNA-seq (scRNA-seq) and bulk RNA-seq data analysis.
Methods: Four datasets associated with diabetic nephropathy were downloaded, and their differentially expressed genes were identified. Enrichment analysis was conducted using Metascape. Next, we identified co-expressed mRNA–lncRNA pairs, analyzed subcellular lncRNA localization, and constructed a ceRNA network. Next, a specific protein–protein interaction was used to identify key biomarkers. Then, we determined the expression profiles of key biomarkers from scRNA-seq data and validated in an external independent dataset. Finally, we explored the correlations between key biomarkers and the clinical features and analyzed the drug perturbation.
Results: Thirteen cell types were identified in the scRNA-seq data, and 106 common differentially expressed genes were identified in both scRNA-seq data and bulk RNA-seq data. These genes were mainly enriched in the focal adhesion pathway of the extracellular matrix. Next, we overlapped these genes with genes predicted by differentially expressed miRNAs, identified co-expressed mRNA–lncRNA pairs and generated a ceRNA network containing 60 mRNAs, 10 miRNAs, and 5 lncRNAs. All lncRNAs were localized in the cytoplasm or cytosol. Analyses identified five key biomarkers (VCAN, TIMP1, TNC, C3 and CP); these proteins were mostly differentially expressed in fibroblasts and renal tubular cells. Furthermore, most of these proteins are associated with glomerular filtration rate, serum creatinine, and proteinuria. In total, seven potential therapeutic molecular medicines were predicted for the treatment of diabetic nephropathy.
Conclusion: In summary, we identified a novel ceRNA-network and five key biomarkers in diabetic kidney disease, which may help to elucidate the mechanisms underlying diabetic nephropathy and facilitate new treatments.
Keywords: single-cell RNA sequencing, bioinformatics, diabetic nephropathy, hub gene, inflammation
Graphical Abstract:

Introduction
Diabetic kidney disease (DKD) is the most predominant microvascular complication of diabetes, a disease that has replaced glomerulonephritis as the leading cause of chronic kidney disease.1 Early-stage DKD has no typical clinical symptoms and is difficult to diagnose; in fact, when diagnosed, most patients are already in the middle to late stages of DKD. Currently, urinary microalbumin is used as a clinical indicator for the diagnosis and progression of DKD; however, this parameter is affected by various factors, and many patients are found to undergo a range of pathological changes, including tubular atrophy and glomerular fibrosis before the onset of microalbuminuria.2 Consequently, it is important to identify novel and effective biomarkers for the early diagnosis and treatment of DKD.
Diabetic nephropathy is a microvascular complication of diabetes mellitus associated with systemic or renal inflammation.3 Clinical studies have shown that clinical features related to inflammation, such as c-reactive protein to serum albumin ratio,4 monocyte-to-lymphocyte ratio,5 serum uric acid,6,7 mean platelet volume-to-lymphocyte ratio8 and platelet distribution width,9 are significantly elevated in patients with DKD and are independent risk factors for the progression of DKD. In addition, it has been proved that a variety of inflammatory molecules are involved in the progress of DKD. For example, kidney injury molecule-1 is used as an early indicator of proximal tubular injury and is also associated with the repair of renal injury, inflammatory cell infiltration and the process of renal fibrosis.10,11 The levels of omentin-1 and neuregulin-4, which are adipokines secreted by visceral adipose tissue, are negatively correlated with the levels of pro-inflammatory factors in DKD.12,13 Therefore, inflammatory mediators are particularly important for the DKD patients as biomarkers for prognosis and potential therapeutic targets.
Recent studies have shown that non-coding RNAs (ncRNAs), including microRNAs (miRNAs) and long non-coding RNAs (lncRNAs), can play roles in DKD via different pathways, and may provide us with new insights for the development of novel therapeutics.14 lncRNA is a form of RNA that is greater than 200 nucleotides in length; these lncRNAs can regulate the expression of related genes at different levels (for example, at the epigenetic, transcriptional, and post-transcriptional levels) in various forms.15 The current literature shows that many lncRNAs are differentially expressed in the renal tissue of patients with DKD. lncRNAs can also induce a number of phenotypic changes, including cellular matrix deposition, fibrosis, and inflammatory response, through various molecular pathways, including PI3K/AKT and Erk.16 miRNAs endogenous non-coding RNAs that are approximately 20 nucleotides in length and can influence gene expression by inducing mRNA degradation and by blocking protein translation. Previous studies have shown that miRNAs can exert a significant impact on disease progression by regulating several different signaling pathways during the pathogenesis of DKD.17 In addition, lncRNA can generate elaborate and complex regulatory networks by interacting with mRNAs and miRNAs. In addition, lncRNAs can bind competitively with miRNAs and cause miRNAs to lose their regulatory effects on target genes; this is referred to as a competitive endogenous RNA (ceRNA) mechanism and has been identified as a common mechanism of lncRNAs.18
Kidney tissue contains a variety of intrinsic and interstitial cells. Previous bulk RNA-seq techniques only detected mean changes in the levels of RNA in multiple cells; however, this strategy cannot identify the unique roles of specific cells in the occurrence and development of disease. Single-cell RNA sequencing (scRNA-seq) can identify gene expression profiles at the single-cell level, thus providing insights to explore the pathogenesis of kidney diseases and discover new therapeutic targets, thus enabling the individualized and precise diagnosis and treatment of kidney diseases.19
In this study, we generated a ceRNA network and identified key biomarkers for DKD based on scRNA-seq and bulk RNA-seq data analysis. We used scRNA-seq to analyze a single-cell dataset of patients with diabetic nephropathy via the gene expression omnibus (GEO). Differentially expressed genes and corresponding functional enrichment were then identified and further combined with bulk RNA-seq data to identify differentially expressed lncRNAs (DElncRNAs), miRNAs (DEmiRNAs) and mRNAs (DEmRNAs) to construct a ceRNA network. Then, we used a protein–protein interaction (PPI) network and Molecular Complex Detection (MCODE) algorithm to identify key target genes and analyze gene expression profiles at the single cell level. Then, we performed receiver operating characteristic (ROC) analysis of the key biomarkers using an external independent dataset. Finally, we investigated the relationship between hub genes and clinical characteristics (eg, serum creatinine, glomerular filtration rate, and proteinuria), and identified potential molecular drugs that could be used therapeutically. Figure 1 shows a flowchart that describes the analytical process.
 |
Figure 1 The technology road map used in this study. |
Materials and Methods
Data Collection
Four datasets (GSE131882, GSE142025, GSE51674, GSE96804) were downloaded from the Gene Expression Omnibus (GEO) database (http://www.ncbi.nlm.nih.gov/geo/); these contained the gene expression profiles of patients with DKD and healthy controls. The scRNA-seq dataset (GSE131882) contained 23,980 single-cell transcriptomes from three control and three diabetic kidney samples.20 The bulk RNA-seq dataset (GSE142025) consisted of 27 patients with DKD and eight normal cases.21 The GSE51674 dataset, which included the microRNA (miRNA) profiles of six patients with DKD and four patients with normal kidneys, was also downloaded to allow us to construct a ceRNA network.22 The GSE96804 dataset (consisting of 40 patients with DKD and 21 control patients) was also prepared for independent external validation.23 Finally, we used the Nephroseq platform for comprehensive renal disease phenotype and genotype data for further validation and clinical investigation. Further details of the four datasets are shown in Table 1.
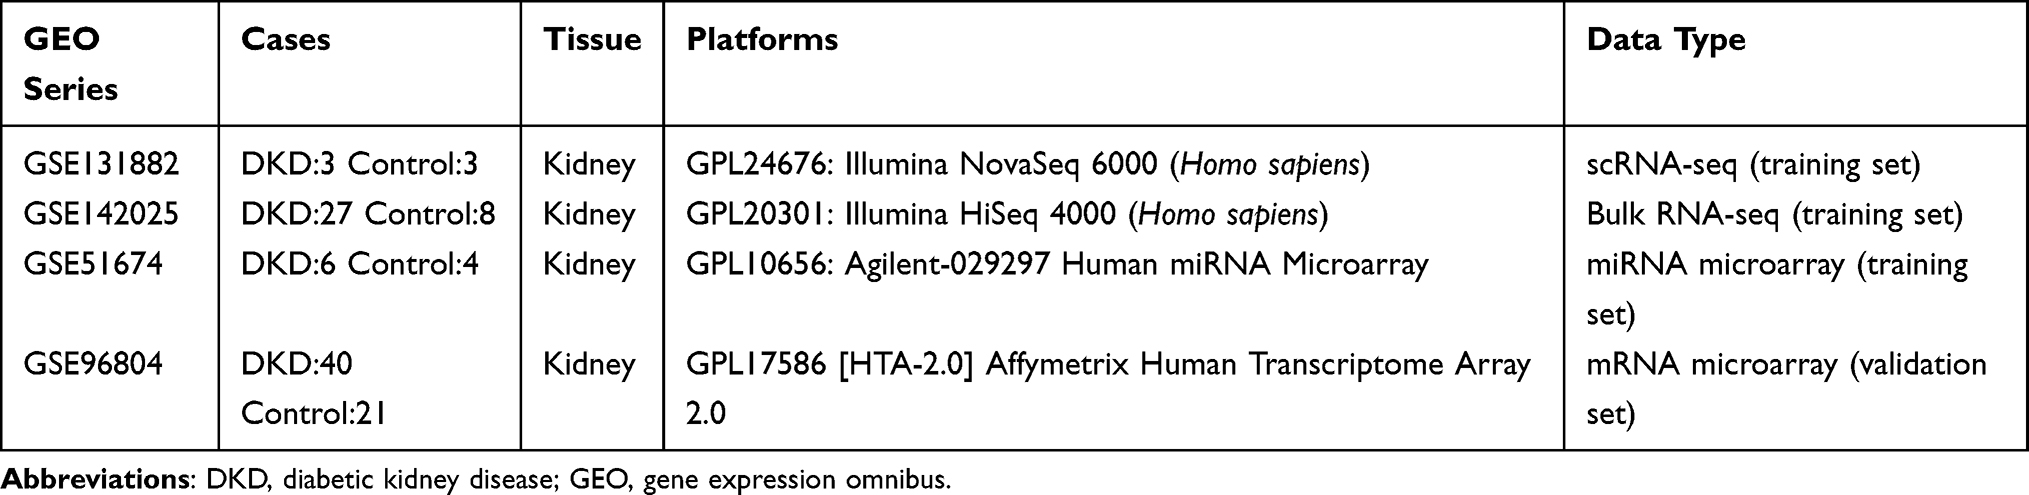 |
Table 1 Detailed Information Relating to the GEO Datasets Used in This Study |
Differentially Expressed Genes (DEGs) in scRNA-Seq and Bulk RNA-Seq Datasets
The limma package was used to determine differentially expressed mRNAs (DEmRNAs), lncRNAs (DElncRNAs) and microRNAs (DEmiRNAs) between biopsies from DKD patients and healthy controls in the bulk RNA-seq dataset.24
For scRNA-seq data, we used the Seurat package (version 4.0) in the R environment (version 4.02) to analyze cells with less than 2000 genes; in total, <10,000 transcripts were filtered.25 Following data integration, normalization, and principal component analysis (PCA), cells were then clustered using the t-distributed stochastic neighbor embedding (t-SNE) method with theresolution set to 0.5. Marker genes for clustering were identified using the FindAllMarkers function. Then, all clusters were identified as different cell types by referring to previous scRNA-seq studies relating to renal disease26 and by considering the CellMarker online database.27 Following cell-type annotation, we chose the FindMarkers function in Seurat to identify DEGs in specified cell-types for further analysis.
Functional Enrichment Analysis
To explore the unique biological significance and important pathways between DKD and control patients, we employed the Gene Ontology (GO) and The Kyoto Encyclopedia of Genes and Genomes (KEGG) analysis based on DEGs in scRNA-seq data by using Metascape website (http://metascape.org).28
ceRNA Network Construction
To better understand the relationship between the mRNAs, miRNAs, and lncRNAs, we constructed a ceRNA network for DKD. First, we imported the DEmiRNAs that we identified previously into the DIANA-LncBase v2 database (http://carolina.imis.athena-innovation.gr/diana_tools/web/index.php) to predict relationships between lncRNAs and miRNAs and acquired a set of predicted lncRNAs.29 Next, we identified miRNA-targeted mRNAs by applying the miRTarBase30 (http://mirtarbase.mbc.nctu.edu.tw/), miRDB31 (http://www.mirdb.org/), and TargetScan32 (http://www.targetscan.org/) databases. To improve the effectiveness of our analyses, we intersected the predicted mRNAs and lncRNAs with the DEmRNAs and DElncRNAs we acquired from the scRNA-seq and bulk-seq data and identified candidate mRNAs and lncRNAs that could be used to construct a ceRNA network. Based on the competitive endogenous RNA theory,33 only mRNA–lncRNA pairs that showed positive and significant correlation (R > 0.6 and p < 0.05; Pearson correlation) were selected. Furthermore, sequences of lncRNAs in the ceRNA network were obtained by the LNCipedia online tool (https://lncipedia.org/).34 Then, we uploaded sequences into the lncLocator tool35 (http://www.csbio.sjtu.edu.cn/bioinf/lncLocator/) to predict the subcellular localizations of the candidate lncRNAs. We did this because the specific functions of lncRNAs are closely related to their intracellular localization. The main location of ceRNAs is the cytoplasm or cytosol. The lncLocator can score each potential subcellular localization of lncRNAs, including exosomes, cytosol, ribosome, nucleus, and cytoplasm. Finally, we merged the co-expressed mRNA–lncRNA pairs and related miRNAs to generate a ceRNA network.
The Identification of Key Biomarkers
Next, we used the Metascape online tool to construct a protein–protein interaction (PPI) network and then determined functional enrichment by analyzing target mRNAs within the ceRNA network. The core gene modules of the PPI work were then identified as key biomarkers by the Molecular Complex Detection (MCODE) algorithm.36 The gene expression profiles of key biomarkers in the scRNA-seq data were illustrated by the FeaturePlot and VlnPlot functions in Seurat.
Independent and External Data Verification
The hub genes identified in the previous step were next verified in the GSE142025 dataset and an independent validation cohort (GSE96804). We demonstrated the differentially expressed levels of key biomarkers in DKD patients and control cases as violin plots by applying the ggplot2 tool in the R environment. Next, we used the ROCR package37 in R software to estimate the area under curve (AUC) from the receiver operating characteristic (ROC) curve; this allowed us to evaluate the capability of each selected hub gene. A larger |AUC-0.5| value indicated that a specific gene exhibited significant capability for distinguishing DKD from control samples. The diagnostic power of hub genes was then determined by analyzing the AUC values.
The Correlation Between Biomarkers and Clinical Features
To further validate the relationship between the biomarkers and the clinical features, we access the Nephroseq database (https://www.nephroseq.org/), which is a free platform for the academic and non-profit renal research community for integrative data mining of genotype/phenotype data. The database incorporates clinical data, which is often difficult to collect from public sources. We then analyzed the expression of key biomarkers and the correlation between the expression level of hub genes and three significant clinical, including the glomerular filtration rate (GFR), the proteinuria and the serum creatinine (SCr) in patients with DKD and healthy control.
Drug Perturbation Analysis
Connectivity Map (CMap) (https://portals.broadinstitute.org/cmap/) is an important database in the field of pharmacogenomic research. This database contains more than 1300 compounds and can be used to perform transcriptomic analysis of gene expression for relevant diseases, thus revealing the relationships between disease genes and potential compounds.38 The differentially expressed genes identified in the scRNA-seq and bulk RNA-seq datasets were converted into a list of corresponding probes following processing in R language and then uploaded to the CMap database to screen for potential compounds. Compounds with negative CMap score values showed a negative correlation with the uploaded disease gene expression profile, thus indicating their potential role in the treatment of diabetic nephropathy.
Statistical Analysis
In our study, R and corresponding R packages were utilized for statistical analysis. Significant differentially expressed genes between the two different groups of subjects were identified by adopting a specific threshold: a log2|fold change|>1.0 and a false discovery rate (fdr) <0.05 in GSE142025. For the GSE51674 dataset, the threshold was a log2|fold change|>1.5 and a p-value <0.001. When we chose the FindMarkers function in Seurat to identify DEGs in specified cell-types in scRNA-seq data, a log2|fold change| >0.25 and an adjusted p-value <0.05 were significantly modulated, as described in the official guideline. The mRNA–lncRNA pairs that showed positive and significant correlation (R > 0.6 and p < 0.05; Pearson correlation) were selected for further analysis. Receiver operating characteristic (ROC) curve was used to analyze the diagnosis value, including the area under the curve (AUC), sensitivity, and specificity. Unpaired t-test was used to distinguish the differences between the two groups. P < 0.05 was considered as a statistically significant difference with 2-tailed tests.
Results
DEGs Derived from scRNA-Seq Data and Functional Enrichment Analysis
The SCTransform function in the Seurat package was used to pre-process and reduce the batch effect. Cells containing less than 200 genes, and with a proportion of mitochondrial DNA-derived gene expression that exceeded 25%, were first removed; then, the remaining cells were used for subsequent analysis (Figure S1A). T-SNE was performed for non-linear dimension reduction and unsupervised clustering. Eventually, 21 clusters, and their highly variable markers, were obtained (Figures 2A, B and S1B, Table S1). Then, we manually identified 13 cell types for all clusters and subclusters in the scRNA-seq data (Figure 2C, Table 2). Following cell annotation, we identified 1209 DEGs in different cell types; of these, 511 were up-regulated genes and 698 were down-regulated (Table S2).
 |
Figure 2 The identification differentially expressed genes (DEGs) and enrichment analysis based on different cell types in the single-cell RNA-seq dataset. (A) T-SNE plot of a 21-cell cluster distribution (0–20) in the GSE131882 single-cell RNA-seq dataset. (B) Bubble plot showing the expression of highly variable gene markers in each cell cluster. (C) Thirteen cell types were identified manually by considering high variability gene markers. The top three significant GO enrichment terms (D) and the top five KEGG pathway terms (E) in up-regulated and down-regulated DEGs based on scRNA-seq data. Abbreviations: CD-ICA, collecting duct type A intercalated cell; CD-ICB, collecting duct type B intercalated cell; CT, connecting tubule cell; DCT, distal convoluted tubule cell; ENDO, endothelium cell; FIB, fibroblast cell; LEUK, leukocyte cell; LOH, loop of Henle cell; MES, mesangial cell; PCT, proximal convoluted tubule cell; PEC, parietal epithelial cell; PODO, podocyte cell; PST, proximal straight tubule cell; t-SNE, t-distributed stochastic neighbor embedding; GO, gene ontology; KEGG, the Kyoto encyclopedia of genes and genomes. |
To further investigate the functionality of the DEGs based on scRNA-seq data, we next conducted GO and KEGG analyses. As shown in Figure 2D and Table S3, GO analysis showed that the up-regulated DEGs were associated with cell adhesion in the biological process (BP) term, plasma membrane and extracellular matrix in the cellular component (CC) term, and ion channel binding and extracellular matrix structural constituent in the molecular function (MF) term. KEGG pathway analysis revealed that the DEGs were mainly enriched in focal adhesion, cell adhesion molecules and the calcium signaling pathway (Figure 2E, Table S3). However, the down-regulated DEGs were mainly enriched in urogenital system development and kidney development in BP, the apical parts of cells and collagen-containing extracellular matrix in CC, and metal ion transmembrane transporter activity in MF (Figure 2D, Table S3). KEGG pathway analysis showed that these DEGs might affect mineral absorption, the calcium signaling pathway, and the AGE-RAGE signaling pathway in diabetic complications (Figure 2E, Table S3).
The Prediction of miRNA–mRNA and lncRNA–miRNA Pairs
Within the GSE142025 RNA-seq dataset, a total of 1161 DEGs were obtained, including mRNAs and lncRNAs (Figure 3A and B, Table S4). There were 53 DEmiRNAs in the GSE51674 dataset (Figure 3C and D, Table S5). Furthermore, we intersected up- and down-regulated DEGs in the scRNA-seq and RNA-seq datasets, respectively. Then, we identified 35 intersecting (common) up-regulated DEGs (Figure 3E) and 71 down-regulated DEGs (Figure 3F). When these were combined, we identified 106 common DEGs for further analysis. We also performed miRNA–mRNA prediction with the DEmiRNAs we acquired previously using the miRTarBase, miRDB, and TargetScan databases; this allowed us to acquire 15,119 target mRNAs. When these data were combined with 106 candidate DEGs, we identified 72 candidate mRNAs (Figure 3G). In addition, application of the DIANA-LncBase v2 database allowed the identification of 526 lncRNA–miRNA pairs; five candidate lncRNAs were then identified to construct the ceRNA network (Figure 3H).
 |
Figure 3 DEGs in the bulk RNA-seq dataset and the identification of co-expressed lncRNA–mRNA pairs. (A) Volcano map showing DEGs in the GSE142025 dataset. Blue dots represent downregulated genes and red dots represent upregulated genes. (B) Heatmap demonstrating DEGs in the GSE142025 dataset. (C) DEmiRNAs in the GSE51674 dataset were plotted as volcano plots with different colors, including downregulated (blue) and upregulated (red) genes. (D) Heatmap illustrating DEmiRNAs in the GSE51674 dataset. (E) Venn diagram showing that there were 35 intersected up-regulated DEGs in the scRNA-seq and bulk RNA-seq dataset. (F) Venn diagram showing that there were 71 down-regulated DEGs overlapping in these two datasets. Candidate mRNAs (G) and lncRNAs (H) obtained by the intersection of predicted genes and merged DEGs. (I) Co-expression mRNA–lncRNA pairs (R>0.6 and p<0.05) were selected by Pearson correlation. (*p<0.05; **p<0.01; the red color represents a positive correlation between lncRNAs and mRNAs; the blue color indicates a negative correlation.). |
The Identification of lncRNA–mRNA Pairs and ceRNA Network Construction
Based on the 72 candidate mRNAs and 5 lncRNAs identified previously, we obtained 125 co-expressed mRNA–lncRNA pairs according to the competitive endogenous RNA theory (Figure 3I, Table S6). After merging the miRNA–mRNA and lncRNA–miRNA pairs, we constructed a ceRNA network that featured 60 mRNAs, 10 miRNAs, and 5 lncRNAs (Figure 4A). Prediction analysis of subcellular localization showed that all five lncRNAs exhibited the highest score in the cytoplasm or cytosol, thus indicating that they exerted biological function in ceRNA network (Figure 4B).
 |
Figure 4 Construction of a ceRNA network and the identification of hub genes. (A) The competitive endogenous RNA network contained 60 mRNAs (green circles), 10 miRNAs (red squares), and 5 lncRNAs (yellow circles). (B) Histogram depicting the subcellular locations of lncRNAs. (C) Bar graph demonstrating the functional enrichment of mRNAs in the ceRNA network. (D) Protein–protein interaction (PPI) network composed of 15 mRNAs. (E) Hub genes obtained by the Molecular Complex Detection (MCODE) algorithm. |
PPI Network Construction and the Identification of Hub Genes
mRNAs from the ceRNA network were imported into Metascape so that we could investigate functional enrichment and generated a PPI network containing 15 mRNAs. Biological enrichment was observed in the NABA CORE MATRISOME (a curated gene set encoding the core extracellular matrix including glycoproteins, collagens, and proteoglycans) and primary focal segmental glomerulosclerosis (Figure 4C). The MCODE algorithm identified five hub genes (VCAN, TIMP1, TNC, C3 and CP) (Figure 4D and E).
The Expression of Hub Genes in scRNA-Seq and Bulk RNA-Seq Data
The FeaturePlot function in Seurat was used to demonstrate the expression profiles of hub lncRNAs (Figure 5A–E) and mRNAs (Figure 5F–J) in the scRNA-seq data. The VlnPlot function was applied to illustrate gene expression levels in the DKD and control groups. However, only statistically significant results arising from this analysis are shown. Of the lncRNAs within the ceRNA network, TEX41 was highly expressed in collecting duct type A intercalated cells and proximal straight tubule (PST) cells, while lower levels were evident in the podocyte cells of patients with DKD (Figure 5K). In the DKD group, DRAIC and LINC00639 were expressed at high levels in leukocytes (LEUK) (Figure 5L) and endothelial (ENDO) cells (Figure 5M), respectively. WT1-AS was expressed at high levels in fibroblast (FIB) cells in the control group (Figure 5N). MSC-AS1 was highly expressed in FIB cells in the DKD group (Figure 5O).
 |
Figure 5 Expression profile of key biomarkers in the scRNA-seq data. Distribution diagram showing the expression profile of lncRNAs (A–E) and mRNAs (F–J) in the DKD kidney scRNA-seq dataset. A Violin plot was used to illustrate the differential expression of lncRNAs (K–O) and mRNAs (P–T) in DKD and control groups in the scRNA-seq data. (*p<0.05; **p<0.01; *** p<0.001, compared DKD and control group). |
With regard to mRNAs, VCAN was expressed at high levels in the FIB cells of DKD patients (Figure 5P). TNC showed high expression levels in mesangial cells and proximal straight tubule cells in patients with DKD but lower levels in parietal epithelial cells (Figure 5Q). However, C3 was expressed at low levels in fibroblast cells and at high levels in the parietal epithelial cells of DKD patients (Figure 5R). CP was only found in the FIB cells of DKD patients and was expressed at high levels Figure 5S). In addition, TIMP1 was expressed at high levels in mesangial cells but lower levels in fibroblast cells from DKD patients (Figure 5T).
After investigating hub mRNAs and lncRNAs in the bulk RNA-seq data, we used a violin plot to demonstrate expression levels and used ROC curves to indicate the ability of these hub factors to distinguish between DKD patients and normal cases in the GSE142025 dataset. Results showed that LINC00639 and MSC-AS1 were expressed at significantly higher expression levels in kidney samples from DKD patients than normal controls. Furthermore, WT1-AS, TEX41 and DRAIC were expressed at significantly higher levels in control cases (Figure 6A). However, all mRNA markers, including VCAN, TIMP1, TNC, C3 and CP, showed considerably higher expression levels in the kidneys of patients with DKD (Figure 6B).
 |
Figure 6 The expression profiles of hub genes in the bulk RNA-seq dataset and validation in an external and independent dataset. Differential expression of key lncRNAs (A) and mRNAs (B) in the disease and control groups of the bulk RNA-seq data (GSE142025). In the external independent dataset GSE96804, violin plots were used to demonstrate the differential expression of key lncRNAs (C) and mRNAs (D) in the DKD and control groups. The receiver operating characteristic curve of key lncRNAs (E) and mRNAs (F) in the GSE142025 dataset. Performance of the key lncRNAs (G) and mRNAs (H) in the GSE96804 dataset, as reflected by their receiver operating characteristic curves. (**p<0.01; ***p<0.001, compared DKD and control group). |
Validation in an Independent External Dataset
We downloaded GSE96804 as an independent dataset to verify the lncRNAs and hub mRNAs that were included in the ceRNA network. For the lncRNAs, the gene expression profiles of MSC-AS1, WT1-AS and DRAIC are consistent with the GSE142025 dataset. However, TEX41 was not detected in the GSE96804 dataset; there was no statistical difference in the levels of LINC00639 when compared between DKD and control cases (Figure 6C). With regard to the hub mRNAs, VCAN, TNC, C3 and CP showed high expression levels; the levels of TIMP1 were significantly different when compared between the DKD and control groups (Figure 6D). Furthermore, ROC curve analysis illustrated that all lncRNAs and key biomarkers had large AUC values, thus indicating that they had the potential predictive ability to discriminate between DKD and normal cases (Figure 6E–H).
The Association Between Key Biomarkers and Clinical Characters
Next, we used the Nephroseq platform to explore the relationship between key biomarkers and clinical significance. Violin plots showed that VCAN, TIMP1, TNC, C3 and CP were highly expressed in patients with DKD and were negatively correlated with GFR (R=−0.87 and p=1.1e-07 for VCAN; R=−0.87 and p=1.2e-07 for TNC; R=−0.84 and p=8.9e-07 for C3; R=−0.58 and p=6.3e-05 for CP; R=−0.85 and p=5.4e-07 for TIMP; Figure 7B, F, J, N, R, respectively).
 |
Figure 7 Correlation between key genes and clinical features. Based on a clinical database, we used violin plots to demonstrate differential expression profiles of VCAN (A), TNC (E), C3 (I), CP (M), and TIMP1 (Q) in normal subjects and patients with diabetic kidney disease. Scatter diagram showing that the levels of VCAN (B), TNC (F), C3 (J), CP (N), TIMP1 (R) were negatively associated with the levels of GFR. The association between serum creatinine and the expression of VCAN (C), TNC (G), C3 (K), CP (O), and TIMP1 (S). The relationships of proteinuria and the expression of VCAN (D), TNC (H), C3 (L), CP (P), and TIMP1 (T) are displayed by scatter diagrams. |
Serum creatinine (SCr) is used for the measurement of renal function. We found that all key biomarkers except CP had positively correlation with SCr (R = 0.67 and p = 0.0032 in VCAN, R = 0.73 and p = 0.011 in TNC, R = 0.79, and p = 0.00018 in C3, R = 0.58 and p = 0.015 in TIMP1) (Figure 7C, G, K, O, S).
The evaluation of proteinuria is used as an indicator for the progression of kidney disease. We found that the higher the expression levels of VCAN and C3, the higher the degree of proteinuria would occur in patients with DKD (R = 0.78 and p = 0.0043 for VCAN; R = 0.54 and p = 0.085 for C3) (Figure 7D and L). However, there was not statistically association detected for other gene markers (R = 0.31 and p = 0.35 for TNC; R = 0.23 and p = 0.49 for CP; R = 0.6 and p = 0.053 for TIMP1) (Figure 7H, P, T).
Drug Prediction
The enrichment scores for CMap ranged from −1 to 1. A positive score indicated that a drug was positively associated with disease progression, while a negative score indicated that a drug inhibited disease progression; a higher absolute value indicated a higher correlation with disease. A list of processed differential gene probes was submitted to the CMap database, and seven negatively correlated compounds with p < 0.01 were identified. Their two-dimensional (2D) structures were obtained from ChemSpider (http://www.chemspider.com/), an open-access platform for chemical research (Table 3).
 |
Table 2 Identification of Cell Types in scRNA-Seq Data via Highly Variable Markers |
 |
Table 3 Perturbation Analysis of Therapeutic Molecular Compounds (p<0.01) |
Discussion
In this study, we identified thirteen cell types in DKD kidney samples, thus indicating the heterogeneity and complexity of kidney tissue. Using the Seurat package in R, we screened the DEGs in every cell type, and finally identified 511 up-regulated genes and 698 down-regulated genes. Functional enrichment analysis further showed that these genes were mainly enriched in the plasma membrane and extracellular matrix, and were primarily involved in the cell adhesion biological process.
Previous studies have shown that cell adhesion plays a vital role in a number of pathological processes, including the recirculation and movement of leukocytes,39 cell differentiation,40 and the activation of and communication between immune cells.41 Furthermore, changes in the levels of adhesion molecules and cytokines have been detected in diabetic nephropathy and reported to represent vital mediators of injury in several types of glomerulonephritis and tubulo-interstitial nephritis, thus underscoring their diagnostic roles in this renal microvascular complication.42,43 A total of 77 DEGs, including 72 mRNAs and 5 lncRNAs, were shown to be associated with DKD and selected from the intersection of scRNA-seq and bulk RNA-seq data and predicted genes. According to the ceRNA hypothesis, we selected co-expressed lncRNA–mRNA pairs and lncRNAs that were located in the cytoplasm or cytosol of the cell. Finally, we constructed a ceRNA network that featured 60 mRNAs, 5 lncRNAs and 10 miRNAs, thus providing us with a comprehensive understanding of molecular interactions in the lncRNA–miRNA–mRNA signaling pathways involved in DKD. Our analysis identified TEX41, MSC-AS1, LINC00639, DRAIC and WT1-AS as the five key lncRNAs, thus suggesting that these lncRNAs may be potential biomarkers for DKD. However, most previous studies have reported that WT1-AS, MSC-AS1 and DRAIC predominantly exert carcinogenic effects on cell proliferation, apoptosis, migration, and invasion in various cancers.44–46 No previous study has specifically investigated the role of TEX41 and LINC00639 in DKD.
PPI network and MCODE analysis further identified five key mRNAs (VCAN, TIMP1, CP, C3, TNC), thus indicating that these mRNAs play vital roles in the progression of DKD. VCAN belongs to the extracellular matrix chondroitin sulphate proteoglycan family. Previous studies have reported that VCAN is up-regulated in DKD and is associated with immune cell injury in diabetic kidney tissue.47,48 TIMP1 is a pro-fibrotic protein that belongs to the TIMP family that exists in the extracellular matrix and is involved in the inhibition of degradation in the extracellular matrix and the promotion of cell proliferation.49 Animal experiments have shown that TIMP-1 promotes fibrotic progression in renal tubular cells by exerting toxic effects;50 however, the potential association between TIMP1 and DKD has yet to be elucidated. Ceruloplasmin (CP) is a pro-oxidant in conditions of severe oxidative stress; increased levels of CP have been detected in the urinary exosomes of patients with diabetic nephropathy.51 Another longitudinal observational study showed that CP is an independent predictor for the progression of diabetic nephropathy in patients with type 2 diabetes.52 Other studies have shown that complement C3 can cause fibrosis and renal dysfunction in podocytes and renal tubular cells in animal models of DKD.53 Moreover, patients with a greater degree of C3 deposition in the kidney are associated with worse clinical endpoints.54 In our previous study, we also demonstrated that C3 was expressed at high levels in DKD cases and associated with M2 macrophages during immune cell infiltration in DKD kidney tissue.55 Clinical research reported that tenascin-C (TNC) can be used as a prognostic indicator to predict the development of microalbuminuria in patients with DKD.56 Mechanistic studies further suggested that TNC can promote the development and progression of DKD by interfering with the TNC/TLR4/NF-κB p65/miR-155-5p pathway.57
Furthermore, we investigated the expression profiles of these biomarkers using scRNA-seq and found that most of the hub genes (VCAN, C3, CP and TIMP1) were highly expressed in fibroblast cells; this was consistent with a previous bulk RNA-seq study, which reported that fibroblasts were expressed at significantly higher levels in patients with advanced DKD and negatively associated with GFR.21 Interestingly, various types of renal tubular cells, such as proximal straight tubule cell, parietal epithelial cell, and collecting duct type A intercalated cell, have been shown to express high levels of biomarkers, thus indicating that the proximal tubule may be particularly susceptible to kidney injury under hyperglycemic conditions and could represent a novel therapeutic target for DKD.58
Finally, we investigated potential therapeutic molecular components for DKD and identified seven predicted drugs. Of these, thapsigargin can activate store-operated Ca2+ channels to reduce the expression of fibronectin protein and collagen IV mRNA in human mesangial cells with DKD, and further down-regulate high glucose- and TGF-β1-stimulated matrix protein expression.59 Another study found that disulfiram suppressed the production and development of inflammation, fibrosis and cellular pyroptosis in proximal renal tubular epithelial cells, both in vitro and in vivo.60 However, there is a clear need for DKD to identify and investigate other drugs.
Conclusion
In summary, we constructed a novel lncRNA–miRNA–mRNA ceRNA network for DKD by integrating scRNA-seq and bulk RNA-seq data analysis. Enrichment analysis showed that most of the targets in the ceRNA network were in extracellular matrix and correlated with inflammatory mechanism in DKD. Furthermore, five key biomarkers (VCAN, TIMP1, TNC, C3 and CP) were identified in fibroblasts and renal tubular cells, and have relationshipswith glomerular filtration rate, serum creatinine, and proteinuria in patients with DKD.
Data Sharing Statement
The scRNA-seq and bulk RNA-seq expression datasets used in this study can be downloaded from the GEO. The Supplementary Material for this article is available in the article.
Ethics Approval and Informed Consent
Approval from the Ethics Committee of Zhejiang aged care hospital was waived because this study was a statistical analysis of public data, and no wet experiments of patients were performed by our authors.
Acknowledgments
We would like to thank the patients and investigators who participated in the GEO for providing data.
Funding
This research was funded by the National Natural Science Foundation of China, grant number No. 81873300.
Disclosure
None of the authors have any conflicts of interest to declare.
References
1. Lytvyn Y, Bjornstad P, van Raalte DH, Heerspink HL, Cherney DZI. The new biology of diabetic kidney disease-mechanisms and therapeutic implications. Endocr Rev. 2020;41(2). doi:10.1210/endrev/bnz010
2. Oshima M, Shimizu M, Yamanouchi M, et al. Trajectories of kidney function in diabetes: a clinicopathological update. Nat Rev Nephrol. 2021;17(11):740–750. doi:10.1038/s41581-021-00462-y
3. Winter L, Wong LA, Jerums G, et al. Use of readily accessible inflammatory markers to predict diabetic kidney disease. Front Endocrinol (Lausanne). 2018;9:225. doi:10.3389/fendo.2018.00225
4. Bilgin S, Kurtkulagi O, Atak Tel BM, et al. Does C-reactive protein to serum Albumin Ratio correlate with diabEtic nephropathy in patients with Type 2 dIabetes MEllitus? The CARE TIME study. Prim Care Diabetes. 2021;15(6):1071–1074. doi:10.1016/j.pcd.2021.08.015
5. Kocak MZ, Aktas G, Duman TT, et al. Monocyte lymphocyte ratio as a predictor of diabetic kidney injury in type 2 diabetes mellitus; The MADKID Study. J Diabetes Metab Disord. 2020;19(2):997–1002. doi:10.1007/s40200-020-00595-0
6. Kocak MZ, Aktas G, Duman TT, Atak BM, Savli H. Is Uric Acid elevation a random finding or a causative agent of diabetic nephropathy? Rev Assoc Med Bras. 2019;65(9):1155–1160. doi:10.1590/1806-9282.65.9.1156
7. Aktas G, Kocak MZ, Bilgin S, Atak BM, Duman TT, Kurtkulagi O. Uric acid to HDL cholesterol ratio is a strong predictor of diabetic control in men with type 2 diabetes mellitus. Aging Male. 2020;23(5):1098–1102. doi:10.1080/13685538.2019.1678126
8. Kocak MZ, Aktas G, Erkus E, Duman TT, Atak BM, Savli H. Mean platelet volume to lymphocyte ratio as a novel marker for diabetic nephropathy. J Coll Physicians Surg Pak. 2018;28(11):844–847. doi:10.29271/jcpsp.2018.11.844
9. Atak BM, Duman TT, Aktas G, Kocak MZ, Savli H. Platelet distribution width is associated with type 2 diabetes mellitus and diabetic nephropathy and neuropathy. Natl J Health Sci. 2018;3(3):95–98. doi:10.21089/njhs.33.0095
10. Chen S, Chen J, Li S, et al. High-fat diet-induced renal proximal tubular inflammatory injury: emerging risk factor of chronic kidney disease. Front Physiol. 2021;12:786599. doi:10.3389/fphys.2021.786599
11. Kin Tekce B, Tekce H, Aktas G, Sit M. Evaluation of the urinary kidney injury molecule-1 levels in patients with diabetic nephropathy. Clin Invest Med. 2014;37(6):E377–83. doi:10.25011/cim.v37i6.22242
12. Tekce H, Tekce BK, Aktas G, Alcelik A, Sengul E. Serum omentin-1 levels in diabetic and nondiabetic patients with chronic kidney disease. Exp Clin Endocrinol Diabetes. 2014;122(8):451–456. doi:10.1055/s-0034-1375674
13. Kocak MZ, Aktas G, Atak BM, et al. Is Neuregulin-4 a predictive marker of microvascular complications in type 2 diabetes mellitus? Eur J Clin Invest. 2020;50(3):e13206. doi:10.1111/eci.13206
14. Winkle M, El-Daly SM, Fabbri M, Calin GA. Noncoding RNA therapeutics - challenges and potential solutions. Nat Rev Drug Discov. 2021;20(8):629–651. doi:10.1038/s41573-021-00219-z
15. Chen Y, Li Z, Chen X, Zhang S. Long non-coding RNAs: from disease code to drug role. Acta Pharm Sin B. 2021;11(2):340–354. doi:10.1016/j.apsb.2020.10.001
16. Guo J, Liu Z, Gong R. Long noncoding RNA: an emerging player in diabetes and diabetic kidney disease. Clin Sci (Lond). 2019;133(12):1321–1339. doi:10.1042/CS20190372
17. Wonnacott A, Denby L, Jm Coward R, Fraser DJ, Bowen T. MicroRNAs and their delivery in diabetic fibrosis. Adv Drug Deliv Rev. 2021;114045. doi:10.1016/j.addr.2021.114045
18. Wang W, Min L, Qiu X, et al. Biological function of long non-coding RNA (LncRNA) Xist. Front Cell Dev Biol. 2021;9:645647. doi:10.3389/fcell.2021.645647
19. Schumacher A, Rookmaaker MB, Joles JA, et al. Defining the variety of cell types in developing and adult human kidneys by single-cell RNA sequencing. NPJ Regen Med. 2021;6(1):45. doi:10.1038/s41536-021-00156-w
20. Wilson PC, Wu H, Kirita Y, et al. The single-cell transcriptomic landscape of early human diabetic nephropathy. Proc Natl Acad Sci U S A. 2019;116(39):19619–19625. doi:10.1073/pnas.1908706116
21. Fan Y, Yi Z, D’Agati VD, et al. Comparison of kidney transcriptomic profiles of early and advanced diabetic nephropathy reveals potential new mechanisms for disease progression. Diabetes. 2019;68(12):2301–2314. doi:10.2337/db19-0204
22. Conserva F, Barozzino M, Pesce F, et al. Urinary miRNA-27b-3p and miRNA-1228-3p correlate with the progression of kidney fibrosis in diabetic nephropathy. Sci Rep. 2019;9(1):11357. doi:10.1038/s41598-019-47778-1
23. Pan Y, Jiang S, Hou Q, et al. Dissection of glomerular transcriptional profile in patients with diabetic nephropathy: SRGAP2a protects podocyte structure and function. Diabetes. 2018;67(4):717–730. doi:10.2337/db17-0755
24. Ritchie ME, Phipson B, Wu D, et al. limma powers differential expression analyses for RNA-sequencing and microarray studies. Nucleic Acids Res. 2015;43(7):e47. doi:10.1093/nar/gkv007
25. Satija R, Farrell JA, Gennert D, Schier AF, Regev A. Spatial reconstruction of single-cell gene expression data. Nat Biotechnol. 2015;33(5):495–502. doi:10.1038/nbt.3192
26. Muto Y, Wilson PC, Ledru N, et al. Single cell transcriptional and chromatin accessibility profiling redefine cellular heterogeneity in the adult human kidney. Nat Commun. 2021;12(1):2190. doi:10.1038/s41467-021-22368-w
27. Zhang X, Lan Y, Xu J, et al. CellMarker: a manually curated resource of cell markers in human and mouse. Nucleic Acids Res. 2019;47(D1):D721–D728. doi:10.1093/nar/gky900
28. Zhou Y, Zhou B, Pache L, et al. Metascape provides a biologist-oriented resource for the analysis of systems-level datasets. Nat Commun. 2019;10(1):1523. doi:10.1038/s41467-019-09234-6
29. Paraskevopoulou MD, Vlachos IS, Karagkouni D, et al. DIANA-LncBase v2: indexing microRNA targets on non-coding transcripts. Nucleic Acids Res. 2016;44(D1):D231–D238. doi:10.1093/nar/gkv1270
30. Huang HY, Lin YC, Li J, et al. miRTarBase 2020: updates to the experimentally validated microRNA-target interaction database. Nucleic Acids Res. 2020;48(D1):D148–D154. doi:10.1093/nar/gkz896
31. Chen Y, Wang X. miRDB: an online database for prediction of functional microRNA targets. Nucleic Acids Res. 2020;48(D1):D127–D131. doi:10.1093/nar/gkz757
32. Agarwal V, Bell GW, Nam JW, Bartel DP. Predicting effective microRNA target sites in mammalian mRNAs. Elife. 2015;4. doi:10.7554/eLife.05005
33. Thomson DW, Dinger ME. Endogenous microRNA sponges: evidence and controversy. Nat Rev Genet. 2016;17(5):272–283. doi:10.1038/nrg.2016.20
34. Volders PJ, Anckaert J, Verheggen K, et al. LNCipedia 5: towards a reference set of human long non-coding RNAs. Nucleic Acids Res. 2019;47(D1):D135–D139. doi:10.1093/nar/gky1031
35. Cao Z, Pan X, Yang Y, Huang Y, Shen HB. The lncLocator: a subcellular localization predictor for long non-coding RNAs based on a stacked ensemble classifier. Bioinformatics. 2018;34(13):2185–2194. doi:10.1093/bioinformatics/bty085
36. Bludau I. Discovery-versus hypothesis-driven detection of protein-protein interactions and complexes. Int J Mol Sci. 2021;22(9):4450. doi:10.3390/ijms22094450
37. Sing T, Sander O, Beerenwinkel N, Lengauer T. ROCR: visualizing classifier performance in R. Bioinformatics. 2005;21(20):3940–3941. doi:10.1093/bioinformatics/bti623
38. Subramanian A, Narayan R, Corsello SM, et al. A next generation connectivity map: L1000 platform and the first 1,000,000 profiles. Cell. 2017;171(6):1437–1452e17. doi:10.1016/j.cell.2017.10.049
39. Lopez-Cortes GI, Diaz-Alvarez L, Ortega E. Leukocyte membrane enzymes play the cell adhesion game. Front Immunol. 2021;12:742292. doi:10.3389/fimmu.2021.742292
40. Le Saux G, Wu MC, Toledo E, et al. Cell-cell adhesion-driven contact guidance and its effect on human mesenchymal stem cell differentiation. ACS Appl Mater Interfaces. 2020;12(20):22399–22409. doi:10.1021/acsami.9b20939
41. Howell K, de Leeuw E. Cell adhesion properties of human defensins. Biochem Biophys Res Commun. 2018;502(2):238–242. doi:10.1016/j.bbrc.2018.05.150
42. Zhang Y, Reif G, Wallace DP. Extracellular matrix, integrins, and focal adhesion signaling in polycystic kidney disease. Cell Signal. 2020;72:109646. doi:10.1016/j.cellsig.2020.109646
43. Wada J, Makino H. Inflammation and the pathogenesis of diabetic nephropathy. Clin Sci (Lond). 2013;124(3):139–152. doi:10.1042/CS20120198
44. Li S, Jia H, Zhang Z, Wu D. DRAIC promotes growth of breast cancer by sponging miR-432-5p to upregulate SLBP. Cancer Gene Ther. 2021. doi:10.1038/s41417-021-00388-4
45. Li C, Feng S, Chen L. MSC-AS1 knockdown inhibits cell growth and temozolomide resistance by regulating miR-373-3p/CPEB4 axis in glioma through PI3K/Akt pathway. Mol Cell Biochem. 2021;476(2):699–713. doi:10.1007/s11010-020-03937-x
46. Wu C, Yang J, Li R, Lin X, Wu J, Wu J. LncRNA WT1-AS/miR-494-3p regulates cell proliferation, apoptosis, migration and invasion via PTEN/PI3K/AKT signaling pathway in non-small cell lung cancer. Onco Targets Ther. 2021;14:891–904. doi:10.2147/OTT.S278233
47. Gao Z, Li XM, Li XL, Sui LN. Identification of key candidate genes and chemical perturbagens in diabetic kidney disease using integrated bioinformatics analysis. Front Endocrinol (Lausanne). 2021;12:721202. doi:10.3389/fendo.2021.721202
48. Xu Q, Li B, Wang Y, et al. Identification of VCAN as hub gene for diabetic kidney disease immune injury using integrated bioinformatics analysis. Front Physiol. 2021;12:651690. doi:10.3389/fphys.2021.651690
49. Eckfeld C, Haussler D, Schoeps B, Hermann CD, Kruger A. Functional disparities within the TIMP family in cancer: hints from molecular divergence. Cancer Metastasis Rev. 2019;38(3):469–481. doi:10.1007/s10555-019-09812-6
50. Andreucci M, Provenzano M, Faga T, et al. Aortic aneurysms, chronic kidney disease and metalloproteinases. Biomolecules. 2021;11(2):194. doi:10.3390/biom11020194
51. Gudehithlu KP, Garcia-Gomez I, Vernik J, et al. In diabetic kidney disease urinary exosomes better represent kidney specific protein alterations than whole urine. Am J Nephrol. 2015;42(6):418–424. doi:10.1159/000443539
52. Lee MJ, Jung CH, Kang YM, et al. Serum ceruloplasmin level as a predictor for the progression of diabetic nephropathy in Korean men with type 2 diabetes mellitus. Diabetes Metab J. 2015;39(3):230–239. doi:10.4093/dmj.2015.39.3.230
53. Morigi M, Perico L, Corna D, et al. C3a receptor blockade protects podocytes from injury in diabetic nephropathy. JCI Insight. 2020;5(5). doi:10.1172/jci.insight.131849
54. Tang X, Li H, Li L, et al. The clinical impact of glomerular immunoglobulin m deposition in patients with type 2 diabetic nephropathy. Am J Med Sci. 2018;356(4):365–373. doi:10.1016/j.amjms.2018.07.001
55. Wang Y, Zhao M, Zhang Y. Identification of fibronectin 1 (FN1) and complement component 3 (C3) as immune infiltration-related biomarkers for diabetic nephropathy using integrated bioinformatic analysis. Bioengineered. 2021;12(1):5386–5401. doi:10.1080/21655979.2021.1960766
56. Yamashita S, Shinozaki T, Murata H, Matsuyama Y, Babazono T. Panel of novel urine biomarkers for incident microalbuminuria in people with type 2 diabetes mellitus. Diabet Med. 2020;37(11):1910–1918. doi:10.1111/dme.14280
57. Zhou Y, Ma XY, Han JY, et al. Metformin regulates inflammation and fibrosis in diabetic kidney disease through TNC/TLR4/NF-kappaB/miR-155-5p inflammatory loop. World J Diabetes. 2021;12(1):19–46. doi:10.4239/wjd.v12.i1.19
58. Gilbert RE. Proximal tubulopathy: prime mover and key therapeutic target in diabetic kidney disease. Diabetes. 2017;66(4):791–800. doi:10.2337/db16-0796
59. Wu P, Wang Y, Davis ME, et al. Store-operated Ca2+ channels in mesangial cells inhibit matrix protein expression. J Am Soc Nephrol. 2015;26(11):2691–2702. doi:10.1681/ASN.2014090853
60. Zhang Y, Zhang R, Han X. Disulfiram inhibits inflammation and fibrosis in a rat unilateral ureteral obstruction model by inhibiting gasdermin D cleavage and pyroptosis. Inflamm Res. 2021;70(5):543–552. doi:10.1007/s00011-021-01457-y
 © 2022 The Author(s). This work is published and licensed by Dove Medical Press Limited. The
full terms of this license are available at https://www.dovepress.com/terms
and incorporate the Creative Commons Attribution
- Non Commercial (unported, 3.0) License.
By accessing the work you hereby accept the Terms. Non-commercial uses of the work are permitted
without any further permission from Dove Medical Press Limited, provided the work is properly
attributed. For permission for commercial use of this work, please see paragraphs 4.2 and 5 of our Terms.
© 2022 The Author(s). This work is published and licensed by Dove Medical Press Limited. The
full terms of this license are available at https://www.dovepress.com/terms
and incorporate the Creative Commons Attribution
- Non Commercial (unported, 3.0) License.
By accessing the work you hereby accept the Terms. Non-commercial uses of the work are permitted
without any further permission from Dove Medical Press Limited, provided the work is properly
attributed. For permission for commercial use of this work, please see paragraphs 4.2 and 5 of our Terms.