Back to Journals » Cancer Management and Research » Volume 11
Integrated analysis of lncRNA-associated ceRNA network reveals potential biomarkers for the prognosis of hepatitis B virus-related hepatocellular carcinoma
Authors Li H, Zhao X, Li C, Sheng C, Bai Z
Received 5 September 2018
Accepted for publication 23 November 2018
Published 17 January 2019 Volume 2019:11 Pages 877—897
DOI https://doi.org/10.2147/CMAR.S186561
Checked for plagiarism Yes
Review by Single anonymous peer review
Peer reviewer comments 3
Editor who approved publication: Dr Antonella D'Anneo
Hongyan Li, Xiaonan Zhao, Chenghua Li, Chuanlun Sheng, Zhenzi Bai
Infectious Department, China-Japan Union Hospital, Jilin University, Changchun 130033, China
Background: There is evidence that abnormal expression of lncRNAs is associated with hepatitis B virus (HBV) infection-induced hepatocellular carcinoma (HCC). However, the mechanisms remain not fully elucidated. The study aimed to identify novel lncRNAs and explore their underlying mechanisms based on the ceRNA hypothesis.
Methods: The RNA and miRNA expression profiling in 20 tumor and matched adjacent tissues from HBV–HCC patients were retrieved from the Gene Expression Omnibus database under accession numbers GSE77509 and GSE76903, respectively. Differentially expressed lncRNAs (DELs), miRNAs (DEMs), and genes (DEGs) were identified using the EdgeR package. Protein–protein interaction (PPI) network was constructed for DEGs followed by module analysis. The ceRNA network was constructed based on interaction relationships between miRNAs and mRNAs/lncRNAs. The functions of DEGs were predicted using DAVID and BinGO databases. The prognosis values (overall survival [OS] and recurrence-free survival [RFS]) of ceRNA network genes were determined using The Cancer Genome Atlas (TCGA) data with Cox regression analysis and Kaplan–Meier method.
Results: The present study screened 643 DELs, 83 DEMs, and 1,187 DEGs. PPI network analysis demonstrated that CDK1 and CCNE1 were hub genes and extracted in functionally related modules. E2F2, CDK1, and CCNE1 were significantly enriched into cell cycle pathway. FAM182B-miR-125b-5p-E2F2 and LINC00346-miR-10a-5p-CDK1/CCNE1 ceRNA axes were obtained by constructing the ceRNA network. Patients with high expressions of DELs and DEGs in the above ceRNA axes had poor OS, while patients with the high expression of DEMs possessed excellent OS. CDK1 was also an RFS-related biomarker, with its high expression predicting poor RFS. The upregulation of LINC00346 and CDK1 but the downregulation of miR-10a-5p in HCC was validated in other microarray datasets and TCGA database.
Conclusion: The LINC00346-miR-10a-5p-CDK1 axis may be an important mechanism for HBV-related HCC, and genes in this ceRNA axis may be potential prognostic biomarkers and therapeutic targets.
Keywords: hepatocellular carcinoma, hepatitis B virus, ceRNA, lncRNA, miRNA, prognosis, bioinformatics analysis, TCGA
Introduction
Hepatocellular carcinoma (HCC) is the fourth most prevalent human malignancy and the third cause of cancer-related deaths in China.1 In 2015, it is estimated that there are 466,100 new cases and 422,100 deaths due to this disease.1 Although patients with HCC can be managed with a series of therapeutic methods (including surgical resection, adjuvant chemotherapy, radiotherapy, and liver transplantation), the overall 5-year survival rate still remains poor (less than 20%).2 Epidemiological studies have shown that chronic hepatitis B virus (HBV) infection is the predominant risk factor for the development, metastasis, and recurrence of HCC, accounting for about 80% of all HCC in China.3-5 Thus, it is necessary to further investigate the molecular mechanisms of HBV-related HCC in order to screen novel prognostic biomarkers and develop effective therapeutic strategies.
Recently, there have studies to indicate that the abnormal expression of lncRNAs, a class of noncoding RNAs longer than 200 nt in length, is associated with the development of various cancers, including HBV-related HCC.6,7 For example, Zuo et al found that lncRNA AX800134 was upregulated in HBV-positive HCC compared with HBV-negative HCC. Silencing AX800134 with siRNA interference significantly suppressed the growth and invasion but enhanced spontaneous apoptosis of HBx-expressing HepG2 cells.8 The study of Lv et al revealed that the expression of lncRNA DREH was frequently downregulated in HBV-associated HCC tissues in comparison with adjacent noncancerous hepatic tissues. Inhibition of DREH expression by HBx remarkably promoted the proliferation of HCC cells in vitro and in vivo.9 Yang et al identified that lncRNA-HEIH was highly expressed in liver samples from patients with HBV-related HCC. The expression level of lncRNA-HEIH in HBV-related HCC was significantly associated with recurrence and was an independent prognostic factor for survival.10 However, the mechanisms of lncRNAs in HBV-related HCC remain not fully elucidated.
Previously, emerging evidence has demonstrated that lncRNAs may function as molecular sponges for a miRNA through their miRNAs response elements (MREs) and thereby influence the translation inhibition or mRNA degradation of the transcript on the targets by the respective miRNAs, which is proposed as ceRNA hypothesis.11 Accumulating data also indicated that this regulatory action plays important roles in HCC development.12,13 For example, Lv et al14 showed that lnRNA Unigene56159 promoted the migration and invasion of HCC cells by acting as a ceRNA for miR-140-5p to de-repress the expression of Slug and induce the epithelial–mesenchymal transition (EMT). Mo et al15 observed the upregulated LINC01287 competitively bound to miR-298 and increased the expression of its target gene STAT3 to promote EMT and invasion of HCC cells. lncRNA n335586 was also reported to promote EMT of HCC cells and then migration as well as invasion through facilitating the expression of its host gene creatine kinase, mitochondrial 1A (CKMT1A) by competitively binding miR-924.16 lncRNA SNHG12 functioned as an oncogene to accelerate tumorigenesis and metastasis of HCC cells by sponging miR-199a/b-5p, which resulted in the high expression of MLK3 (mitogen-activated protein kinase kinase kinase 11) and activated the NF-κB pathway.17 HCAL directly interacted with and functioned as a sponge for miR-15a, miR-196a, and miR-196b to modulate lysosomal protein transmembrane 4 beta (LAPTM4B) expression in HCC.18 However, studies performed to investigate the ceRNA mechanisms of lncRNAs for HBV-related HCC were rare.14,16
The goal of this study was to identify novel lncRNA–miRNA–mRNA interaction axes for explaining the development of HBV-associated HCC by constructing a ceRNA regulatory network using sequencing data collected from a public database. Also, the prognosis performance of related lncRNAs, miRNA, and mRNAs was also validated by utilizing The Cancer Genome Atlas (TCGA) datasets. We believe that our study may provide novel prognostic biomarkers and therapeutic targets for HBV-associated HCC.
Methods
Data collection and preprocessing
Two datasets under accession numbers GSE7750919 and GSE7690319 were retrieved from the Gene Expression Omnibus (GEO) database (http://www.ncbi.nlm.nih.gov/geo/). These two datasets examined the RNA expression profiling and noncoding (miRNA) expression profiling in 20 primary tumors and 20 matched adjacent normal tissues from patients with HBV-induced HCC by high-throughput sequencing via HiSeq 2500 System (Illumina, San Diego, CA, USA). The samples were the same for the two datasets. The fragment per kilobase per million mapped reads (FPKM) expression data in TXT files were downloaded and preprocessed by removing low abundance genes with an FPKM of <1. The lncRNA and mRNA genes in RNA expression profiling were annotated based on the Ensembl Gene ID and HUGO Gene Nomenclature Committee (HGNC; http://www.genenames.org/).20
Differentially expressed RNA analysis
The differentially expressed genes (DEGs), differentially expressed lncRNAs (DELs), and differentially expressed miRNAs (DEMs) between primary tumors and adjacent normal tissues were identified using the EdgeR package of R software (Version 3.22.3; http://www.bioconductor.org/packages/release/bioc/html/edgeR.html).21 P-value was adjusted to false discovery rate (FDR) with multitest package (Version 2.36.0; http://bioconductor.org/packages/release/bioc/html/multtest.html).22 The FDR of <0.05 and |logFC(fold change)| >1 were set as the statistical threshold value. Hierarchical cluster heatmap representing the expression intensity and direction of DEGs, DELs, and DEMs was generated using the pheatmap R package (Version: 1.0.8; https://cran.r-project.org/web/packages/pheatmap) based on Euclidean distance.
Protein–protein interaction (PPI) network
The Search Tool for the Retrieval of Interacting Genes/Proteins (STRING; Version 10.0; http://stringdb.org/) database23was used to assess the direct and indirect correlations between DEGs. The screened interaction pairs among DEGs were used to construct the PPI network with the Cytoscape software (Version 3.6.1; www.cytoscape.org/).24 The topological features of the PPI network, consisting of degree (the number of edges [interactions] of a node protein]), betweenness centrality (BC; the number of shortest paths that run through a node), closeness centrality (CC; the average length of the shortest paths to access all other proteins in the network), and average path length (APL; the average of distances between all pairs of nodes), were then calculated using the CytoNCA plugin in cytoscape software (http://apps.cytoscape.org/apps/cytonca)25 to determine which genes were hub nodes. Functionally related clusters with well-interconnected genes were further identified from the PPI network using the Molecular Complex Detection (MCODE; Version: 1.4.2, http://apps.cytoscape.org/apps/mcode) algorithm26 with default scoring options. Modules with score >4 and node >6 were considered to be significant.
Function enrichment analysis
Gene Ontology (GO) Biological Process term and Kyoto Encyclopedia of Genes and Genomes (KEGG) pathway enrichment analyses of DEGs were conducted using the Database for Annotation, Visualization and Integrated Discovery (DAVID) online tool (Version 6.8; http://david.abcc.ncifcrf.gov)27 and BinGO28 plugin in Cytoscape to predict their underlying functions. Statistical significance was defined as FDR <0.05.
lncRNA–miRNA–mRNA ceRNA regulatory network construction
The miRcode database (Version 11; http://www.mircode.org/)29 was used to screen the interaction relationships between DELs and DEMs, and then, the DELs–DEMs interaction network was constructed using the Cytoscape software (Version 3.6.1; www.cytoscape.org/).24 The target genes of DEMs in the DELs–DEMs interaction network were predicted using the miRwalk database (Version 2.0; http://www.zmf.umm.uni-heidelberg.de/apps/zmf/mirwalk2),30 which were then overlapped with the DEGs to obtain the DELs–DEMs–DEGs regulatory relationships. The negative interaction pairs between DEMs and DEGs/DELs were integrated to construct the DELs–DEMs–DEGs ceRNA network using the Cytoscape software (Version 3.6.1; www.cytoscape.org/).24
Furthermore, all known HCC-related pathways were downloaded from Comparative Toxicogenomics Database (CTD; http://ctd.mdibl.org/),31 which was then overlapped with the pathways enriched by the genes in the ceRNA network to obtain potentially HCC-related ceRNA network.
Prognosis values of DELs, DEMs, and DEGs in ceRNA network
The miRNAs and mRNAs expression profile data of HCC were also collected from TCGA (https://gdc-portal.nci.nih.gov/) database, with only the HBV samples having survival information, included. Univariate Cox regression analysis was performed to screen prognosis-related DELs, DEMs, and DEGs using the survival package (Version 2.40.1; https://cran.r-project.org/package=survival). The samples were then classified into a low-expression group (< median) and a high-expression group (> median) based on the expression of each prognosis-related DEL, DEM, and DEG. The Kaplan–Meier (KM) method with the log-rank test was employed to compare the overall survival (OS) and recurrence-free survival (RFS) between the high- and low-expression groups through the GraphPad Prism software (Version 5; GraphPad Software, Inc., La Jolla, CA, USA). P<0.05 was considered to be statistically significant.
Validation of expressions of crucial DELs, DEMs, and DEGs in ceRNA network
The expressions of crucial DELs, DEMs, and DEGs were also validated in TCGA dataset and other microarray datasets that detected the mRNA (GSE121248: 70 vs 37; GSE9466032: 21 vs 21; GSE2559933: 10 vs 21 normal), miRNA (GSE69580: 5 vs 5), and lncRNA (GSE2746234: 5 vs 5) expression profile between tumor and matched adjacent tissues from HBV–HCC patients. All microarray datasets were also collected from the GEO database. The expression difference was tested by t-test. P<0.05 was set as statistical significance.
Results
Differential expression analysis
A total of 133 lncRNAs, 18,628 protein-coding mRNAs, and 2,578 miRNAs were annotated in mRNA-seq and miRNA-seq data. After removing the low abundance genes with an FPKM of <1, 80 lncRNAs, 16,169 protein-coding mRNAs, and 874 miRNAs were left for differential expression analysis. Based on the given threshold (FDR <0.05 and |logFC| >1), a total of 43 DELs (14 downregulated and 29 upregulated), 83 DEMs (10 downregulated and 73 upregulated), and 1,187 DEGs (650 downregulated and 537 upregulated) were identified between adjacent normal tissues and primary tumors (Table 1). The heat map analysis showed that the samples with similar features tended to be clustered according to the expressions of DELs (Figure 1A), DEMs (Figure 1B), and DEGs (Figure 1C).
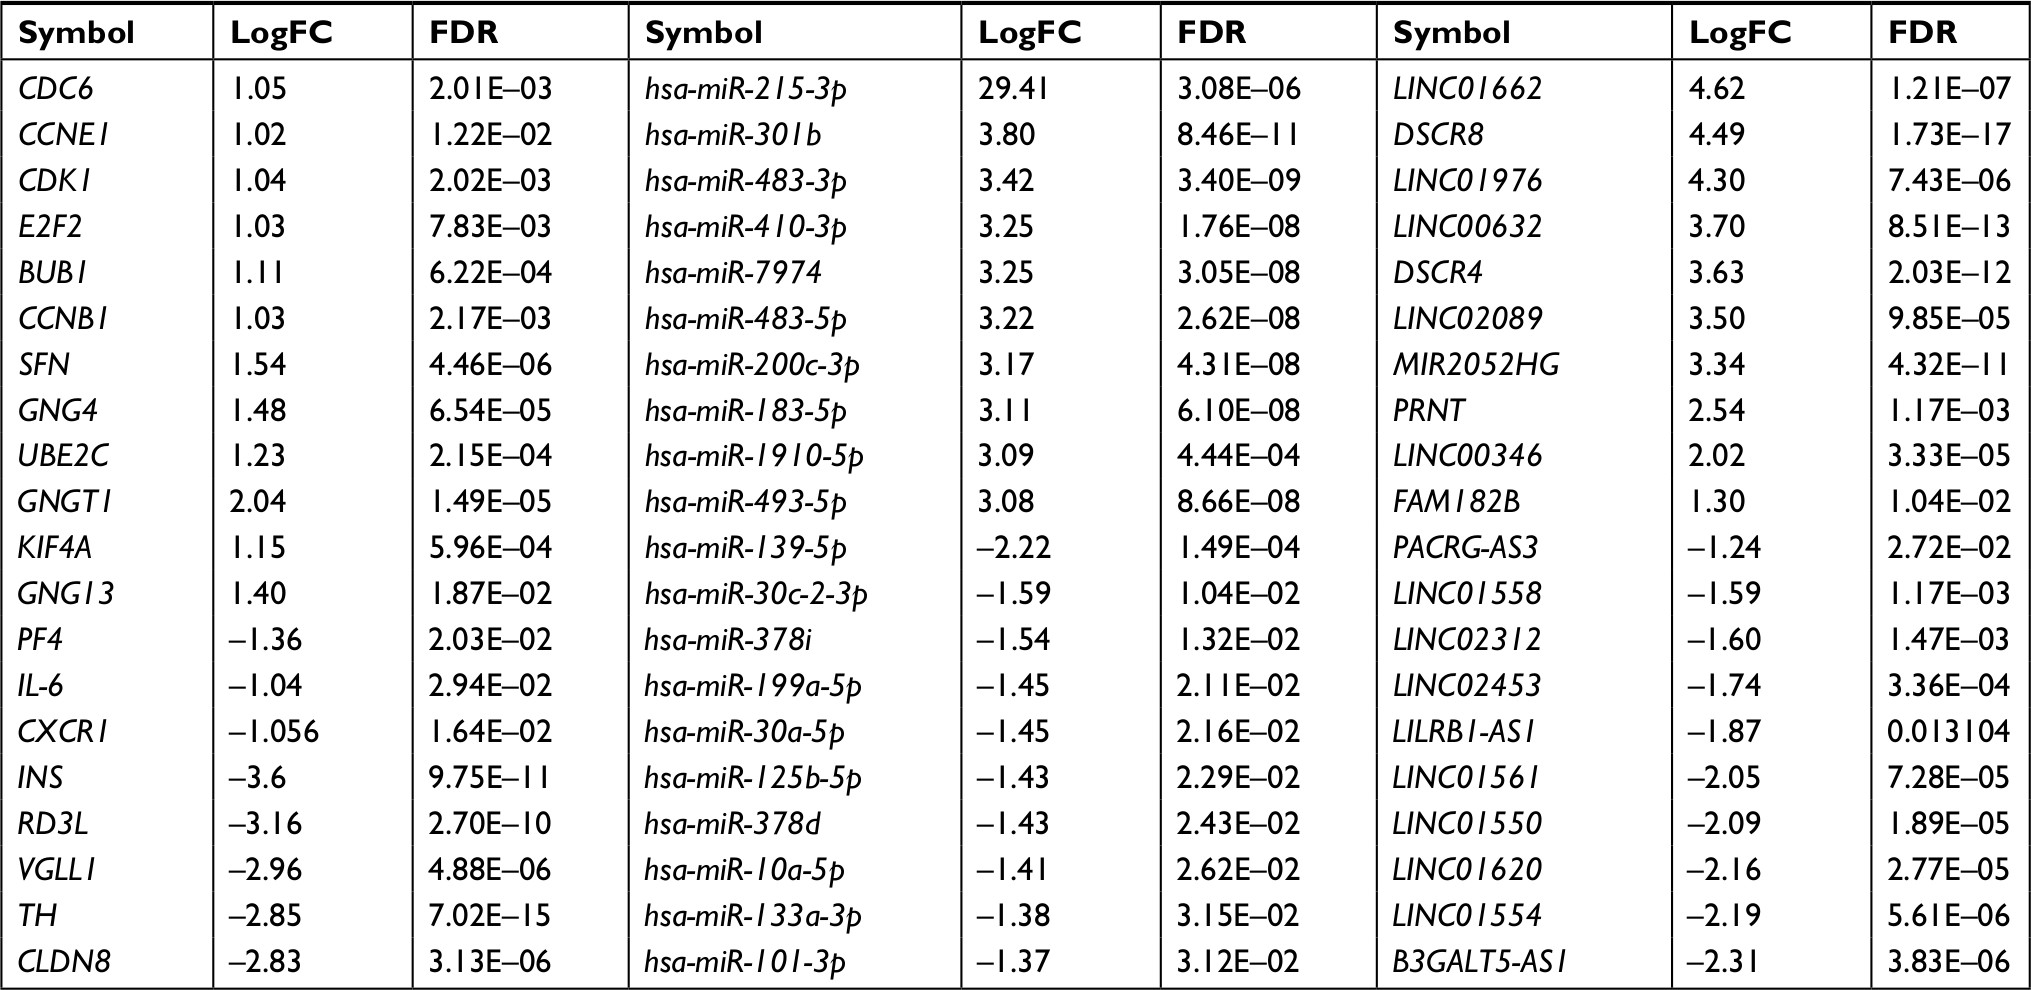 | Table 1 Differentially expressed genes, miRNAs, and lncRNAs Abbreviations: FC, fold change; FDR, false discovery rate. |
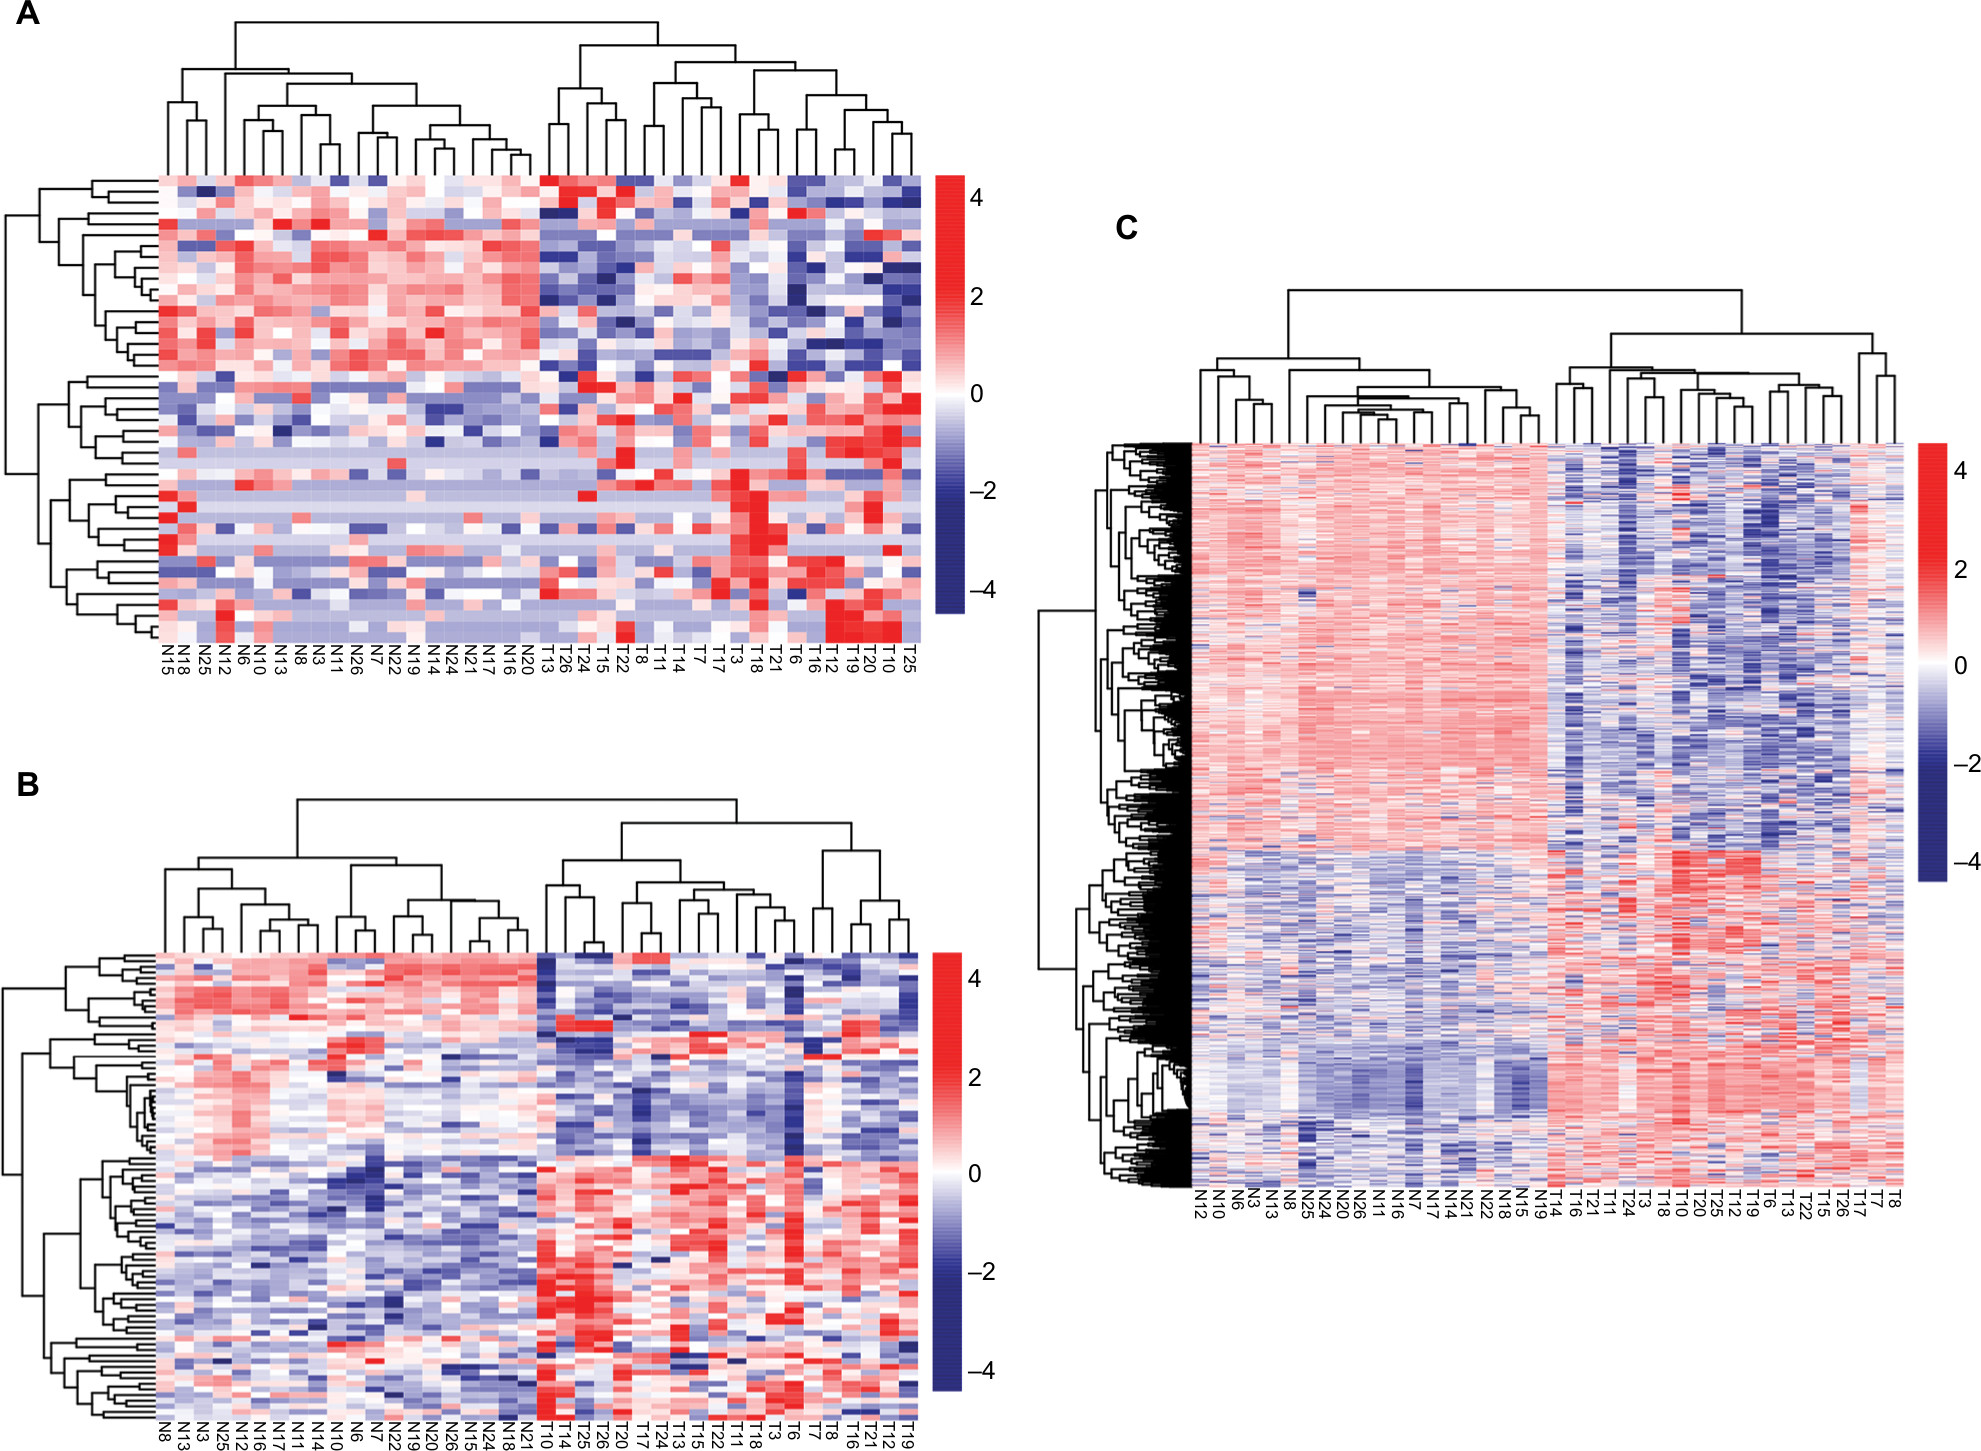 | Figure 1 Hierarchical clustering and heat map analysis of differentially expressed lncRNAs (A), miRNAs (B), and genes (C). Notes: Each row represents a sample, and each column represents an lncRNA, miRNA, or gene. High- or low-relative expression is displayed as a red or blue strip, respectively. Each group contained 20 different samples. Abbreviations: T, tumor; N, normal. |
Function enrichment for DEGs
The upregulated and downregulated DEGs were subjected to the DAVID to predict their functions. The results indicated that 16 GO biological process terms were obtained for the upregulated genes, mainly involving cell cycle (ie, E2F2, CDK1, CCNE1, BUB1, UBE2C, and CCNB1), while 27 GO biological process terms were enriched for the downregulated genes, mainly involving inflammatory response (PF4 and CXCR1) (Table 2 and Figure 2A). Furthermore, the KEGG pathway enrichment analysis was performed. In line with the GO enrichment results, the cell cycle (E2F2, CDK1, CCNE1, BUB1, and CCNB1) and p53 signaling pathway (CDK1, CCNE1, and CCNB1) were also obtained for the upregulated genes, while cytokine–cytokine receptor interaction was enriched for the downregulated genes (PF4 and CXCR1) (Table 3 and Figure 2B).
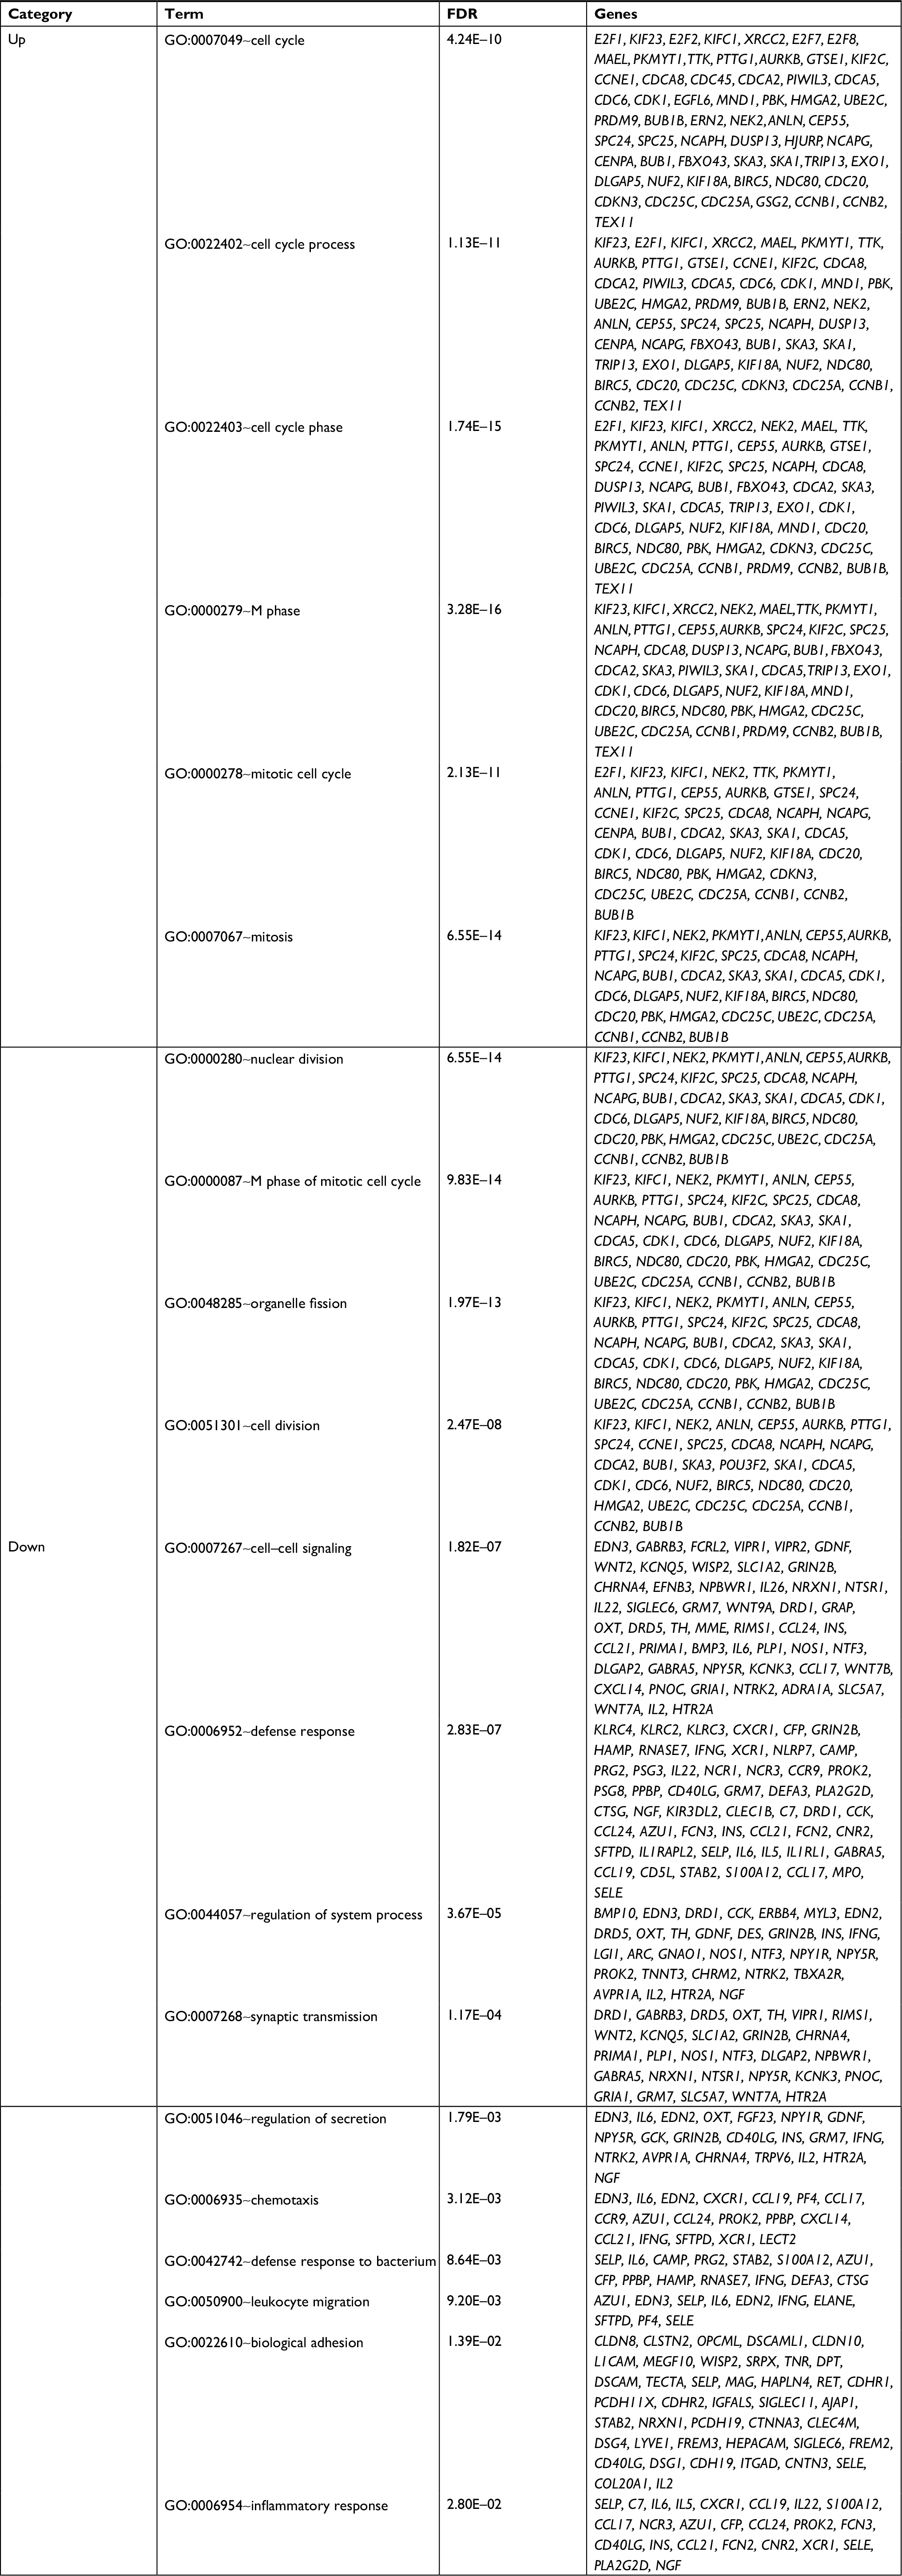 | Table 2 GO enrichment for differentially expressed genes using the DAVID database Note: Top 10 terms were listed. Abbreviations: DAVID, Database for Annotation, Visualization and Integrated Discovery; FDR, false discovery rate; GO, Gene Ontology. |
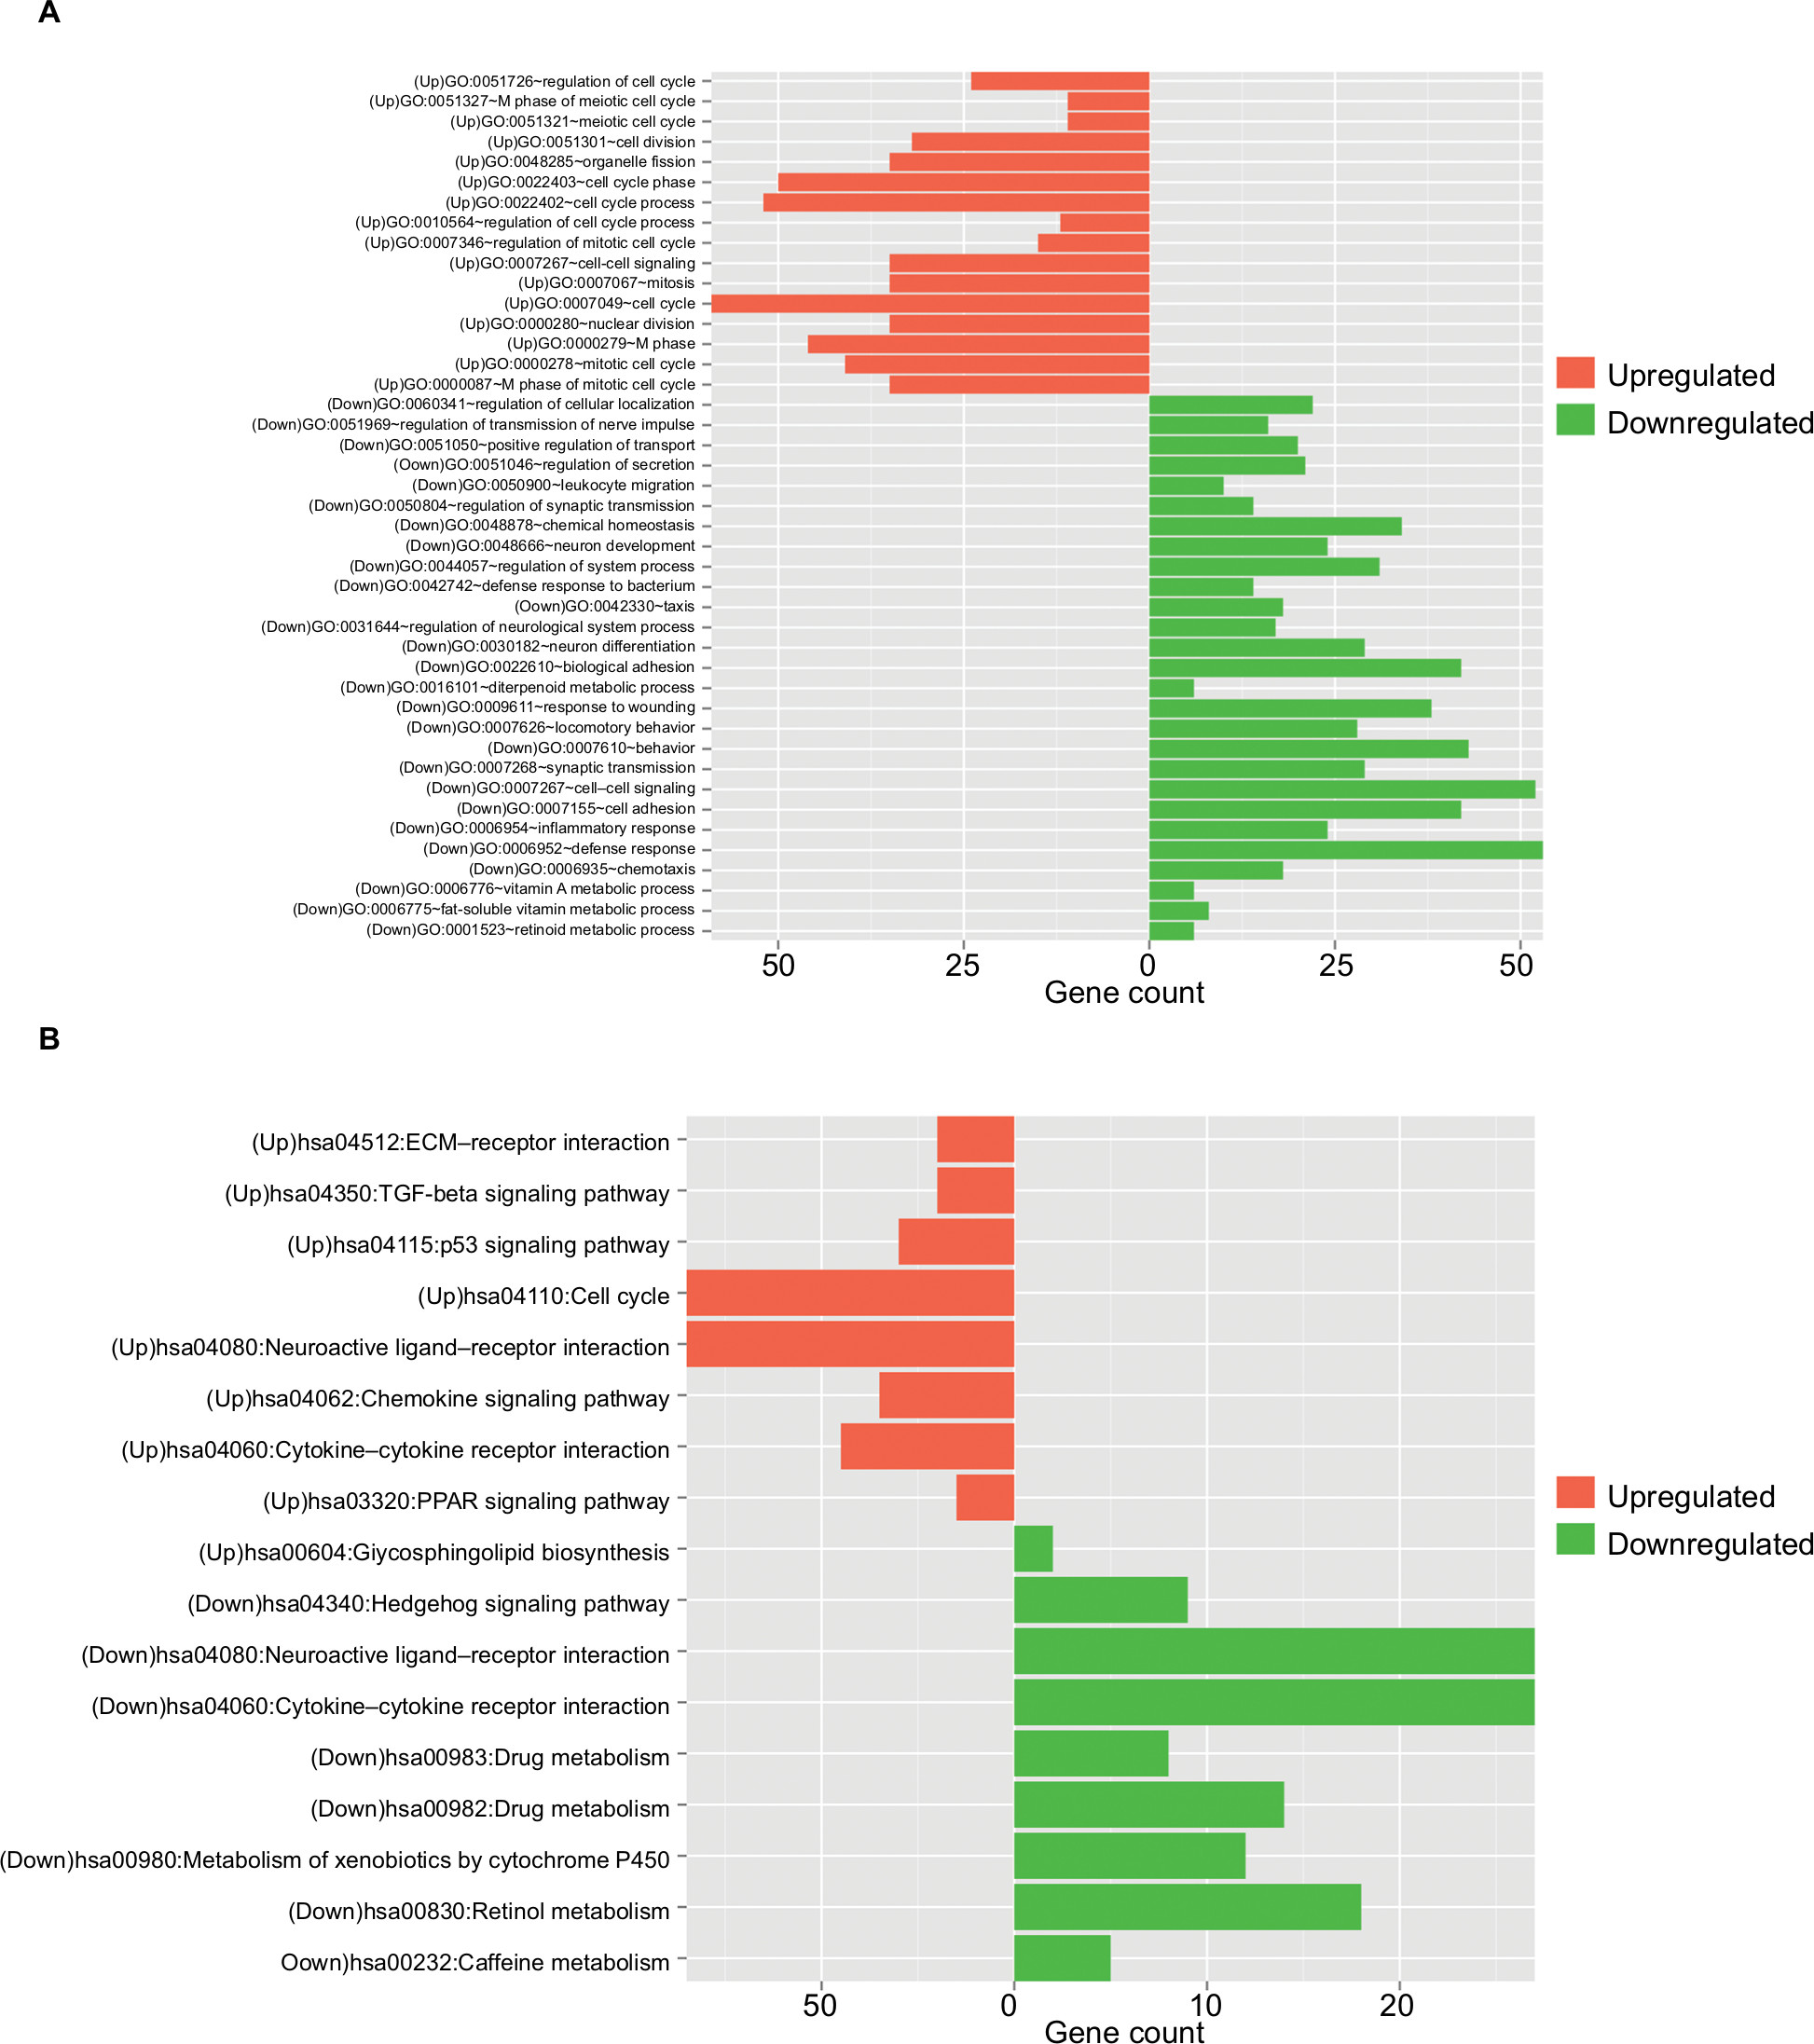 | Figure 2 Function enrichment analyses for the differentially expressed genes. Note: (A) GO enrichment and (B) KEGG pathways enrichment. Abbreviations: GO, Gene Ontology; KEGG, Kyoto Encyclopedia of Genes and Genomes. |
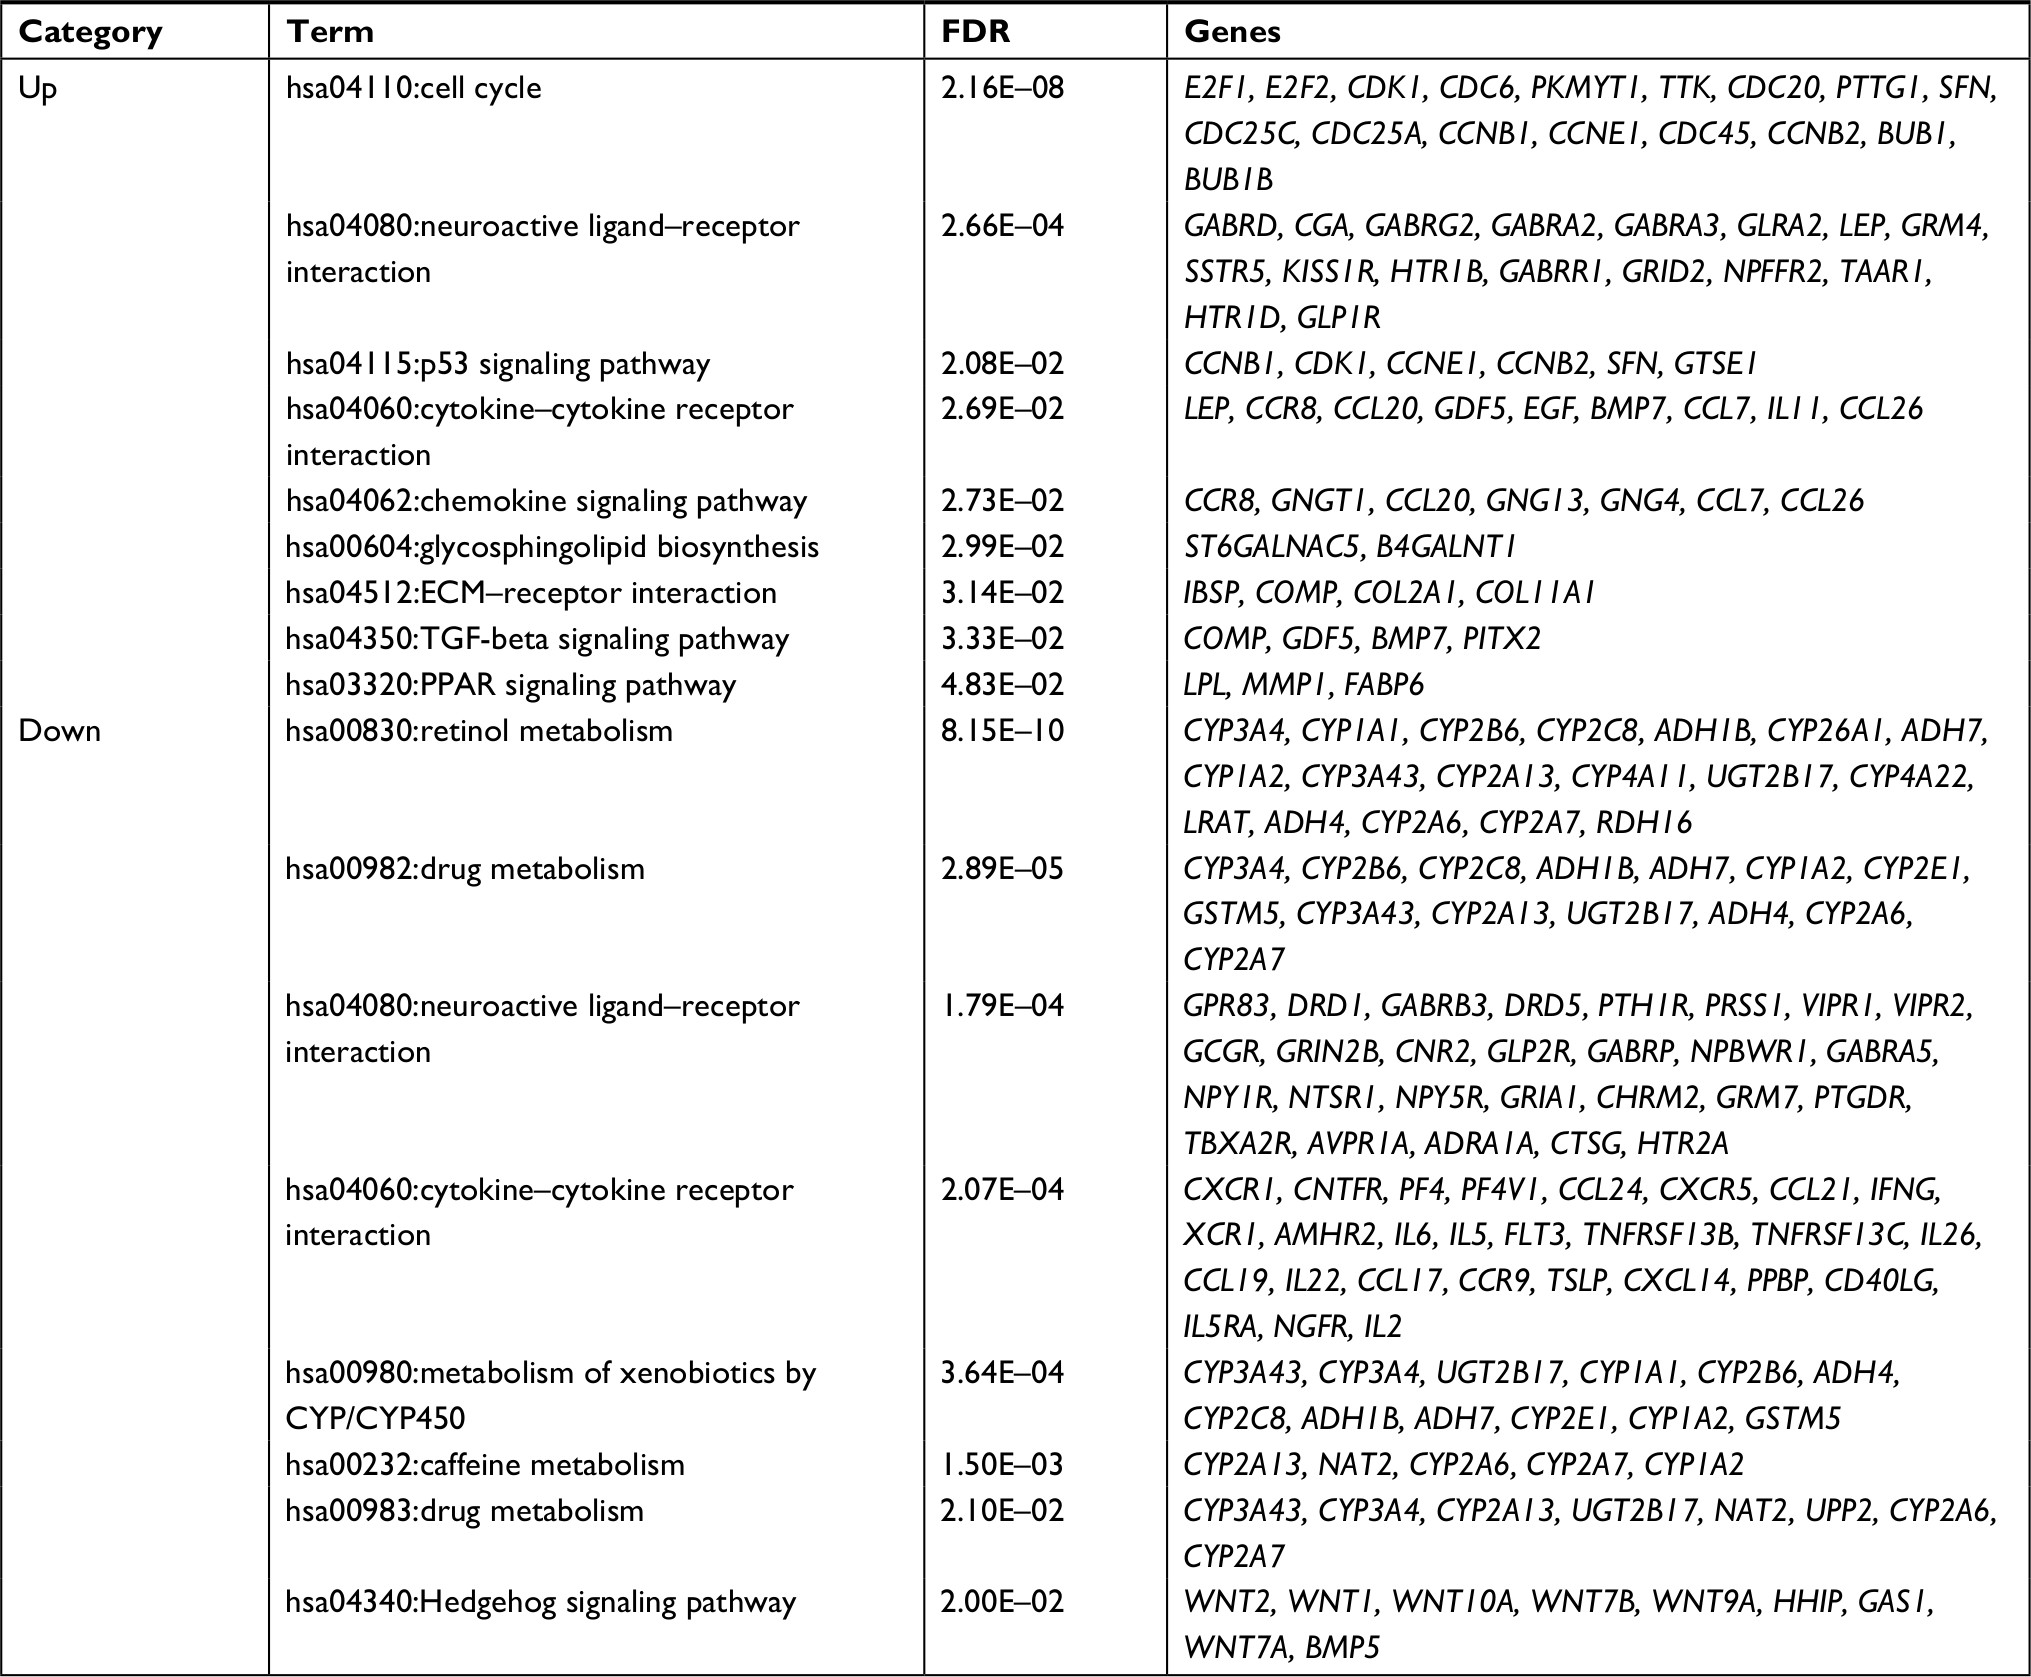 | Table 3 KEGG pathway enrichment for differentially expressed genes using the DAVID database Abbreviations: DAVID, Database for Annotation, Visualization and Integrated Discovery; FDR, false discovery rate; KEGG, Kyoto Encyclopedia of Genes and Genomes. |
PPI network construction
Using the STRING database, 2,065 interaction relationship pairs (eg, BUB1–CDK1) were obtained between the 357 DEGs (182 downregulated and 175 upregulated), which were used for constructing a PPI network (Figure 3). After calculating the topological features for each protein in PPI network, CCNB1, CDK1, G protein subunit gamma 4 (GNG4), UBE2C, G protein subunit gamma transducin 1 (GNGT1), kinesin family member 4A (KIF4A), PF4, and G protein subunit gamma 13 (GNG13) were found to be shared in four topological characteristics and ranked in the top 30, suggesting that they may be hub genes (Table 4).
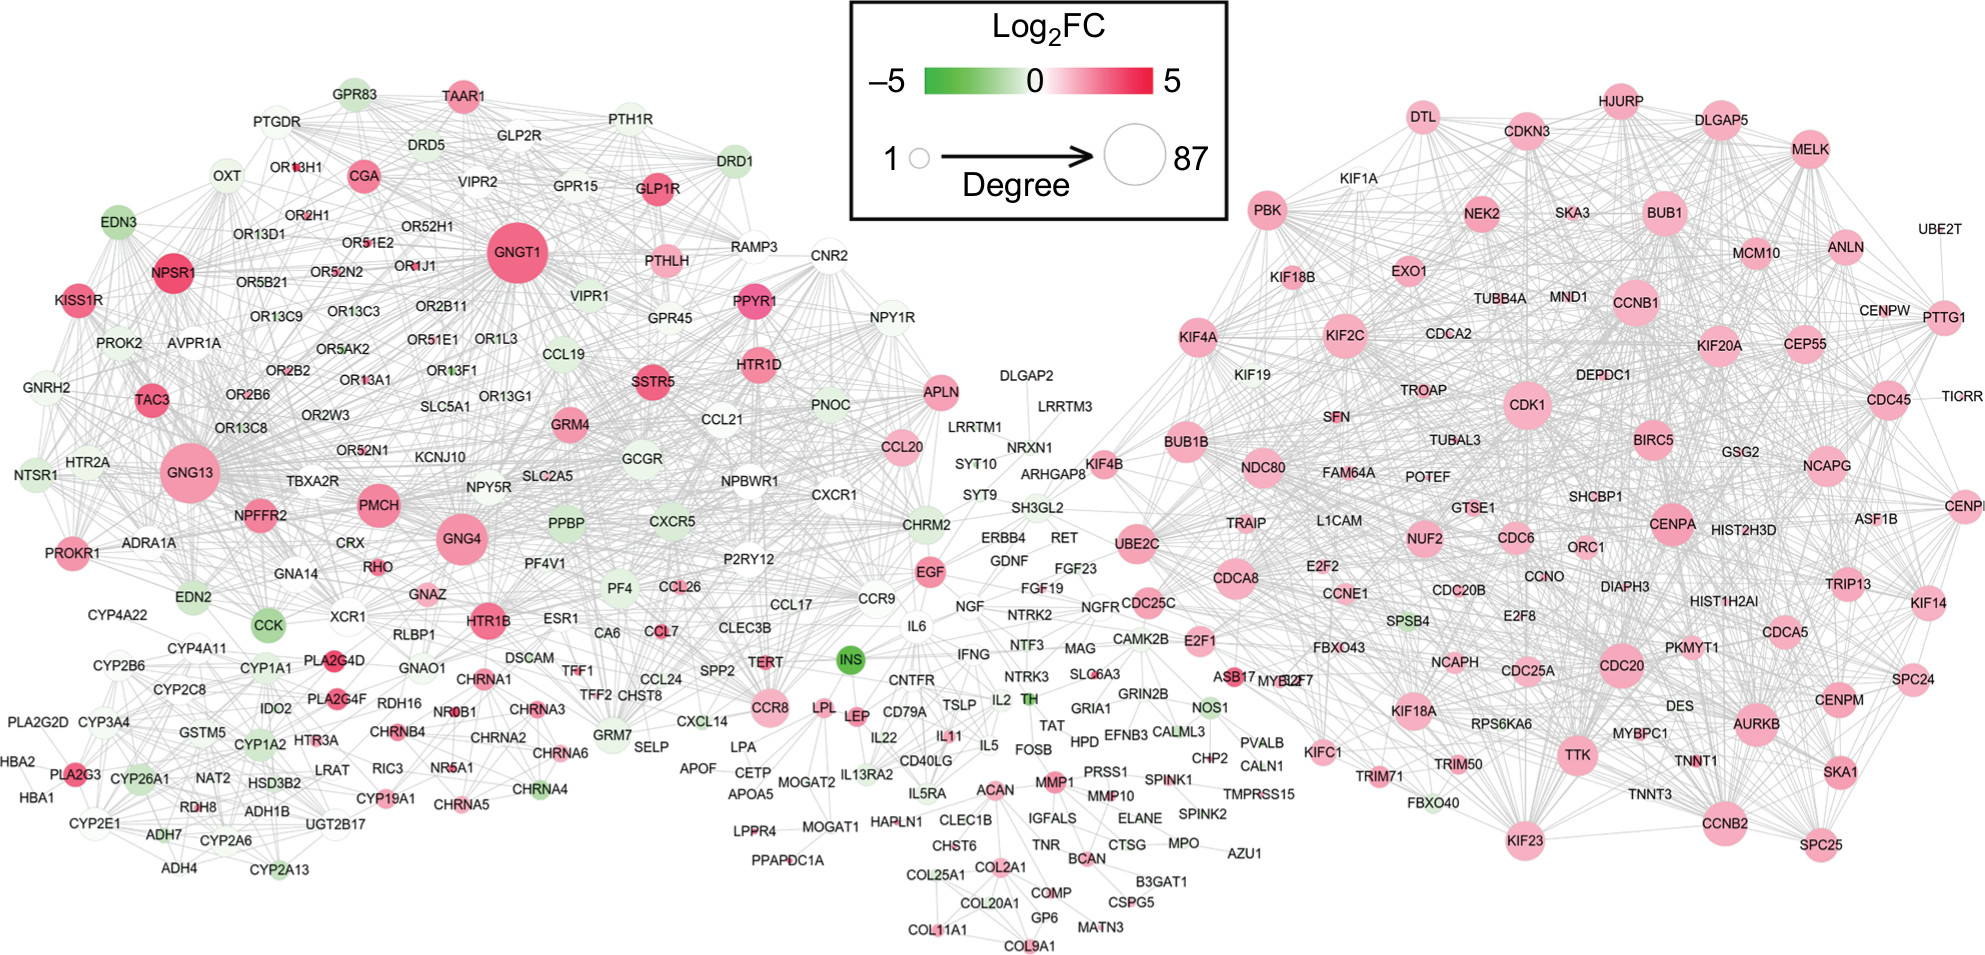 | Figure 3 Protein and protein interaction network for the differentially expressed genes. Notes: Red, upregulated; green, downregulated. The larger size of node (protein) indicates the higher degree (interaction relationships) of it. Abbreviation: FC, fold change. |
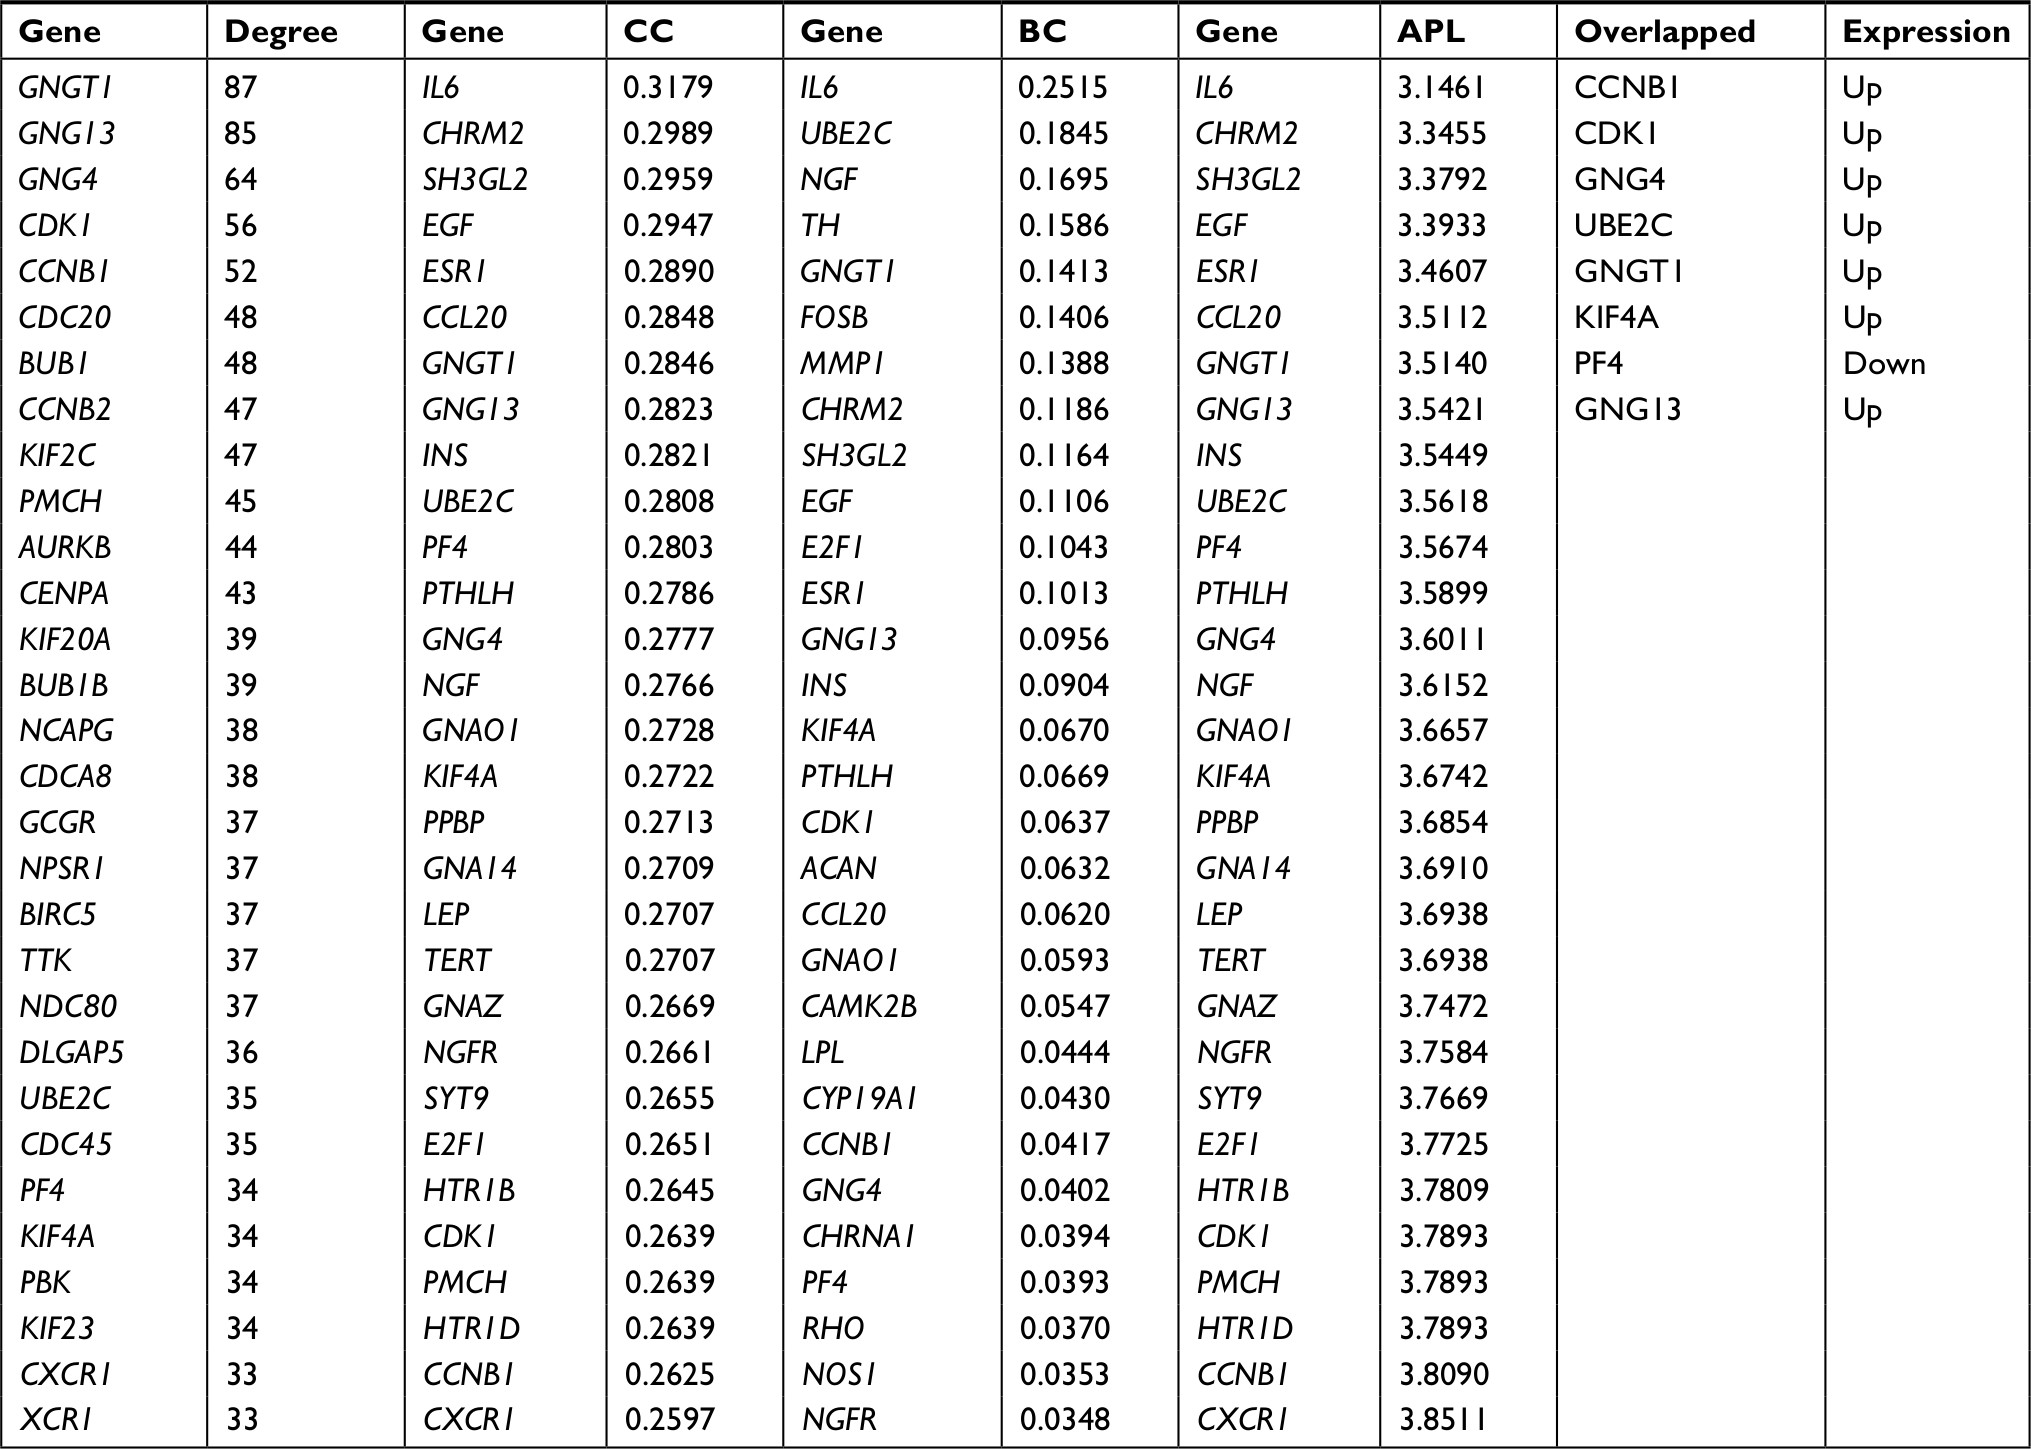 | Table 4 Topological features for each protein in PPI network Note: Top 30 genes were listed. Abbreviations: APL, average path length; BC, betweenness centrality; CC, closeness centrality; PPI, protein–protein interaction. |
Four significant functionally related modules (Figure 4) were subsequently screened using the MCODE, among which the module 1 was the most significant with score =14.474 and node =38, followed by module 2 with score =13.152 and node =46. Also, GO analysis of genes in modules 1 and 2 with BinGO plugin of Cytoscape indicated that they were involved in mitotic cell cycle (CCNB1, CDK1, BUB1, and UBE2C) and cell surface receptor-linked signaling pathway (PF4 and CXCR1) (Table 5).
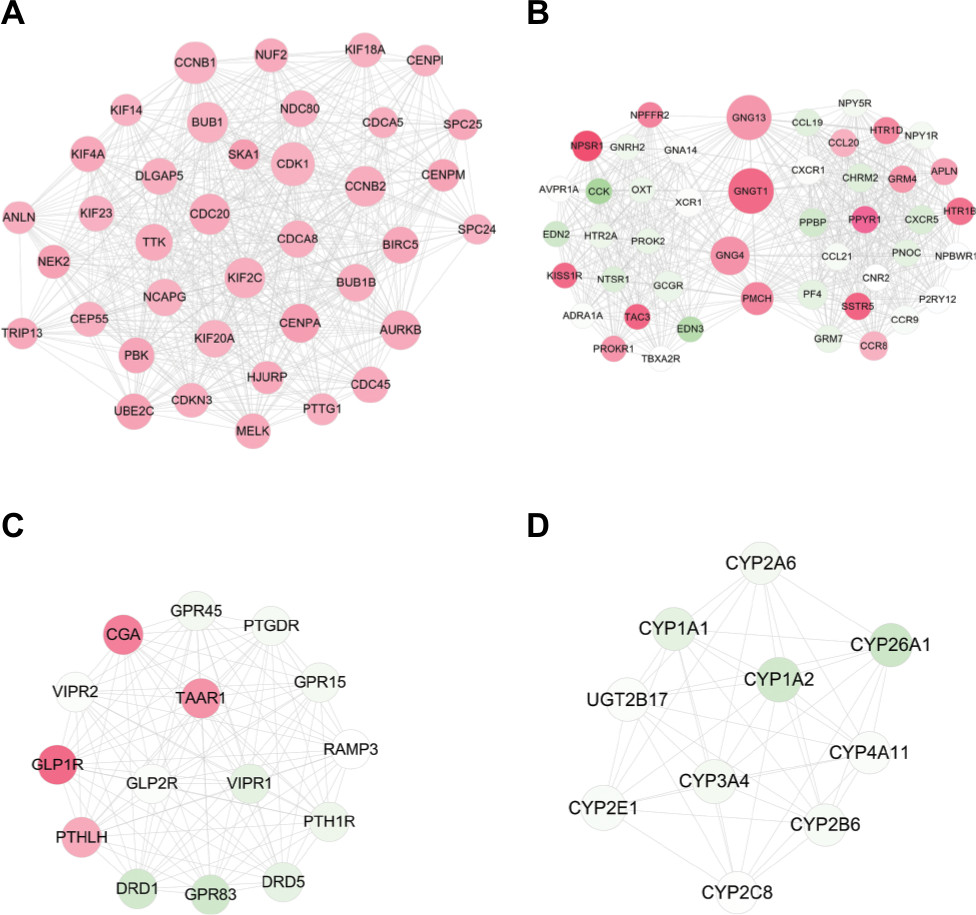 | Figure 4 Modules extracted from the protein and protein interaction network. Notes: (A) module 1; (B) module 2; (C) module 3; and (D) module 4. Red, upregulated; green, downregulated. The larger size of node (protein) indicates the higher degree (interaction relationships) of it. |
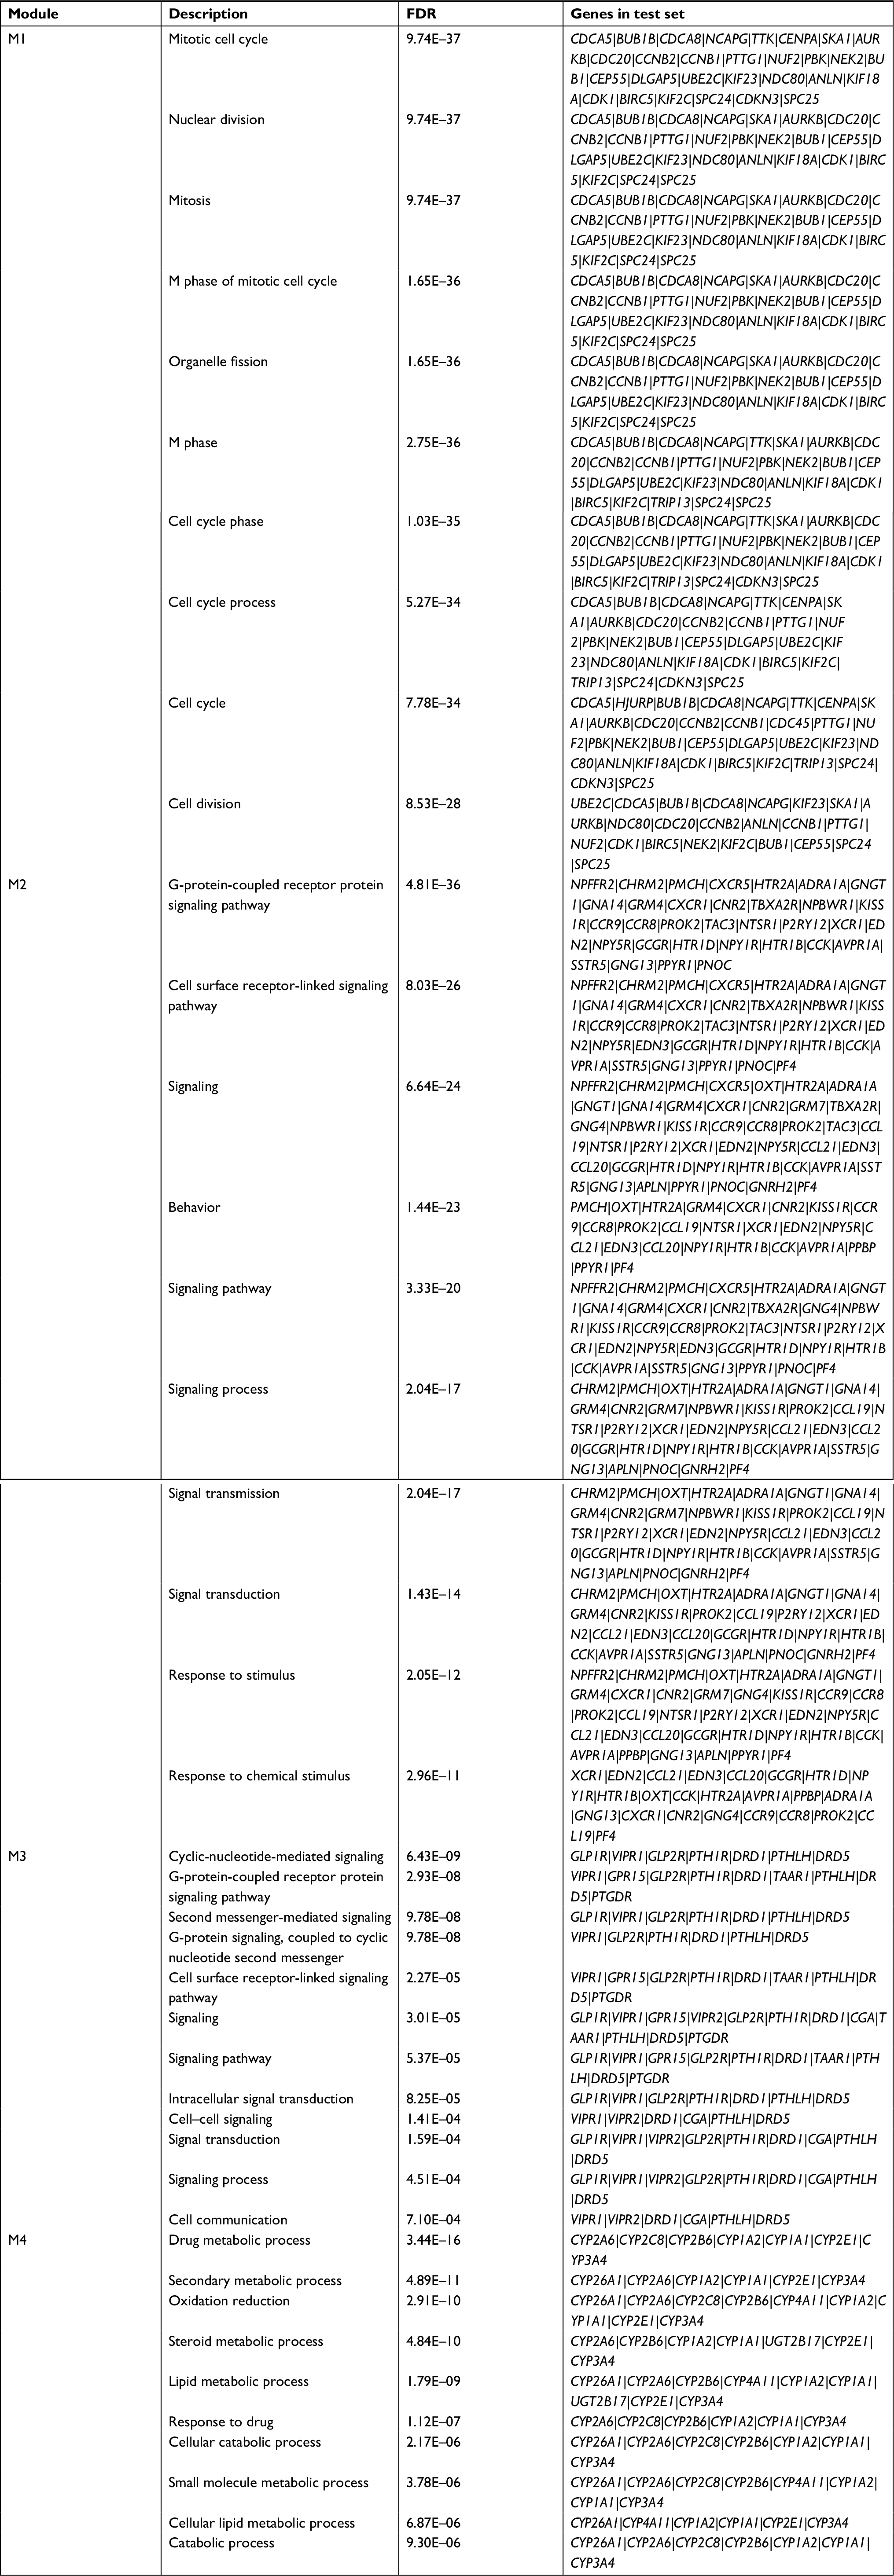 | Table 5 BinGO enrichment for genes in modules Abbreviation: FDR, false discovery rate. |
CeRNA network construction
By searching the miRcode database, 14 DELs–DEMs interaction relationship pairs (including five DELs, all upregulated, and 10 DEMs, five upregulated and five downregulated) were predicted, which were used for constructing the DELs–DEMs network. Subsequently, the target genes of these 10 DEMs were predicted with the miRwalk database. After removal of the positive–negative relationships between DEMs and DEGs, 113 DELs–DEMs interaction relationship pairs (including eight DEMs, three upregulated and five downregulated, and 82 DEGs, 67 upregulated and 15 downregulated) were left for constructing the DEMs–DEGs network. By integrating the DELs–DEMs network and DEMs–DEGs network, a DELs–DEMs–DEGs ceRNA network was established containing 95 nodes (five DELs, eight DEMs, and 82 DEGs) and 239 edges (14 DELs–DEMs, 113 DELs–DEGs, and 112 DEGs–DEGs) (Figure 5).
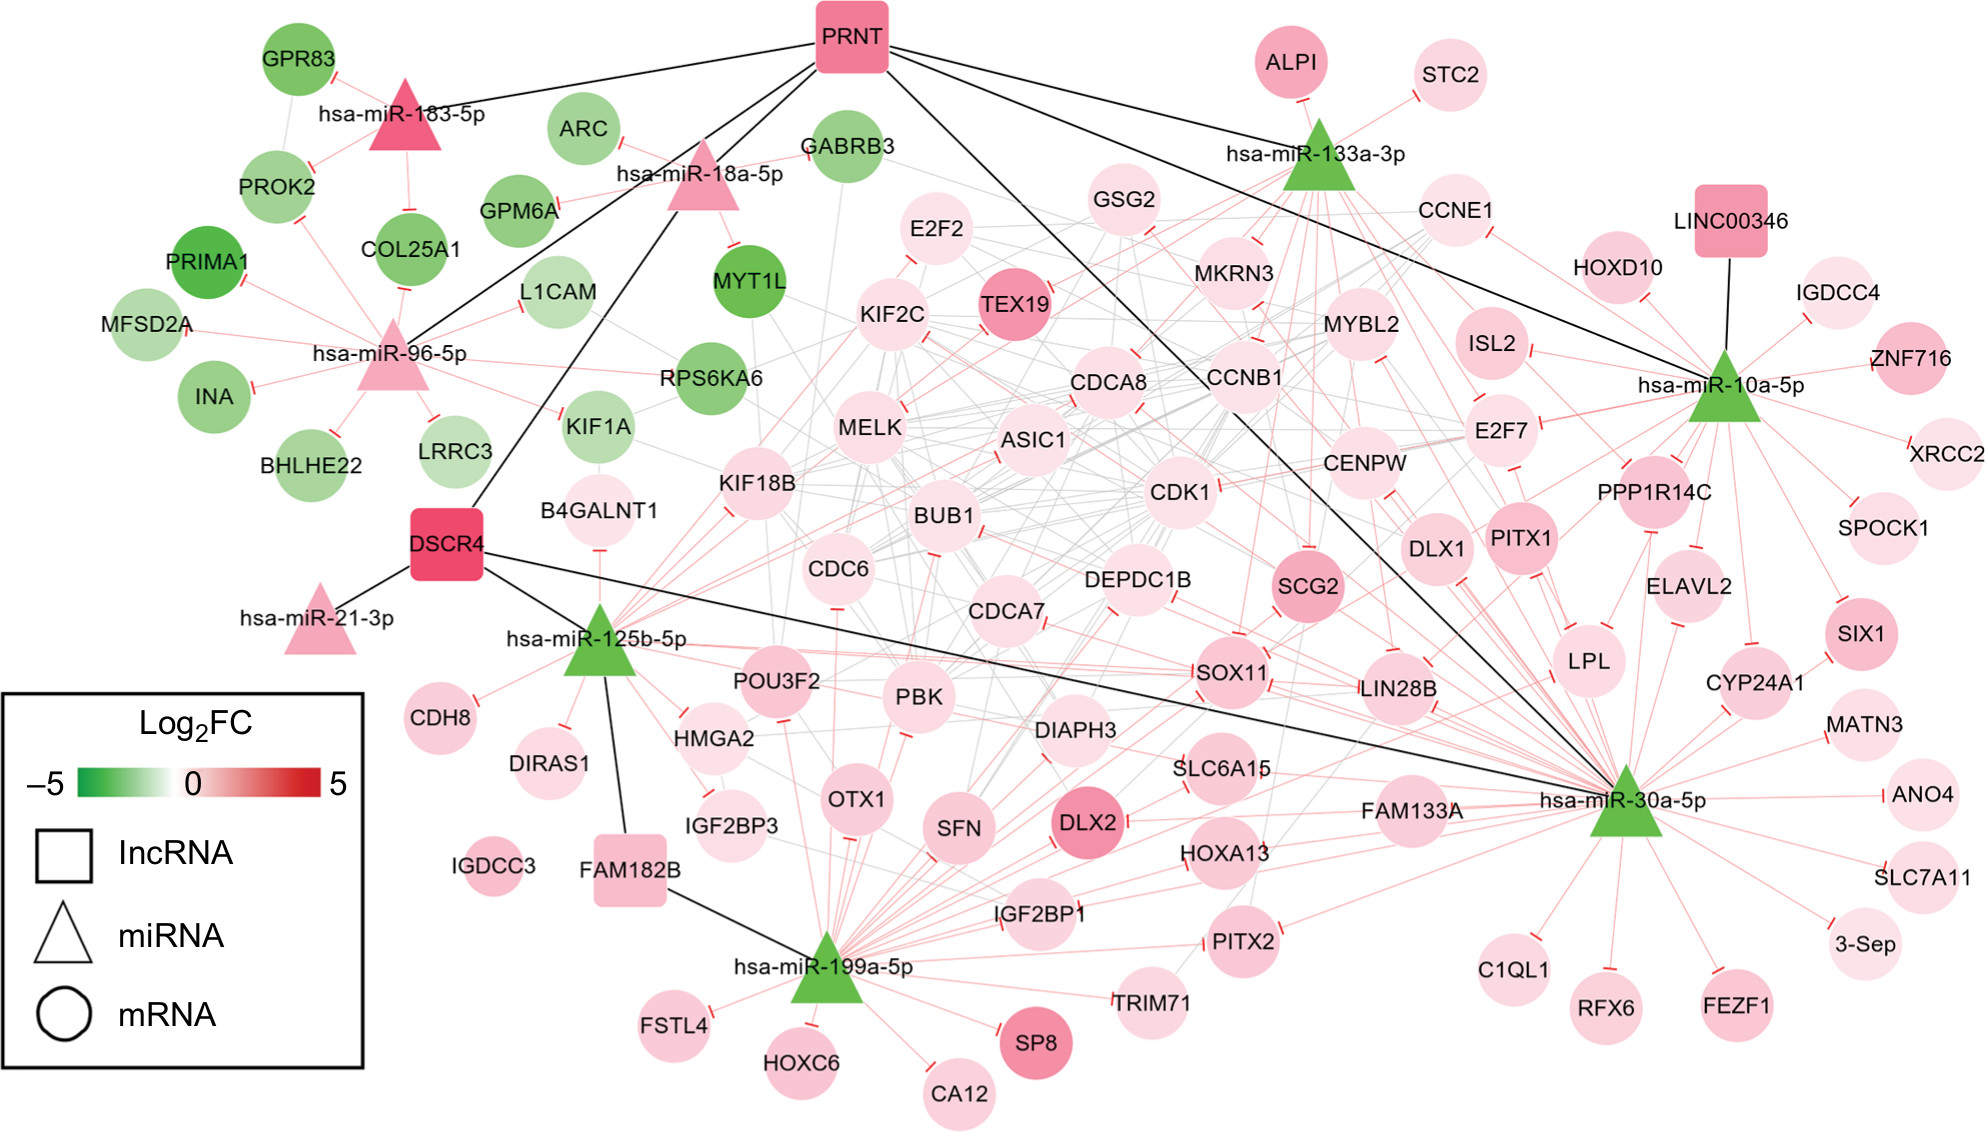 | Figure 5 ceRNAs interaction network of lncRNA–miRNA–mRNA. Notes: Square nodes represent lncRNAs; triangle nodes represent miRNAs; circular nodes represent mRNAs. Red, upregulated; green, downregulated. Abbreviation: FC, fold change. |
Function enrichment analysis with DAVID showed the genes in the ceRNA network participated in four significant KEGG pathways, including cell cycle, p53 signaling pathway, neuroactive ligand–receptor interaction, and pathways in cancer (Table 6). By searching the CTD database with “Hepatocellular Carcinoma” as the keyword, 244 KEGG pathways were found to be associated with HCC. Among them, three were common with the enrichment results of the genes in the ceRNA network, including cell cycle (CCNE1, E2F2, and CDK1), p53 signaling pathway (CCNE1 and CDK1), and pathways in cancer (E2F2). Thus, the DELs–DEMs–DEGs interaction relationship pairs associated with these three pathways were extracted to form the HCC-related ceRNA network (Figure 6), in which four DELs (DSCR4, FAM182B, PRNT, and LINC00346), five DEMs (hsa-miR-199a-5p, hsa-miR-30a-5p, hsa-miR-125b-5, hsa-miR-10a-5p, and hsa-miR-133a-3p), and seven DEGs (CDC6, CCNE1, CDK1, E2F2, BUB1, CCNB1, and SFN) were involved.
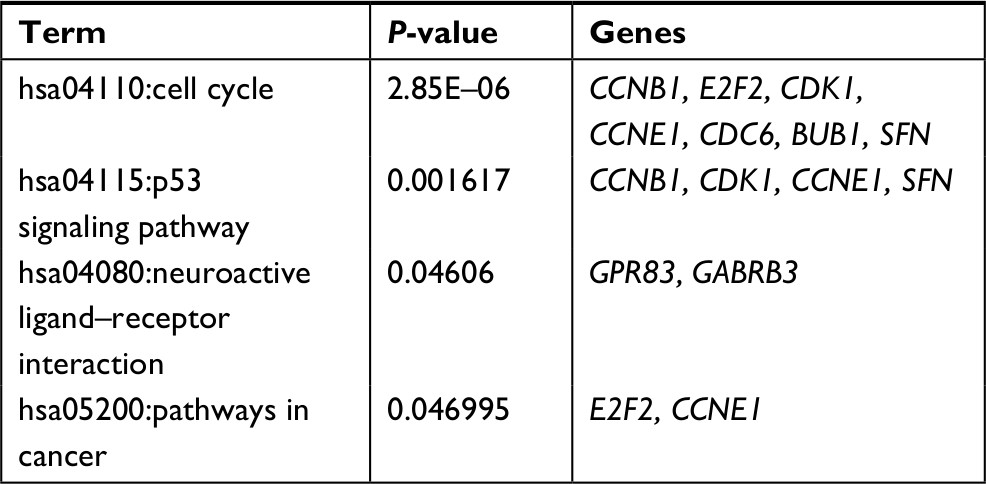 | Table 6 KEGG pathways for genes in ceRNA network Abbreviation: KEGG, Kyoto Encyclopedia of Genes and Genomes. |
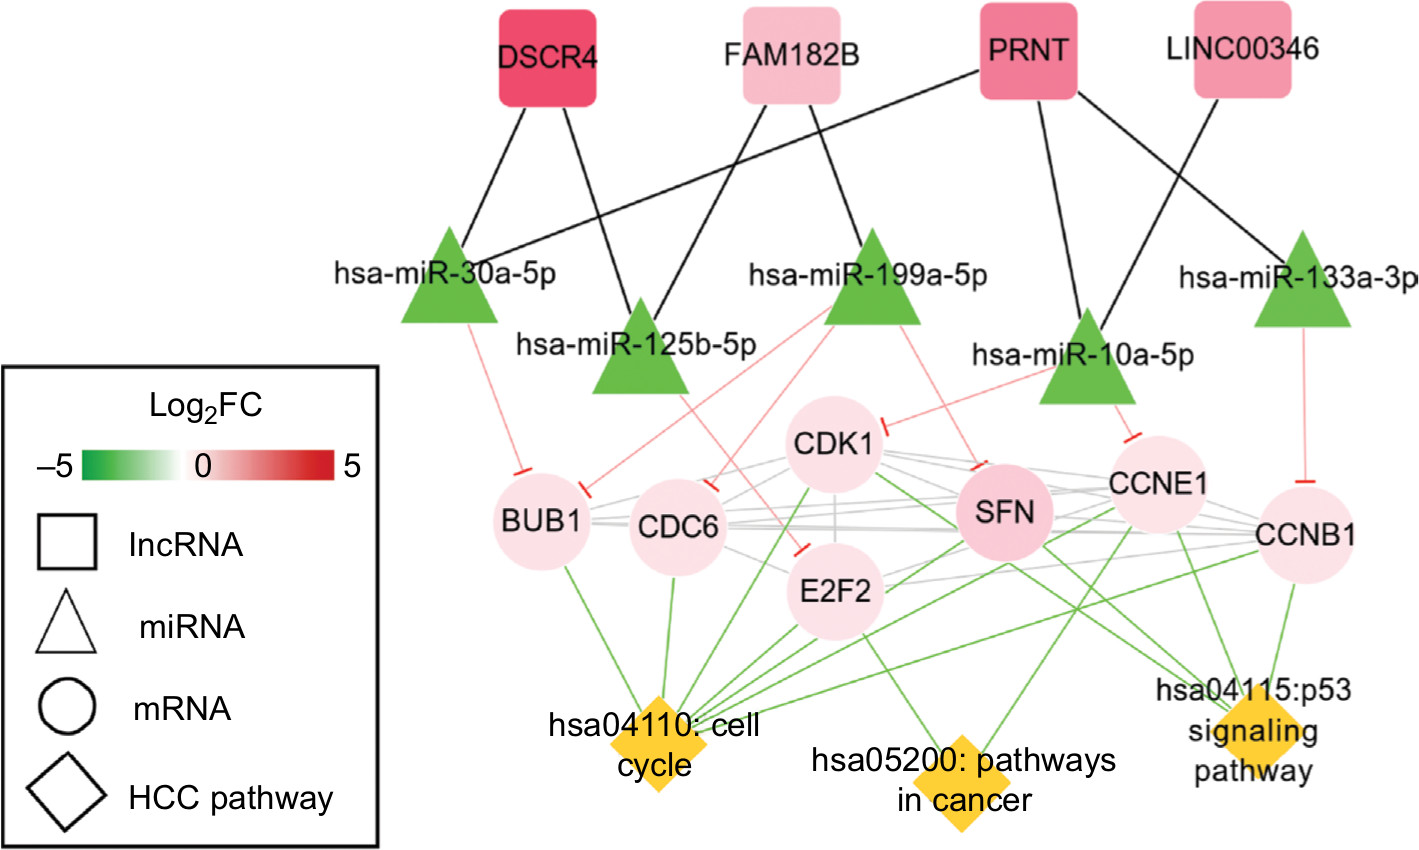 | Figure 6 HCC-related ceRNAs interaction network of lncRNA–miRNA–mRNA. Notes: Square nodes represent circRNAs, triangle nodes represent miRNAs, circular nodes represent mRNAs, and rhombus nodes represent HCC pathways. Red, upregulated; green, downregulated. Abbreviations: FC, fold change; HCC, hepatocellular carcinoma. |
Prognosis prediction for DELs, DEMs, and DEGs
Ninety-eight HBV-related HCC samples, which have been used for mRNA and miRNA sequencing, were collected from TCGA database. Univariate Cox regression analysis was then used to screen OS- and RFS-related DELs, DEMs, and DEGs from HCC-related ceRNA network in these samples. The results showed that two DELs, four DEMs, and seven DEGs were significantly associated with OS, but only five DEGs were significantly associated with RFS (Table 7). KM curve was subsequently drawn according the expression level of each DEL, DEM, and DEG in the sequencing data. In line with the Cox regression analysis results, KM curve analysis also (Figure 7) showed that two DELs (FAM182B and LINC00346), four DEMs (hsa-miR-30a-5p, hsa-miR-125b-5p, hsa-miR-10a-5p, and hsa-miR-133a-3p), and seven DEGs (CDC6, CCNE1, CDK1, E2F2, BUB1, CCNB1, and SFN) were significantly associated with OS but not PRNT (expression value =0 in TCGA data), DSCR4 (P=0.493), and hsa-miR-199a-5p (P=0.101). Also, all the relationships between their expressions and the prognosis results were in line with our expectation, that is, patients with the high expression of the DELs and DEGs (all were upregulated genes in HBV-related HCC) had the poor survival, while patients with the high expression of DEMs (all were downregulated genes in HBV-related HCC) possessed excellent survival. As shown in Figure 8, KM curve analysis also showed that the highly expressed five DEGs (CDC6, CDK1, BUB1, CCNB1, and SFN) were significantly associated with RFS.
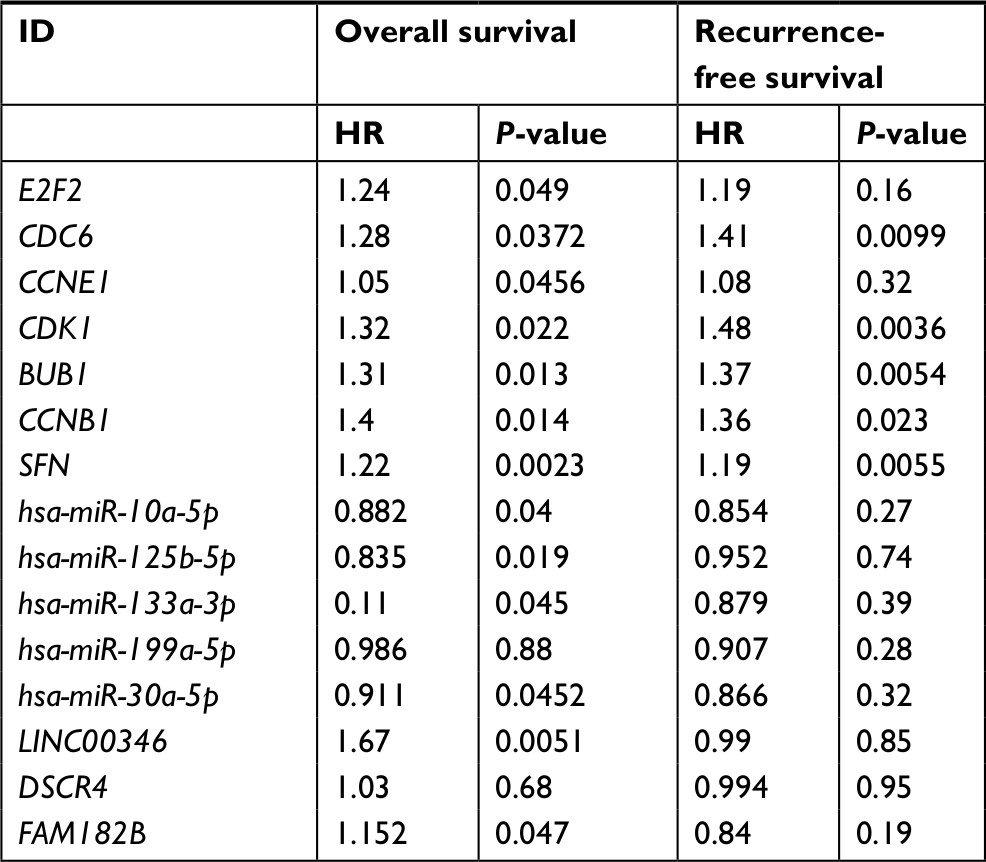 | Table 7 Cox regression analysis to screen survival-related genes |
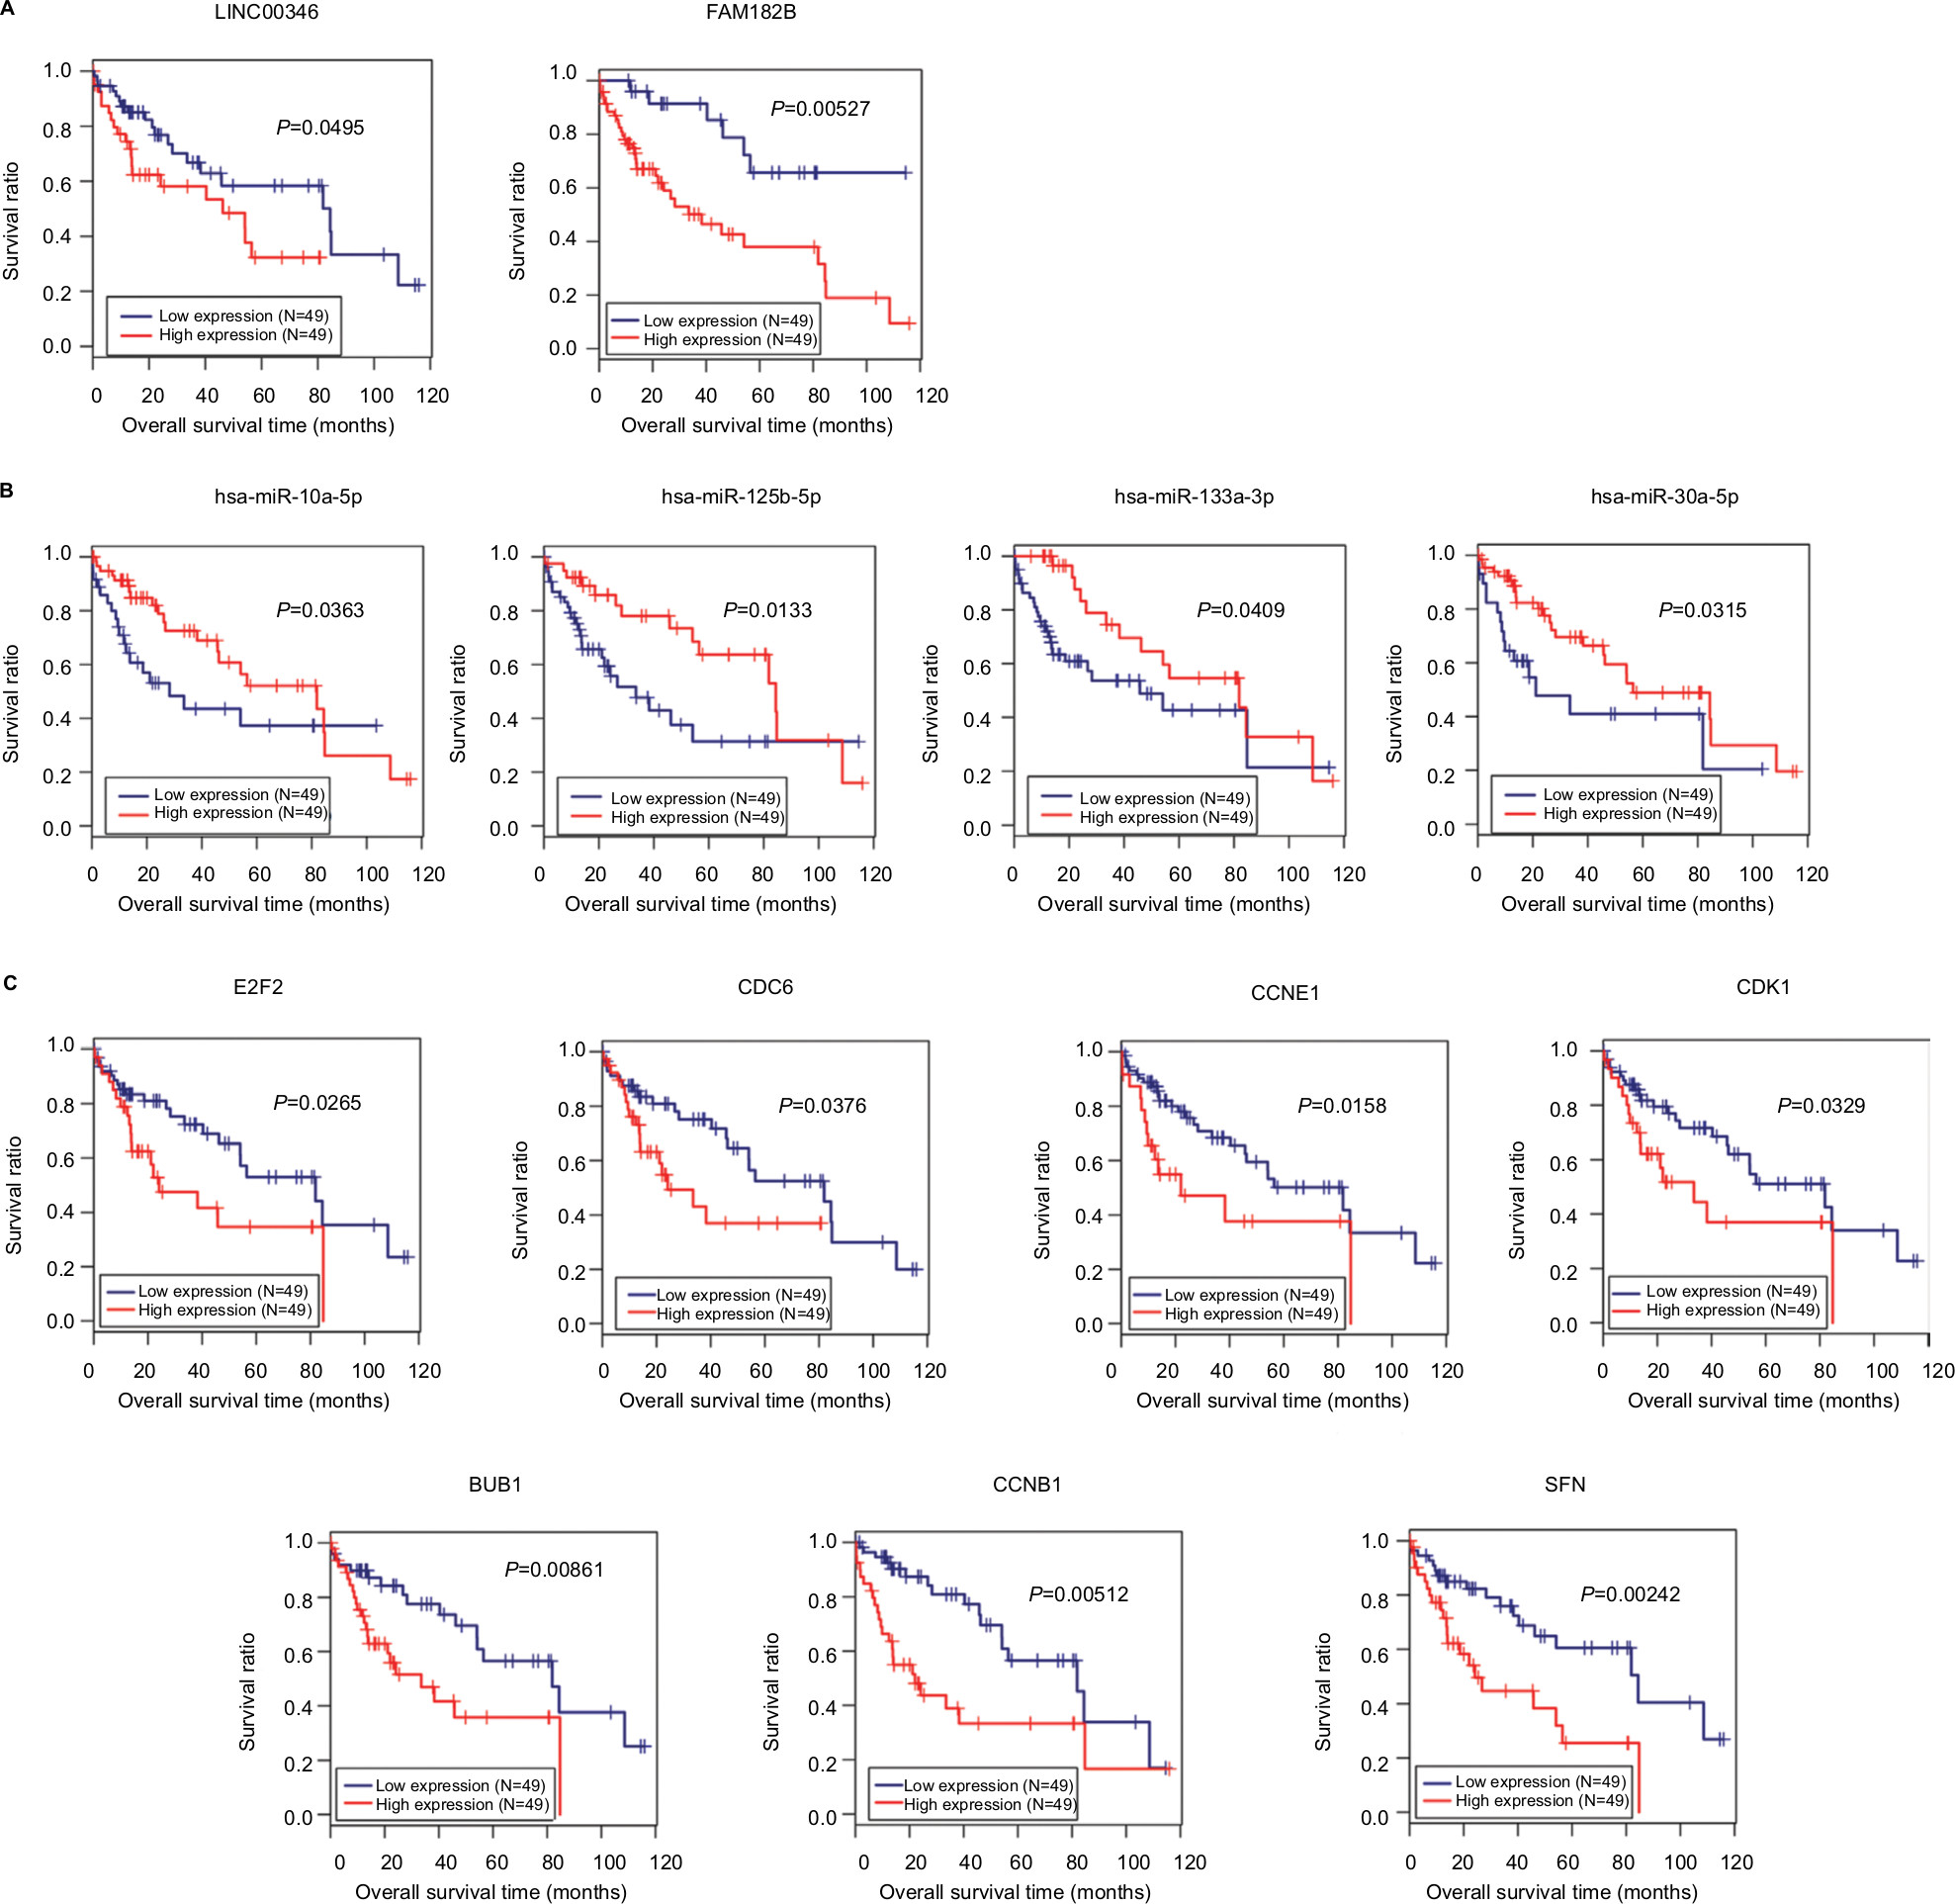 | Figure 7 Kaplan–Meier analysis to display the correlation of differentially expressed lncRNAs (A), miRNAs (B), and genes (C) with overall survival outcomes for patients with HBV-related HCC. Abbreviations: HBV, hepatitis B virus; HCC, hepatocellular carcinoma. |
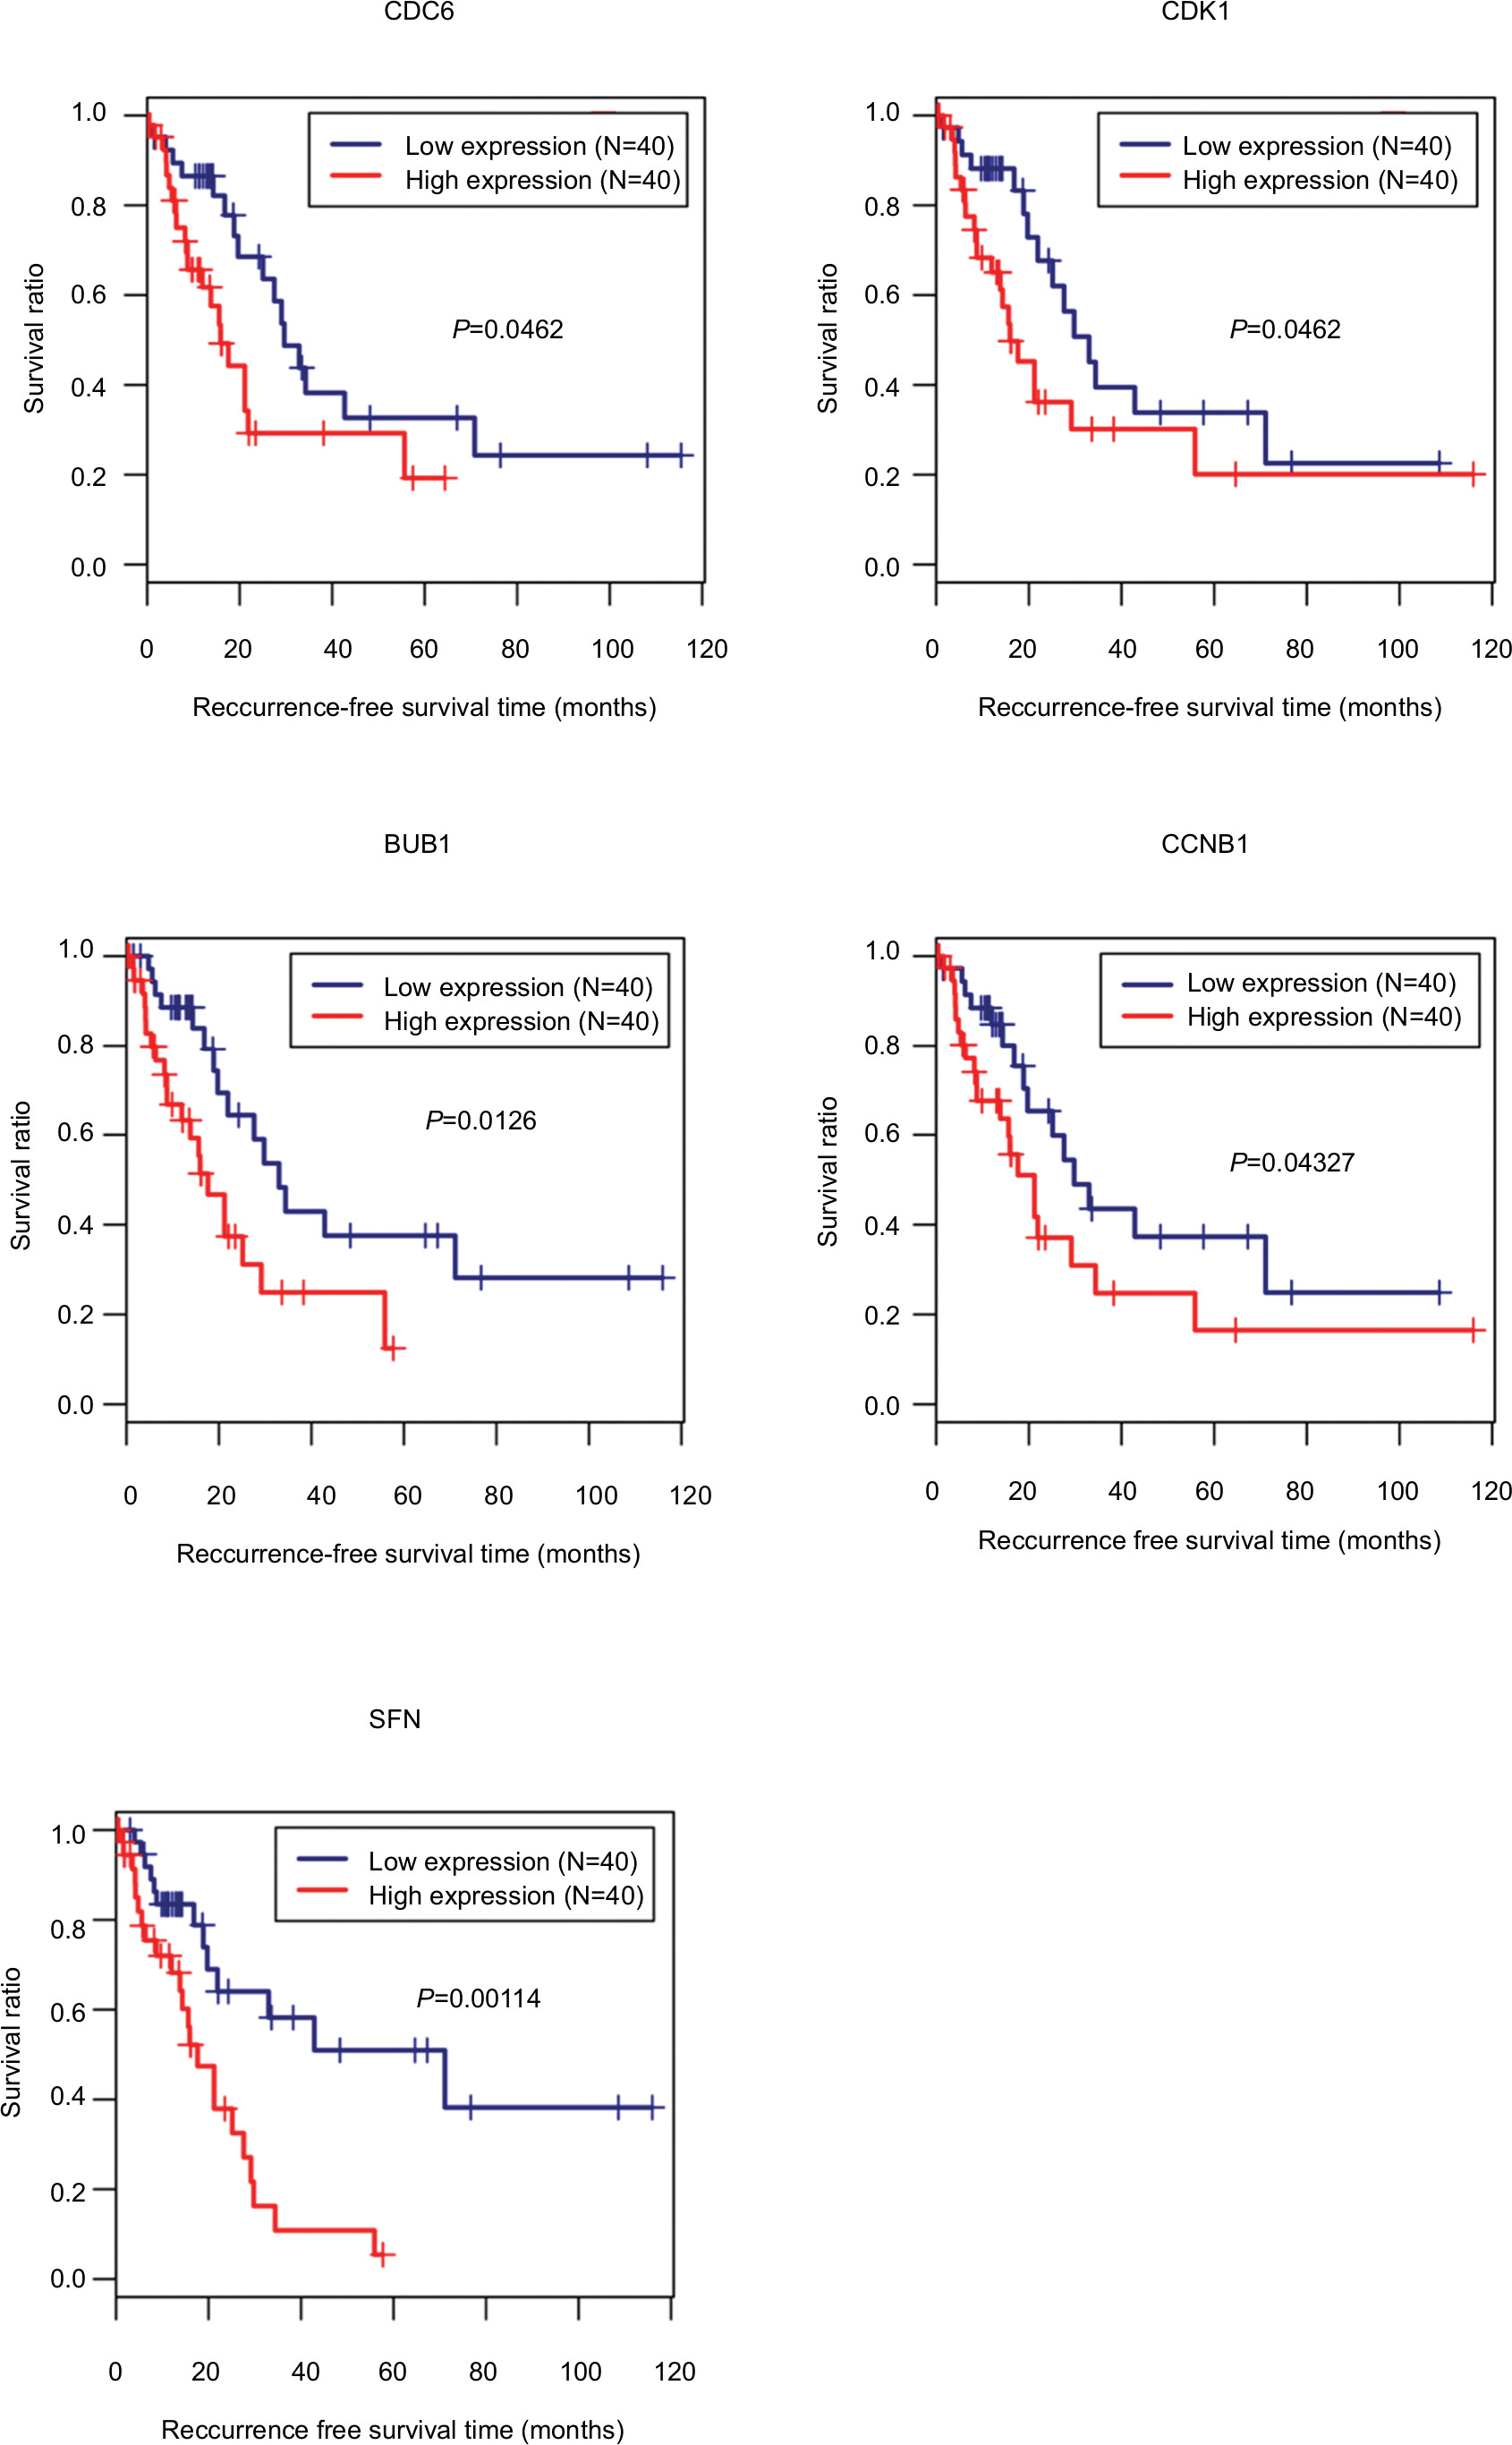 | Figure 8 Kaplan–Meier analysis to display the correlation of differentially expressed genes with recurrence-free survival outcomes for patients with HBV-related HCC. Abbreviations: HBV, hepatitis B virus; HCC, hepatocellular carcinoma. |
Further combination with their interaction relationships in the ceRNA network suggested that FAM182B-miR-125b-5p-E2F2 and LINC00346-miR-10a-5p-CDK1/CCNE1 ceRNA axes were especially important for the development and prognosis of HBV-related HCC.
Validation of expressions of crucial DELs, DEMs, and DEGs in ceRNA network
The upregulation of LINC00346, CDK1, and CCNE1 but the downregulation of miR-10a-5p and miR-125b-5p was also validated in other microarray datasets and TCGA data. FAM182B was not found to be differentially expressed in GSE27462 and TCGA data. E2F2 was demonstrated to be differentially expressed in GSE94660, GSE25599, and TCGA data but not in GSE121248 (Table 8). These findings indicated that LINC00346-miR-10a-5p-CDK1 ceRNA axis may be a potentially verifiable mechanism for HBV-related HCC.
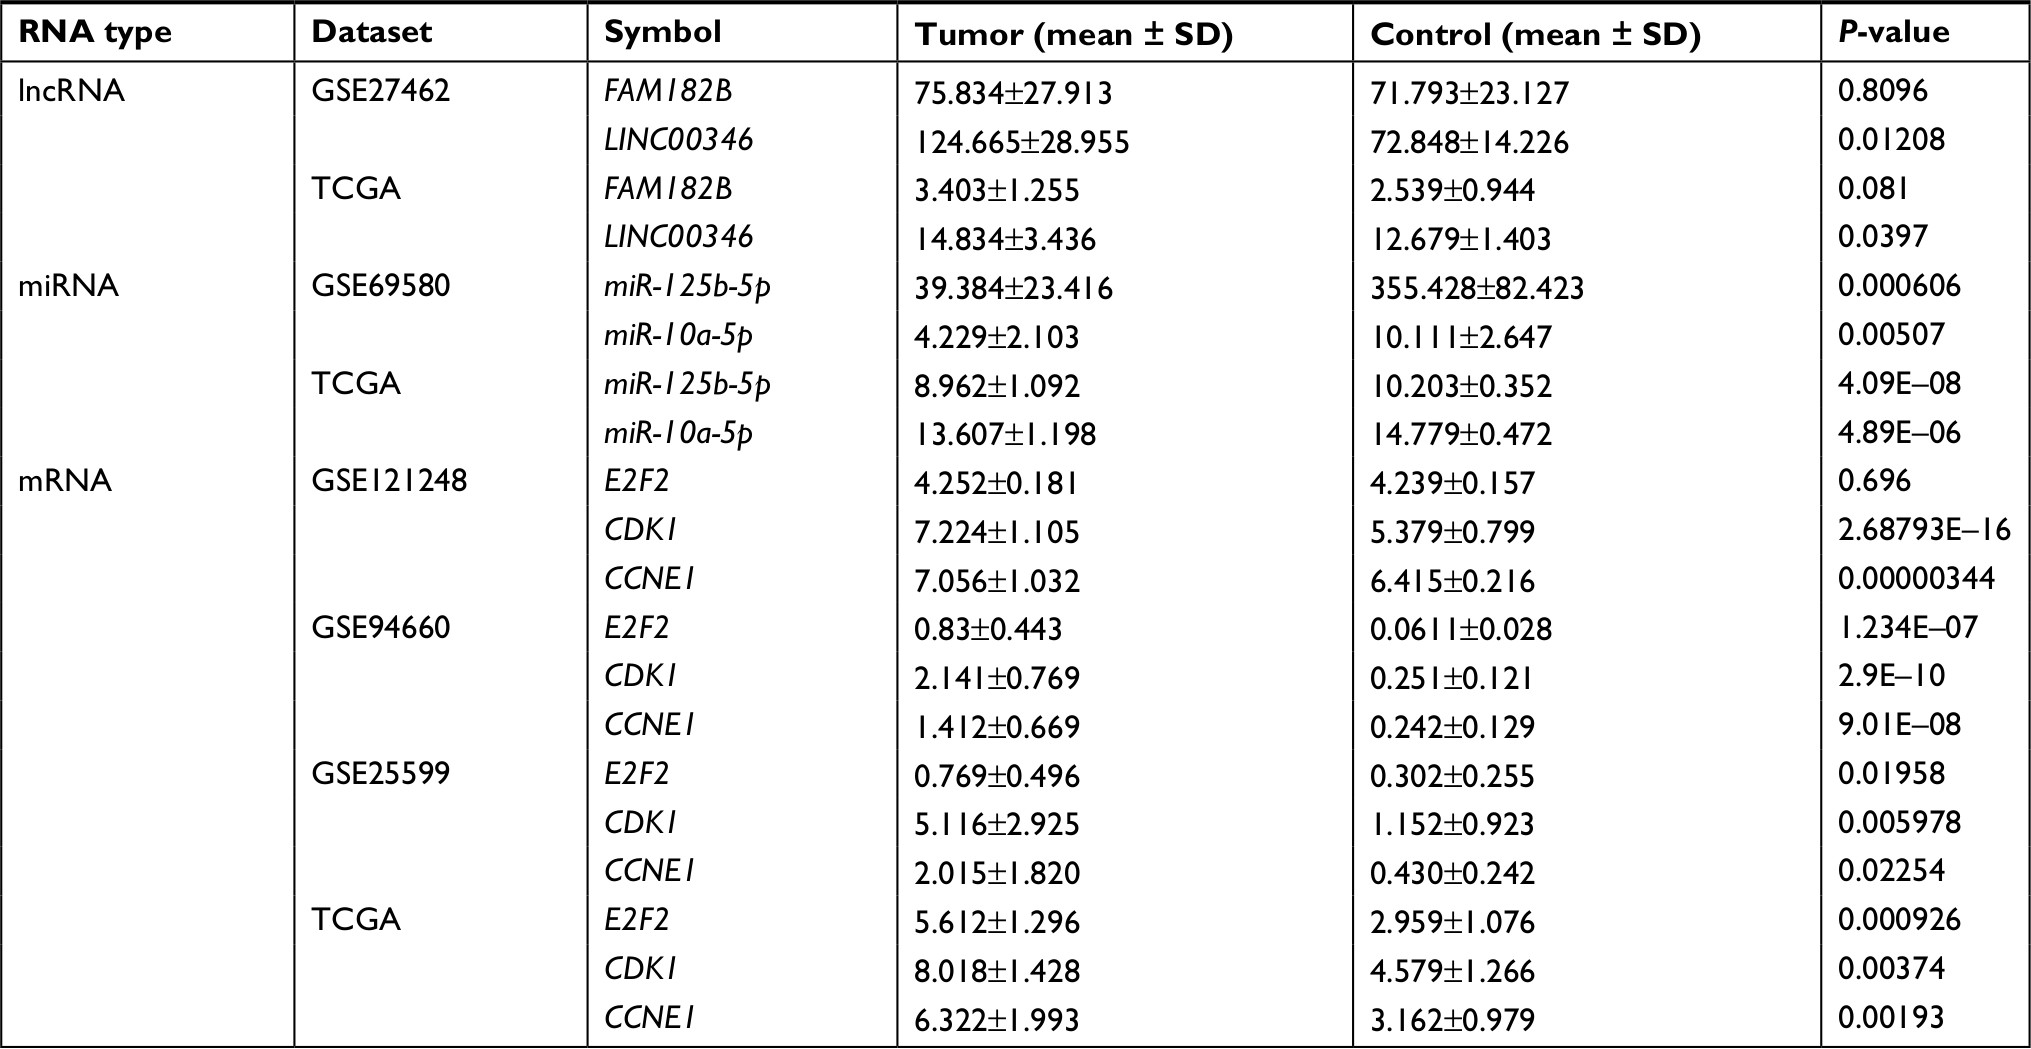 | Table 8 Confirmation of expressions of crucial lncRNAs, miRNAs, and mRNAs using other datasets Abbreviation: TCGA, The Cancer Genome Atlas. |
Discussion
In the present study, we identified FAM182B-miR-125b-5p-E2F2 and LINC00346-miR-10a-5p-CDK1/CCNE1 ceRNA axes as important mechanisms for the development of HBV-related HCC. They were involved in HBV-related HCC by influencing cell cycle. Also, the genes in these two axes were significantly associated with the OS of patients. LINC00346-miR-10a-5p-CDK1 may be especially crucial because CDK1 was considered as a hub gene in the PPI network and was also associated with RFS as well as the expressions of all of them confirmed in other datasets.
Numerous studies have shown that HBV infection of hepatocytes promotes cell cycle progression by accelerating G1/S and G2/M transition and thus increases cell proliferation ability, ultimately inducing the development of HCC.35,36 It is well accepted that CCNE1 is a positive regulator of G1/S phase transition37 and CCNB1 is required for G2/M transition and mitosis resumption by forming a maturation promoting factor with CKD1.38 Transcriptional factor E2F2 can be activated by Cyclin-CDK enzymatic complex after phosphorylating the protein retinoblastoma (Rb), which promotes the transcription of E2F2 target genes to regulate the G1/S-phase transition.39 Thus, CCNE1, CCNB1, CKD1, and E2F2 genes are suggested to be upregulated in HBV-related HCC. These hypotheses have been demonstrated by previous studies. For example, Sung et al40 used the RNA sequencing (RNA-seq) and Sanger sequencing to confirm that CCNE1 gene was highly expressed in HBV integrated tumors compared with adjacent normal tissue. Chin et al41 observed that delivery of a replication competent HBV genome into hepatocyte lines Huh7 and PMH induced the expression of CCNB1. Cheng et al42 also used in vitro experiments to prove HBV persistently activated the CCNB1-CDK1 kinase in HCC cells. In line with these studies, our study also found CCNE1, CCNB1, and CKD1 were upregulated in tumor samples of patients with HBV-related HCC and the high expression of them predicted poor prognosis. The CKD1 may be especially important because it was associated with both OS and RFS. Although there was a study to indicate E2F2 upregulation in HCC,43 its relationship with HBV has not been investigated. Our study may be the first to reveal that HBV infection may trigger E2F2 upregulation and lead to the development of HCC and poor prognosis for patients. miRNAs are the class of small RNAs (18–25 nucleotides) that downregulate target gene expressions via binding to the 3′-untranslated region (UTR). Thus, the upregulation of cell cycle-related genes may be attributed to the downregulation of miRNAs. In this study, we also investigated the DEMs between tumor and normal samples and predicted their interaction with target genes by the miRwalk database. Our results indicated that miR-10a-5p and miR-125b-5p could regulate CDK1/CCNE1 and E2F2, respectively. There have studies to explore the miRNAs to regulate these target genes in HCC, such as miR-7/497/195-CCNE1,44,45 miR-582-5p-CDK1,46 and miR-214/490-E2F2,47,48 but not focused on the relationships of our prediction. However, the studies on the expressions of miR-10a-5p and miR-125b-5p in HCC may indirectly illuminate their underlying negative relations. Zhu et al49 identified the DEMs in seven paired specimens of HCC using the microarray technique and found that miR-10a-5p and miR-125b-5p were significantly downregulated. Overexpression of miR-10a50 and miR-125b51 was reported to suppress the metastasis of HCC cells in vivo. In line with these studies, our study also showed that miR-10a-5p and miR-125b-5p were downregulated in HBV-related HCC and high expression of them predicted excellent prognosis. lncRNAs are proposed to act as a ceRNA to involve in the regulation effects of miRNAs on the expression of target genes. Thus, the upregulation of cell cycle-related genes may also be attributed to the upregulation of lncRNAs that sponged the miRNAs. In this study, we also investigated the DELs between tumor and normal samples and predicted their interaction with miRNAs by the miRcode database. Our results indicated that upregulated FAM182B and LINC00346 may regulate cell cycle-related genes by interacting with miR-125b-5p and miR-10a-5p, resulting in poor prognosis. In line with our study, there has been a study to demonstrate that LINC00346 was upregulated in bladder cancer tissues compared to normal tissues. Knockdown of LINC00346 inhibited bladder cancer cell proliferation and migration and induced cell cycle arrest and cell apoptosis.52 The high expression of LINC00346 was also found to be significantly associated with poor OS in HCC53 and breast cancer samples.54 Nevertheless, no studies were performed to investigate the interaction of LINC00346 with miRNAs. Also, any investigation related to FAM182B has not been found until now. These implied that our identified ceRNA axes (FAM182B-miR-125b-5p-E2F2 and LINC00346-miR-10a-5p-CDK1/CCNE1) may be novel mechanisms for HBV-related HCC.
There were some limitations in this study. First, our study has preliminarily predicted that these ceRNA axes may be associated with the development of HBV-related HCC and some of them were confirmed in some other microarray datasets. Thus, further clinical, in vitro (dual luciferase reporter assay), and in vivo (loss of function) experiments are necessary to validate the expressions of controversial genes (such as FAM182B and E2F2) and regulatory relationships between DELs and DEMs as well as between DEMs and DEGs, and their roles for the proliferation, metastasis, and invasion of HBV infection hepatocytes. Second, there were no clinical data in our used datasets (GSE77509 and GSE76903) and, thus, we only preliminarily predicted the associations between prognosis (OS and RFS) and each of our identified DEL/DEM/DEG using TCGA data via univariate cox regression analysis. Whether these genes were independent biomarkers needed further clinical trials with multivariate Cox’s model that integrated all the clinical information (such as HBV DNA level, liver function parameters, pathologic stage, pathologic node, and pathologic metastasis, grade, therapeutic strategies including hepatectomy, radiofrequency ablation, and solafenib)55–57 and all DELs/DEMs/DEGs expression levels.
Conclusion
The present study preliminarily indicates that FAM182B and LINC00346 may be novel prognostic biomarkers and therapeutic targets for HBV-associated HCC. They function as a ceRNA to sponge miR-125b-5p and miR-10a-5p to de-repress cell cycle-related genes (E2F2, CDK1, and CCNE1) and promote the cell growth of HCC cells.
Ethics approval and informed consent
As the data used in this study were downloaded from GEO or TCGA database, and no human experiment was involved in this study, there were no ethical approval and informed consent. Thus, the principles of the Declaration of Helsinki were also not followed.
Availability of data and materials
All the microarray data were downloaded from the GEO database in NCBI (http://www.ncbi.nlm.nih.gov/geo/). The mRNA and miRNA Seq-data were obtained from TCGA (https://tcga-data.nci.nih.gov/).
Author contributions
HL and ZB participated in the conception and design of this study. HL and XZ performed the acquisition of data. CL and CS were involved in the analysis and interpretation of data. HL and CL performed the statistical and bioinformatics analyses. HL drafted the manuscript. ZB revised the manuscript for important intellectual content. All authors read and approved the final manuscript. All authors contributed toward data analysis, drafting and critically revising the paper and agree to be accountable for all aspects of the work.
Disclosure
The authors report no conflicts of interest in this work.
References
Chen W, Zheng R, Baade PD, et al. Cancer statistics in China, 2015. CA Cancer J Clin. 2016;66(2):115–132. | ||
Li J, Huang L, Yan J, Qiu M, Yan Y. Liver resection for hepatocellular carcinoma: personal experiences in a series of 1330 consecutive cases in China. ANZ J Surg. 2018;88(10):E713–E717. | ||
Li Y, Zhang Z, Shi J, et al. Risk factors for naturally-occurring early-onset hepatocellular carcinoma in patients with HBV-associated liver cirrhosis in China. Int J Clin Exp Med. 2015;8(1):1205–1212. | ||
Xiang L, Liu K, Chen Y. Analysis of Risk Factors Associated with the Development of Hepatocellular Carcinoma in Chronic HBV-Infected Chinese: A Meta-Analysis. Int J Environ Res Public Health. 2016;13(6):604. | ||
Lin CL, Kao JH. Risk stratification for hepatitis B virus related hepatocellular carcinoma. J Gastroenterol Hepatol. 2013;28(1):10–17. | ||
Fan H, Zhang Q, Zhao X, Lv P, Liu M, Tang H. Transcriptomic profiling of long non-coding RNAs in hepatitis B virus-related hepatocellular carcinoma. Oncotarget. 2017;8(39):65421–65434. | ||
Mou Y, Wang D, Xing R, et al. Identification of long noncoding RNAs biomarkers in patients with hepatitis B virus-associated hepatocellular carcinoma. Cancer Biomark. 2018;23(1):95–106. | ||
Zuo K, Kong L, Xue D, Yang Y, Xie L. The expression and role of lncRNA AX800134 in hepatitis B virus-related hepatocellular carcinoma. Virus Genes. 2018;54(4):475–483. | ||
Lv D, Wang Y, Zhang Y, Cui P, Xu Y. Downregulated long non-coding RNA DREH promotes cell proliferation in hepatitis B virus-associated hepatocellular carcinoma. Oncol Lett. 2017;14(2):2025–2032. | ||
Yang F, Zhang L, Huo X-Song, et al. Long noncoding RNA high expression in hepatocellular carcinoma facilitates tumor growth through enhancer of zeste homolog 2 in humans. Hepatology. 2011;54(5):1679–1689. | ||
Salmena L, Poliseno L, Tay Y, Kats L, Pandolfi PP. A ceRNA hypothesis: the Rosetta Stone of a hidden RNA language? Cell. 2011;146(3):353–358. | ||
Li Y, Liu G, Li X, Dong H, Xiao W, Lu S. Long non-coding RNA SBF2-AS1 promotes hepatocellular carcinoma progression through regulation of miR-140-5p-TGFBR1 pathway. Biochem Biophys Res Commun. 2018;503(4):2826–2832. | ||
Sui J, Yang X, Qi W, et al. Long Non-Coding RNA Linc-USP16 Functions As a Tumour Suppressor in Hepatocellular Carcinoma by Regulating PTEN Expression. Cell Physiol Biochem. 2017;44(3):1188–1198. | ||
Lv J, Fan HX, Zhao XP, et al. Long non-coding RNA Unigene56159 promotes epithelial-mesenchymal transition by acting as a ceRNA of miR-140-5p in hepatocellular carcinoma cells. Cancer Lett. 2016;382(2):166–175. | ||
Mo Y, He L, Lai Z, et al. LINC01287/miR-298/STAT3 feedback loop regulates growth and the epithelial-to-mesenchymal transition phenotype in hepatocellular carcinoma cells. J Exp Clin Cancer Res. 2018;37(1):149. | ||
Fan H, Lv P, Mu T, et al. LncRNA n335586/miR-924/CKMT1A axis contributes to cell migration and invasion in hepatocellular carcinoma cells. Cancer Lett. 2018;429:89–99. | ||
Lan T, Ma W, Hong Z, Wu L, Chen X, Yuan Y. Long non-coding RNA small nucleolar RNA host gene 12 (SNHG12) promotes tumorigenesis and metastasis by targeting miR-199a/b-5p in hepatocellular carcinoma. J Exp Clin Cancer Res. 2017;36(1):11. | ||
Xie CR, Wang F, Zhang S, et al. Long Noncoding RNA HCAL Facilitates the Growth and Metastasis of Hepatocellular Carcinoma by Acting as a ceRNA of LAPTM4B. Mol Ther Nucleic Acids. 2017;9:440–451. | ||
Yang Y, Chen L, Gu J, et al. Recurrently deregulated lncRNAs in hepatocellular carcinoma. Nat Commun. 2017;8:14421. | ||
Povey S, Lovering R, Bruford E, Wright M, Lush M, Wain H. The HUGO Gene Nomenclature Committee (HGNC). Human Genetics. 2001;109(6):678–680. | ||
Nikolayeva O, Robinson MD. edgeR for differential RNA-seq and ChIP-seq analysis: an application to stem cell biology. Methods Mol Biol. 2014;1150:45–79. | ||
Pollard KS, Dudoit S, Laan MJ. Multiple testing procedures: the multtest package and applications to genomics. In: Gentleman R., Carey VJ, Huber W, Irizarry RA, Dudoit S, editors. Bioinformatics and Computational Biology Solutions Using R and Bioconductor. New York: Springer; 2005:249–271. | ||
Szklarczyk D, Franceschini A, Wyder S, et al. STRING v10: protein-protein interaction networks, integrated over the tree of life. Nucleic Acids Res. 2015;43(D1):D447–D452. | ||
Kohl M, Wiese S, Warscheid B. Cytoscape: software for visualization and analysis of biological networks. Methods Mol Biol. 2011;696:291–303. | ||
Tang Y, Li M, Wang J, Pan Y, Wu FX. CytoNCA: a cytoscape plugin for centrality analysis and evaluation of protein interaction networks. Biosystems. 2015;127:67–72. | ||
Bader GD, Hogue CW. An automated method for finding molecular complexes in large protein interaction networks. BMC Bioinformatics. 2003;4(1):2. | ||
Huang DW, Sherman BT, Lempicki RA. Systematic and integrative analysis of large gene lists using DAVID bioinformatics resources. Nat Protoc. 2009;4(1):44–57. | ||
Maere S, Heymans K, Kuiper M. BiNGO: a Cytoscape plugin to assess overrepresentation of gene ontology categories in biological networks. Bioinformatics. 2005;21(16):3448–3449. | ||
Jeggari A, Marks DS, Larsson E. miRcode: a map of putative microRNA target sites in the long non-coding transcriptome. Bioinformatics. 2012;28(15):2062–2063. | ||
Dweep H, Gretz N. miRWalk2.0: a comprehensive atlas of microRNA-target interactions. Nat Methods. 2015;12(8):697. | ||
Davis AP, Grondin CJ, Johnson RJ, Sciaky D, et al. The Comparative Toxicogenomics Database: update 2017. Nucleic Acids Res. 2017;45(D1):D972–D978. | ||
Yoo S, Wang W, Wang Q, et al. A pilot systematic genomic comparison of recurrence risks of hepatitis B virus-associated hepatocellular carcinoma with low- and high-degree liver fibrosis. BMC Med. 2017;15(1):214. | ||
Huang Q, Lin B, Liu H, et al. RNA-Seq analyses generate comprehensive transcriptomic landscape and reveal complex transcript patterns in hepatocellular carcinoma. PLoS One. 2011;6(10):e26168. | ||
Yang F, Zhang L, Huo XS, et al. Long noncoding RNA high expression in hepatocellular carcinoma facilitates tumor growth through enhancer of zeste homolog 2 in humans. Hepatology. 2011;54(5):1679–1689. | ||
Zheng BY, Gao WY, Huang XY, et al. HBx promotes the proliferative ability of HL-7702 cells via the COX-2/Wnt/β-catenin pathway. Mol Med Rep. 2018;17(6):8432–8438. | ||
Xia Y, Cheng X, Li Y, Valdez K, Chen W, Liang TJ. Hepatitis B virus deregulates cell cycle to promote viral replication and a premalignant phenotype. J Virol. 2018;92(19)):e00722–18pii:. | ||
Luo Q, Li X, Li J, et al. MiR-15a is underexpressed and inhibits the cell cycle by targeting CCNE1 in breast cancer. Int J Oncol. 2013;43(4):1212–1218. | ||
Fang Y, Yu H, Liang X, Xu J, Cai X. Chk1-induced CCNB1 overexpression promotes cell proliferation and tumor growth in human colorectal cancer. Cancer Biol Ther. 2014;15(9):1268–1279. | ||
Dimova DK, Dyson NJ. The E2F transcriptional network: old acquaintances with new faces. Oncogene. 2005;24(17):2810–2826. | ||
Sung WK, Zheng H, Li S, et al. Genome-wide survey of recurrent HBV integration in hepatocellular carcinoma. Nat Genet. 2012;44(7):765–769. | ||
Chin R, Earnest-Silveira L, Koeberlein B, et al. Modulation of MAPK pathways and cell cycle by replicating hepatitis B virus: Factors contributing to hepatocarcinogenesis. J Hepatol. 2007;47(3):325–337. | ||
Cheng P, Li Y, Yang L, et al. Hepatitis B virus X protein (HBx) induces G2/M arrest and apoptosis through sustained activation of cyclin B1-CDK1 kinase. Oncol Rep. 2009;22(5):1101–1107. | ||
Gnani D, Romito I, Artuso S, et al. Focal adhesion kinase depletion reduces human hepatocellular carcinoma growth by repressing enhancer of zeste homolog 2. Cell Death Differ. 2017;24(5):889–902. | ||
Furuta M, Kozaki K, Tanimoto K, et al. The tumor-suppressive miR-497-195 cluster targets multiple cell-cycle regulators in hepatocellular carcinoma. PLoS One. 2013;8(3):e60155. | ||
Zhang X, Hu S, Zhang X, et al. MicroRNA-7 arrests cell cycle in G1 phase by directly targeting CCNE1 in human hepatocellular carcinoma cells. Biochem Biophys Res Commun. 2014;443(3):1078–1084. | ||
Zhang Y, Huang W, Ran Yet al. miR-582-5p inhibits proliferation of hepatocellular carcinoma by targeting CDK1 and AKT3. Tumour Biol. 2015;36(11):8309–8316. | ||
Wang P, Chen S, Fang H, et al. miR-214/199a/199a* cluster levels predict poor survival in hepatocellular carcinoma through interference with cell-cycle regulators. Oncotarget. 2016;7(1):929–945. | ||
Fang ZQ, Li MC, Zhang YQ, Liu XG. MiR-490-5p inhibits the metastasis of hepatocellular carcinoma by down-regulating E2F2 and ECT2. J Cell Biochem. 2018;119(10):8317–8324. | ||
Zhu HR, Huang RZ, Yu XN, et al. Microarray expression profiling of microRNAs reveals potential biomarkers for hepatocellular carcinoma. Tohoku J Exp Med. 2018;245(2):89–98. | ||
Yan Y, Luo YC, Wan HY, et al. MicroRNA-10a is involved in the metastatic process by regulating Eph tyrosine kinase receptor A4-mediated epithelial-mesenchymal transition and adhesion in hepatoma cells. Hepatology. 2013;57(2):667–677. | ||
Zhou HC, Fang JH, Shang LR, et al. MicroRNAs miR-125b and miR-100 suppress metastasis of hepatocellular carcinoma by disrupting the formation of vessels that encapsulate tumour clusters. J Pathol. 2016;240(4):450–460. | ||
Ye T, Ding W, Wang N, Huang H, Pan Y, Wei A. Long noncoding RNA linc00346 promotes the malignant phenotypes of bladder cancer. Biochem Biophys Res Commun. 2017;491(1):79–84. | ||
Zhang J, Fan D, Jian Z, Chen GG, Lai PB. Cancer specific long noncoding RNAs show differential expression patterns and competing endogenous RNA potential in hepatocellular carcinoma. PLoS One. 2015;10(10):e0141042. | ||
Liu H, Li J, Koirala P, et al. Long non-coding RNAs as prognostic markers in human breast cancer. Oncotarget. 2016;7(15):20584–20596. | ||
Akuta N, Suzuki F, Kobayashi M, et al. Circulating microRNA-122 levels are important predictor of hepatitis B virus surface antigen seroclearance. J Med Virol. 2018;90(10):1586–1592. | ||
Nie QH, Gao LH, Cheng YQ, et al. Hepatitis C virus infection of human cytotrophoblasts cultured in vitro. J Med Virol. 2012;84(10):1586–1592. | ||
Zhang MH, Niu H, Li Z, Huo RT, Wang JM, Liu J. Activation of PI3K/AKT is involved in TINAG-mediated promotion of proliferation, invasion and migration of hepatocellular carcinoma. Cancer Biomark. 2018;23(1):33–43. |
 © 2019 The Author(s). This work is published and licensed by Dove Medical Press Limited. The
full terms of this license are available at https://www.dovepress.com/terms
and incorporate the Creative Commons Attribution
- Non Commercial (unported, 3.0) License.
By accessing the work you hereby accept the Terms. Non-commercial uses of the work are permitted
without any further permission from Dove Medical Press Limited, provided the work is properly
attributed. For permission for commercial use of this work, please see paragraphs 4.2 and 5 of our Terms.
© 2019 The Author(s). This work is published and licensed by Dove Medical Press Limited. The
full terms of this license are available at https://www.dovepress.com/terms
and incorporate the Creative Commons Attribution
- Non Commercial (unported, 3.0) License.
By accessing the work you hereby accept the Terms. Non-commercial uses of the work are permitted
without any further permission from Dove Medical Press Limited, provided the work is properly
attributed. For permission for commercial use of this work, please see paragraphs 4.2 and 5 of our Terms.