Back to Journals » OncoTargets and Therapy » Volume 13
Insulin-Like Growth Factor Binding Protein-2 Promotes Proliferation and Predicts Poor Prognosis in Hepatocellular Carcinoma
Authors Ma Y, Cui D, Zhang Y, Han C, Wei W
Received 12 February 2020
Accepted for publication 18 May 2020
Published 8 June 2020 Volume 2020:13 Pages 5083—5092
DOI https://doi.org/10.2147/OTT.S249527
Checked for plagiarism Yes
Review by Single anonymous peer review
Peer reviewer comments 2
Editor who approved publication: Dr Sanjay Singh
Yang Ma, Dongqian Cui, Yu Zhang, Chen-chen Han, Wei Wei
Key Laboratory of Anti-Inflammatory and Immune Medicine, Ministry of Education, Anhui Collaborative Innovation Center of Anti-Inflammatory and Immune Medicine, Institute of Clinical Pharmacology, Anhui Medical University, Hefei, People’s Republic of China
Correspondence: Wei Wei
Institute of Clinical Pharmacology, Anhui Medical University, Key Laboratory of Anti-Inflammatory and Immune Medicine, Ministry of Education, Meishan Road 81, Hefei 230032, People’s Republic of China
Tel +86-551-6516-1209
Email [email protected]
Background: Insulin-like growth factor binding protein-2 (IGFBP2) levels are significantly increased in the plasma of hepatocellular carcinoma (HCC) patients. However, the correlation between IGFBP2 levels and clinical parameters and the exact role of IGFBP2 in HCC are unclear. In this study, we identified the role and potential molecular mechanisms of IGFBP2 in HCC.
Materials and Methods: ELISA assays were used to detect plasma IGFBP2 levels in HCC patients and healthy controls, and the correlations with patients’ clinicopathological data were analyzed. The CCK8 assay was used to explore cell proliferation. Luciferase reporter, co-immunoprecipitation, and immunofluorescence assays were used to demonstrate the molecular mechanism of IGFBP2 in HCC.
Results: Plasma IGFBP2 levels were determined blindly in 37 HCC patients and 37 matched healthy controls. The mean plasma IGFBP2 concentrations in HCC patients were higher than in healthy controls, and IGFBP2 levels in HCC were positively correlated with the degree of differentiation, tumor size, metastasis, and portal venous invasion. Exogenous IGFBP2 activated integrin β 1 and thus induced the combination and colocalization of activated integrin β 1 and p-FAK, which promoted the phosphorylation of FAK, Erk, and Elk1, eventually inducing EGR1-mediated proliferation of the HCC cell lines HepG2 and HCCLM3. Meanwhile, neutralization of integrin β 1 inhibited IGFBP2-induced FAK, Erk, Elk1, and EGR1 activation.
Conclusion: Taken together, these results indicated that exogenous IGFBP2 promoted the integrin β 1/FAK/Erk/Elk1/EGR1 pathway, which stimulated the proliferation of HCC cells. Plasma IGFBP2 could be a novel prognostic biomarker for HCC patients.
Keywords: IGFBP-2, integrin β 1, FAK, HCC proliferation
Introduction
Hepatocellular carcinoma (HCC) was the sixth most commonly diagnosed cancer and the fourth leading cause of cancer death worldwide in 2018.1 Despite advances in therapeutic strategies such as surgical resection and liver transplantation, the clinical outcomes of HCC patients have not improved due to late-stage diagnoses, and early metastasis.2 Therefore, there is an urgent need for novel diagnostic and therapeutic strategies to improve the prognosis of HCC patients.
Insulin-like growth factor binding protein-2 (IGFBP2) is the second most abundant IGFBP in human circulation;3 elevated plasma IGFBP2 levels compared with healthy controls are observed in patients with glioma,4 lung cancer,5 prostate cancer,6 and HCC.7 IGFBP2 is a 32- to 34-kD protein that can not only bind IGFs with high affinity, but also act in IGF-independent pathways to promote cell invasion,8 metastasis,9 tumorigenesis,10 and angiogenesis9,11 in various cancer types. However, the roles and mechanisms of IGFBP2 in HCC remain unknown. The Arg-Gly-Asp (RGD) cell adhesion motif of IGFBP2 protein potentially binds to integrin receptors.12 Focal adhesion kinase (FAK) is a cytoplasmic non-receptor tyrosine kinase that is autophosphorylated following the activation of integrin receptors.
Early growth response protein 1 (EGR1) is an 82-kDa transcription factor that is an immediate early gene product. Mitogenic stimuli, including serum and growth factors, and non-mitogenic stresses, including hypoxia and γ-irradiation, both can activate pathways such as PI3K/AKT and MEK/ERK, that increase EGR1 expression.12,13
This study investigated plasma IGFBP2 levels in HCC patients and analyzed statistical correlations between these and clinicopathological data. We also show that exogenous IGFBP2 activated integrin β1, and thus induced the combination and colocalization of activated integrin β1 and p-FAK, which induced phosphorylation of FAK, Erk and Elk1, eventually promoting EGR1-mediated proliferation of HCC cells. These results are the first to mechanistically explain the role of plasma IGFBP2 as a prognostic biomarker in HCC patients.
Materials and Methods
ELISA Assay
We selected the blood sample of the 37 HCC patients before their surgical operation, and matched the patients with 37 healthy volunteers for age, sex and race. All HCC patients and healthy volunteers had signed informed consent for sample collection. Plasma was isolated by centrifuging the blood samples at room temperature, plasma IGFBP2 was measured by an enzyme-linked immunosorbent assay (ELISA) kit (RayBio, USA), following the manufacturer’s instructions, IGFBP2 concentration was calculated from the standard curve. The present study was approved by the Research Ethics Committee of Anhui Medical University and performed in accordance with the Declaration of Helsinki.
Cell Culture and Reagents
Human HCC cell lines HepG2 was a gift from University of Science and Technology of China, and HCCLM3 were purchased from Shanghai Cell Bank, Chinese Academy of Sciences (Shanghai, China), and maintained in DMEM (Hyclone, USA) supplemented with 10% FBS (Hyclone, USA) and 2 nmol/L L-glutamine and penicillin–streptomycin. Cells were cultured in an incubator with humidified air at 37°C with 5% CO2. HepG2 and HCCLM3 were authenticated using short tandem repeat profiling AmpFLSTR™ Identifiler™ Plus PCR Amplification Kit for high-resolution screening and interspecies cross-contamination detection. Lipofectamine-3000 (Invitrogen, USA) was employed for plasmids transfection according to the manufacturer’s protocol.
Cell Proliferation Assay
1×10⁴ HepG2 or HCCLM3 cells per well were seeded in 96-well plates in DMEM with 10% FBS. The following day, the cells were incubated in serum-free medium for 12 h, and then treated with 15.5, 31, 62, 125 or 250 ng/mL recombinant human IGFBP2 (Peprotech, USA) for 48 or 72 h. In some cultures, cells were preincubated with integrin β1-neutralising antibody at a concentration of 2 mg/mL (Chemicon International, USA) for 0.5 h before treatment with IGFBP2. In another experiment, cells were transfected with pcDNA3.1-IGFBP2 or pcDNA3.1-ctr plasmids for 24, 48 or 72 h, cell growth was performed as described previously14 using cck-8 cell viability assay system. The optical density was determined at 450 nm using a scanning multiwall spectrophotometer (Tecan, Austria).
Western Blot
HepG2 or HCCLM3 cells were seeded at 2×10⁶ cells per well in 6-well plate, the following day, cells were in serum-free medium overnight and then treated with 250 ng/mL IGFBP2 for 0.5 h, 1 h, 4 h, 12 h, 24 h, 48 h at 37°C, total protein was extracted using lysis buffer to analyze FAK, p-FAK, Erk, pErk, Elk1, p-Elk1 and EGR1 levels, and Western blot analysis was scanned, and densitometric analysis was applied for quantification of the bands as using ImageJ software (National Institutes of Health). The ROD ratio was calibrated as the percentage expression compared with 0 hr, which was designated as 100% following normalization to each β-actin band. In another experiment, cells were pretreated with 2 mg/mL integrin β1-neutralising antibody, total protein was extracted using lysis buffer to analyze FAK, p-FAK, Erk, pErk, Elk1, p-Elk1 levels. Western blot assay was performed as described previously.15
Luciferase Reporter Assays
Briefly, an appropriate amount of the EGR1 promoter-luciferase reporters, together with renilla luciferase plasmids, which served as the internal control, were co-transfected into HepG2 or HCCLM3 cells. 12 hrs later, cells were pretreated with 2 mg/mL integrin β1-neutralising antibody for 0.5 h and then with 250 ng/mL IGFBP2 for the following 12 h, then the cell lysates were prepared and subjected to Dual-luciferase Reporter Assay (Promega) according to the manufacturer’s instructions. Luciferase activities were normalized to renilla luciferase activities. Data represent at least three independent experiments.
Cell Immunofluorescence
Cell immunofluorescence was performed as described previously,16 HepG2 or HCCLM3 cells were seeded into 6-well plate with aseptic glasses, after starvation overnight, IGFBP2 was added to the medium for 4 h, and disposed with 4% paraformaldehyde and 0.25% Triton X-100 at room temperature, after that, the cells were incubated with anti-phosphorylated FAK and anti-activated integrin β1 (Santa Cruz Biotechnology, USA), which is antibody that binds to β1 only when it is in the active conformation.17 The expression of phosphorylated FAK, activated integrin β1 and DAPI nuclear localization were examined under laser scanning confocal microscope.
Co-Immunoprecipitation
HepG2 or HCCLM3 cells were seeded at 1×10⁷ cells in 10-cm plate, the following day, cells were pretreated in serum-free medium overnight and then treated with 250 ng/mL IGFBP2 for 0.5 hr, 1 hr or 4 hrs at 37°C, each protein was extracted using lysis buffer, activated integrin β1 antibody was added for 2 hrs, then protein A/G PLUS-Agarose into each sample at 4°C overnight, immunoprecipitates were washed, mixed with sample buffer, and loaded on SDS gels, FAK or integrin β1 antibody was used for Western blot detection.
Statistical Analysis
All analyses were performed using SPSS v19.0 and Graphpad Prism 6.02. The comparison of the mean data was performed by Student’s t-test, and the data of two groups of continuous variables were compared by one way ANOVA. A significance level was set at P < 0.05 for all tests.
Results
Plasma IGFBP2 Levels in HCC Patients and Matched Controls
To test whether there were differences in circulating IGFBP2 levels between HCC patients and healthy controls, we obtained plasma samples from 37 HCC patients and 37 case-matched healthy volunteers. Clinicopathological characteristics of the 37 HCC patients are summarized in Table 1. Plasma IGFBP2 levels were determined by ELISA by an investigator blinded to clinical information. The results showed that the mean plasma concentration of IGFBP2 in HCC patients (372.38±139.68 ng/mL) was significantly higher than that of healthy controls (289.18±104.49 ng/mL, P=0.006) (Figure 1A). IGFBP2 values among HCC patients were then analyzed for statistically significant associations and correlations with clinicopathological data. There were no significant differences in plasma IGFBP2 levels when patients were grouped by age, sex, liver cirrhosis, or Hepatitis B virus status (Figure 1B–E). In contrast, serum IGFBP2 levels were significantly higher in Grade III/IV cases compared with Grade I/II cases (mean: 429.10 ng/mL vs. 325.00 ng/mL, P=0.021) (Figure 1F), larger tumors (≥5 cm) compared with smaller tumors (<5 cm) (mean: 432.93 ng/mL vs. 335.52 ng/mL, P=0.038) (Figure 1G). Additionally, IGFBP2 levels were higher in metastatic cases than in the group without metastases (mean: 415.65 ng/mL vs. 301.29 ng/mL, P=0.014) (Figure 1H); and in cases with portal vein invasion compared with the group free from portal vein invasion (mean: 416.90 ng/mL vs. 313.94 ng/mL, P=0.024) (Figure 1I). These results demonstrated that circulating IGFBP2 values were significantly higher in HCC patients than in healthy controls, and that the level of IGFBP2 positively was correlated with the degree of differentiation, tumor size, metastasis, and portal vein invasion, which suggested that IGFBP2 levels were increased when HCC had progressed to advanced stages.
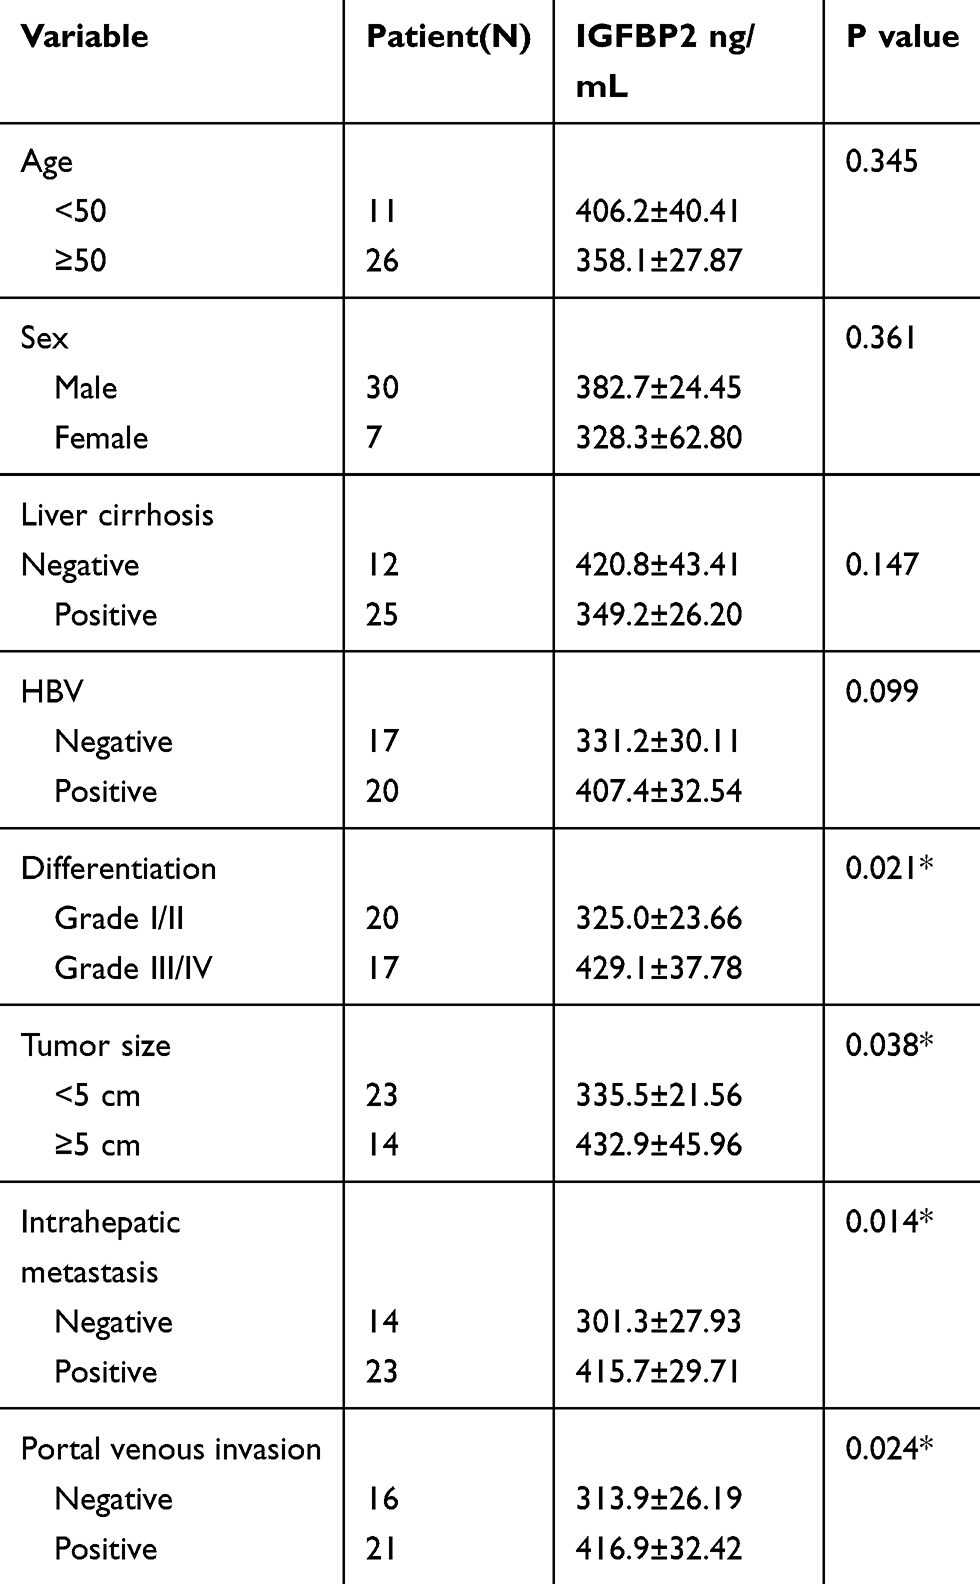 |
Table 1 Clinicopathological Characteristics of HCC Patients and Plasma IGFBP2 Levels (*P < 0.05) |
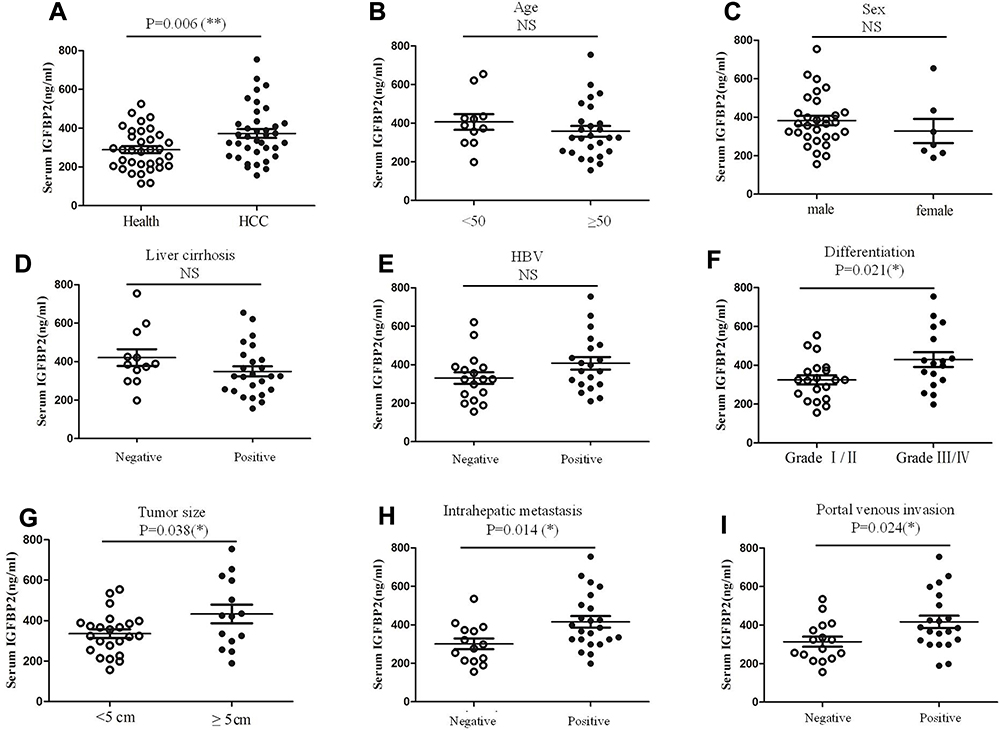 |
Figure 1 Plasma IGFBP2 levels in HCC patients and matched controls. The plasma IGFBP2 levels of 37 HCC patients and healthy controls were determined by ELISA assay (A), IGFBP2 values for HCC patients were then analyzed statistically for association and correlation with clinical information (B–I). Each experiment was performed in triplicate; *p<0.05, **p<0.01. Abbreviation: ns, not significant. |
Exogenous IGFBP2 but Not Endogenous IGFBP2 Overexpression Promoted HCC Cells Proliferation
To investigate the role of IGFBP2 in HCC cell proliferation, we overexpressed endogenous IGFBP2 and added exogenous recombinant human IGFBP2 to HCC cells. The viability of HepG2 cells transfected with the pcDNA3.1-IGFBP2 plasmid or the vector control was detected by the CCK-8 assay, and the results showed that cells did not show marked differences in their proliferation; the same results were also observed in HCCLM3 cells (Figure 2A and B). IGFBP-2 level secreted into the medium of HCC/pcDNA3.1-IGFBP2 is much higher compared to HCC/pcDNA3.1-ctr, but generally lower than 20ng/mL (Figure 2C). However, when we added recombinant human IGFBP2 (31 to 250 ng/mL) to the culture medium for 48 h and 72 h, the proliferation of HepG2 and HCCLM3 cells were elevated in a dose-dependent manner (Figure 2D–G). These results suggested that exogenous IGFBP2 stimulation promotes HCC cell proliferation, while overexpressing endogenous IGFBP2 has no effect.
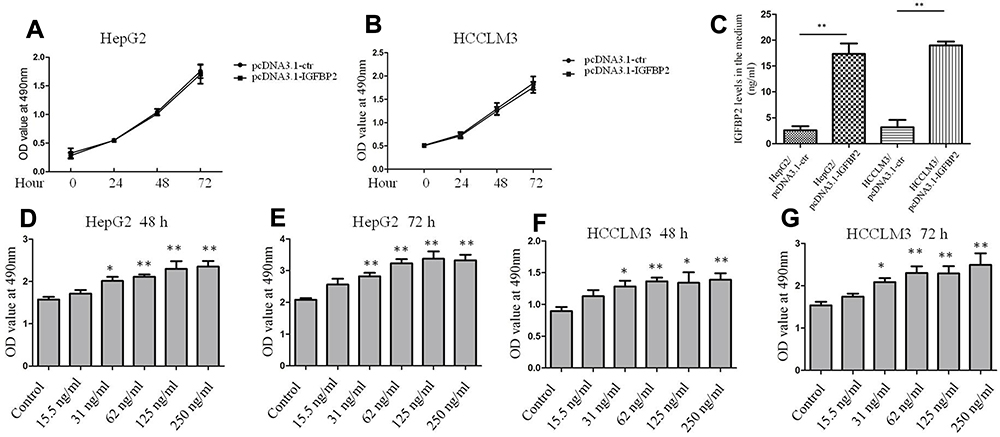 |
Figure 2 Exogenous IGFBP2 but not endogenous IGFBP2 overexpression promoted HCC cells proliferation. Growth of HepG2 and HCCLM3 cells transfecting with pcDNA3.1-IGFBP2 plasmid and the vector control for 72 h (A, B). IGFBP-2 levels secreted into the medium of HepG2, HCCLM3 and genetically engineered cells were detected by ELISA assay (C). Growth of HepG2 and HCCLM3 cells treated with different concentrations of exogenous recombinant human IGFBP2 for 48 or 72 h (D–G). (**p < 0.01, *p < 0.05 compared with control group). |
Exogenous IGFBP2 Enhanced FAK, Erk, and Elk1 Activation in HCC Cells
To identify the signaling pathways through which IGFBP2 promoted the proliferation of HCC cells, we examined FAK, Erk, and Elk1 activation levels in HepG2 and HCCLM3 cells. This signaling axis was first investigated because the Erk pathway has previously been associated with IGFBP2.18 A suboptimal IGFBP2 concentration (125 ng/mL) was chosen to stimulate cells, and protein samples extracted from cultured cells were analyzed by Western blot, using densitometric analysis to quantify relative optical densities of immunoreactive bands using ImageJ software. The results showed that levels of phosphorylated FAK, Erk, and Elk1 relative to total FAK, Erk, and Elk1 were gradually increased from 0.5 h to 12 h after IGFBP2 treatment, and then decreased from 12 h to 48 h (Figure 3A–D). Additionally, EGR1 expression was elevated after IGFBP2 administration in HepG2 and HCCLM3 cells (Figure 3A–D). It has been reported that EGR1 is induced by Erk/Elk1 signaling in non-small cell lung cancer and head and neck squamous cell carcinoma cells.19 These results suggest that exogenous IGFBP2 enhances signaling through the FAK/Erk/Elk1/EGR1 axis in HCC cells.
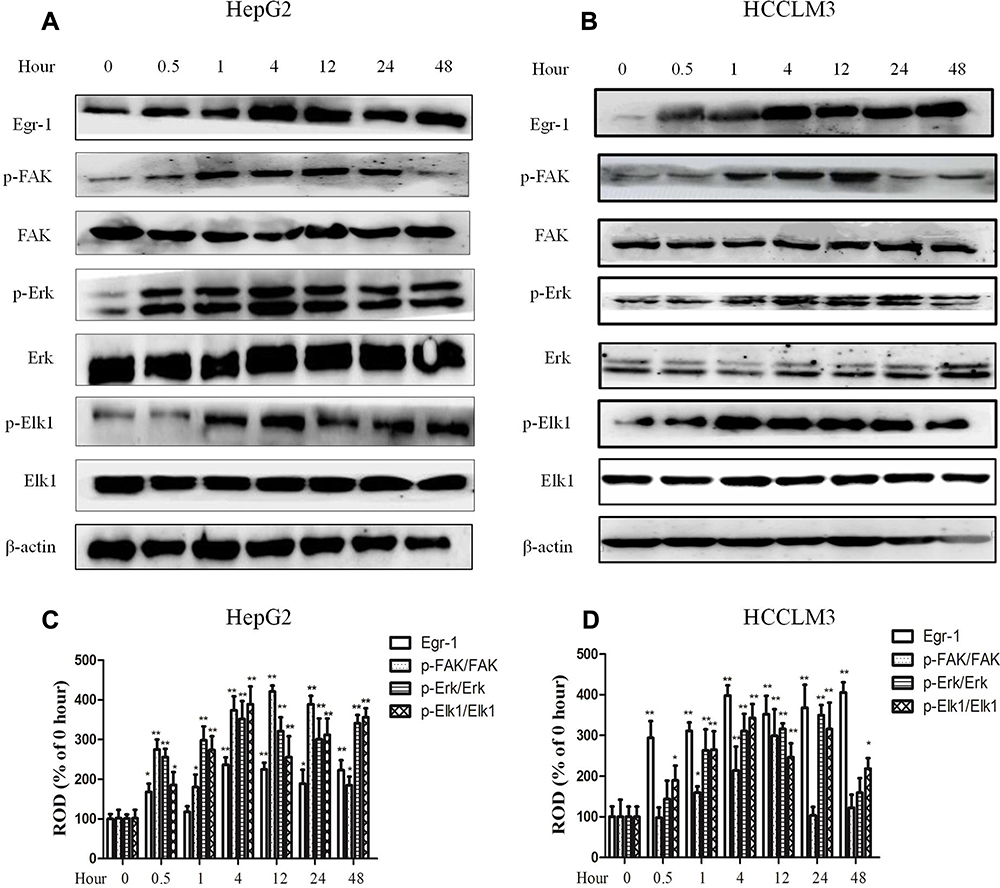 |
Figure 3 Exogenous IGFBP2 enhanced FAK, Erk, and Elk1 activation in HCC cells. Whole-cell lysates from HepG2 (A) and HCCLM3 (B) cells were treated with 125 ng/mL IGFBP2 for different time point and subjected to SDS-PAGE for analyzing the expression of EGR1, FAK, Erk and Elk1, the activation of FAK, Erk and Elk1 were examined by immunoblot assays using anti-phosphorylated antibody. The statistics of EGR1 expression, FAK, Erk, and Elk1 phosphorylation in HepG2 (C) and HCCLM3 (D) were analyzed using ImageJ software. Relative optical density (ROD) is presented as a percentage of the 0 h immunoblot band. (**p < 0.01, *p < 0.05 compared with 0 h group, N=5 per group). |
Neutralizing Integrin β1 Inhibited IGFBP2-Induced FAK/Erk/Elk1/EGR1 Activation
It has been reported that IGFBP2 binds to integrin β1 to promote glioma cell invasion.17 Thus, we pre-treated HepG2 and HCCLM3 cells with anti-integrin β1-neutralizing antibody or nonimmune IgG for 0.5 h before IGFBP2 treatment, and then employed Western blot and luciferase reporter assays to detect the effects of IGFBP2 on intracellular signaling pathways. The results showed that blocking integrin β1 with the neutralizing antibody inhibited IGFBP2-induced FAK, Erk, and Elk1 phosphorylation but did not change total FAK, Erk, or Elk1 protein levels (Figure 4A and B). Luciferase reporter assays showed that IGFBP2 administration induced EGR1 promoter activity and that neutralizing integrin β1 decreased IGFBP2-induced EGR1 promoter activity (Figure 4C and D). These results indicated that IGFBP2 mediates FAK/Erk/Elk1/EGR1 pathway activation through integrin β1 in HCC cells.
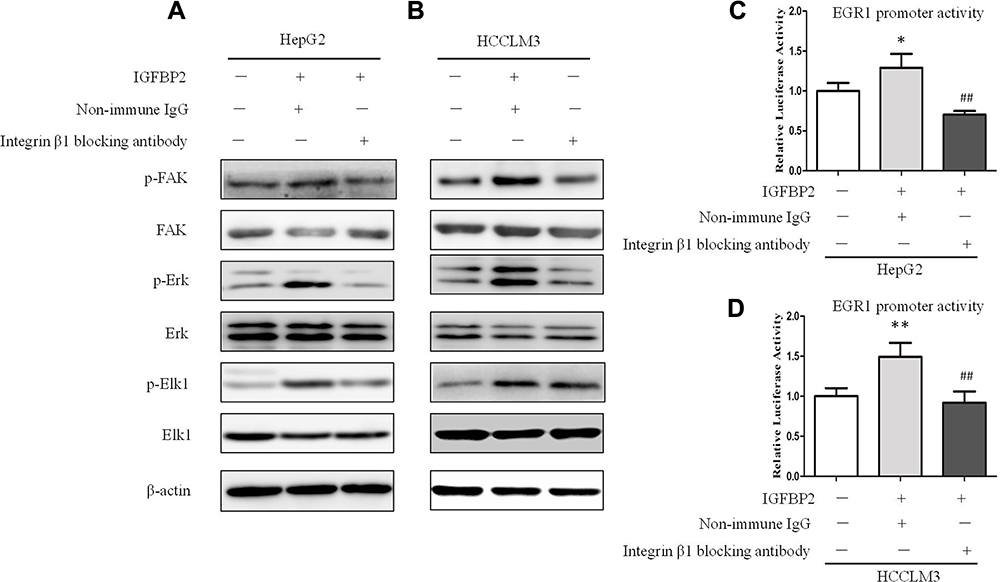 |
Figure 4 Neutralizing integrin β1 inhibited IGFBP2-induced FAK/Erk/Elk1/EGR1 activation. Whole-cell lysates from HepG2 (A) and HCCLM3 (B) cells which were pre-treated with anti-integrin β1-neutralising antibody or nonimmune IgG for 0.5 h before IGFBP2 treatment were subjected to SDS-PAGE for analyzing the expression of EGR1, and the activation of FAK, Erk and Elk1. HepG2 (C) and HCCLM3 (D) cells were transfected with EGR1 promoter-luciferase reporter plasmid for 12 h, then pre-treated with anti-integrin β1-neutralising antibody or nonimmune IgG for 0.5 h before IGFBP2 treatment for the following 12 h, and EGR1 promoter luciferase activities were examined (**p < 0.01, *p < 0.05 compared with the left group, ##p < 0.01 compared with middle group). |
IGFBP2 Activated Integrin β1 and Promoted the Interaction Between Integrin β1 and p-FAK
To further investigate the role of integrin β1 in HCC cells, we observed the interaction between integrin β1 and phosphorylated FAK by co-immunoprecipitation and immunofluorescence assays. The activated integrin β1 antibody, which binds to β1 only when it is in the active conformation, was used for these assays. We found that there was little interaction between activated integrin β1 and p-FAK in untreated cells, while IGFBP2 administration to HCC cells induced a time-dependent interaction between the two proteins (Figure 5A and B). Immunofluorescence assays showed that IGFBP2 treatment increased levels of active integrin β1 at the plasma membrane and increased colocalization of activated integrin β1 and p-FAK (Figure 5C and D). These data suggest that IGFBP2 activates integrin β1 and promotes the interaction between integrin β1 and p-FAK.
 |
Figure 5 IGFBP2 activated integrin β1 and promoted the interaction between integrin β1 and p-FAK. HepG2 (A) and HCCLM3 (B) cells were treated with IGFBP2 for different time point. Whole-cell lysates were used for immunoprecipitation with activated integrin β1 antibody and p-FAK antibody were detected by Western blotting. HepG2 (C) and HCCLM3 (D) cells on aseptic glasses were treated with IGFBP2 for 4 h and fixed, nuclei (blue) were stained with DAPI. Active form of integrin β1 (green) was stained with activated integrin β1 antibody and p-FAK (red) was stained with anti-phosphorylated FAK antibody. |
Discussion
According to the follow-up survey by the Japanese Liver Cancer Study group, the cumulative survival rates of HCC after surgical removal are 52.3% at 5 years and 27.3% at 10 years; additionally, larger tumor size, portal vein invasion, and late clinical stages are associated with worse survival rates.20,21 According to our results, plasma IGFBP2 concentrations in HCC patients are significantly higher than in healthy controls. Among HCC patients, IGFBP2 levels were not correlated with age, sex, liver cirrhosis or Hepatitis B virus status. Consistent with the results of a previous study, IGFBP2 levels were not correlated with age or the stage of hepatic cirrhosis in HCC patients.7 However, serum IGFBP2 levels were significantly higher in patients with poorly differentiated lesions (Grade III/IV), larger tumors (≥5 cm), and in those positive for portal vein invasion and metastasis. Although we have not collected survival data for these HCC patients, we speculate that the group with high serum IGFBP2 levels may be associated with poorer survival rates. This study showed that increased plasma IGFBP2 levels were associated with disease progression, suggesting that serum IGFPB2 level could be a novel prognostic biomarker for HCC.
IGFBP2 treatment has been shown to stimulate the growth of human epithelial ovarian cancer cells22 and glioma cells.23 To investigate the mechanisms through which plasma IGFBP2 affects HCC progression, we examined the effects of recombinant exogenous IGFBP2 on the proliferation of HCC cells. We added different concentrations of recombinant human IGFBP2 to the cell culture medium and found that HCC cell proliferation was induced in a dose-dependent manner; however, overexpressing endogenous IGFBP2 in HCC cells did not affect their proliferation, for two reasons. Firstly, the IGFBP-2 concentration in the medium of HepG2, HCCLM3 and genetically engineered cells were generally lower than 20ng/mL, which is much lower than the exogenous IGFBP-2 level; secondly, it suggests that endogenous IGFBP2 may transduce different signaling pathways that have other cellular effects. It has been reported that the JNK pathway was specifically involved in cell migration in IGFBP2-overexpressing glioma cells.24 IGFBP2 overexpression induces activation of the NF-κB pathway, which drives epithelial-mesenchymal transition and invasion in pancreatic ductal adenocarcinoma.9
The RGD adhesion motif of IGFBP2 is a known integrin-binding domain, which suggests that exogenous IGFBP2 may function through binding to integrin receptors on the surface of HCC cells. There is evidence that IGFBP2 binds to integrin β1 to promote glioma cell invasion.17 In this study, exogenous IGFBP2 was found to stimulate HCC proliferation by binding to integrin β1. IGFBP2 activated integrin β1 and induced the interaction between integrin β1 and its adaptor protein FAK. Previous studies have indicated that integrin activation can activate ERK signaling, which transduces growth signals and participates in cancer-related processes.25 Our data showed that IGFBP2 treatment increased the levels of phosphorylated FAK, Erk, and Elk1, and upregulated EGR1 levels. Pre-treating HCC cells with an integrin β1 blocking antibody reduced the IGFBP2-induced activation of FAK, Erk, Elk1, and the transcription of EGR1, suggesting that IGFBP2 functions through binding to integrin β1 on HCC cells.
Conclusions
In summary, our results indicated that exogenous IGFBP2 activated integrin β1, and thus induced the combination and colocalization of activated integrin β1 and p-FAK, which promoted the phosphorylation of FAK, Erk, Elk1 and EGR1 transcription, eventually promoted HCC cell proliferation (Figure 6). The mean plasma IGFBP2 concentrations in HCC patients were higher than in healthy controls, and IGFBP2 levels in HCC were positively correlated with the degree of differentiation, tumor size, metastasis, and portal venous invasion. Plasma IGFBP2 could be a novel prognostic biomarker for HCC patients.
 |
Figure 6 Mechanism diagram of IGFBP2 promoting HCC cell proliferation. Exogenous IGFBP2 promoted the integrin β1/FAK/Erk/Elk1/EGR1 pathway, which stimulated the proliferation of HCC cells. |
Data Sharing Statement
The data used to support the findings of this study are available from the corresponding author upon request.
Ethics Approval
The present study was approved by the Research Ethics Committee of Anhui Medical University and written informed consents were provided by all patients. This study was performed in accordance with the Declaration of Helsinki.
Acknowledgments
This research was supported by the Natural Science Foundation of China (Nos. 81502123, 81330081, 81673444), Natural Science Foundation of Anhui Province (No.1308085QH130), and the Anhui Province Natural Science Foundation in University (Nos. KJ2014A119, KJ2019A0234).
Disclosure
The authors declare no conflicts of interest.
References
1. Bray F, Ferlay J, Soerjomataram I, et al. Global cancer statistics 2018: GLOBOCAN estimates of incidence and mortality worldwide for 36 cancers in 185 countries. CA Cancer J Clin. 2018;68(6):394–424. doi:10.3322/caac.21492
2. Johnson PJ. The role of serum alpha-fetoprotein estimation in the diagnosis and management of hepatocellular carcinoma. Clin Liver Dis. 2001;5:145–159. doi:10.1016/S1089-3261(05)70158-6
3. Yu H, Rohan T. Role of the insulin-like growth factor family in cancer development and progression. J Natl Cancer Inst. 2000;92:1472–1489. doi:10.1093/jnci/92.18.1472
4. Lin Y, Jiang T, Zhou K, et al. Plasma IGFBP2 levels predict clinical outcomes of patients with high-grade gliomas. Neurooncol. 2009;11:468–476.
5. Guo C, Lu H, Gao W, et al. Insulin-like growth factor binding protein-2 level is increased in blood of lung cancer patients and associated with poor survival. PLoS One. 2013;8(9):e74973. doi:10.1371/journal.pone.0074973
6. Ho PJ, Baxter RC. Insulin-like growth factor-binding protein-2 in patients with prostate carcinoma and benign prostatic hyperplasia. Clin Endocrinol. 1997;46:333–342. doi:10.1046/j.1365-2265.1997.1100922.x
7. Ranke MB, Maier KP, Schweizer R, et al. Pilot study of elevated levels of insulin-like growth factor-binding protein-2 as indicators of hepatocellular carcinoma. Horm Res. 2003;60:174–180. doi:10.1159/000073229
8. Russo VC, Schütt BS, Andaloro E, et al. Insulin-like growth factor binding protein-2 binding to extracellular matrix plays a critical role in neuroblastoma cell proliferation, migration, and invasion. Endocrinology. 2005;146:4445–4455. doi:10.1210/en.2005-0467
9. Gao S, Sun Y, Zhang X, et al. IGFBP2 activates the NF-κB pathway to drive epithelial-mesenchymal transition and invasive character in pancreatic ductal adenocarcinoma. Cancer Res. 2016;76(22):6543–6554. doi:10.1158/0008-5472.CAN-16-0438
10. Dunlap SM, Celestino J, Wang H, et al. Insulin-like growth factor binding protein 2 promotes glioma development and progression. Proc Natl Acad Sci U S A. 2007;104(28):11736–11741. doi:10.1073/pnas.0703145104
11. Azar WJ, Azar SH, Higgins S, et al. IGFBP2 enhances VEGF gene promoter activity and consequent promotion of angiogenesis by neuroblastoma cells. Endocrinology. 2011;152:3332–3342. doi:10.1210/en.2011-1121
12. Cohen DM. Urea-inducible Egr-1 transcription in renal inner medullary collecting duct (mIMCD3) cells is mediated by extracellular signal-regulated kinase activation. Proc Natl Acad Sci U S A. 1996;93:11242–11247. doi:10.1073/pnas.93.20.11242
13. Chu L, Wang T, Hu Y, et al. Activation of Egr-1 in human lung epithelial cells exposed to silica through MAPKs signaling pathways. PLoS One. 2013;8:e68943. doi:10.1371/journal.pone.0068943
14. Ma Y, Han -C-C, Li Y, Wang Y, Wei W. Insulin-like growth factor-binding protein-3 inhibits IGF-1-induced proliferation of human hepatocellular carcinoma cells by controlling bFGF and PDGF autocrine/paracrine loops. Biochem Biophys Res Commun. 2016;478(2):964–969. doi:10.1016/j.bbrc.2016.08.059
15. Ma Y, Han CC, Huang Q, Sun WY, Wei W. GRK2 overexpression inhibits IGF1-induced proliferation and migration of human hepatocellular carcinoma cells by downregulating EGR1. Oncol Rep. 2016;35(5):3068–3074. doi:10.3892/or.2016.4641
16. Sun WY, Hu SS, Wu JJ, et al. Down-regulation of β-arrestin2 promotes tumour invasion and indicates poor prognosis of hepatocellular carcinoma. Sci Rep. 2016;6:35609. doi:10.1038/srep35609
17. Holmes KM, Annala M, Chua CY, et al. Insulin-like growth factor-binding protein 2-driven glioma progression is prevented by blocking a clinically significant integrin, integrin-linked kinase, and NF-κB network. Proc Natl Acad Sci U S A. 2012;109(9):3475–3480. doi:10.1073/pnas.1120375109
18. Kiepe D, Van Der Pas A, Ciarmatori S, et al. Defined carboxy-terminal fragments of insulin-like growth factor (IGF) binding protein-2 exert similar mitogenic activity on cultured rat growth plate chondrocytes as IGF-I. Endocrinology. 2008;149:4901–4911. doi:10.1210/en.2007-1395
19. Kim JH, Choi DS, Lee OH, et al. Antiangiogenic antitumor activities of IGFBP-3 are mediated by IGF-independent suppression of Erk1/2 activation and Egr-1–mediated transcriptional events. Blood. 2011;118(9):2622–2631. doi:10.1182/blood-2010-08-299784
20. Kiyosawa K, Umemura T, Ichijo T, et al. Hepatocellular carcinoma: recent trends in Japan. Gastroenterology. 2004;127:S17–S26. doi:10.1053/j.gastro.2004.09.012
21. Kokudo T, Hasegawa K, Matsuyama Y, et al. Liver resection for hepatocellular carcinoma associated with hepatic vein invasion: a Japanese nationwide survey. Hepatology. 2017;66(2):510–517. doi:10.1002/hep.29225
22. Chakrabarty S, Kondratick L. Insulin-like growth factor binding protein-2 stimulates proliferation and activates multiple cascades of the mitogen-activated protein kinase pathways in NIH-OVCAR3 human epithelial ovarian cancer cells. Cancer Biol Ther. 2006;5(2):189–197. doi:10.4161/cbt.5.2.2333
23. Han S, Li Z, Master LM, et al. Exogenous IGFBP2 promotes proliferation, invasion, and chemoresistance to temozolomide in glioma cells via the integrin b1-ERK pathway. Br J Cancer. 2014;111(7):1400–1409. doi:10.1038/bjc.2014.435
24. Mendes KN, Wang GK, Fuller GN, Zhang W. JNK mediates insulin like growth factor binding protein 2/integrin alpha5-dependent glioma cell migration. Int J Oncol. 2010;37:143–153. doi:10.3892/ijo_00000662
25. Renshaw MW, Ren XD, Schwartz MA. Growth factor activation of MAP kinase requires cell adhesion. EMBO J. 1997;16:5592–5599. doi:10.1093/emboj/16.18.5592
 © 2020 The Author(s). This work is published and licensed by Dove Medical Press Limited. The
full terms of this license are available at https://www.dovepress.com/terms
and incorporate the Creative Commons Attribution
- Non Commercial (unported, 3.0) License.
By accessing the work you hereby accept the Terms. Non-commercial uses of the work are permitted
without any further permission from Dove Medical Press Limited, provided the work is properly
attributed. For permission for commercial use of this work, please see paragraphs 4.2 and 5 of our Terms.
© 2020 The Author(s). This work is published and licensed by Dove Medical Press Limited. The
full terms of this license are available at https://www.dovepress.com/terms
and incorporate the Creative Commons Attribution
- Non Commercial (unported, 3.0) License.
By accessing the work you hereby accept the Terms. Non-commercial uses of the work are permitted
without any further permission from Dove Medical Press Limited, provided the work is properly
attributed. For permission for commercial use of this work, please see paragraphs 4.2 and 5 of our Terms.