
Back to Journals » Journal of Asthma and Allergy » Volume 18
Insights into Local Grass and Weed Pollen Sensitization in Bangkok, Thailand: IgE Reactivity Patterns, Cross-Reactivity, and Putative Allergens
Authors Aud-in S, Juprasong Y  , Tantilipikorn P , Songnuan W
Received 10 April 2025
Accepted for publication 25 July 2025
Published 21 August 2025 Volume 2025:18 Pages 1193—1210
DOI https://doi.org/10.2147/JAA.S533633
Checked for plagiarism Yes
Review by Single anonymous peer review
Peer reviewer comments 2
Editor who approved publication: Dr Luis Garcia-Marcos
Sirirat Aud-in,1,2 Yotin Juprasong,2,3 Pongsakorn Tantilipikorn,4,5 Wisuwat Songnuan1,2,4
1Department of Plant Science, Faculty of Science, Mahidol University, Bangkok, Thailand; 2Single-Cell Omics and Systems Biology of Diseases Research Unit, Faculty of Science, Mahidol University, Bangkok, Thailand; 3Department of Biochemistry, Faculty of Medicine, Srinakharinwirot University, Bangkok, Thailand; 4Siriraj Center of Research Excellence in Allergy and Immunology, Faculty of Medicine Siriraj Hospital, Mahidol University, Bangkok, Thailand; 5Division of Rhinology and Allergy, Department of Otorhinolaryngology, Faculty of Medicine Siriraj Hospital, Mahidol University, Bangkok, Thailand
Correspondence: Wisuwat Songnuan, Email [email protected]
Background: Allergic rhinitis (AR) triggered by pollen is a growing global public health concern. This study aimed to: 1) analyze IgE reactivity to grass and weed pollen in Thai AR patients; 2) assess the prevalence and intensity of IgE-reactive protein bands; and 3) investigate cross-reactivity among pollen species.
Methods: Sera were collected from Thai adult AR patients in Bangkok, Thailand, and skin prick test (SPT) data were obtained. ELISA assessed IgE reactivity to pollen extracts from four grasses (Bermuda grass, para grass, Johnson grass, Manila grass) and two weeds (nutsedge, careless weed) using 119 patient sera. Immunoblot identified IgE-reactive protein bands using 65 patient sera with positive SPT. Cross-reactivity was confirmed by immunoblot and ELISA inhibition assays.
Results: Johnson grass showed the highest ELISA optical density (OD) values. Significant positive correlations (rs = 0.740 to 0.935, p < 0.0001) in IgE reactivity were observed among pollen species, with stronger correlations among grasses. Immunoblot identified 30 kDa and 63 kDa proteins as major IgE-reactive proteins in grasses, and 25 kDa and 75 kDa proteins in nutsedge. Strong positive correlations were found within grass species for number of bands, ELISA OD, and SPT wheal size. A positive correlation existed between ELISA and SPT results (rs = 0.27, p = 0.030). Inhibition assays confirmed cross-reactivity among grass and weed species.
Conclusion: This study highlights variability in pollen sensitization, cross-reactivity, and potential novel allergens in Thai AR patients. These findings are crucial for enhancing pollen allergy understanding and improving diagnostic and treatment, particularly in tropical/subtropical regions.
Keywords: aeroallergen, allergic rhinitis, Johnson grass, nutsedge, pollen allergy
Introduction
Allergic rhinitis (AR) constitutes a significant global public health concern with a steadily increasing worldwide prevalence. Current research suggests that approximately 10% to 20% of the general population suffer from seasonal AR, with an even higher occurrence among children.1 Severe AR has a significant impact, leading to a decrease in quality of life, impaired work performance, disrupted sleep, and obstructive sleep apnea.2,3 In Thailand, AR prevalence has steadily increased, reaching 50.6% in 2001 from 37.9% in 1995.4 Seasonal AR is triggered by outdoor aeroallergens, such as pollen. Grass and weed pollen play a significant role as prominent contributors to allergic sensitization.5 The prevalence of grass pollen allergy varies globally, with European countries reporting rates as high as 90% among diagnosed allergic rhinoconjunctivitis patients.6 In China, Bermuda grass and timothy grass have been identified as major allergens, affecting up to 50% and 70% of allergic rhinitis patients, respectively.7 In Thailand, Bermuda grass, para grass, and Johnson grass contribute to allergic sensitization, with sensitization rates of 37–59%, 35–73%, and 31%, respectively. Additionally, Manila grass (39%) and hurricane grass (29%) have also been identified as significant allergens.4,8,9 This comprehensive understanding underscores the global impact of grass pollen on allergic respiratory conditions.
Variations in sensitization patterns are observed across different geographical locations, as alterations in the predominant circulating aeroallergens are influenced by factors such as lifestyle, climate, and urbanization.10,11 For the effective management of AR, current information concerning both the prevalent aeroallergens and the patterns of sensitization within a specific local environment is essential.
Understanding of grass allergen components primarily stems from research conducted on grass pollen from temperate (Pooideae) species, which are prevalent in those climate regions. However, subtropical grasses exhibit distinct phylogenetic and ecological characteristics. Notably, their allergen composition differs qualitatively.12 Subtropical grasses, particularly those belonging to the Panicoideae (eg, Bahia grass, Johnson grass, and para grass) and Chloridoideae (eg, Bermuda grass and Manila grass) subfamilies, hold significant clinical importance in subtropical zones spanning America, Africa, Asia, and Australia. Individuals residing in subtropical regions demonstrate heightened allergic sensitivity to these grass pollen varieties compared to those produced by temperate grasses.5 Weed pollen, alongside grasses, is another widespread allergenic source in various regions, including Northern and Central America11 and Europe.13 Studies in Thailand have shown that AR patients exhibit sensitivity to pollen extracts from sedge (Carex spp)., careless weed (Amaranthus hybridus L)., and cattail (Typha latifolia L).4,14 In accordance with plant classification, sedge belongs to the same order (Poales) as grasses, whereas careless weed is placed in a distinct family (Amaranthaceae).15 Sensitization to a specific allergen can induce cross-reactivity with homologous molecules in closely related plant species. Additionally, functionally similar molecules from diverse species within a protein family can also exhibit IgE cross-reactivity due to their conserved structure.16 Despite this knowledge, there is a dearth of information regarding the patterns of sensitization to pollen from both grasses and weeds in tropical and subtropical regions.
Previously, closely similar deduced amino acid sequences of the Group-1 grass pollen allergen were reported in widely encountered subtropical grasses, suggesting the potential cross-reactivity.17 Evidence of this cross-reactivity has indeed been observed among tropical/subtropical grasses. A study reported that the EXPB family served as the major cross-reactive allergen for Thai AR patients sensitive to Bermuda grass, Johnson grass, and para grass.18 In addition, Uro m 1, the major allergen from para grass, demonstrated effective inhibition of Bermuda grass and Johnson grass pollen extracts.19 Similarly, Zoy m 1, the major allergen from Manila grass, exhibited significant cross-reactivity with Bermuda grass pollen extract.8 However, the data concerning weed pollen sensitization and cross-reactivity remains scarce.
Our previous study reported grass and weed pollen sensitization patterns among Thai patients with AR in Bangkok based on skin prick test (SPT) responses.20 To enhance understanding, the present study aims to provide insights into patients’ IgE reactivity, assess the prevalence and intensity of IgE-reactive protein bands, and investigate cross-reactivity among pollen species. The findings are expected to contribute to improving the diagnosis and management of pollen allergies in AR patients living in tropical and subtropical regions, particularly Southeast Asia.
Materials and Methods
Serum Samples
This study was approved by the Hospital Institutional Review Board under the reference number Si 171/2017. Adult Thai patients diagnosed with allergic rhinitis (AR) who visited a chosen standardized allergy clinic in Bangkok, Thailand were recruited to test grass and weed pollen sensitizations using a skin-prick test (SPT). The criterion for a positive SPT result was a wheal size of 3×3 mm or larger concomitant with a flare recommended by GA2LEN guidelines.21 Participants were included in the study from June 2017 to September 2020. The demographic and clinical characteristics of the patients are presented in Table 1.20 Due to limitations of serum, two sera were excluded for this study.
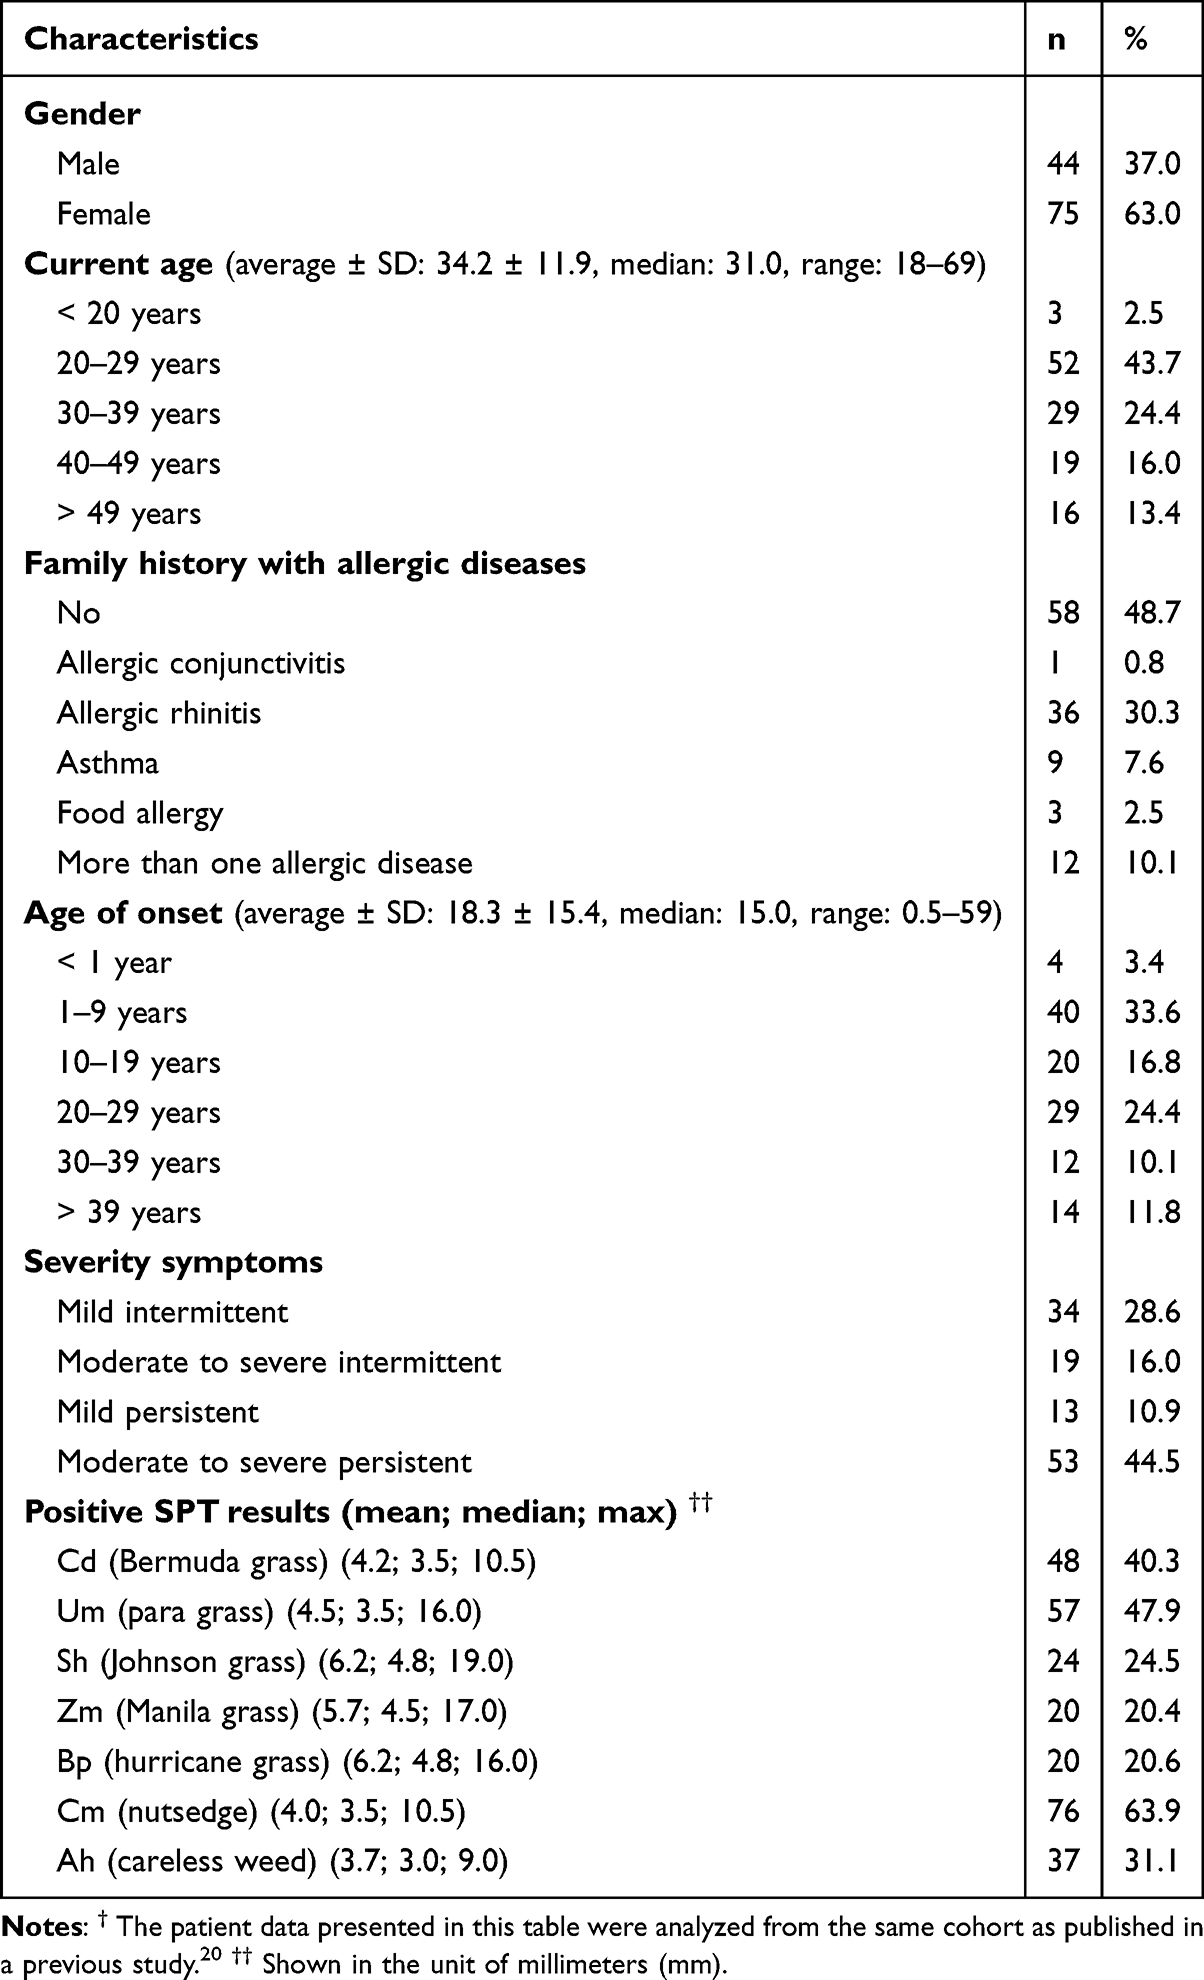 |
Table 1 Baseline Demographic and Clinical Characteristics of Allergic Rhinitis Patients (n = 119) † |
To assess IgE reactivity, sera from 119 AR patients were used for indirect enzyme-linked immunosorbent assay (ELISA) and 65 patients with positive SPT results for at least one pollen extract for immunoblot analysis. Furthermore, three and four serum samples were selected for immunoblot inhibition and ELISA inhibition assays, respectively, to test IgE cross-reactivity between pollen species.
Pollen Protein Extraction
Four grass species: Bermuda grass (Cynodon dactylon (L). Pers., Cd), para grass (Urochloa mutica (Forssk). T.Q.Nguyen, Um), Johnson grass (Sorghum halepense (L). Pers., Sh), Manila grass (Zoysia matrella (L). Merr., Zm), and two weed species: nutsedge (Cyperus mitis Steud., Cm) and careless weed (Amaranthus hybridus L., Ah) were collected from natural areas in Thailand. These species were selected because they are commonly distributed in Thailand and other tropical or subtropical regions and represent significant sources of airborne pollen allergens in these areas.22 All species were identified by Prof. Paweena Triperm, a plant taxonomy specialist, and the voucher specimens were deposited at the Department of Plant Science, Faculty of Science, Mahidol University, Bangkok, Thailand. Grass and weed pollen were ground in 1x phosphate-buffered saline (PBS, pH 7.0) containing 1 mM phenylmethylsulfonyl fluoride (PMSF), a protease inhibitor. The crude pollen extracts were then centrifuged at 10,000 rpm for 10 minutes at 4°C. The supernatants were collected and filtered sequentially through 0.45-μm and 0.2-μm filters. The total protein concentration was quantified using the Bradford assay.
Indirect Enzyme-Linked Immunosorbent (ELISA) and ELISA Inhibition
ELISA plates were coated with 0.25 µg/well (0.005 µg/µL) of pollen protein extract and incubated overnight at 4°C. The coated plates were blocked with blocking buffer (2% (w/v) skim milk in 0.05% (v/v) phosphate buffered saline with Tween® 20 (PBST)) at room temperature for 1 h. Serum samples diluted 1:8 in blocking buffer were added and incubated in the coated plate at room temperature for 2 h. After serum incubation, the plates were incubated with horseradish peroxidase (HRP)-labeled mouse IgG anti-human IgE antibodies (SeraCare Life Sciences, USA) diluted 1:1,000 in blocking buffer. 3,3′5,5-tetramethylbenzidine (TMB) substrate (SeraCare Life Sciences, USA) was added, and the reaction was stopped using 1 N HCl. Light absorbance was measured at optical density (OD) of 450 nm using a spectrophotometer (Biochrom, EZ read 400). All assays were performed in triplicates.
ELISA inhibition assay was performed the same as above, except that 0.5 µg of the protein extract was coated per well, and sera diluted 1:16 were pre-incubated overnight at 4°C with 0.25, 0.125, or 0.0625 µg/µL pollen protein extracts used as the inhibitory protein.
Immunoblot and Immunoblot Inhibition
Pollen protein extracts were incubated at 95°C for 5 min. Ten micrograms of each protein extract were loaded onto SDS-PAGE gels (14% separating, 7% stacking) and separated electrophoretically. Proteins were transferred to a nitrocellulose membrane using Transblot® TurboTM Transfer System (Bio-Rad, USA). The membrane was blocked with blocking buffer (3% (w/v) skim milk in 0.2% (v/v) PBST) for 1 h, followed by incubation with diluted serum samples (1:20 in blocking buffer) overnight at 4°C. Each membrane was then incubated with HRP-labeled mouse IgG anti-human IgE antibodies, diluted 1:5,000 in blocking buffer, at room temperature for 1 h. Bound IgEs were detected using Immobilon® Western Chemiluminescent HRP substrate (Millipore, Germany), and the emitted chemiluminescence signal was visualized using a gel documentation system (ImageQuant LAS 500, GE Healthcare Life Sciences, USA).
IgE reactivity levels from the immunoblot assay were evaluated visually relative to all bands across gels that were auto-exposed. Scores were assigned as follows: bands with high, medium, and low signal intensity received scores of 3, 2, and 1, respectively. The average band intensity of each protein band size was calculated by multiplying the number of bands by their respective scores and then dividing the total score by the total number of bands, using the formula: [(number of bands × 3) + (number of bands × 2) + (number of bands × 1)]/total number of bands.
The percent prevalence of each protein band size was calculated by dividing the total number of bands by the total number of patients and then multiplying by 100, using the formula: (total number of bands/number of patients)×100.
Average band intensity and prevalence of each protein band with different molecular weights (kDa) were calculated from data collected from 65 AR patients.
Immunoblot inhibition was performed similarly, except that 0.5 µg of the protein extract was loaded per well, and diluted sera were pre-incubated overnight at 4°C with 0.125 µg/µL pollen protein extracts used as the inhibitory protein.
Data Processing and Statistical Analysis
Hierarchical clustering analysis of ELISA data and heatmap visualization with a dendrogram were conducted using OriginPro®2023 software (OriginLab Corporation, USA). The clustering method was done according to the Group Average method and Euclidean distance.
Data visualization and statistical analysis were performed using GraphPad Prism version 9.0.0 (GraphPad Software, USA). Normality and homogeneity of variance assumptions were assessed using the Shapiro–Wilk test and Bartlett’s test, respectively, with a statistical significance set at p < 0.05. Scatter plots were generated to evaluate correlations, and Spearman’s rank correlation coefficient (rs) was calculated for each parameter.
Results
Patterns of IgE Reactivity to Grass and Weed Pollen
To assess sensitization to grass and weed pollen, a total of 119 serum donors diagnosed with allergic rhinitis (AR) underwent skin-prick testing (SPT) and enzyme-linked immunosorbent assay (ELISA) using six pollen extracts: four grass species (Bermuda grass, Cd; para grass, Um; Johnson grass, Sh; Manila grass, Zm) and two weed species (nutsedge, Cm; careless weed, Ah). Of the 119 patients, 21 were not administered SPT with Sh and Zm due to limited availability of the extracts as mentioned in the previous study.20
Overall, the average ELISA optical density (OD) showed no significant difference between most pollen extracts (mean ±SD: 0.127 ± 0.259 to 0.198 ± 0.466), except for Ah which displayed a lower mean OD and a high SD (mean ± SD: 0.057 ± 0.170) (Figure 1A). Interestingly, Sh pollen elicited the highest mean and median OD values among all pollen species. However, Sh pollen had the second-lowest positive SPT rate (24/98, 24.49%), while Cm pollen triggered the highest rate (76/119, 63.87%). Notably, one donor serum (P100) exhibited high ELISA ODs for all pollen extracts, including Ah, despite reporting no current medication use and having negative SPT results for all tested allergens. Patients with positive SPT results demonstrated a consistently higher median ELISA OD compared to those with negative SPT across all pollen extracts (Figure 1A and B). Clustering analysis based on ELISA OD revealed the closest sensitization profiles between Um and Sh, distinct from the other species. Cd and Zm clustered together, with a relationship to Cm. Ah remained the most distinct species within this group, in accordance with generally low IgE reactivity in the study population (Figure 1B).
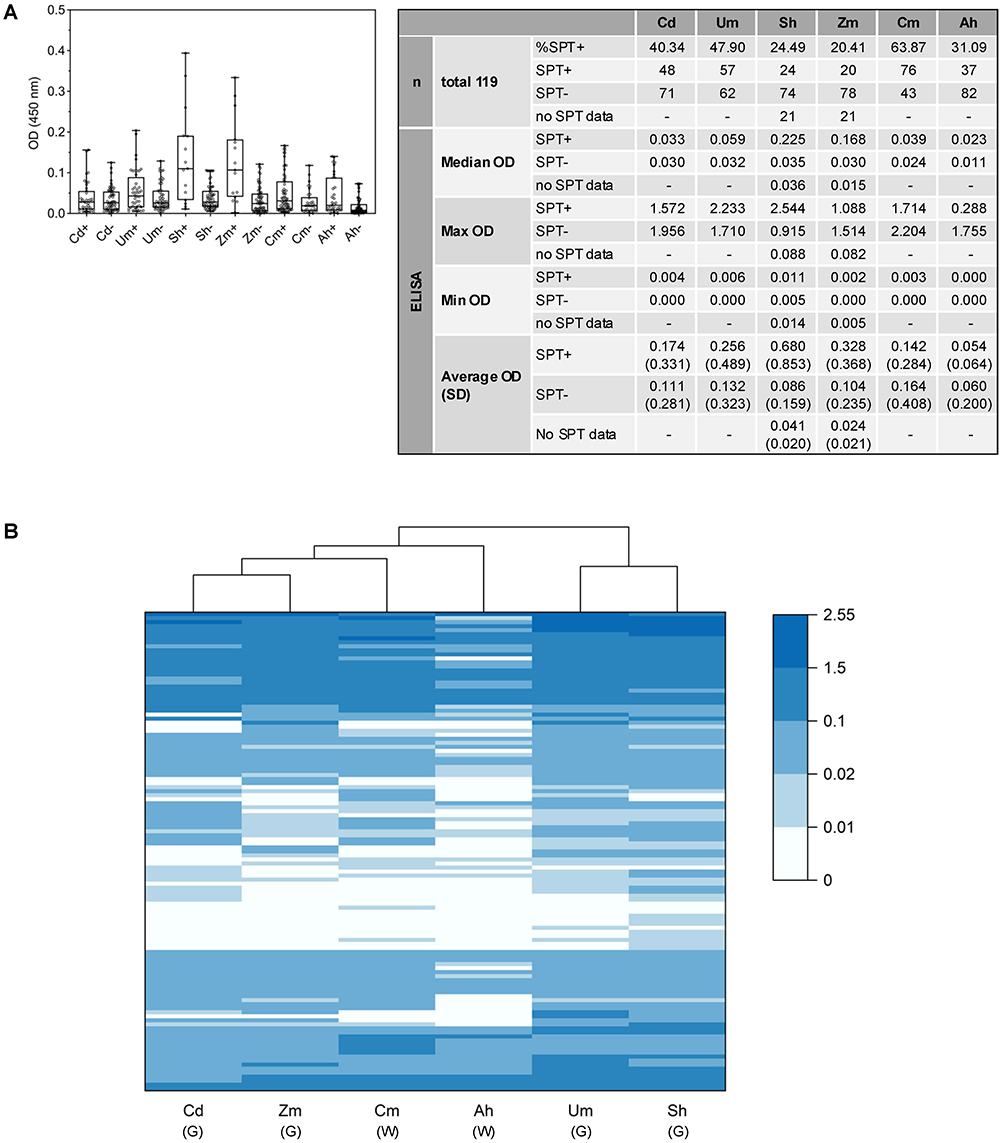 |
Figure 1 Pattern of sensitization to grass and weed pollen proteins in Thai AR patients measured by ELISA. (A) Patient IgE reactivity. Box plots with error bars represent median and interquartile range of ELISA optical density (OD) in absorbance units for AR patients (n=119). The table summarizes the average (mean ± SD), maximum (max), minimum (min), and median OD values for patients with positive SPT (SPT+), negative SPT (SPT-), and no SPT data. SPT data for Sh and Zm extracts was unavailable for some patients due to the unavailability of these extracts on the test date. (B) Hierarchical clustering and heatmap of ELISA OD levels. Heatmap illustration of ELISA OD levels to grass and weed pollen extracts for each patient. Columns represent pollen species, and rows represent patient number. The color scale represents OD values, with light blue indicating low IgE reactivity (low OD) and dark blue indicating high IgE reactivity (high OD). Grasses (G): Cd - Cynodon dactylon (Bermuda grass), Um - Urochloa mutica (para grass), Sh - Sorghum halepense (Johnson grass), Zm - Zoysia matrella (Manila grass). Weeds (W): Cm - Cyperus mitis (nutsedge), Ah - Amaranthus hybridus (careless weed). |
Correlation Analysis of IgE Reactivity to Various Pollen Species
To investigate the relationship between patient sensitization to various pollen species, Spearman correlation coefficients were calculated based on the ELISA results (Figure 2). Overall, the ELISA ODs revealed statistically significant positive correlations between all pollen species pairs (min and max rs = 0.740 and 0.935; all p-values < 0.0001). Notably, stronger positive correlations were generally observed among grass pollen species compared to those between grass and weed species. Furthermore, the analysis identified the strongest and weakest associations among the tested pollen species. The strongest correlation (rs = 0.935) was observed between Um and Zm, while the weakest association (rs = 0.740) was found between Sh and Ah.
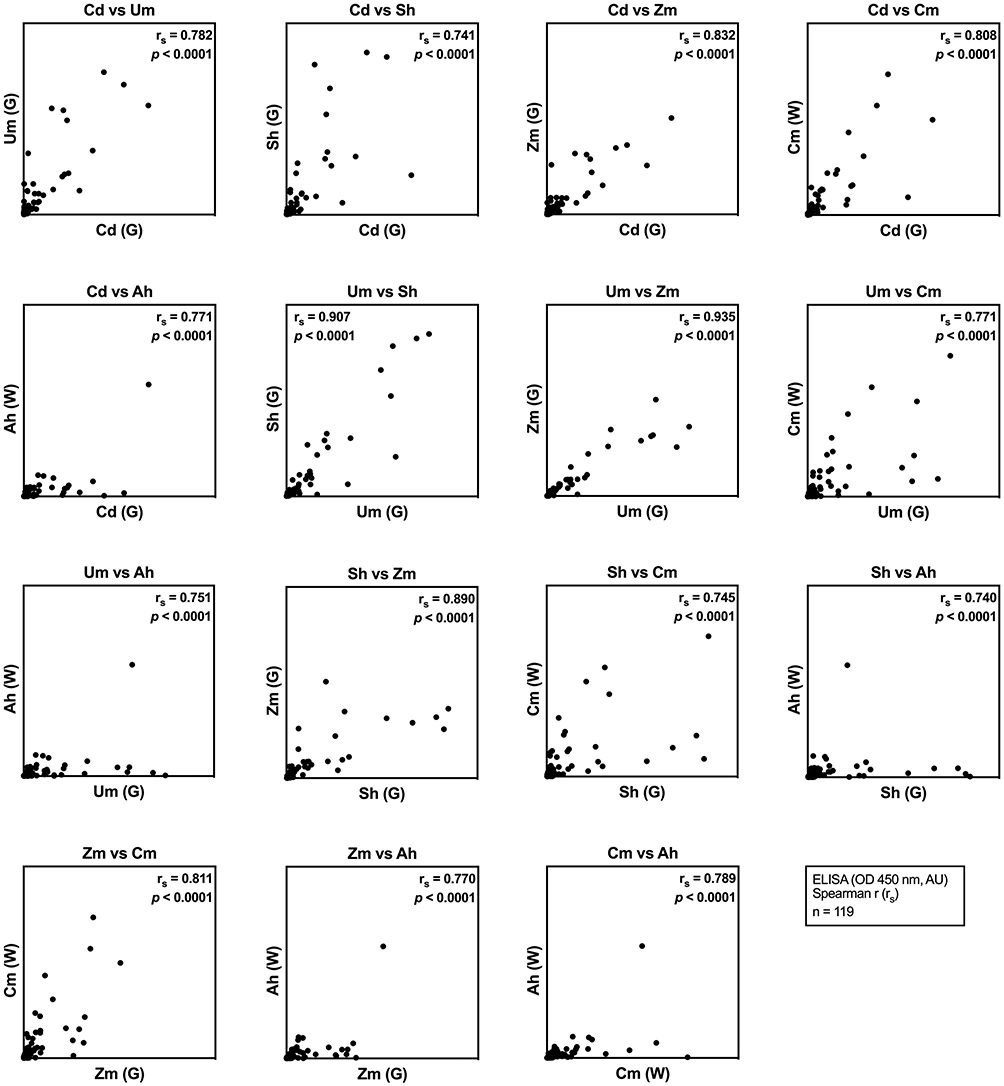 |
Figure 2 Correlation analysis of IgE reactivity between pollen species using indirect ELISA. Scatter plots illustrating Spearman correlation coefficient (rs) and corresponding p-values between IgE reactivity to various pollen species (n=119). IgE reactivity is shown in arbitrary units (AU). Grasses (G): Cd - Cynodon dactylon (Bermuda grass), Um - Urochloa mutica (para grass), Sh - Sorghum halepense (Johnson grass), Zm - Zoysia matrella (Manila grass). Weeds (W): Cm - Cyperus mitis (nutsedge), Ah - Amaranthus hybridus (careless weed). |
Within the grass group, the strongest correlation was observed between Um and Zm (rs = 0.935), followed by Um and Sh (rs = 0.907). In contrast, Cd and Sh exhibited the weakest association (rs = 0.741). Examining correlations between grass and weed species, the highest association was found between Zm and Cm (rs = 0.811), followed by Cd and Cm (rs = 0.808). Remarkably, even the lowest correlation observed, between Sh and Ah (rs = 0.740), still indicated a strong positive association. The correlation analysis within the weed group revealed a strong positive correlation between Cm and Ah (rs = 0.789).
Pollen Protein Profiles
Pollen protein profiles were studied using SDS-PAGE, and immunoblotting assessed the presence of IgE-reactive protein bands in 65 patient sera against various pollen extracts (Figure 3). SDS-PAGE analysis revealed variations in protein profiles between the pollen extracts, particularly for Ah (Figure 3A). A predominant band, consistently observed at approximately 30 kDa in all grass pollen extracts, corresponded to the previously identified Group-1 grass pollen allergen (beta-expansin) (Figure 3A and B). Notably, the major IgE-reactive band in Cm was approximately 25 kDa, and its identity remains unknown. The band from Ah exhibited comparatively lower intensity.
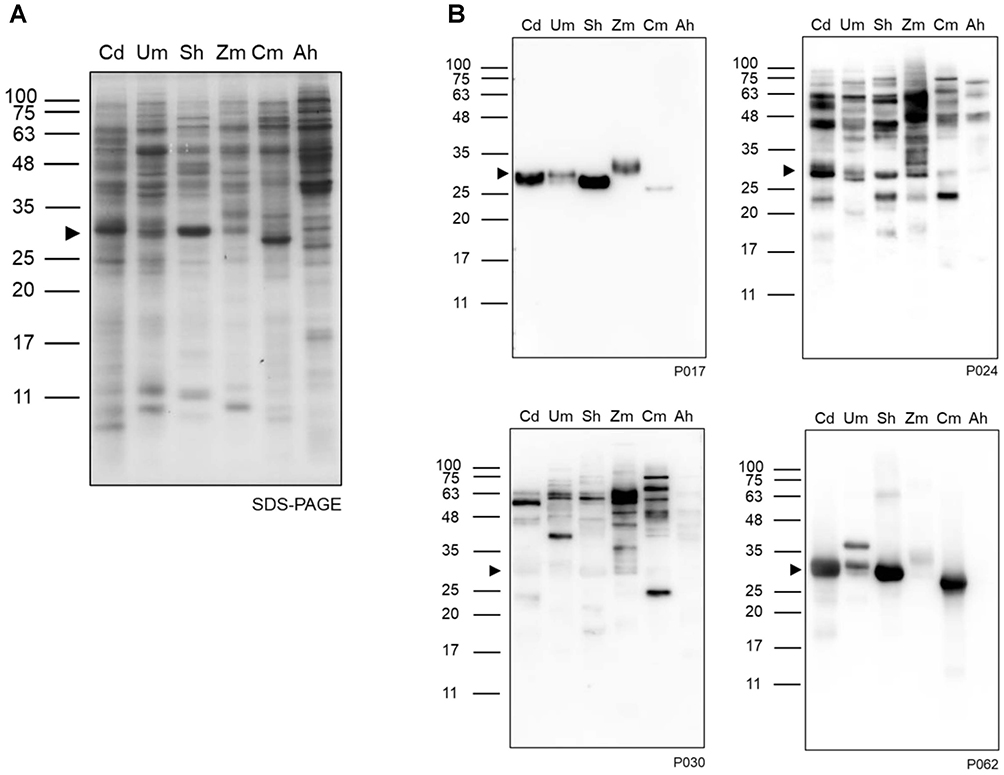 |
Figure 3 Immunoblot analysis of IgE reactivity in AR patients to grass and weed pollen protein extracts. n = 65. (A) Protein profiles of grass and weed pollen extracts. SDS-PAGE of crude extracts from various grass and weed pollen species. (B) IgE reactivity of AR patient sera to pollen extracts. Immunoblot analysis of IgE reactivity in sera from four representative AR patients (P017, P024, P030, P062) against each pollen extract. Sera were diluted 1:20 and incubated with 10 µg/well of pollen protein extract. Arrowheads highlight the Group-1 grass pollen allergen (beta-expansin), a major allergen in grasses. Lane designations correspond to the specific grass and weed pollen species. Grasses: Cd - Cynodon dactylon (Bermuda grass), Um - Urochloa mutica (para grass), Sh - Sorghum halepense (Johnson grass), Zm - Zoysia matrella (Manila grass). Weeds: Cm - Cyperus mitis (nutsedge), Ah - Amaranthus hybridus (careless weed). |
Band Intensity of IgE-Reactive Proteins
To assess patient IgE reactivity levels, the relative intensity of IgE-reactive bands in each immunoblot for all pollen species was manually scored as high, medium, or low (Figure 4). The distribution of patients across these reactivity levels was generally similar across all species, with some exceptions. Overall, the distribution of patients across three IgE reactivity levels was similar in all species, with Sh exhibiting the highest number of bands (256 bands). Specifically, at the high level, Sh had the greatest count of IgE-reactive bands (59 bands) compared to other species. Additionally, Sh showed the highest number of band sizes (23 band sizes). Ah consistently showed the fewest bands at all reactivity levels. Interestingly, for almost all pollen species except Zm, the low reactivity level contained the most bands, followed by medium and high. In Zm, the high reactivity level showed a higher number of bands than the medium level. In all species, bands with low intensity were more than 80% of the total number of band sizes, followed by bands with medium and high intensity, respectively. Most bands exhibited low intensity, comprising approximately 50–65% of the total number of bands. Furthermore, major protein bands with high prevalence (≥ 50%) were identified from all grass species. Notably, the 30 kDa protein was a major band in Cd and Sh, the 63 kDa protein in Um, Sh, and Zm, and the 50 kDa protein in Um.
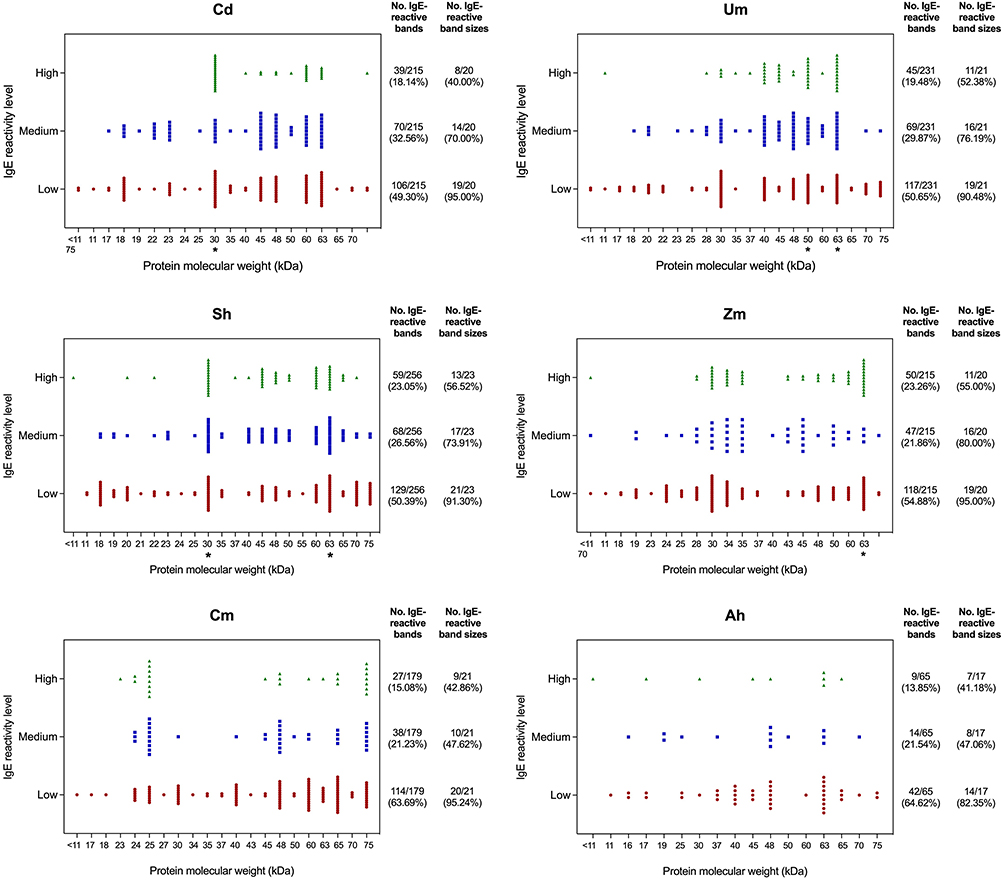 |
Figure 4 Patient IgE reactivity levels to each protein band. Scatter plots depict the IgE reactivity levels of individual AR patients (n = 65) to each protein band identified in the immunoblot assay. The intensity of IgE binding was visually scored as high, medium, or low. Each data point represents the IgE reactivity level of a single patient towards a specific protein band with different molecular weight (kDa). Grasses: Cd - Cynodon dactylon (Bermuda grass), Um - Urochloa mutica (para grass), Sh - Sorghum halepense (Johnson grass), Zm - Zoysia matrella (Manila grass). Weeds: Cm - Cyperus mitis (nutsedge), Ah - Amaranthus hybridus (careless weed). Asterisks indicate prevalence ≥ 50%. Percent prevalence = (total number of bands/number of patients) x 100. |
Relationship Between Prevalence and Intensity of IgE-Reactive Protein Bands
The relationship between the prevalence and average intensity of each detected band is illustrated in Figure 5. Frequently, protein bands with high prevalence were also observed to have relatively high intensity, albeit not the highest. In all grass species, the 30 and 60 kDa proteins had high prevalence and intensity. The 60 kDa protein exhibited relatively high prevalence percentages in Cd and Sh, while the 50 and 34 kDa proteins showed relatively high prevalence percentages in Um and Zm, respectively, all characterized by high intensity (Figure 5).
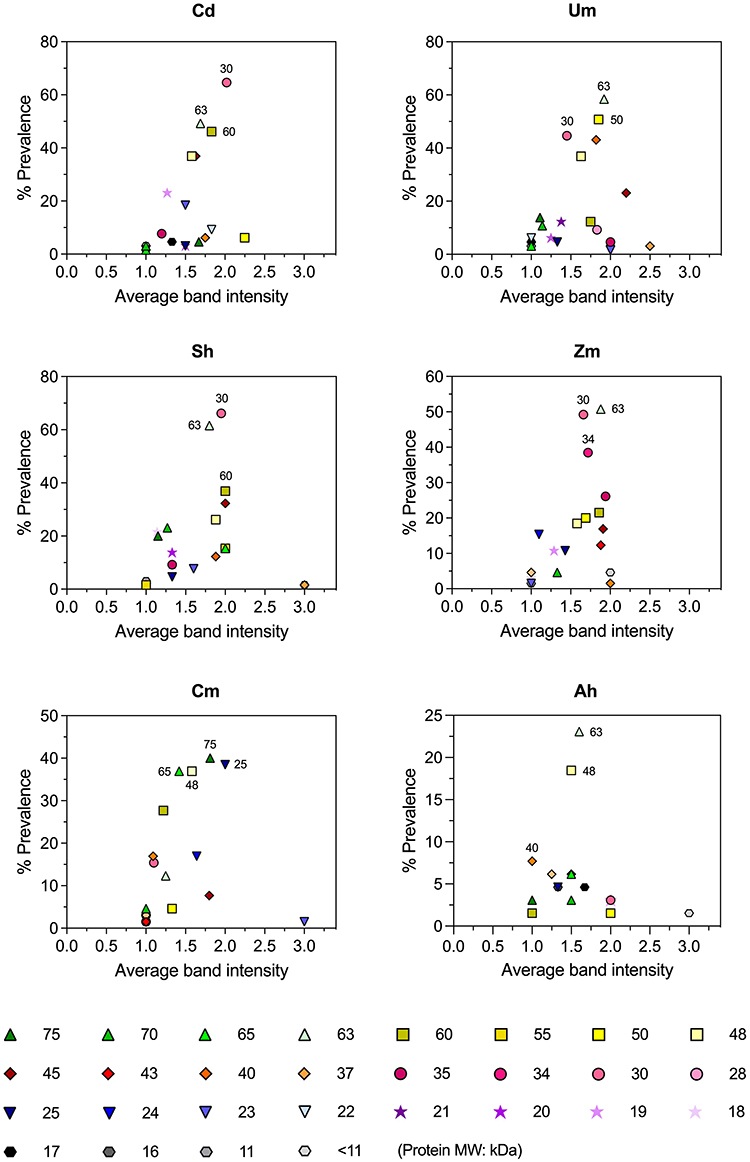 |
Figure 5 Intensity and prevalence of IgE-reactive protein bands in immunoblot analysis of AR patient sera. IgE reactivity levels in immunoblots against pollen protein extracts were visually scored based on band intensity: high (3), medium (2), and low (1). The average band intensity (arbitrary units, AU) and prevalence (percentage of patients with positive IgE reactivity against each particular band) are shown for each protein band (molecular weight indicated in kDa). Data were obtained from sera of 65 AR patients with positive SPT results for at least one pollen extract. The average band intensity of each protein band = [(number of bands × 3) + (number of bands × 2) + (number of bands × 1)]/total number of bands. The percent prevalence of each protein band = (total number of bands/number of patients) × 100. Grasses: Cd - Cynodon dactylon (Bermuda grass), Um - Urochloa mutica (para grass), Sh - Sorghum halepense (Johnson grass), Zm - Zoysia matrella (Manila grass). Weeds: Cm - Cyperus mitis (nutsedge), Ah - Amaranthus hybridus (careless weed). |
For Cm, the 75 kDa protein presented the highest percentage prevalence, followed by the 25 kDa protein, both exhibiting high intensity. Whereas Ah showed that the 63 and 48 kDa proteins were the most prevalent IgE-reactive proteins. Of note, low prevalence bands with the highest intensity were detected in Um (37 kDa), Sh (37 and < 11 kDa, superimposed), Cm (23 kDa), and Ah (< 11 kDa), as shown in Figure 5. The top three IgE-reactive proteins, with the highest percentage prevalence, from each species are summarized in Supplementary Table 1. The putative grass pollen allergen group for each protein, along with allergen characteristics, is detailed in the table.23–25 The number of IgE-reactive protein bands per patient from the immunoblots was summarized for each pollen species (Supplementary Figure 1).
Correlation Analysis of Patient Sensitization to Pollen Species
To evaluate the relationship between pollen species among 65 AR patients, Spearman correlation was performed and illustrated in heatmaps (Figure 6). Based on the number of bands, ELISA results, and SPT wheal size, the correlation between most grass species was higher than the correlation between grass and weed species. The results indicated a positive correlation between the number of IgE-reactive bands across all species. The highest significant positive correlation (rs = 0.81; p < 0.0001) was observed from Cd-Um and Um-Sh, while the lowest correlation was identified from Zm-Ah (rs = 0.33; p < 0.0001) (Figure 6A). A highly significant positive correlation of ELISA results was found for all species, with Um-Zm showing the highest correlation (rs = 0.94; p < 0.0001) (Figure 6B). Additionally, the data from the skin prick test (SPT) wheal size were also analyzed, revealing that Sh-Zm presented the highest positive correlation (rs = 0.77; p < 0.0001) (Figure 6C). The correlation of all analyzed parameters was summarized (Figure 6D). Interestingly, the average SPT wheal size exhibited a significantly positive correlation with the severity of AR (rs = 0.34; p = 0.006) and the average ELISA OD450 (rs = 0.27; p = 0.030). No significant correlation was found between the other parameters.
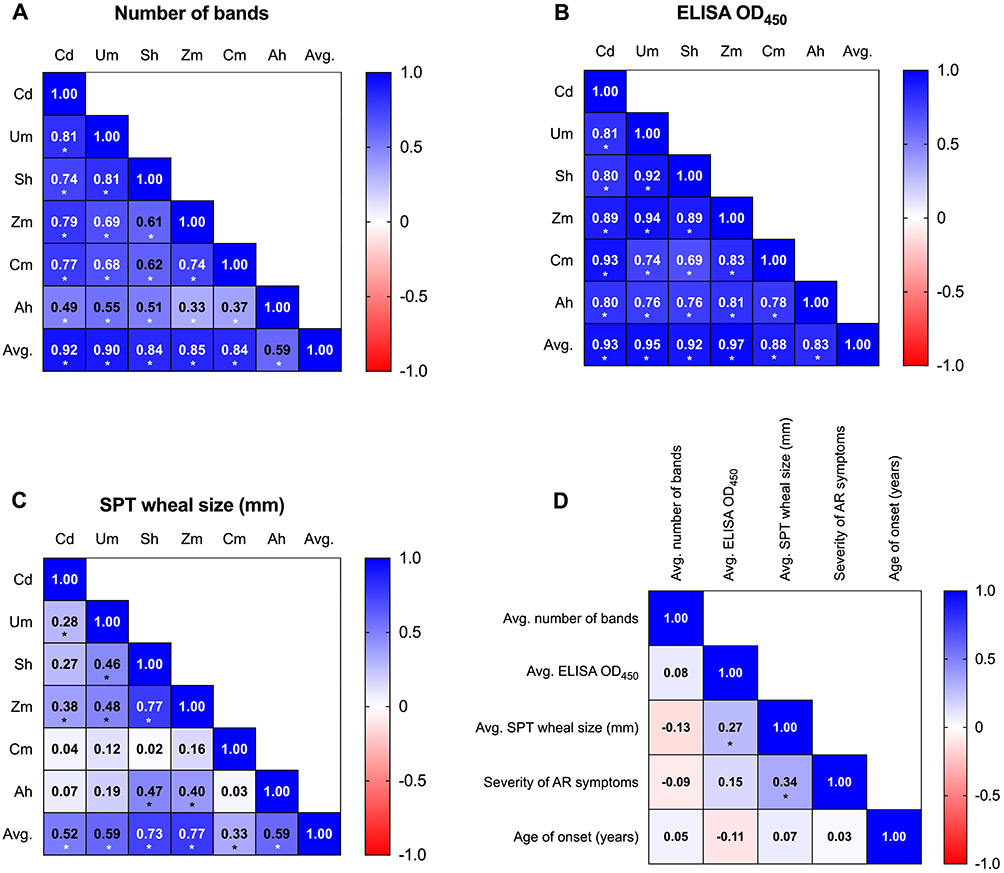 |
Figure 6 Correlation analysis of patient sensitization to pollen extracted proteins. Heatmaps represent Spearman correlation coefficients (rs) between various factors for each patient. Statistically significant correlations (p < 0.05) are marked with an asterisk (*). Correlation between pollen species based on (A) the number of IgE-reactive protein bands detected in immunoblot analysis, (B) ELISA OD values, and (C) SPT wheal size. (D) Summary of the correlation between the analyzed factors: average number of IgE-reactive protein bands, average of ELISA OD values, average of SPT wheal size, severity of AR, and age of onset. Data was analyzed from 65 patients (n = 65), who were selected for immunoblot. Grasses: Cd - Cynodon dactylon (Bermuda grass), Um - Urochloa mutica (para grass), Sh - Sorghum halepense (Johnson grass), Zm - Zoysia matrella (Manila grass). Weeds: Cm - Cyperus mitis (nutsedge), Ah - Amaranthus hybridus (careless weed). |
IgE Cross-Reactivity Between Grass and Weed Pollen Species
To further confirm IgE cross-reactivity between pollen species, an immunoblot inhibition assay was performed (Figure 7). The inhibition assay between grass species (Cd - Um) is shown in Figure 7A. The results demonstrated that patient IgE-binding to the ~30 kDa protein from Um was inhibited by Cd protein pre-incubation, and vice versa. This indicated that the IgE-binding epitopes of ~30 kDa protein from Cd and Um were cross-reactive with each other. Interestingly, patient no. 062 (P062) demonstrated IgE reactivity to the approximately 35 kDa band from Um. However, this band could not be inhibited by Cd (Figure 7A). In the case of grass (Um) and weed (Cm) species, patient IgE-binding to the ~30 kDa band of Um was partially inhibited by Cm (Figure 7B).
 |
Figure 7 Immunoblot inhibition to assess cross-reactivity of grass and weed pollen allergens. Patient sera (ID: P062, P103, P121; diluted 1:20) were pre-incubated with inhibitory proteins (0.125 µg/µL) from either (A) grass pollen extracts or (B) grass and weed pollen extracts. Each well contained 5 µg of the loaded (target) pollen protein extract. Reduced signal intensity after pre-incubation indicates potential cross-reactivity between the inhibitory and target allergens. Arrow heads indicate major IgE-reacting proteins. Grasses: Cd - Cynodon dactylon (Bermuda grass), Um - Urochloa mutica (para grass). Weed: Cm - Cyperus mitis (nutsedge). |
Furthermore, an ELISA inhibition assay was performed to quantify the extent of IgE cross-reactivity between two grass species (Um and Cd) and between grass (Um) and weed species (Cm) at various concentrations of inhibitory protein extracts. The results showed that the inhibition patterns varied among patients. In patients P103, the percentage of inhibition between the grass species was higher than between the grass and weed species, whereas the opposite was observed in patient P024. For patients P062 and P103, Um inhibited IgE reactivity to Cd more effectively than Cd inhibited IgE reactivity to Um. Additionally, for patient P062, Um demonstrated greater inhibition of Cm compared to the inhibition of Um by Cm, a pattern distinct from that observed in patients P024, P103, and P121. Notably, the percentage of inhibition of Cd by Um was similar to the self-inhibition of Cd, found in patients P024, P062, and P121 (Figure 8).
 |
Figure 8 ELISA inhibition assay for cross-reactivity of grass and weed pollen allergens. Patient sera (ID: P024, P062, P103, P121; diluted 1:16) were pre-incubated with inhibitory proteins (0.25, 0.125, 0.0625 µg/µL) from each pollen extract. Each well was coated with 0.5 µg of target pollen protein extract. Grasses: Cd - Cynodon dactylon (Bermuda grass), Um - Urochloa mutica (para grass). Weed: Cm - Cyperus mitis (nutsedge). |
Discussion
In this study, the patterns of IgE reactivity to grass and weed pollen species were successfully investigated and analyzed. Enzyme-linked immunosorbent assay (ELISA) results revealed varying IgE reactivity profiles among patients. Individuals who exhibited a high average OD for one species were likely to have a high average OD for others. Median OD of individuals with positive SPT was higher than who with negative SPT for all species. This implied that individuals who had positive SPT may have high serum IgE reactivity. Hierarchical clustering analysis of ELISA OD revealed that para grass and Johnson grass displayed highly similar IgE reactivity profiles, distinct from the remaining species. Bermuda grass and Manila grass clustered together, exhibiting profiles closely associated with nutsedge. Careless weed, however, showed a more pronounced separation from other species within this group. Based on the Angiosperm Phylogeny Group (APG) classification of flowering plants, para grass and Johnson grass belong to the Panicoideae grass subfamily, while Bermuda grass and Manila grass are classified under the subfamily Chloridoideae. Nutsedge is part of the Cyperaceae family, sharing the Poales order with grasses (Poaceae family). Whereas careless weed, belonging to the Amaranthaceae family, is categorized in a separate order, indicating a more distant botanical relationship.15 The close phylogenetic relationship likely explains the observed patterns of similar IgE reactivity and potential cross-reactivity due to the presence of homologous allergens with similar protein sequences.26 Additionally, positive correlations were observed among all species. However, stronger correlations were typically found within grass species compared to those between grasses and weeds. This suggests that IgE cross-reactivity may occur between grass species than between grass and weed species. However, the correlation between para grass and Manila grass was slightly higher than that between para grass and Johnson grass.
Immunoblot assays aimed at evaluating the presence of IgE-reactive protein bands in patients. The immunoblots revealed slight variations in protein profiles between pollen species. A notable observation was the predominant presence of a protein band around 30 kDa in grass pollen species. This protein band is attributed to the Group-1 grass pollen allergens, recognized as highly prevalent and potent allergens across all grass species.24 Group-1 allergens are classified as a subset of the beta-expansin (EXPB) family.27 Expansins play a role in the extension and loosening of the extracellular matrix within plant cells. This assists in pollen-tube penetration through the female flower.28 Group-1 allergens are identified as major allergens in both temperate and tropical/subtropical grass species. For instance, Phl p 1 from timothy grass,29 Cyn d 1 from Bermuda grass,30 Sor h 1 from Johnson grass,31 Uro m 1 from para grass,19 and Zoy m 1 from Manila grass.8 Group-1 allergen sequences from subtropical grasses had high percent identity (97.79–100%), suggesting high cross-reactivity.17
In this study, further analysis via immunoblots revealed a significant finding in the case of nutsedge, where the major interacting band shifted to approximately 25 kDa, previously unidentified as an allergen. Based on the immunoblot inhibition and ELISA inhibition, this 25 kDa major allergen in nutsedge pollen is likely to belong to Group-1 allergen, although further experiments are needed to confirm the identity of this protein. In careless weed, this protein appears to be a minor allergen.
In addition to the 30 kDa beta-expansin major allergen, this study also confirmed the 63 kDa protein as a major allergen from tropical/subtropical grasses based on high percentage prevalence and average intensity. The 63 kDa proteins belong to grass Group-4 allergens. Group-4 allergens, characterized as highly basic glycoproteins with molecular weights ranging from 50 to 67 kDa, were originally identified in grass species, including Phleum pratense L., Dactylis glomerata L., and Lolium perenne L.31–33 Given the finding that up to 80% of individuals sensitized to grass pollen show IgE reactivity to Group-4 allergens, these allergens can unequivocally be classified as major allergens.34,35 Immunogold electron microscopy investigations have suggested that Phl p 4, purified from timothy grass (P. pratense), might be located in both the cell wall and the cytoplasm.36 Group-4 allergens have been reported as flavoenzymes. Notably, BG60, a 60-kDa allergen from Bermuda grass (Cynodon dactylon (L). Pers.) pollen, was the first identified flavinylated allergen. The peptide sequences resulting from protease digestion exhibited a 40% similarity to berberine bridge enzymes in plants.37 Furthermore, Dac g 4, identified in Orchard grass (D. glomerata), has been proposed to be a flavoenzyme, as evidenced by its peptide sequence similarity to BG60.23 Unlike Group-1 allergens, Group-4 allergens are not specific to grasses.24 Group-5 grass allergens have been identified only from grass species in the Pooideae subfamily (temperate grasses).12 This study confirmed that Group-5 grass allergens are not major allergens from grass and weed species used in this study.
In addition to the known major allergens, this study also identified potentially important, but previously uncharacterized allergens. Currently, no allergenic proteins have been definitively identified from nutsedge. This study pinpoints the 75 kDa protein from this species, which showed the highest prevalence and high IgE reactivity. Careless weed exhibited the 63 kDa and 48 kDa proteins as the most prevalent IgE-reactive proteins, although their prevalence was below 25%. Similar to nutsedge, no allergens have been reported from this species. Currently, only Ama r 1 and Ama r 2 have been identified from redroot pigweed (Amaranthus retroflexus L)., a closely related species. Ama r 1 and Ama r 2 were characterized as Ole e 1-like protein and profilin, respectively.38,39 More studies are needed to obtain additional information about these IgE-reactive proteins.
To better understand individual patient allergic response profiles to various pollen species, we investigated the number of IgE-reactive protein bands per patient for all pollen species. Notably, most patients exhibited specific IgE reactivity to multiple allergens, indicating the complex nature of AR and its associated multi-morbidity. This finding aligns with previously published reports from France and Sweden.40 This could be due to several factors, including limitations in the sensitivity of the assay, the presence of non-IgE mediated allergies, or individual variations in immune responses. There are some limitations in band scoring, such as the non-quantitative nature and the dependency of band intensity to exposure time, which varied from blot to blot. Additionally, band intensity is relative to other bands on the same blot. Despite these limitations, we believe that useful information was extracted from the data.
Studies in Southeast Asia have shown that a substantial proportion of allergic patients exhibit IgE reactivity to multiple pollen allergens, reflecting the complex and diverse allergen sensitization patterns observed in the region. For instance, a study in the Philippines revealed that over 20% of allergic individuals demonstrated specific IgE reactivity to pollen allergens, even in the absence of clinical symptoms.41 This highlights the potential of specific IgE testing to uncover subclinical sensitizations, which may have implications for early intervention. Additionally, research conducted in Vietnam underscores the diverse allergen profiles in the region. The study reported that patients with allergic rhinitis frequently displayed sensitization to multiple pollen sources, complicating diagnosis and management.42 Similarly, studies in Thailand have documented a high prevalence of sensitization to grass, tree, and weed pollens, with evidence of IgE cross-reactivity contributing to multi-allergen sensitivity.43 In Malaysia, the study reported that allergic airway diseases were often driven by sensitization to multiple aeroallergens, including pollen, further supporting the regional trend of poly-sensitization.44 This aligns with our findings and underscores the shared challenges of diagnosing and managing allergic diseases across Southeast Asia.
While the number of IgE-reactive bands and ELISA results showed a strong correlation among grass and weed species, SPT wheal size demonstrated a weak correlation. This result might be due to the complexity of downstream signaling or regulation of symptoms. Additionally, SPT has its limitations, such as skin conditions, reliance on visual observation, and variability of testing extracts. Immunoblot inhibition and ELISA inhibition assays demonstrated partial inhibition between grass species and between grass and weed species. However, the inhibition results varied considerably between patients. This variability can be attributed to two factors. Firstly, patient-specific IgE antibodies may bind to different epitopes on the same protein. Secondly, the epitopes themselves may exhibit variations within the same protein molecule. Furthermore, different species contain diverse types and numbers of allergens, each presenting a unique array of epitopes. This IgE cross-reactivity analysis further supports our recent clinical study, which reported the extent of cross-reactivity among grass and weed species.20 This observation has implications for the selection of protein extracts in diagnostic approaches. Nevertheless, this study represents the first instance of presenting ELISA inhibition results for grass and weed pollen species in Thailand, necessitating further investigation given the limited existing literature. To elucidate clearer patterns of inhibition between species among Thai patients, future research should include larger patient samples.
The clinical relevance due to IgE cross-reactivity depends on a complex interplay of factors, including the body’s immune response to the allergen, exposure, and the specific characteristics of the allergen itself.45 Our findings revealed a significantly positive correlation between the average ELISA OD values and the average SPT wheal size. This suggests that individuals with higher levels of specific IgE antibodies are more likely to exhibit larger SPT wheal sizes, indicating a stronger immune response. There have been reports of an agreement and correlation between SPT and serum-specific immunoglobulin E (sIgE) tests.46,47 SPT wheal size has been found to be positively correlated with sIgE levels.47 Additionally, a significantly positive correlation was also observed between the average SPT wheal size and the severity of AR, suggesting that a larger wheal size might indicate a higher likelihood of experiencing more severe AR symptoms. Previously, a study reported an association between patient-reported clinical symptoms and SPT wheal size when exposed to aeroallergens.48 Moreover, several studies reported that sIgE was related to symptom severity in patients with AR or asthma.49,50 However, the relationship between SPT, sIgE levels, and the severity of AR symptoms is still a matter of ongoing debate. Although our findings demonstrate IgE cross-reactivity between specific grass and weed pollen species at the molecular level, their clinical significance remains to be fully elucidated. Correlations between IgE reactivity and SPT results suggest potential clinical relevance; however, longitudinal and outcome-based clinical studies are needed to confirm whether such cross-reactivity translates into allergic symptoms or influences management strategies.
The combined use of these assays provided a comprehensive assessment of cross-reactivity, which is crucial for understanding the allergenic relationships among species. These findings are expected to contribute to improving the diagnosis and management of pollen allergies in AR patients living in tropical and subtropical regions, particularly Southeast Asia. The knowledge provides data on locally prevalent allergens for the development of region-specific diagnostic tools, leading to more accurate allergy tests. It helps clinicians to design personalized immunotherapy protocols, consequently enhancing patient care and outcomes in these areas.
There are a few limitations of this study, including the exclusion of timothy grass, a well-established reference species in grass pollen allergy studies. This species is not naturally found in tropical or subtropical climates, including Southeast Asia and is not relevant to local environmental exposure or clinical sensitization patterns in our population. However, its inclusion in future studies may facilitate comparisons between tropical and temperate grass pollen sensitization and provide a useful benchmark for cross-reactivity analysis. Additionally, we acknowledge the limited geographical and demographic representation of the patient cohort, as patients were recruited from a single hospital in Bangkok. To elucidate more comprehensive insights into AR presentations within Thailand, future studies should include a larger, geographically diverse patient sample.
Conclusion
Overall, our study demonstrated patterns of grass and weed pollen sensitization in Thai AR patients in Bangkok, illustrated the relationships between IgE reactivity and SPT responses, and provided evidence for cross-reactivity among species for improving allergy diagnosis and management. Major new findings include high cross-reactivity between para grass and nutsedge. The cross-reactive proteins are a 30 kDa protein in para grass and a 25 kDa protein in nutsedge, suggesting that this 25 kDa protein is likely to be a beta-expansin. Additionally, the 25 kDa protein is the major IgE-reactive band in nutsedge with high prevalence and intensity. The 63 kDa protein is highly significant in all grasses. These proteins are promising candidates for novel allergens. This knowledge provides valuable understanding for developing diagnostic and therapeutic approaches for pollen allergies in Southeast Asia and other tropical/subtropical regions.
Abbreviations
AR, Allergic rhinitis; SPT, Skin prick test; ELISA, Enzyme-linked immunosorbent assay; OD, Optical density; Cd, Cynodon dactylon; Um, Urochloa mutica, Sh, Sorghum halepense, Zm, Zoysia matrella, Cm, Cyperus mitis; Ah, Amaranthus hybridus; APG, Angiosperm Phylogeny Group; EXPB, Beta-expansin; sIgE, Serum-specific immunoglobulin E.
Data Sharing Statement
The datasets used and/or analyzed during the current study are available from the corresponding author on reasonable request.
Ethics Approval and Consent to Participate
This study complied with the Declaration of Helsinki. This research was ethically reviewed and approved by the Siriraj Hospital Institutional Review Board (approval number: Si 171/2017). All participants involved in the study signed written informed consent forms agreeing to take part.
Declaration of Generative AI in Scientific Writing
During the preparation of this work, the authors used Chat GPT in order to improve the language of this article. After using this tool, the authors reviewed and edited the content as needed and took full responsibility for the content of the published article.
Acknowledgments
The authors acknowledge the valuable contribution of the ENT Allergy Clinic staff, Siriraj Hospital, who assisted with the skin prick tests and serum sample collection.
Author Contributions
All authors made a significant contribution to the work reported, whether that is in the conception, study design, execution, acquisition of data, analysis and interpretation, or in all these areas; took part in drafting, revising or critically reviewing the article; gave final approval of the version to be published; have agreed on the journal to which the article has been submitted; and agree to be accountable for all aspects of the work.
Funding
The Thailand Research Fund provided financial support for this study (grant number TRG5780182).
Disclosure
The authors have no conflicts of interest to declare for this work.
References
1. Dykewicz MS, Hamilos DL. Rhinitis and sinusitis. J Allergy Clin Immunol. 2010;125(2):S103–S115. doi:10.1016/j.jaci.2009.12.989
2. Bousquet J, Khaltaev N, Cruz AA, et al. Allergic Rhinitis and its Impact on Asthma (ARIA) 2008*. Allergy. 2008;63(s86):8–160. doi:10.1111/j.1398-9995.2007.01620.x
3. Wallace DV, Dykewicz MS, Bernstein DI, et al. The diagnosis and management of rhinitis: an updated practice parameter. J Allergy Clin Immunol. 2008;122(2 Suppl):S1–84. doi:10.1016/j.jaci.2008.06.003
4. Bunnag C, Jareoncharsri P, Tantilipikorn P, Vichyanond P, Pawankar R. Epidemiology and current status of allergic rhinitis and asthma in Thailand-ARIA Asia-Pacific workshop report. Asian Pacific J Allergy Immunol. 2009;27(1):79–86.
5. Davies JM. Grass pollen allergens globally: the contribution of subtropical grasses to burden of allergic respiratory diseases. Clin Exp Allergy. 2014;44(6):790–801. doi:10.1111/cea.12317
6. Worm M, Lee H, Kostev K. Prevalence and treatment profile of patients with grass pollen and house dust mite allergy. J Dtsch Dermatologischen Gesellschaft. 2013;11(7):653–661. doi:10.1111/ddg.12089
7. Luo W, Huang H, Zheng P, et al. Major grass pollen allergens and components detected in a southern Chinese cohort of patients with allergic rhinitis and/or asthma. Mol Immunol. 2016;78:105–112. doi:10.1016/j.molimm.2016.08.013
8. Somkid K, Aud-In S, Pinkaew B, Tantilipikorn P, Piboonpocanun S, Songnuan W. Manila grass (Zoysia matrella) Zoy m 1 allergen may contribute to allergic sensitization in tropical/subtropical regions due to extensive cross-reactivity with other group-1 grass pollen allergens. Asian Pacific J Allergy Immunol. 2021. doi:10.12932/AP-250920-0971
9. Tantilipikorn P, Pinkaew B, Talek K, Assanasen P, Suwanwech T, Bunnag C. Pattern of allergic sensitization in chronic rhinitis: a 19-year retrospective study. Asian Pacific J Allergy Immunol. 2021;39(3):156–162. doi:10.12932/AP-080719-0597
10. Bousquet PJ, Chinn S, Janson C, Kogevinas M, Burney P, Jarvis D. Geographical variation in the prevalence of positive skin tests to environmental aeroallergens in the European Community Respiratory Health Survey I. Allergy. 2007;62(3):301–309. doi:10.1111/j.1398-9995.2006.01293.x
11. Chan‐Yeung M, Anthonisen NR, Becklake MR, et al. Manila grass (Zoysia matrella) Zoy m 1 allergen may contribute to allergic sensitization in tropical/subtropical regions due to extensive cross-reactivity with other group-1 grass pollen allergens. Asian Pacific J Allergy Immunol. 2022;65(11):1404–1413. doi:10.12932/AP-250920-0971
12. Kailaivasan T, Davies JM. The molecular allergology of subtropical grass pollen. Mol Immunol. 2018;100:126–135. doi:10.1016/j.molimm.2018.03.012
13. Gadermaier G, Hauser M, Ferreira F. Allergens of weed pollen: an overview on recombinant and natural molecules. Methods. 2014;66(1):55–66. doi:10.1016/j.ymeth.2013.06.014
14. Katel P, Pinkaew B, Talek K, Tantilipikorn P. Pattern of aeroallergen sensitization and quality of life in adult Thai patients with allergic rhinitis. Front Allergy. 2021;2:1–12. doi:10.3389/falgy.2021.695055
15. Chase MW, Christenhusz MJM, Fay MF, et al. An update of the Angiosperm Phylogeny Group classification for the orders and families of flowering plants: APG IV. Bot J Linn Soc. 2016;181(1):1–20. doi:10.1111/boj.12385
16. Cox AL, Eigenmann PA, Sicherer SH. Clinical Relevance of Cross-Reactivity in Food Allergy. J Allergy Clin Immunol Pract. 2021;9(1):82–99. doi:10.1016/j.jaip.2020.09.030
17. Aud-in S, Somkid K, Songnuan W. Group-1 grass pollen allergens with near-identical sequences identified in species of subtropical grasses commonly found in Southeast Asia. Medicina (Kaunas). 2019;55(5):193. doi:10.3390/medicina55050193
18. Pacharn P, Songnual W, Siriwatanakul U, et al. Beta-EXPANsin of Bermuda, Johnson, and Para grass pollens, is a major cross-reactive allergen for allergic rhinitis patients in subtropical climate. Asian Pacific J Allergy Immunol. 2019;37(1):30–35. doi:10.12932/AP-071117-0191
19. Dhammachat S, Somkid K, Piboonpocanun S, et al. Isoforms of Group 1 Allergens from a Tropical/Subtropical Para Grass (Urochloa mutica) Display Different Levels of IgE Reactivity and Cross-reactivity. Eur Ann Allergy Clin Immunol. 2019;51(04):174. doi:10.23822/EurAnnACI.1764-1489.95
20. Aud-in S, Juprasong Y, Pinkaew B, Talek K, Tantilipikorn P, Songnuan W. Incidence of grass and weed sensitization in Bangkok, Thailand: a clinical study. Front Public Health. 2024;12:1–13. doi:10.3389/fpubh.2024.1301095
21. Heinzerling LM, Burbach GJ, Edenharter G, et al. GA 2 LEN skin test study I: GA2LEN harmonization of skin prick testing: novel sensitization patterns for inhalant allergens in Europe. Allergy. 2009;64(10):1498–1506. doi:10.1111/j.1398-9995.2009.02093.x
22. Songnuan W, Bunnag C, Soontrapa K, et al. Airborne pollen survey in Bangkok, Thailand: a 35-year update. Asian Pacific J Allergy Immunol. 2015;33(3):253–25362. doi:10.12932/AP0571.33.3.2015
23. Andersson K, Lidholm J. Characteristics and Immunobiology of Grass Pollen Allergens. Int Arch Allergy Immunol. 2003;130(2):87–107. doi:10.1159/000069013
24. Hrabina M, Peltre G, Van Ree R, Moingeon P. Grass pollen allergens. Clin Exp Allergy Rev. 2008;8(1):7–11. doi:10.1111/j.1472-9733.2008.00126.x
25. Gangl K, Niederberger V, Valenta R, Nandy A. Marker allergens and panallergens in tree and grass pollen allergy. Allergo J Int. 2015;24(5):158–169. doi:10.1007/s40629-015-0055-3
26. Aalberse RC, Akkerdaas J, Van Ree R. Cross-reactivity of IgE antibodies to allergens. Allergy Eur J Allergy Clin Immunol. 2001;56(6):478–490. doi:10.1034/j.1398-9995.2001.056006478.x
27. Cosgrove DJ, Bedinger P, Durachko DM. Group I allergens of grass pollen as cell wall-loosening agents. Proc Natl Acad Sci U S A. 1997;94(12):6559–6564. doi:10.1073/pnas.94.12.6559
28. Cosgrove DJ. Loosening of plant cell walls by expansins. Nature. 2000;407(6802):321–326. doi:10.1038/35030000
29. Valenta R, Vrtala S, Ebner C, Kraft D, Scheiner O. Diagnosis of grass pollen allergy with recombinant timothy grass (Phleum pratense) pollen allergens. Int Arch Allergy Immunol. 1992;97(4):287–294. doi:10.1159/000236135
30. Matthiesen F, Schumacher MJ, Lowenstein H. Characterization of the major allergen of Cynodon dactylon (Bermuda grass) pollen, Cyn d I. J Allergy Clin Immunol. 1991;88(5):763–774. doi:10.1016/0091-6749(91)90184-P
31. Campbell BC, Gilding EK, Timbrell V, et al. Total transcriptome, proteome, and allergome of Johnson grass pollen, which is important for allergic rhinitis in subtropical regions. J Allergy Clin Immunol. 2015;135(1):133–142. doi:10.1016/j.jaci.2014.06.034
32. Brodard V, David B, Görg A, Peltre G. Two-dimensional gel electrophoretic analysis with immobilized ph gradients of dactylis glomerata pollen allergens. Int Arch Allergy Immunol. 1993;102(1):72–80. doi:10.1159/000236553
33. Ekramoddoullah AKM, Kisil FT, Sehon AH. Immunochemical characterization of a high molecular weight basic allergen (HMBA) of rye grass (Lolium perenne) pollen. Mol Immunol. 1983;20(4):465–473. doi:10.1016/0161-5890(83)90027-5
34. Ford SA, Baldo BA. A re-examination of ryegrass (Lolium perenne) pollen allergens. Int Arch Allergy Immunol. 1986;81(3):193–203. doi:10.1159/000234134
35. Haavik S, Paulsen BS, Wold JK. Glycoprotein Allergens in Pollen of Timothy. Int Arch Allergy Immunol. 1985;78(3):260–268. doi:10.1159/000233896
36. Grote M, Stumvoll S, Reichelt R, Lidholm J, Valenta R. Identification of an allergen related to Phl p 4, a major timothy grass pollen allergen, in pollens, vegetables, and fruits by immunogold electron microscopy. Biol Chem. 2002;383(9):1441–1445. doi:10.1515/BC.2002.163
37. Liaw SH, Lee DY, Chow LP, Lau GX, Su SN. Structural characterization of the 60-kDa Bermuda grass pollen isoallergens, a covalent flavoprotein. Biochem Biophys Res Commun. 2001;280(3):738–743. doi:10.1006/bbrc.2000.4203
38. Morakabati P, Assarehzadegan MA, Khosravi GR, Akbari B, Dousti F. Cloning and expression of Ama r 1, as a novel allergen of Amaranthus retroflexus pollen. J Allergy. 2016;2016:1–8. doi:10.1155/2016/4092817
39. Tehrani M, Sankian M, Assarehzadegan MA, et al. Identification of a new allergen from amaranthus retroflexus pollen, ama r 2. Allergol Int. 2011;60(3):309–316. doi:10.2332/allergolint.10-OA-0279
40. Siroux V, Ballardini N, Soler M, et al. The asthma‐rhinitis multimorbidity is associated with IgE polysensitization in adolescents and adults. Allergy. 2018;73(7):1447–1458. doi:10.1111/all.13410
41. Sabit M, Wong C, Andaya A, Ramos JD. Pollen allergen skin test and specific IgE reactivity among Filipinos: a community-based study. Allergy Asthma Clin Immunol. 2020;16(1):1–10. doi:10.1186/s13223-020-00471-9
42. Pham D, Le Trinh THK, Le K, Pawankar R. Characteristics of allergen profile, sensitization patterns and allergic rhinitis in Southeast Asia. Curr Opin Allergy Clin Immunol. 2022;22(2):137–142. doi:10.1097/ACI.0000000000000814
43. Sritipsukho P. Effect of allergic rhinitis and asthma on the quality of life in young Thai adolescents. Asian Pacific J Allergy Immunol. 2015;33(3):222–226. doi:10.12932/AP0548.33.3.2015
44. Andiappan AK, Puan KJ, Lee B, et al. Allergic airway diseases in a tropical urban environment are driven by dominant mono‐specific sensitization against house dust mites. Allergy. 2014;69(4):501–509. doi:10.1111/all.12364
45. Ferreira F, Hawranek T, Gruber P, Wopfner N, Mari A. Allergic cross-reactivity: from gene to the clinic. Allergy Eur J Allergy Clin Immunol. 2004;59(3):243–267. doi:10.1046/j.1398-9995.2003.00407.x
46. Cho JH, Suh JD, Kim JK, Hong SC, Park IH, Lee HM. Correlation between skin-prick testing, individual specific IgE tests, and a multiallergen IgE assay for allergy detection in patients with chronic rhinitis. Am J Rhinol Allergy. 2014;28(5):388–391. doi:10.2500/ajra.2014.28.4074
47. Nam YH, Lee SK. Comparison between skin prick test and serum immunoglobulin E by CAP system to inhalant allergens. Ann Allergy Asthma Immunol. 2017;118(5):608–613. doi:10.1016/j.anai.2017.03.005
48. Haahtela T, Burbach GJ, Bachert C, et al. Clinical relevance is associated with allergen‐specific wheal size in skin prick testing. Clin Exp Allergy. 2014;44(3):407–416. doi:10.1111/cea.12240
49. Bauchau V, Durham SR. Epidemiological characterization of the intermittent and persistent types of allergic rhinitis. Allergy. 2005;60(3):350–353. doi:10.1111/j.1398-9995.2005.00751.x
50. Borish L, Chipps B, Deniz Y, Gujrathi S, Zheng B, Dolan CM. Total serum IgE levels in a large cohort of patients with severe or difficult-to-treat asthma. Ann Allergy Asthma Immunol. 2005;95(3):247–253. doi:10.1016/S1081-1206(10)61221-5
 © 2025 The Author(s). This work is published and licensed by Dove Medical Press Limited. The
full terms of this license are available at https://www.dovepress.com/terms
and incorporate the Creative Commons Attribution
- Non Commercial (unported, 4.0) License.
By accessing the work you hereby accept the Terms. Non-commercial uses of the work are permitted
without any further permission from Dove Medical Press Limited, provided the work is properly
attributed. For permission for commercial use of this work, please see paragraphs 4.2 and 5 of our Terms.
© 2025 The Author(s). This work is published and licensed by Dove Medical Press Limited. The
full terms of this license are available at https://www.dovepress.com/terms
and incorporate the Creative Commons Attribution
- Non Commercial (unported, 4.0) License.
By accessing the work you hereby accept the Terms. Non-commercial uses of the work are permitted
without any further permission from Dove Medical Press Limited, provided the work is properly
attributed. For permission for commercial use of this work, please see paragraphs 4.2 and 5 of our Terms.