Back to Journals » OncoTargets and Therapy » Volume 10
Initial experience of correlating diffusion spectral parameters with histopathologic indexes in murine colorectal tumor homografts
Authors Zhang XY, Li XT, Sun J, Sun YS
Received 10 November 2016
Accepted for publication 16 May 2017
Published 26 August 2017 Volume 2017:10 Pages 4213—4223
DOI https://doi.org/10.2147/OTT.S127283
Checked for plagiarism Yes
Review by Single anonymous peer review
Peer reviewer comments 3
Editor who approved publication: Dr Carlos E Vigil
Xiao-Yan Zhang, Xiao-Ting Li, Jia Sun, Ying-Shi Sun
Key Laboratory of Carcinogenesis and Translational Research (Ministry of Education), Department of Radiology, Peking University Cancer Hospital & Institute, Beijing, People’s Republic of China
Purpose: To determine the correlation between continuously distributed diffusion-weighted image (DWI)-derived parameters and histopathologic indexes.
Methods: Fifty-four mice bearing HCT-116 colorectal tumors were included for analysis; 12 mice were used for continuous observation, and the other 42 mice were used for break-point observation. All mice were randomly divided into radiotherapy and non-radiotherapy groups. Optical imaging and MRI were performed at different time points according to radiotherapy regimen (baseline, 24 h, 48 h, 72 h, 7 d, 14 d, and 28 d). Continuous observation data were analyzed to show the difference of dynamic changing trends of optical and MR-DWI–derived parameters between radiotherapy and non-radiotherapy groups (photon numbers, D_max, full width half maximum [FWHM], and apparent diffusion coefficient [ADC] value). Break-point observation data were used to analyze the correlation between histopathologic indices and DWI-derived parameters.
Results: There was a significant difference in the changing trends of photon numbers, D_max, FWHM, and ADC value between radiotherapy and non-radiotherapy groups, especially at early time points. There was moderate negative correlation between Ki67 and percentage changes of D_max, FWHM, and ADC values (the correlation coefficients were 0.632, 0.449, and 0.586, P<0.001, P=0.008, and P<0.001, respectively). There was moderate negative correlation between survivin and percentage changes of D_max and ADC values (correlation coefficients were 0.496 and 0.473, P=0.004 and P=0.006, respectively).
Conclusion: The continuously distributed DWI-derived parameters could reflect histological behavior to some extent and, thus, are potential markers for early noninvasive monitoring of tumor cell apoptosis and proliferation.
Keywords: magnetic resonance imaging, diffusion-weighted imaging, continuously distributed, colorectal cancer, murine homografts
Introduction
Rectal cancer is one of the leading causes of cancer mortality worldwide. Although resection of the tumor lesion may be beneficial in patients with early-stage (T1 and T2 stages) rectal carcinoma, most patients with locally advanced rectal carcinoma (LARC) are ineligible for surgery directly. In such cases, neoadjuvant chemoradiotherapy is routinely used to improve local control.1
Tumor responses to preoperative treatment are highly heterogeneous. Accurate identification of tumor responses enables the optimal individualized preoperative treatment.2–4 Presently, many clinical studies have indicated the usefulness of diffusion-weighted image (DWI) in predicting tumor response to preoperative treatment for rectal cancer.5–7
To date, most DWI studies of the rectum have used b-factor within 0–1,000 s/mm2 range, and apparent diffusion coefficient (ADC) values were usually calculated by assuming monoexponential or biexponential signal decay functions. However, in both animal and human studies,8,9 it has been shown that the signal decay with b-factor over an extended b-factor range is better modeled by assuming multiexponential decay functions. The biexponential (two-component), stretched-exponential (multi-component), and Gaussian-exponential (multi-component) models were all potentially available, and these models all need a constant number of diffusion composition or a predefined regular ADC value distribution such as a Gaussian distribution,9–11 and an ideal state cannot be achieved in them. Generally, in in vivo experiments, each voxel or region of interest (ROI) contains numerous vessels and cells with different sizes, orientations, geometries, and membrane permeabilities. Therefore, the distribution of diffusion coefficients is heterogeneous and complicated. Instead of making assumptions about the number or the distribution of diffusion components, it is desirable to describe the system in terms of a general integral equation where signal decay is the result of a continuous distribution of diffusion components. In this study, a diffusion spectral model is constructed on the basis of a regularized non-negative least squares algorithm. By assuming this model, we proposed to calculate pure molecular-based diffusion, perfusion-related diffusion, and other parameters indicating tissue characterization or features, and also to compare the differences between radiotherapy and non-radiotherapy groups of Balb/c mice with rectal tumor homografts. Additionally, we proposed to explore the histologic mechanism of the novel DWI-derived parameter by testing the relationship between these parameters and tumor cell proliferation and apoptosis.
Materials and methods
Ethics statement
This study was approved by the Ethics Committee of Beijing Cancer Hospital.
Animal model
Transfection of cells
HCT-116 cells were purchased from Shanghai Cell Bank of Chinese Academy of Sciences (Shanghai, People’s Republic of China) and divided into a negative control group (non-transfected group) and experimental group (green fluorescent protein [GFP]). HCT-116 cells (2×10⁵ cells) in the logarithmic growth phase were seeded in six-well culture plates with Roswell Park Memorial Institute 1640 medium (GIBCO, Thermo Fisher Scientific, Waltham, MA, USA) without any antibiotic, incubated overnight to get 70% in the logarithmic growth phase, and then transfected (per the manufacturer’s instructions for Lipo2000). After 48 h, stable cell lines expressing GFP were achieved and were cultured (Figure 1).
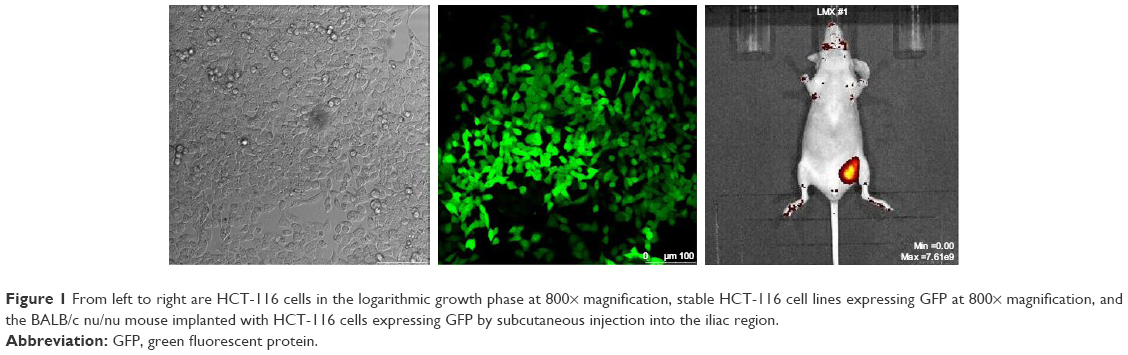 | Figure 1 From left to right are HCT-116 cells in the logarithmic growth phase at 800× magnification, stable HCT-116 cell lines expressing GFP at 800× magnification, and the BALB/c nu/nu mouse implanted with HCT-116 cells expressing GFP by subcutaneous injection into the iliac region. |
Fifty-eight male BALB/c nu/nu mice (age 5–6 weeks, weight 18–22 g) were obtained from the Chinese Academy of Medical Sciences (Beijing, People’s Republic of China). All animals were implanted with HCT-116 cells (1×10⁷ cells in 0.1 mL culture medium) by subcutaneous injection into the iliac region. Treatment was begun when tumors grew to 0.7–1 cm (~3–4 weeks). Experiments were performed in accordance with the regulations of the National of Institute of Health Guide for the Care and Use of Laboratory Animals. Four mice were excluded due to model inconsistency (too large or too small). Therefore, 54 mice were included in the experiment. Twelve mice were used for consecutive optical imaging and MR scanning observation, and 42 mice were used for break-point observation.
Twelve randomly chosen mice underwent optical imaging and MR scanning, and were then divided into two groups randomly – radiotherapy and non-radiotherapy groups. After radiotherapy, these 12 mice underwent optical imaging and MR scanning at different time points (24 h, 48 h, 72 h, 7 d, 14 d, and 28 d).
Forty-two mice, which were used for break-point observation, underwent optical imaging and MR scanning, and were then divided into two groups randomly – radiotherapy and non-radiotherapy groups. After radiotherapy, optical imaging and MR scanning were performed at different time points (24 h, 48 h, 72 h, 7 d, 14 d, and 28 d), similar to that in the abovementioned consecutive observation. However, the difference was that three randomly chosen mice from each group were sacrificed, and histological examination was performed.
MR scanning
All examinations were performed with a 3.0 Tesla MRI scanner (DISCOVERY MR750, GE Healthcare, Little Chalfont, Buckinghamshire, UK) using specific animal coil. The examinations included axial and coronal T2 weighted image (T2WI) as well as DWI. To prevent artifacts from bowel peristalsis, 1 mg glucagon (Glucagon G Novo, Eisai, Tokyo, Japan) was intramuscularly administered before imaging. T2WI was performed with repetition time/echo time (TR/TE) of 2000/102.1 ms, matrix 256×256, slice thickness 1.6 mm, and number of excitation (NEX) 16 (Figure 2).
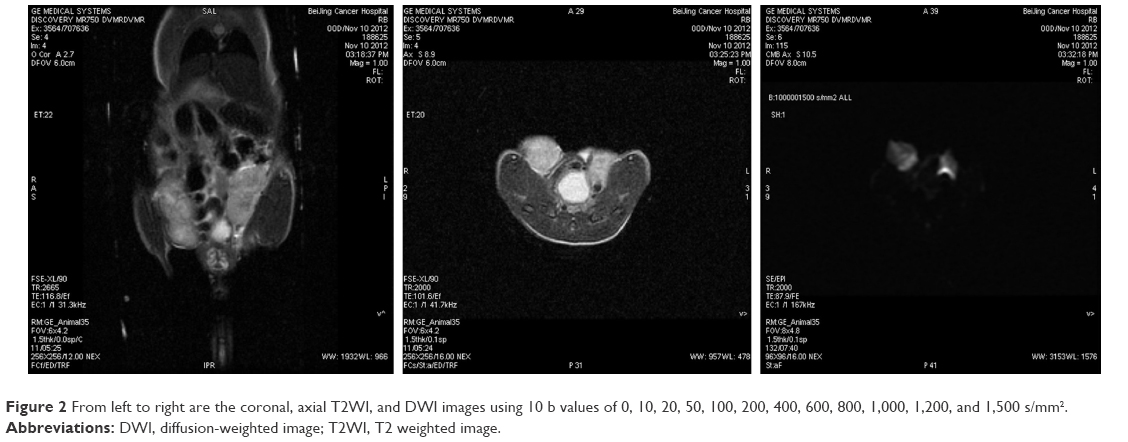 | Figure 2 From left to right are the coronal, axial T2WI, and DWI images using 10 b values of 0, 10, 20, 50, 100, 200, 400, 600, 800, 1,000, 1,200, and 1,500 s/mm2. |
DWI was performed with TR/TE of 2000/87.9 ms, field of view (FOV) 6×4.2 cm, matrix 128×128, slice thickness 1 mm, and NEX 1. The diffusion weighting was performed along three orthogonal directions at 10 b values of 0, 10, 20, 50, 100, 200, 400, 600, 800, 1,000, 1,200, and 1,500 s/mm2. A parallel imaging technique and sensitivity encoding were used to reduce gradient-echo train lengths by a factor of 2 (Figure 3). ROIs were manually circumscribed for high-signal areas on lesions observed in DW images. ROIs were drawn on the b0 image with a homogenous tumoral area, consistent with minimal contamination from unintended tissues; signal intensities were measured for each b value within the same ROI (Figure 3).
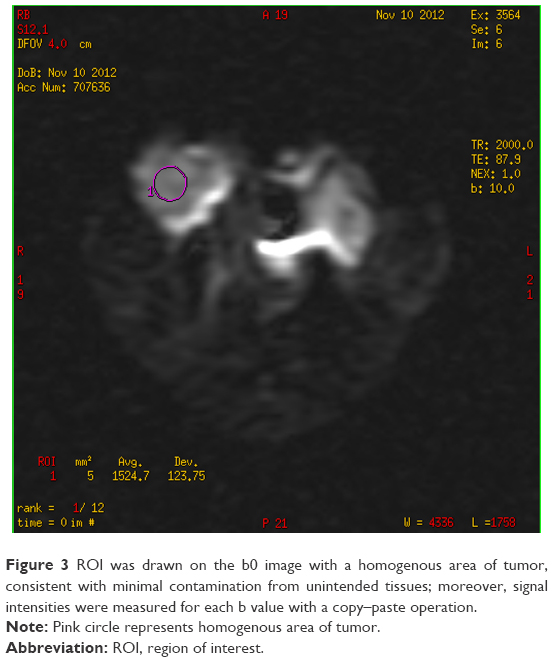 | Figure 3 ROI was drawn on the b0 image with a homogenous area of tumor, consistent with minimal contamination from unintended tissues; moreover, signal intensities were measured for each b value with a copy–paste operation. |
MR image analysis
MRI examinations were interpreted and analyzed by consensus of two experienced radiologists who were blinded to the treatments the mice received.
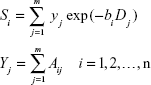
Instead of making assumptions about the number of diffusion components, such a system can be described in terms of a general integral equation
| [a] |
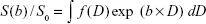
where S is signal intensity and f(D) is the proportion of tissues with specific diffusion coefficient D.
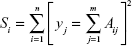
For computer implementation, Eq [a] could be discretized as
|
|
where Aij = exp (−bi Dj, and yj = S0 fj is the amplitude of the spectral component at Dj.
It is a typical ill-posed problem for which it is difficult to obtain an analytical solution. It can be solved by the non-negative least-squares (NNLS) scheme, which minimizes the least-squares misfit and, meanwhile, confines all elements of y to be non-negative.
To construct a diffusion spectrum which is more realistic for the physical system, additional constraints are incorporated into the Eq [c]
| [c] |
| [d] |
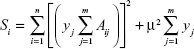
where μ is the trade-off factor which represents the extent of regularization.
After all of the y values in Eq [a] are calculated, the diffusion spectrum was determined. Finally, parameters of the spectrum were extracted for statistical analysis. Two major parameters, D_max and FWHM are considered in this study. D_max is the largest diffusion component in the spectrum (the Dj value corresponding to the largest yj). FWHM is the full width at half maximum yj.
Meanwhile, conventional ADC values are calculated by Functool (GE Healthcare) for the comparison.
Optical imaging
Isoflurane (3%) together with an oxygen-transporting carrier was used as an inhalational anesthetic for inducing anesthesia in mice and deepened with 2% concentration to maintain anesthesia. Optical imaging instrument (Xenogen IVIS), excitation light 490 nm, and absorption wavelength of 509 nm were used. Optical indicators included photon numbers and radiant efficiency (Figure 1).
Radiotherapy
Mice were anesthetized with pentobarbital (50 mg/kg i.p.). The iliac region was irradiated with a total of 12 Gy in two daily fractions (6 MV photon beam at a source-to-axis distance of 100 cm and dose rate 2.4 Gy/min) administered by an accelerator (Clinac 1800, Varian Associates Inc., CA, USA). Two tissue-equivalent polystyrene plates (1.5 cm upward and 4.5 cm downward) were used to provide adequate build-up.
Histopathological analysis
After the mice were sacrificed, Ki67, survivin, and cyclin D stainings of each tumor tissue specimen were performed on formalin-fixed, paraffin-embedded 5 μm-thick sections. Primary antibodies used in this study were Ki67 at 1:500 (abcam), survivin at 1:250 (abcam), and cyclin D at 1:1,000 (abcam). Second antibodies used in this study were products of Zhong Shan Company. Immunohistochemical analysis was performed by two investigators who were blinded to the treatment each animal had received. The pathologic indices were all determined by counting a total of at least 1,000 neoplastic nuclei subdivided in 10 fields that were randomly chosen at 400× magnification. Positive signals were all defined as the presence of a distinct brown staining on nuclei of neoplastic cells. At least 10 digital pictures were taken for each section, away from areas of necrosis but otherwise randomly. The digital images were assessed using Image-Pro Plus 6.0 software, and the integral optical density (IOD) of each photograph was ascertained.
Statistical analysis
Intergroup comparisons for the baseline data and time-dependent percentage change of DWI parameters and photon numbers were performed using data from the 12 mice for continuous observation. Intergroup comparisons for the change of histopathological index and correlation between histopathological index and MRI parameters were carried out using data from the 42 mice for break-point observation. Kolmogorov–Smirnov test was used to determine whether the variables or percentage change of variables were normally distributed. An independent t-test or Mann–Whitney test was performed to test for any statistical differences between groups. Pearson correlation coefficient was calculated to measure the linear relationship between variables. A two-tailed P<0.05 indicated significant statistical difference.
Result
Time-dependent percentage change of DWI-derived parameters between radiotherapy and non-radiotherapy groups
Continuous observation data was used to test whether there was any difference in the baseline data and time-dependent percentage change of DWI parameters and photon numbers between radiotherapy and non-radiotherapy groups. There were no significant differences in DWI-related parameters at baseline between the two groups, all P>0.05.
Within 48 hours after radiotherapy, there was a contrary changing tendency observed in D_max, FWHM, and ADC values between radiotherapy and non-radiotherapy groups. That is, D_max, FWHM, and ADC values in the radiotherapy group were significantly higher than baseline values, whereas D_max, FWHM, and ADC values in the non-radiotherapy group were slightly reduced than baseline values (Figure 4). The significantly different percentage changes between radiotherapy and non-radiotherapy groups within 48 h were detected for D_max, FWHM, and ADC values (Table 1). The percentage change of D_max and FWHM between radiotherapy and non-radiotherapy groups became similar after 7 d, but ADC values still presented differences between radiotherapy and non-radiotherapy groups at 72 h, 7 d, and 14 d, which indicated that ADC values might be a more sensitive parameter.
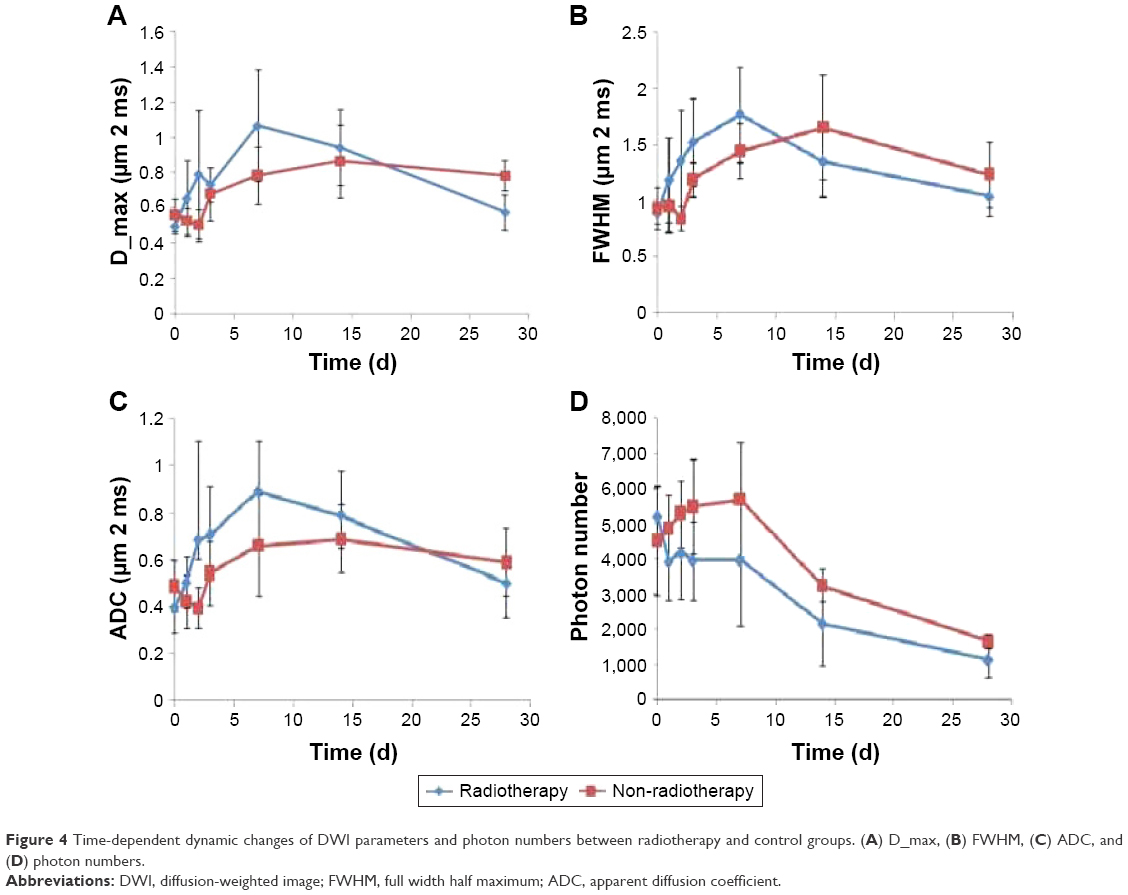 | Figure 4 Time-dependent dynamic changes of DWI parameters and photon numbers between radiotherapy and control groups. (A) D_max, (B) FWHM, (C) ADC, and (D) photon numbers. |
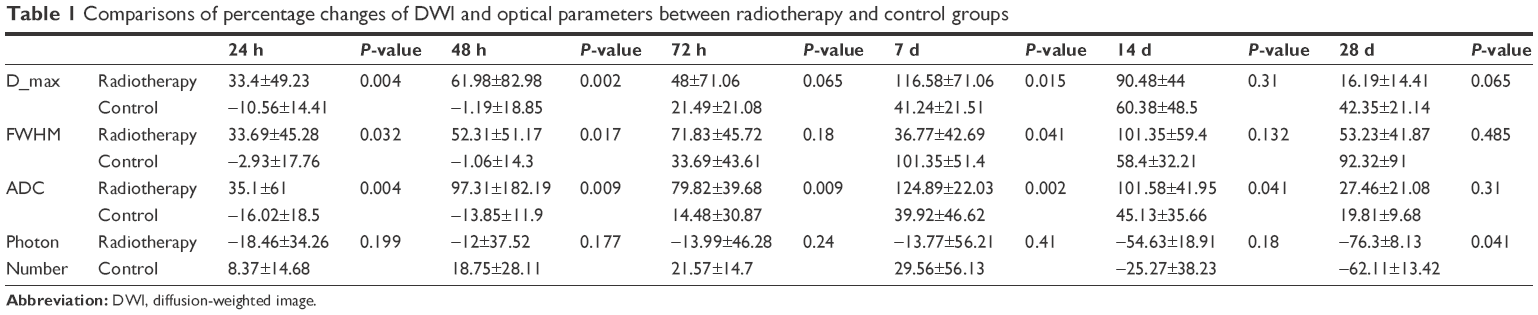 | Table 1 Comparisons of percentage changes of DWI and optical parameters between radiotherapy and control groups |
Time-dependent percentage change of photon numbers and its relationship with DWI-derived parameters
Within 7 days after radiotherapy, there was a contrasting changing tendency of photon numbers between radiotherapy and non-radiotherapy groups (Figure 4). That is, photon numbers in the radiotherapy group significantly declined as compared with baseline values, whereas photon numbers continuously increased in the non-radiotherapy group. Seven days later, photon numbers declined in both two groups. The percentage changes of photon numbers between radiotherapy and non-radiotherapy groups were significantly different at 28 d; the photon numbers of radiotherapy group declined more than those in the non-radiotherapy group (P=0.041; Table 1).
Furthermore, we analyzed the relationship between DWI-related parameters and optical photon numbers. Among D_max, FWHM, and ADC values, only FWHM showed a significant negative correlation with photon numbers (P=0.024), and the correlation coefficient was 0.266. D_max and ADC values showed no correlation with photon numbers (P=0.104 and P=0.163, respectively).
Relationship between DWI-related parameters and histopathologic indices
The changing trends of histopathologic indices between radiotherapy and non-radiotherapy groups are presented in Figure 5. The integrated optical density (IOD) of Ki67, survivin and cyclin declined after radiotherapy; however, the IOD of Ki67, survivin, and cyclin was sustained or slightly increased in the non-radiotherapy group. There was a significantly negative correlation detected between Ki67 and percentage changes of D_max, FWHM, and ADC values (P<0.001, P=0.008, and P<0.001, respectively), and the correlation coefficients were 0.632, 0.449, and 0.586, respectively (Figures 6 and 7). There was a significantly negative correlation detected between survivin and percentage changes of D_max and ADC values (P=0.004 and P=0.006, respectively; Figure 7), and the correlation coefficients were 0.496 and 0.473, respectively. But no significant correlation was detected between survivin and percentage change of FWHM (P=0.113). Between cyclin and change rates of D_max, FWHM, and ADC values, no significant correlations were detected (P=0.158, P=0.222, and P=0.063, respectively).
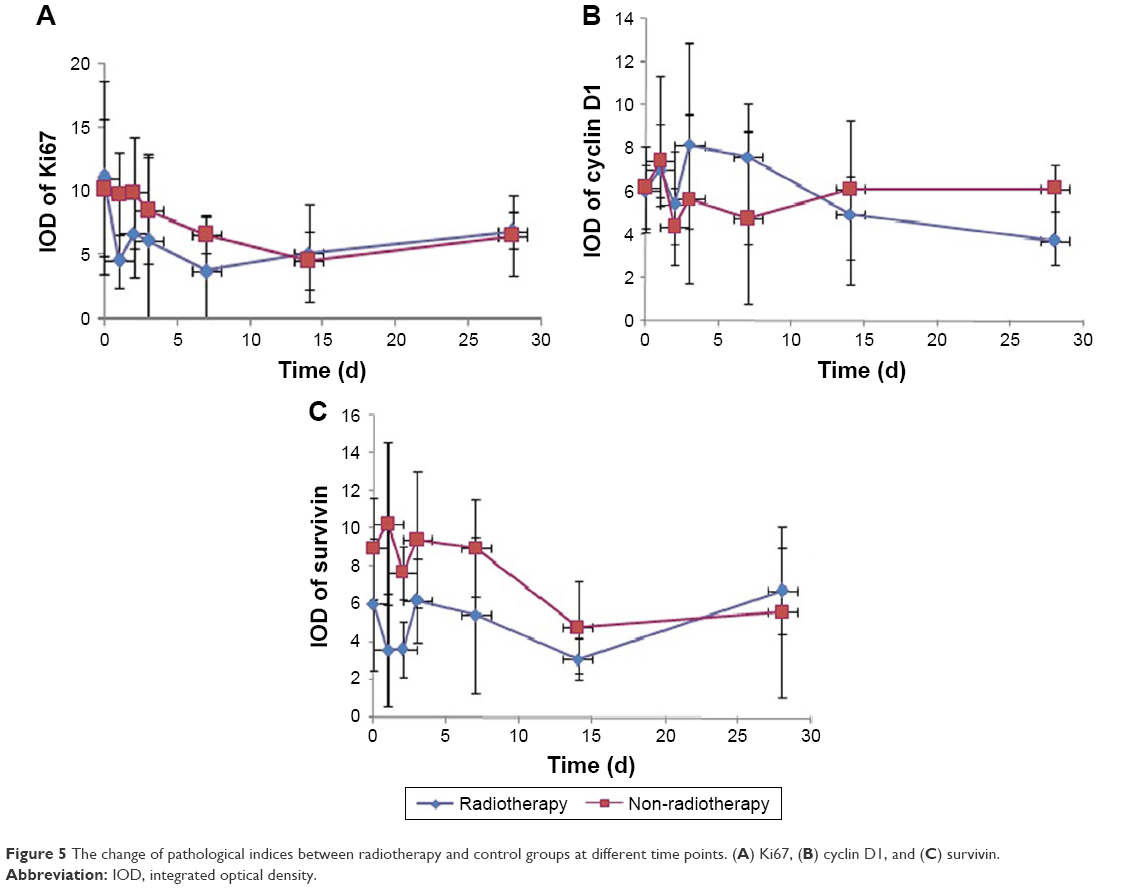 | Figure 5 The change of pathological indices between radiotherapy and control groups at different time points. (A) Ki67, (B) cyclin D1, and (C) survivin. |
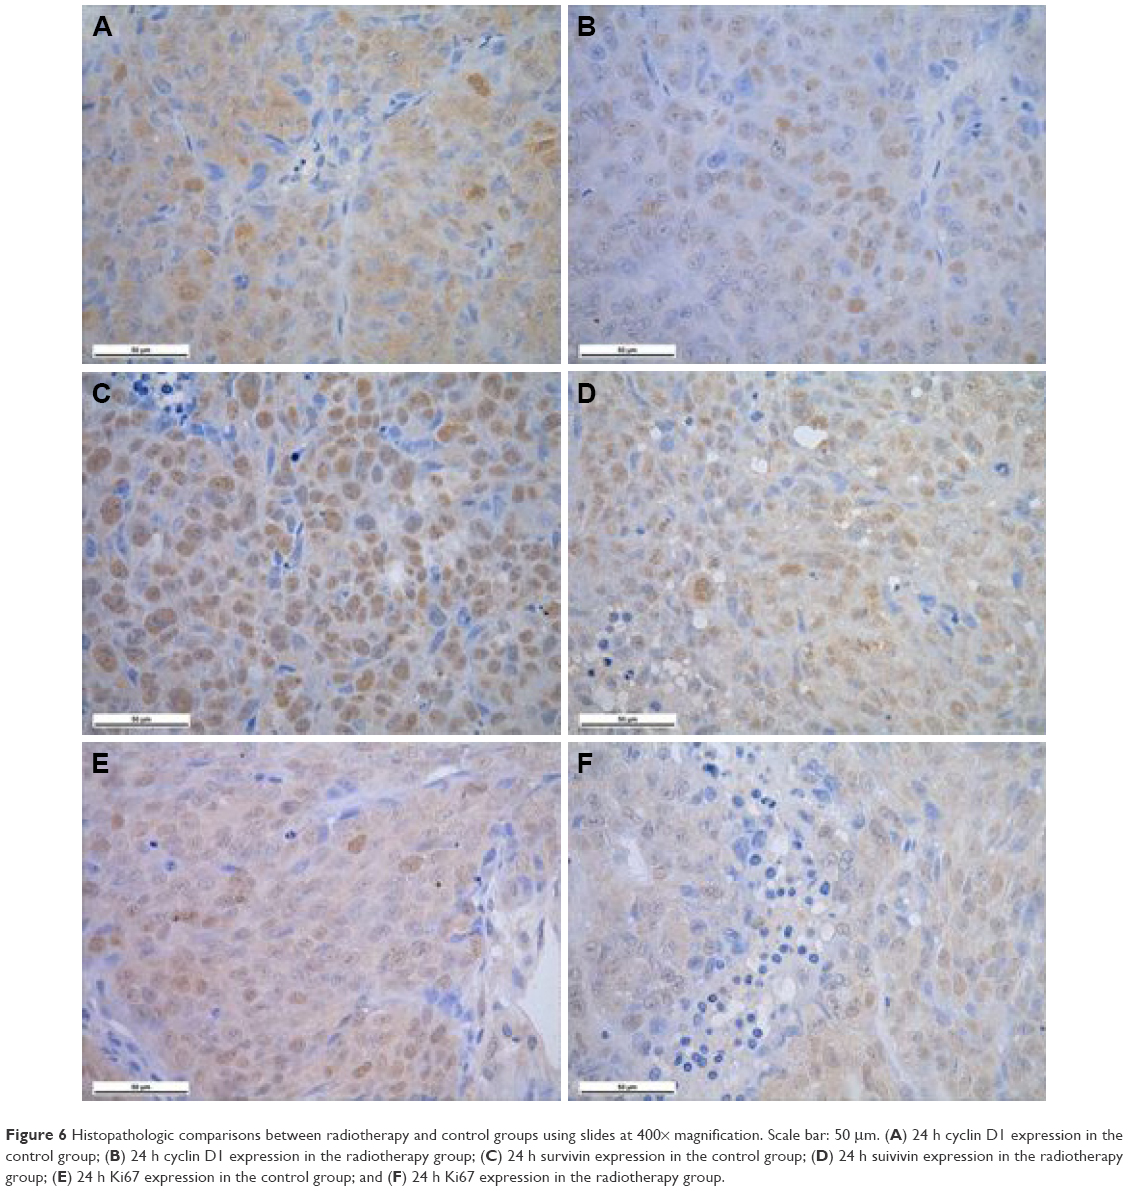 | Figure 6 Histopathologic comparisons between radiotherapy and control groups using slides at 400× magnification. Scale bar: 50 μm. (A) 24 h cyclin D1 expression in the control group; (B) 24 h cyclin D1 expression in the radiotherapy group; (C) 24 h survivin expression in the control group; (D) 24 h suivivin expression in the radiotherapy group; (E) 24 h Ki67 expression in the control group; and (F) 24 h Ki67 expression in the radiotherapy group. |
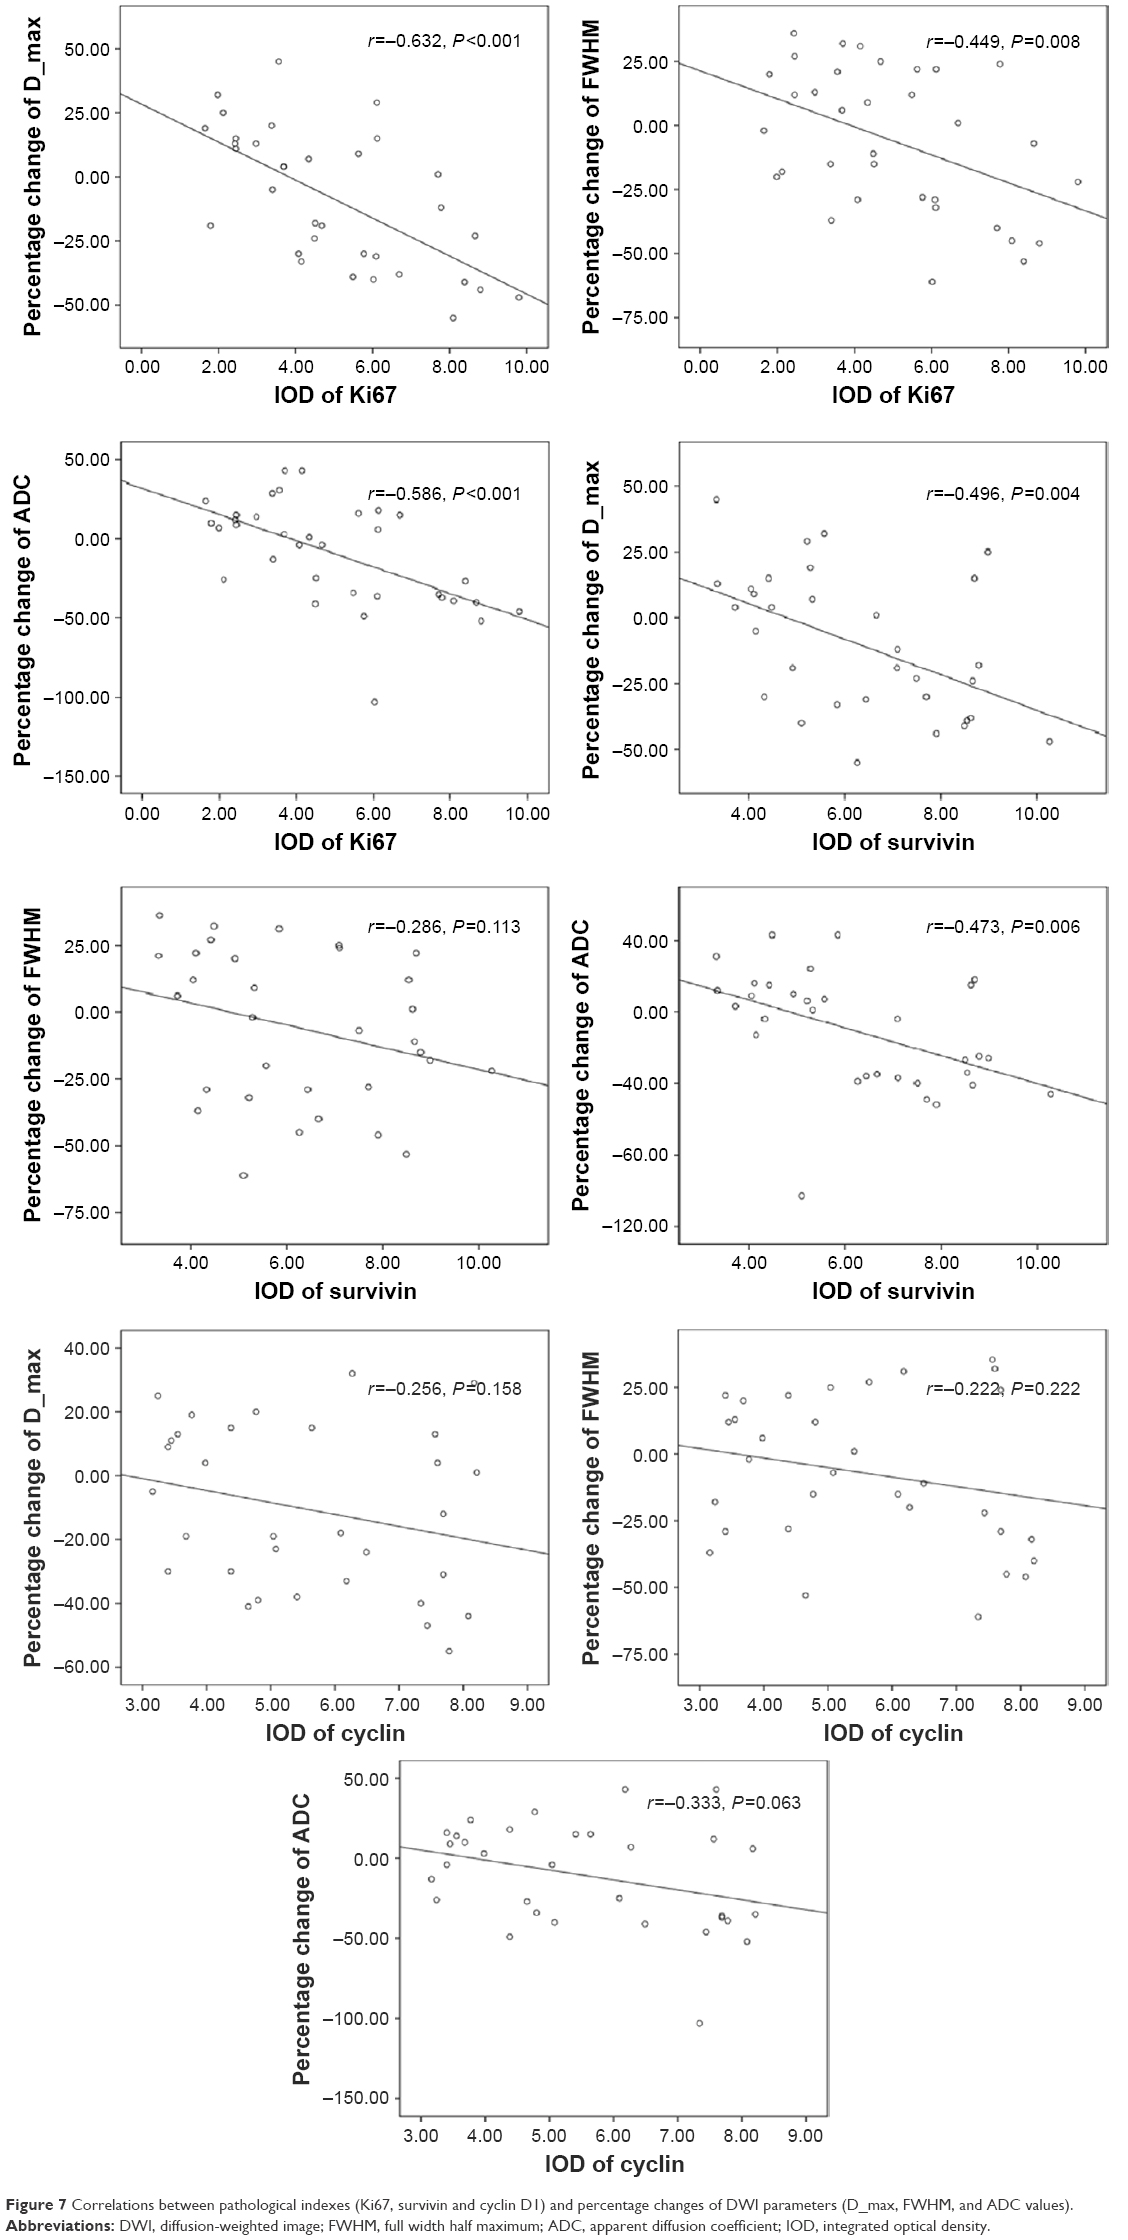 | Figure 7 Correlations between pathological indexes (Ki67, survivin and cyclin D1) and percentage changes of DWI parameters (D_max, FWHM, and ADC values). |
Discussion
Diffusion in biological tissues is most frequently quantified using a monoexponential model; however, diffusion-induced MR signal decay in many organs has been shown to be multiexponential.12–16 Le Bihan et al10 proposed a biexponential model assuming that there are two distinct proton pools inside each voxel, and these proton pools have different diffusion rates. The intravoxel incoherent motion (IVIM) model also suggests that the slow component comprises the Brownian water molecular diffusion and the fast component is blood perfusion in the capillary network;13–15 however, the biexponential model is an oversimplification of reality, and it lacks the capacity to describe a larger number of proton pools with more diffusion components. Further studies of animal and human brain tissues revealed that the simple categorization of fast and slow elements as extra- and intracellular water pools could hardly be supported by empirical results.11
To overcome the difficulty and inaccuracies of making assumptions about the number of diffusion components in biological tissue, several groups investigated alternative models that assume a continuous spectrum of diffusion coefficients.17–20 However, none of these models could precisely describe the spectrum of diffusion coefficients within the voxel. Because the negative volume fraction of any diffusion component is non-physical, the non-negativity constraint must be taken into account; however, this takes time and occasionally makes the solution unstable. The NNLS21 algorithm is numerically stable, very fast, and thus successfully used for inversion of relaxation data.22,23 The NNLS approach has been used to process the diffusion data;22 however, it was investigated in only the brain and achieved in a discrete way.
In this study, MR signal attenuation due to water molecular diffusion in DWI was analyzed using a regularized NNLS-based diffusion spectrum, which assumes that each voxel contains a continuous distribution of diffusion coefficients. To obtain the raw single-decay curves with a higher signal–noise ratio (SNR), the signal intensity at each b-value was obtained using the mean signal intensity of an ROI instead of a single voxel; therefore, to minimize the biases of voxels within each ROI, the ROIs were drawn over the homogeneous areas on DW images. In biological tissue, each pixel contains numerous water molecules with different diffusion coefficients. The continuous distribution of diffusion is more reasonable than several discrete values; therefore, the regularized NNLS is recommended. In this study, it was hypothesized that diffusion spectral parameters could better differentiate different tissues; even in the same malignant tissues, it could be used for monitoring therapy effect.
Diffusion spectral parameters – that is, the changes in the rates of D_max, FWHM, and ADC values – can monitor water diffusion activity that result from a decrease in tumor cells soon after radiotherapy (within 48 h). Within 48 h after radiotherapy, D_max and ADC values were significantly higher than before therapy, which increased water diffusion-reflected tumor cell decrease that was demonstrated by decreased optimal photon numbers in this study. In addition, the negative correlation that existed between survivin and change in rates of D_max and ADC value showed that the elevated D_max and ADC values were associated with increased apoptosis, whereas the decreased D_max and ADC values were associated with reduced apoptosis. A negative correlation existed between Ki67, and change rates of D_max and ADC value showed that the elevated D_max and ADC values were associated with reduced proliferation, and the decreased D_max and ADC values were associated with increased proliferation. These results are consistent with those Zhang reported earlier.24 The elevation and broadening of FWHM in the early stage after radiotherapy reflected more microenvironmental heterogeneity than that at the baseline. This study found no relationship between DWI-derived parameters and cyclin, indicating that these DWI-derived parameters might not reflect histologic behaviors related to cell cycle. However, the small number of animals in this study is a possible reason for the negative result, and this is the main limitation of this study.
Early changes of DWI-related parameters after radiotherapy have the same time window with optimal imaging, suggesting that diffusion spectral parameters can reflect early pathological changes in tumor microenvironment sensitively. Compared with a complex microenvironment, further histological analyses need to be performed.
Conclusion
We have used the regularized NNLS approach to generate the continuously distributed diffusion spectrum, which is intuitionistic and not trapped by an unknown number of diffusion components. The measurements also probed changes in the diffusion spectrum during and after therapy. This method could provide insight into the diffusion mechanism of water molecules in biological tissue and lead to a new method by which to investigate tissue structure and structural changes in tumor progression and regression.
Acknowledgment
This work was supported by the National Natural Science, Foundation of China (Grant No 81471640).
Author contributions
YSS constructed the continuously distributed diffusion-weighted magnetic resonance imaging model, designed experiments, and wrote the manuscript; XYZ and XTL conducted the experiment; XYZ and JS read the images and conducted data measurements; XTL performed statistical analysis. All authors contributed toward data analysis, drafting and revising the paper and agree to be accountable for all aspects of the work.
Disclosure
The authors report no conflicts of interest in this work.
References
Arrazubi V, Suárez J, Novas P, Pérez-Hoyos MT, Vera R, Martínez Del Prado P. Chemoradiation of rectal cancer. Minerva Chir. 2013;68(1):11–26. | ||
Bakke KM, Hole KH, Dueland S, et al. Diffusion-weighted magnetic resonance imaging of rectal cancer: tumour volume and perfusion fraction predict chemoradiotherapy response and survival. Acta Oncol. 2017;56(6):813–818. | ||
Xie H, Sun T, Chen M, et al. Effectiveness of the apparent diffusion coefficient for predicting the response to chemoradiation therapy in locally advanced rectal cancer: a systematic review and meta-analysis. Medicine (Baltimore). 2015;94(6):e517. | ||
Pham TT, Liney GP, Wong K, Barton MB. Functional MRI for quantitative treatment response prediction in locally advanced rectal cancer. Br J Radiol. 2017;90(1072):20151078. | ||
van der Paardt MP, Zagers MB, Beets-Tan RG, Stoker J, Bipat S. Patients who undergo preoperative chemoradiotherapy for locally advanced rectal cancer restaged by using diagnostic MR imaging: a systematic review and meta-analysis. Radiology. 2013;269(1):101–112. | ||
Genovesi D, Filippone A, Ausili Cèfaro G, et al. Diffusion-weighted magnetic resonance for prediction of response after neoadjuvant chemoradiation therapy for locally advanced rectal cancer: preliminary results of a monoinstitutional prospective study. Eur J Surg Oncol. 2013;39(10):1071–1078. | ||
Lambregts DM, Vandecaveye V, Barbaro B, et al. Diffusion-weighted MRI for selection of complete responders after chemoradiation for locally advanced rectal cancer: a multicenter study. Ann Surg Oncol. 2011;18(8):2224–2231. | ||
Buckley DL, Bui JD, Phillips MI, et al. The effect of ouabain on water diffusion in the rat hippocampal slice measured by high resolution NMR imaging. Magn Reson Med. 1999;41(1):137–142. | ||
Mulkern RV, Barnes AS, Haker SJ, et al. Biexponential characterization of prostate tissue water diffusion decay curves over an extended b-factor range. Magn Reson Imaging. 2006;24(5):563–568. | ||
Le Bihan D, Breton E, Lallemand D, Aubin ML, Vignaud J, Laval-Jeantet M. Separation of diffusion and perfusion in intravoxel incoherent motion MR imaging. Radiology. 1988;168(2):497–505. | ||
Lee JH, Springer CS Jr. Effects of equilibrium exchange on diffusion-weighted NMR signals: the diffusigraphic “shutter-speed”. Magn Reson Med. 2003;49(3):450–458. | ||
Maier SE, Bogner P, Bajzik G, et al. Normal brain and brain tumor: multicomponent apparent diffusion coefficient line scan imaging. Radiology. 2001;219(3):842–849. | ||
Sigmund E, Cho G, Kim S, et al. Intravoxel incoherent motion imaging of tumor microenvironment in locally advanced breast cancer. Magn Reson Med. 2011;65(5):1437–1447. | ||
Luciani A, Vignaud A, Cavet M, et al. Liver cirrhosis: intravoxel incoherent motion MR imaging – pilot study. Radiology. 2008;249(3):891–899. | ||
Müller M, Prasad P, Edelman R. Can the IVIM model be used for renal perfusion imaging? Eur J Radiol. 1998;26(3):297–303. | ||
Riches SF, Hawtin K, Charles-Edwards EM, de Souza NM. Diffusion-weighted imaging of the prostate and rectal wall: comparison of biexponential and monoexponential modelled diffusion and associated perfusion coefficients. NMR Biomed. 2009;22(3):318–325. | ||
Jensen JH, Helpern JA, Ramani A, Lu H, Kaczynski K. Diffusional kurtosis imaging: the quantification of non-gaussian water diffusion by means of magnetic resonance imaging. Magn Reson Med. 2005;53(6):1432–1440. | ||
Yablonskiy DA, Bretthorst GL, Ackerman JJ. Statistical model for diffusion attenuated MR signal. Magn Reson Med. 2003;50(4):664–669. | ||
Bennett KM, Schmainda KM, Bennett RT, Rowe DB, Lu H, Hyde JS. Characterization of continuously distributed cortical water diffusion rates with a stretched-exponential model. Magn Reson Med. 2003;50(4):727–734. | ||
Magin RL, Abdullah O, Baleanu D, Zhou XJ. Anomalous diffusion expressed through fractional order differential operators in the Bloch-Torrey equation. J Magn Reson. 2008;190(2):255–270. | ||
Lawson CL, Hanson RJ. Solving Least Squares Problems. Englewood cliffs, NJ: Prentice-Hall; 1974:158. | ||
Munn K, Smith DM. A NMR technique for the analysis of pore structure: Numerical inversion of relaxation measurements. J Colloid Interface Sci. 1987;119(1):117–126. | ||
Zengingonul HP, Mulkern RV. Measurement and analysis of nonexponential signal decay curves in brain diffusion and muscle relaxation magnetic resonance studies in humans. Int J Imaging Syst Technol. 1999;10(3):294–303. | ||
Zhang XY, Sun YS, Tang L, Xue WC, Zhang XP. Correlation of diffusion-weighted imaging data with apoptotic and proliferation indexes in CT26 colorectal tumor homografts in balb/c mouse. J Magn Reson Imaging. 2011;33(5):1171–1176. |
 © 2017 The Author(s). This work is published and licensed by Dove Medical Press Limited. The
full terms of this license are available at https://www.dovepress.com/terms
and incorporate the Creative Commons Attribution
- Non Commercial (unported, 3.0) License.
By accessing the work you hereby accept the Terms. Non-commercial uses of the work are permitted
without any further permission from Dove Medical Press Limited, provided the work is properly
attributed. For permission for commercial use of this work, please see paragraphs 4.2 and 5 of our Terms.
© 2017 The Author(s). This work is published and licensed by Dove Medical Press Limited. The
full terms of this license are available at https://www.dovepress.com/terms
and incorporate the Creative Commons Attribution
- Non Commercial (unported, 3.0) License.
By accessing the work you hereby accept the Terms. Non-commercial uses of the work are permitted
without any further permission from Dove Medical Press Limited, provided the work is properly
attributed. For permission for commercial use of this work, please see paragraphs 4.2 and 5 of our Terms.