")
Back to Journals » International Journal of Nanomedicine » Volume 9 » Issue 1
Inhibitory effect of gold nanoparticles on the D-ribose glycation of bovine serum albumin
Authors Liu W, Cohenford M, Frost L, Seneviratne C, Dain J
Received 8 July 2014
Accepted for publication 3 September 2014
Published 26 November 2014 Volume 2014:9(1) Pages 5461—5469
DOI https://doi.org/10.2147/IJN.S70777
Checked for plagiarism Yes
Review by Single anonymous peer review
Peer reviewer comments 2
Editor who approved publication: Dr Thomas Webster
Weixi Liu,1 Menashi A Cohenford,1–3 Leslie Frost,3 Champika Seneviratne,4 Joel A Dain1
1Department of Chemistry, University of Rhode Island, Kingston, RI, USA; 2Department of Integrated Science and Technology, 3Department of Chemistry, Marshall University, Huntington, WV, USA; 4Department of Chemistry, College of the North Atlantic, Labrador, NL, Canada
Abstract: Formation of advanced glycation end products (AGEs) by nonenzymatic glycation of proteins is a major contributory factor to the pathophysiology of diabetic conditions including senile dementia and atherosclerosis. This study describes the inhibitory effect of gold nanoparticles (GNPs) on the D-ribose glycation of bovine serum albumin (BSA). A combination of analytical methods including ultraviolet–visible spectrometry, high performance liquid chromatography, circular dichroism, and matrix-assisted laser desorption/ionization time-of-flight (MALDI-TOF) mass spectrometry were used to determine the extent of BSA glycation in the presence of citrate reduced spherical GNPs of various sizes and concentrations. GNPs of particle diameters ranging from 2 nm to 20 nm inhibited BSA’s AGE formation. The extent of inhibition correlated with the total surface area of the nanoparticles. GNPs of highest total surface area yielded the most inhibition whereas those with the lowest total surface area inhibited the formation of AGEs the least. Additionally, when GNPs’ total surface areas were set the same, their antiglycation activities were similar. This inhibitory effect of GNPs on BSA’s glycation by D-ribose suggests that colloidal particles may have a therapeutic application for the treatment of diabetes and conditions that promote hyperglycemia.
Keywords: gold nanoparticles, glycation, AGEs, GNPs, BSA
Introduction
Albumin, the most abundant plasma protein, is a multifunctional biomolecule involved in a wide variety of physiological activities.1,2 Glycation of albumin and other proteins can generate advanced glycation end products (AGEs) leading to several chronic complications of diabetes including atherosclerosis, renal failure, and cataract formation.3–5 Current efforts to reduce the formation of AGEs have focused on a number of synthetic drugs such as aminoguanidine and metformin.6–8 Although some of these compounds have shown promising inhibitory effects on AGE formation, they have been also found to cause side effects.7 Recently, studies have reported that gold nanoparticles (GNPs), a substance widely applied in the field of nanomedicine, can act as an antiglycation agent reducing the formation of AGEs.9–11 With this potential, GNPs may provide a safer approach for the treatment of AGE-related disease.
Under normal conditions, albumin has a half-life of about 21 days and a plasmatic concentration ranging from 35 to 54 mg/mL.12 Being highly exposed to different biomolecules in the blood, albumin is susceptible to enzymatic and nonenzymatic changes.1,2,13 Of the nonenzymatic changes contributing to modifications in albumin’s structure and function, the glycation of the molecule by reducing sugars has received considerable attention.13–15
Glycation of albumin initiates with a condensation reaction between the amino groups on the protein and the carbonyl group of a reducing sugar, yielding unstable Schiff base structures.14 These intermediary unstable compounds can rearrange to form more stable ketoamine structures that, over time, promote the production of a heterogeneous group of molecules commonly referred to as AGEs.16–19 The formation of AGEs is not limited to albumin or other proteins. In fact, many amino containing molecules such as lipids, deoxyribonucleic acid (DNA), and ribonucleic acid (RNA) have been reported to be glycated both in vitro and in vivo.20–22 Under conditions promoting hyperglycemia, AGEs can accumulate in the body and contribute to many of the chronic complications of diabetes and classical galactosemia.3–5,23,24
GNPs, also referred to as colloidal gold particles, are a suspension of gold beads that in solution can range in size from one to several hundred nanometers.25 Because of their unique optical properties, variable surface-to-volume ratios, and their ease of production, GNPs have been used in a wide range of applications. In the medicine field, for instance, GNPs have been used for diagnostic and imaging purposes,26,27 whereas in the pharmaceutical industry their applications have extended to such areas as drug delivery and medicinal chemistry.28–30
Studies in our laboratory9 and others10,11 have recently demonstrated that GNPs can reduce the formation of AGEs, with these reductions occurring under physiological temperature and pH conditions. Considering that GNPs may provide an alternative approach to reducing AGEs and AGE-related diseases (ie, besides the use of synthetic drugs), in this study, we focused on two objectives: 1) the inhibitory effects of citrate coated spherical GNPs on the glycation of albumin by D-ribose, and 2) the effects of GNP size, concentration, and total surface area on the extent modification of albumin by D-ribose.
This report describes for the first time 1) the inhibition of albumin glycation in the presence of GNPs by D-ribose, and 2) a correlation between GNP’s total surface area and the formation of AGE products.
Materials and methods
Reagents
Bovine serum albumin (BSA) and analytical grade D-ribose were obtained from Sigma-Aldrich Chemical Co. (St. Louis, MO, USA). Citrate reduced spherical GNPs with variable diameters (2 nm, 5 nm, 20 nm, 50 nm, 100 nm, and 200 nm) were purchased form Ted Pella, Inc. (Redding, CA, USA). The size, concentration, and characterization of the colloidal suspension were determined by the manufacturer of the GNPs, BBI Solutions (Cardiff, UK), according to standard protocols (http://www.tedpella.com/gold_html/goldsols.htm) using ultraviolet–visible (UV–Vis) spectroscopy and transmission electron microscopy. Disposable UV-transparent cuvettes (12.5 mm×12.5 mm×36 mm) and high performance liquid chromatography (HPLC) analytical grade solvents were procured from Thermo Fisher Scientific (Rockford, IL, USA). ZipTip pipette tips with C4 resin and 0.22 μm filter unit were obtained from EMD Millipore Co. (Billerica, MA, USA).
Preparation of reaction incubation mixtures
To test the effects of GNPs on BSA’s glycation by D-Ribose, two different groups of reaction mixtures hereinafter referred to as A and B were prepared. Incubation mixtures A had GNP suspensions of variable surface area and those in B had colloidal suspensions whose surface areas were held constant. Unless otherwise indicated, all of the aforementioned mixtures were prepared in 0.1 M phosphate buffer, pH 7.2.
Incubation mixtures A contained GNP suspensions of various concentrations and sizes (2 nm, 5 nm, and 20 nm), 35 mg/mL albumin set at the physiological levels of the protein in blood, and 20 mM D-ribose. The concentration of D-ribose was set at 20 mM to mimic D-glucose concentrations sometimes seen in the blood of patients with diabetes.1 Incubation mixtures B were prepared in a similar manner as incubation mixtures A but with GNPs’ total surface areas adjusting to the same value in each colloidal suspension.
The shaded area in Table 1 summarizes the technical details of all GNP suspensions in incubation mixtures A and B based on the data provided by the manufacturer of the GNPs, BBI Solutions (Cardiff, UK). The total surface areas were determined by taking into account both the size of the particles and their concentrations. Total surface areas were calculated by the formula 4πr2×C where r and C, respectively, represent the radius of the nanoparticles and their particle concentrations.
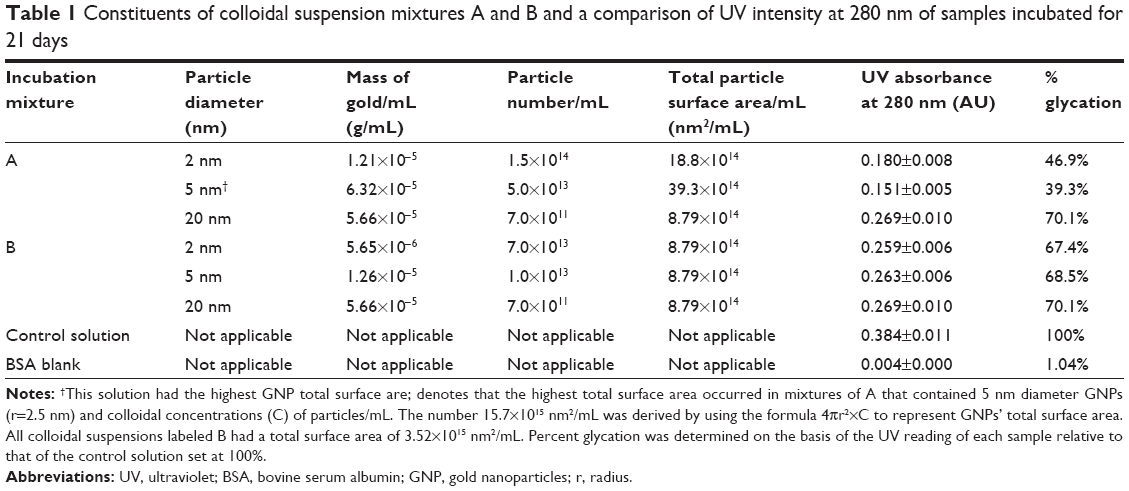 | Table 1 Constituents of colloidal suspension mixtures A and B and a comparison of UV intensity at 280 nm of samples incubated for 21 days |
The choice of particle size in this study was based on the observation that precipitation of GNPs routinely occurred when the glycation of BSA was performed in the presence of colloidal suspensions with diameters exceeding 20 nm. Smaller diameter particles of sizes 2 nm, 5 nm, and 20 nm exhibited no such effects and were thus included in this study to further evaluate their inhibitory effect on the formation of AGEs.
Preparation of blank and control solutions
Blank solutions included BSA alone (35 mg/mL), D-ribose alone (20 mM), or BSA (35 mg/mL) with the different size GNPs in 0.1 M phosphate buffer, pH 7.2. Control solutions were adjusted to contain BSA and D-ribose with final concentrations of 35 mg/mL and 20 mM, respectively.
Analysis of samples
Unless otherwise indicated, all reaction mixtures including the control and blank solutions were prepared in triplicate and incubated under sterile conditions at 37°C in a shaking water bath for 21 days. Aliquots were drawn from the reaction mixture at 0, 3, 7, 14 and 21 days of incubation. Samples were then stored at −20°C until analysis. Analysis of the mixtures was performed on samples that were thawed, centrifuged, and purified by C4 ZipTip pipettes, EMD Millipore Co. (Billerica, MA, USA).
A period of 21 days of incubation was selected for this study because preliminary experiments had demonstrated the formation of AGEs of BSA with D-ribose using the conditions described.
Detection of glycated products by UV–Vis spectrometry
UV–Vis experiments were performed with an UltroSpec 2100 instrument (Biochrom Ltd, Cambridge, UK) according to the method of Dutta and Seneviratne.31,32 Briefly, the analysis was carried out at wavelengths ranging from 250 to 400 nm in a thermostatically controlled cuvette holder set at 25°C±1°C. Prior to analysis, each specimen was diluted 50-fold to yield a UV absorption reading of less than 1.
Circular dichroism experiments
Circular dichroism (CD) analysis was performed with a Jasco J-720 spectropolarimeter (Tokyo, Japan) using quartz cuvettes with 1 mm path length. Interpretation of results was performed by the Jasco’s Spectra Manager software. Prior to spectral acquisition, the concentration of BSA in each sample was adjusted to 0.5 mg/mL in 0.1 M phosphate buffer, pH 7.2. CD spectral signatures for each sample were obtained in the far ultraviolet region (190–250 nm) by taking the average of ten consecutive scans. The bandwidth in each case was adjusted to 1 nm.
High performance liquid chromatography experiments
Each HPLC run was performed in triplicate using a Hewlett Packard 1050 system (Waldbronn, Germany) that included a low-pressure gradient pump, a four-channel degasser, a sequential auto sampler and a programmable fluorescence detector (HP 1046A). The HPLC equipment was operated with the ChemStation software from Agilent Technologies (Santa Clara, CA, USA). All AGE species were separated on a Shodex (New York, NY, USA) RSpak C18 reverse phase HPLC column (5 μm×4.6 mm×150 mm) with a 415 Å pore size. Mobile phase A consisted of 0.1% trifluoroacetic acid (TFA) and 1% acetonitrile in water. Mobile phase B included 0.1% TFA and 95% acetonitrile in water. A linear gradient from 20% to 60% of mobile phase B was applied at a constant flow rate of 1.0 mL/min over 25 minutes. Fluorescence measurements for monitoring glycated products were performed at excitation and emission wavelengths of 340 nm and 420 nm, respectively. The above excitation and emission values allowed optimal detection of AGEs. Prior to analysis, all solvents were degassed and sonicated for 15 minutes and all samples were filtered by a 0.22 μm membrane.
Matrix-assisted laser desorption/ionization time-of-flight (MALDI-TOF) mass spectrometry
Unless otherwise indicated, each sample destined for mass spectrometric analysis was purified with a C4 ZipTip. Mass spectrometric readings were performed on incubation mixtures (0.6 μL) spotted onto stainless steel sample plates. Analysis of m/z ratios was performed on a Bruker Autoflex MALDI–TOF spectrometer (Bruker Daltonics, Billerica, MA, USA) in linear TOF mode with a 550 ns delay. All spectra represented the sum of 500 single laser shots randomized over ten positions localized on the same spot (500/50). Mass spectrometric data was evaluated with Bruker’s (Billerica, MA, USA) FlexAnalysis and ClinProTools software. For spotting purposes, protein samples were mixed in a 50% aqueous acetonitrile solution (0.6 μL) saturated with sinapinic acid and containing 0.05% TFA.
Analysis of data by UV, CD, HPLC, and MALDI-TOF
All UV, CD, HPLC, and MALDI-TOF experiments were performed in triplicate and compared with their respective control solution.
Results
UV–Vis spectroscopy studies showed that there were increases in the UV absorption of all incubation mixtures that contained BSA and D-ribose regardless of whether GNPs were included in the reaction mixtures. Blank solutions containing BSA alone or D-ribose alone yielded no increases in UV readings. Figures 1A and B show UV–Vis absorption profiles for each reaction mixture at wavelengths ranging from 250 nm to 390 nm. All samples yielded a prominent UV absorption at around 280 nm, which was attributed to the formation of AGEs and their aromatic ring structures.33
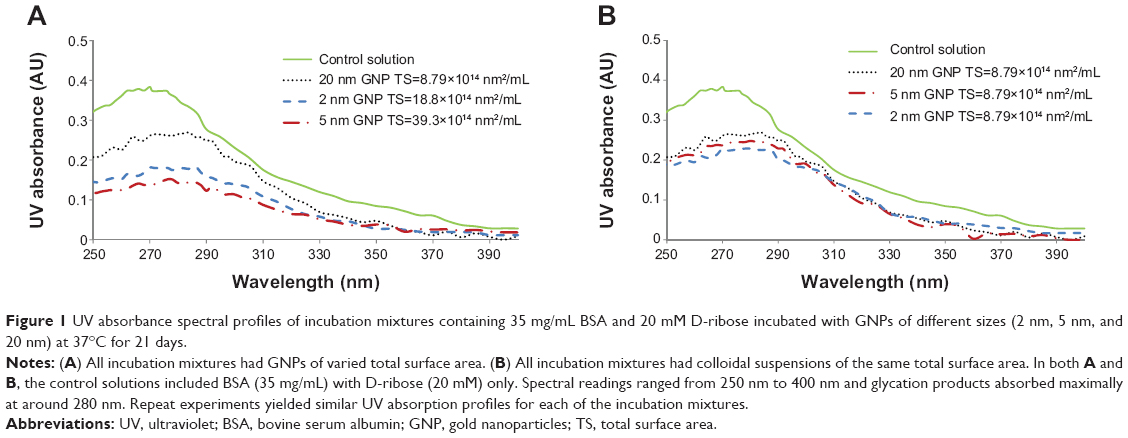 | Figure 1 UV absorbance spectral profiles of incubation mixtures containing 35 mg/mL BSA and 20 mM D-ribose incubated with GNPs of different sizes (2 nm, 5 nm, and 20 nm) at 37°C for 21 days. |
Figure 2A and B display the time course UV absorption profiles of all colloidal suspensions. The UV profiles show three important findings: 1) that UV intensities increased over time, 2) that UV absorption readings were highest in samples that contained no GNPs but only BSA and D-ribose, and 3) that the extent inhibition of glycation was relatable to the colloidal suspension’s total surface area. The increase in UV absorption from day 0 to day 21 was not surprising as previous studies in our lab and those of others have demonstrated that glycation is a time-dependent process.13–15,21,22
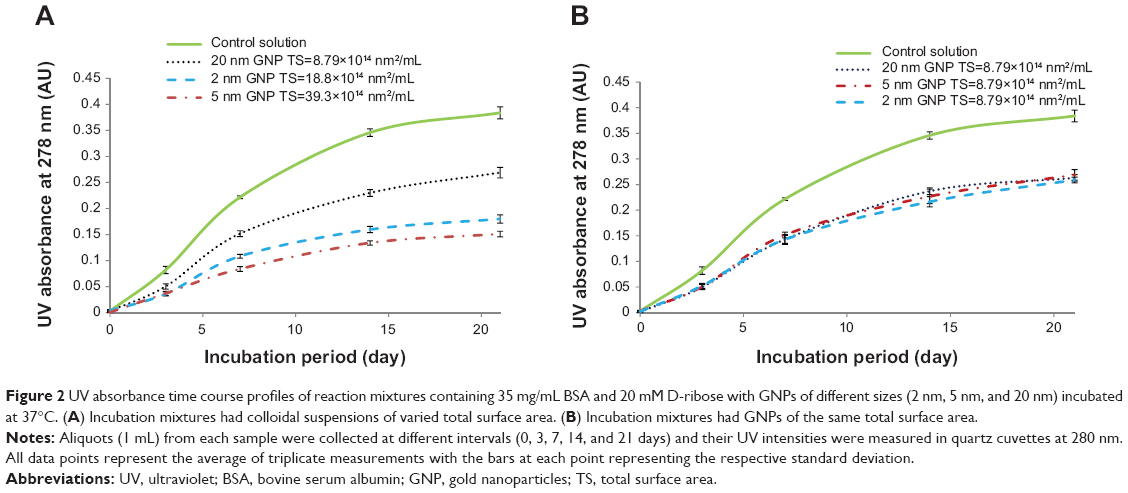 | Figure 2 UV absorbance time course profiles of reaction mixtures containing 35 mg/mL BSA and 20 mM D-ribose with GNPs of different sizes (2 nm, 5 nm, and 20 nm) incubated at 37°C. (A) Incubation mixtures had colloidal suspensions of varied total surface area. (B) Incubation mixtures had GNPs of the same total surface area. |
Table 1 shows the percent glycation of BSA with GNPs of similar and variable total surface areas relative to controls that contained no GNPs and whose glycation levels were set at 100%. The data demonstrates that glycation was most inhibited in colloidal suspensions that had the highest total surface area (% glycation =39.3%) and were least inhibited in those whose total surface area was lowest (% glycation =70.1%). Additional results showed that so long as the total surface areas were set the same, glycation levels remained similar in all GNP treated incubation mixtures (see Table 1, Figures 1B and 2B).
To evaluate the effect of the colloidal suspensions on the conformational change of glycated BSA, CD scans were performed at the far UV region31,34 on reaction mixtures containing 1) the protein and D-ribose incubated with GNPs, 2) the protein and D-ribose incubated without GNPs (control solution), and 3) on solutions containing BSA alone or BSA with GNPs (blank solutions). Figure 3A and B show the respective CD spectral profiles of mixtures A and B after 21 days of incubation at 37°C. As expected, native BSA alone yielded a CD spectrum with well-defined α-helical features showing two prominent dips, one at 208 nm and the other at 222 nm.34 The CD spectral profiles of mixtures containing BSA with D-ribose alone displayed similar features as that of BSA, but with less pronounced dips at 208 nm and 222 nm. This result was not surprising since some loss in the α-helical structure of the protein was expected to occur due to nonenzymatic modification of BSA by D-ribose.14,34
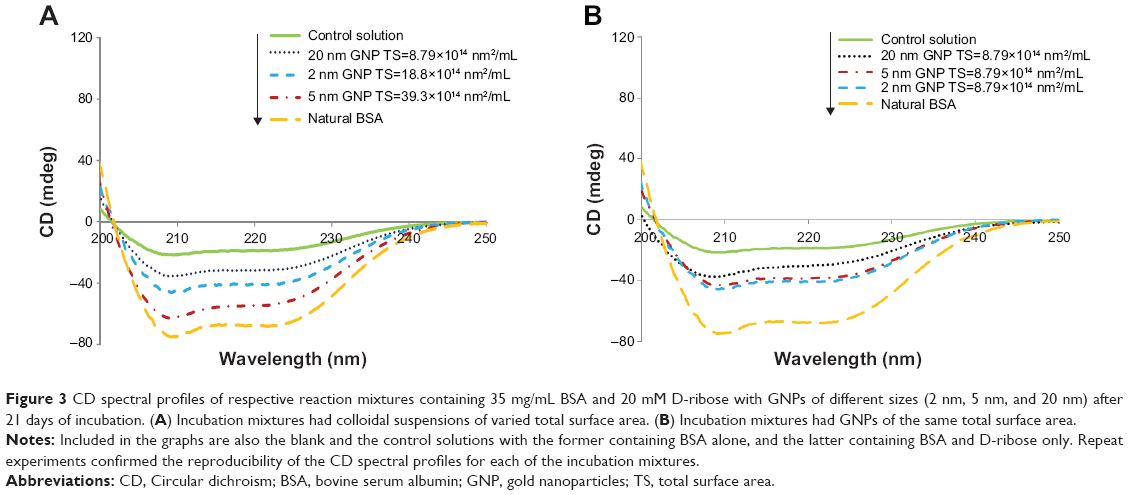 | Figure 3 CD spectral profiles of respective reaction mixtures containing 35 mg/mL BSA and 20 mM D-ribose with GNPs of different sizes (2 nm, 5 nm, and 20 nm) after 21 days of incubation. (A) Incubation mixtures had colloidal suspensions of varied total surface area. (B) Incubation mixtures had GNPs of the same total surface area. |
The CD spectra in Figure 3A again demonstrated that GNPs had an inhibitory effect on glycation and this inhibitory effect was modulated by the colloidal suspensions’ total surface areas. In the presence of colloidal suspensions, the secondary structure of the protein was most stabilized with GNPs exhibiting the highest surface area and least stabilized when GNPs of lowest total surface area were added. In Figure 3B, the most striking finding was the observation that in incubation mixtures that had GNPs of the same total surface area, CD spectral profiles were relatively similar. This result, once again, suggested that so long as the total surface areas of the GNPs were maintained similar, the inhibition of BSA’s glycation remained the same. To quantify the extent of BSA’s glycation in the presence and absence of GNPs, we next focused on the analysis of the incubations mixtures by HPLC.
Figure 4 displays the HPLC elution profiles of the control incubation mixture and the colloidal suspensions in the A labeled incubations. Peak 1 and peak 2 in each of the profiles represent the fluorescent AGE products of BSA detectable at excitation and emission wavelengths of 360 nm and 420 nm, respectively.33,35 Repeat HPLC analysis showed that these peaks occurred routinely in all mixtures designated A and B. Peak 1 had a retention time of 2.25 minutes and peak 2 had a retention time of 15.87 min. HPLC elution profile of the blank solution containing BSA alone yielded no fluorescence peaks.
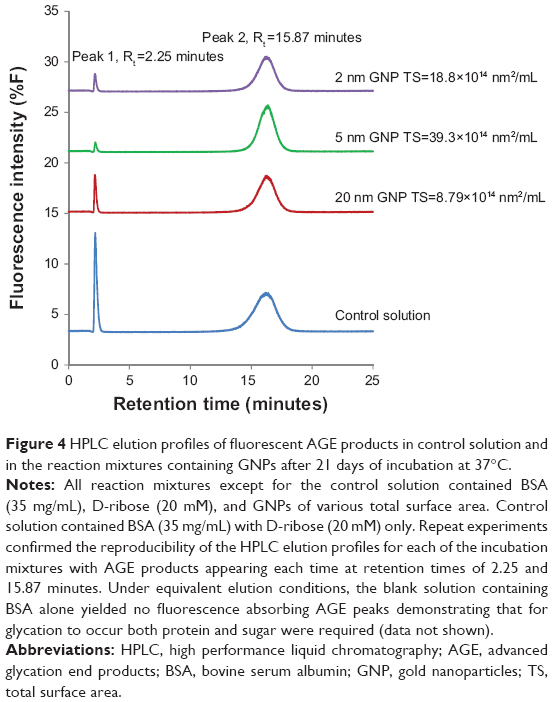 | Figure 4 HPLC elution profiles of fluorescent AGE products in control solution and in the reaction mixtures containing GNPs after 21 days of incubation at 37°C. |
Table 2 shows the integrated areas under peak 1 and peak 2 for every incubation mixture. Analysis of the data demonstrates that glycation products were, once again, most pronounced in the controls that contained only BSA and D-ribose. HPLC elution profile of the control solution yielded two AGEs peaks with a total peak area of 646.81. In contrast, the formation of AGEs was less pronounced in mixtures treated with colloidal suspensions. In each case where colloidal suspensions were included, the amount of glycated products were found to be relatable to the GNP’s total surface area. Suspensions that had particles of the highest surface area yielded the lowest levels of glycation (total AGE peak area =358.45), whereas those with the lowest surface area exhibited the highest levels of AGE products (total AGE peak area =480.1). Next, focus was placed on MALDI-TOF mass spectrometric studies to compare the mass shift in nonglycated BSA versus BSA in the colloidal suspensions labeled A and B.
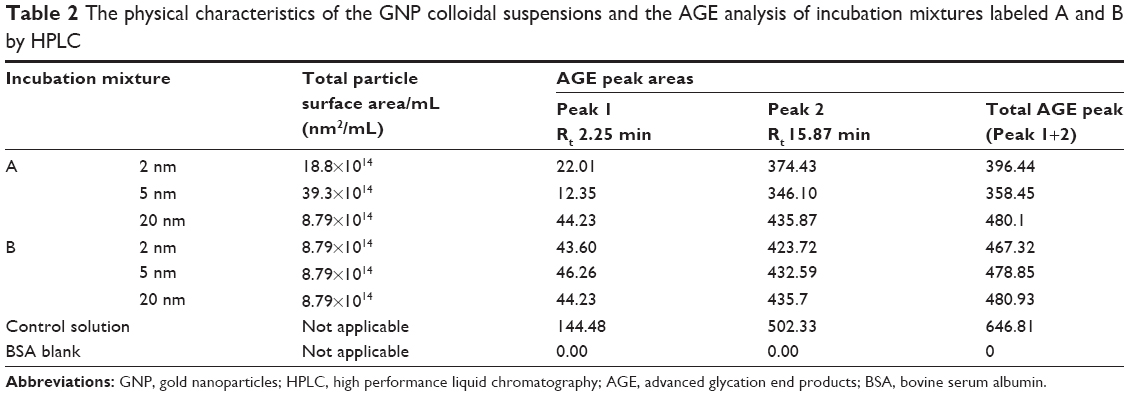 | Table 2 The physical characteristics of the GNP colloidal suspensions and the AGE analysis of incubation mixtures labeled A and B by HPLC |
Figure 5 shows the MALDI-TOF mass spectral profiles of BSA in 1) the blank solution containing BSA alone, 2) the control solution containing BSA and D-ribose, and 3) the suspensions designated as the A mixtures. The increase in the mass of BSA after its glycation by D-ribose was due to the condensation of the sugar molecules with the protein during the glycation process.36
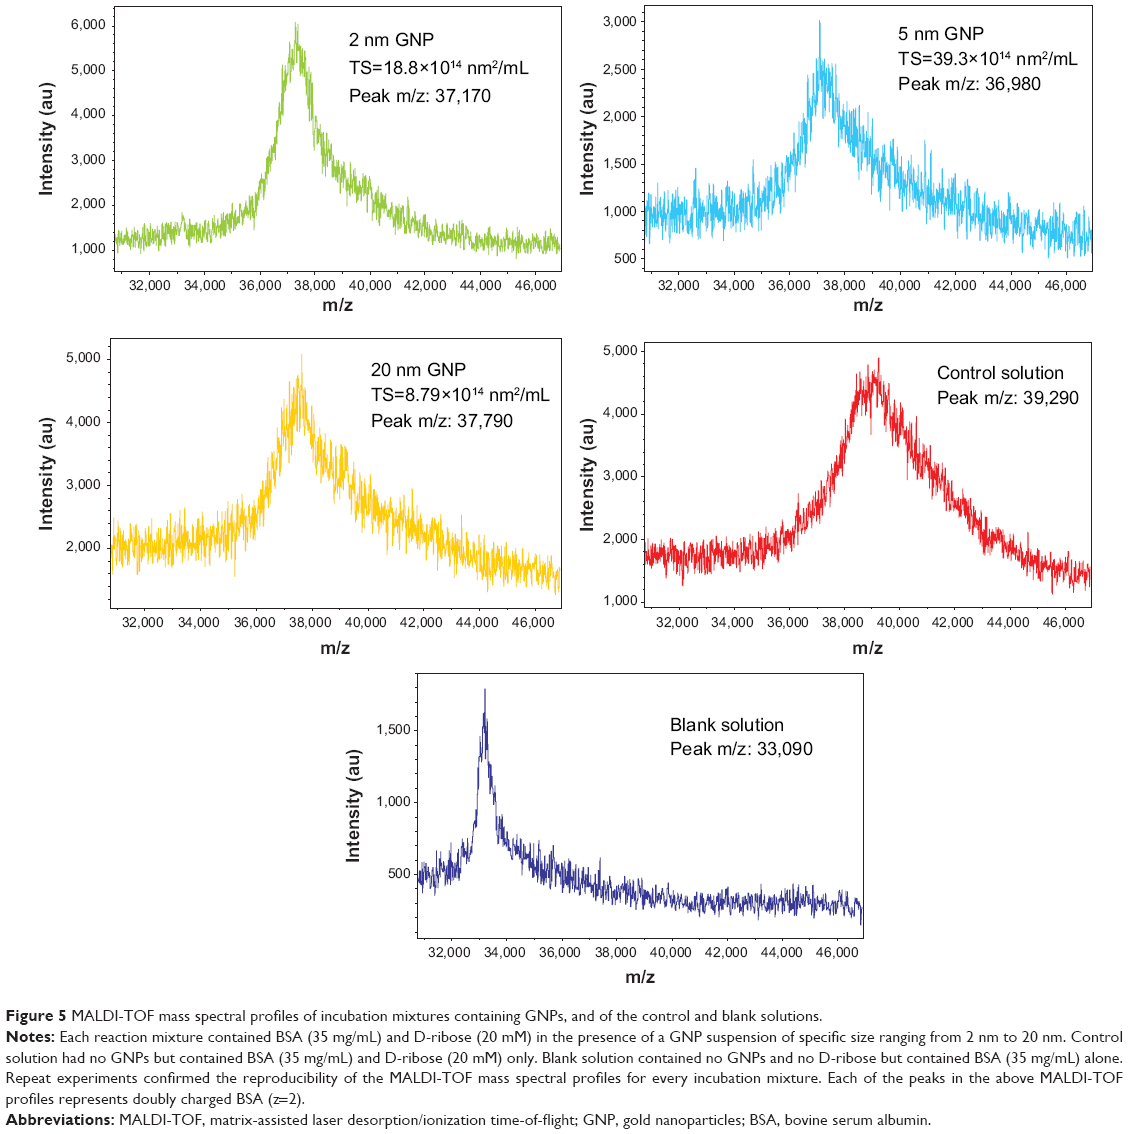 | Figure 5 MALDI-TOF mass spectral profiles of incubation mixtures containing GNPs, and of the control and blank solutions. |
Table 3 summarizes the shift in the m/z values and the number of D-ribose adducts on BSA in mixtures A and B by a MALDI-TOF method described previously.36 Analysis of the data confirmed the HPLC results and shows that the most pronounced shifts in the m/z of the BSA peak occurred in the control solution that contained only BSA and D-ribose. Native BSA exhibited an m/z peak of 33,090 whereas that of the control yielded an m/z=39,290. This difference in the m/z values represented the condensation of 83 sugar residues to the protein (see Table 3). In the case of the colloidal mixtures, the changes in the m/z values were less pronounced indicating the inhibitory effects of GNPs on the glycation of BSA by D-ribose. The MALDI-TOF data also shows that the GNP mixture with the highest surface area yielded the lowest glycation, generating a protein peak with an m/z =36,980. Relative to native BSA, this represented the condensation of 52 D-ribose molecules to the protein. In contrast, the GNP suspension with the lowest surface area yielded a BSA peak with an m/z =37,790 which represented the condensation of 63 D-ribose molecules to the protein. Confirming the HPLC results was also the observation that in colloidal suspensions that had the same total surface areas, the number of D-ribose addicts in each solution was similar.
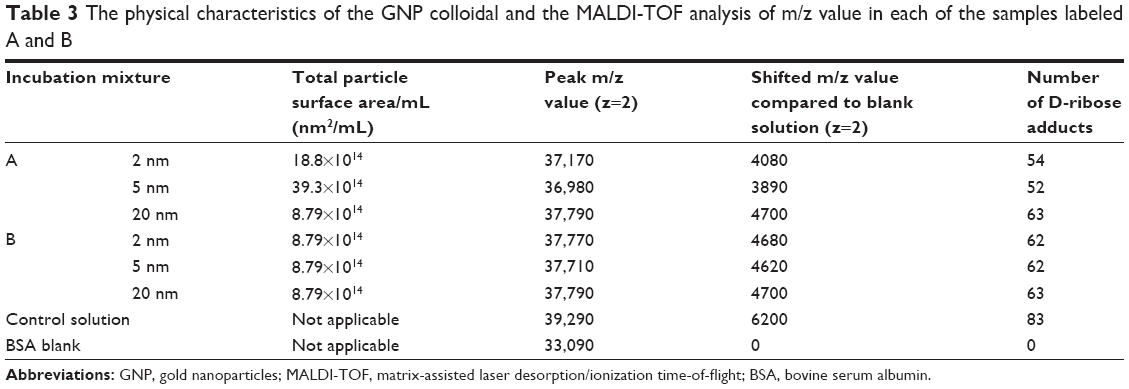 | Table 3 The physical characteristics of the GNP colloidal and the MALDI-TOF analysis of m/z value in each of the samples labeled A and B |
Discussion
Previous studies have demonstrated that proteins can spontaneously conjugate with gold atoms on nanoparticles to yield homogeneous suspensions.37,38 In the case of human and bovine albumin, this conjugation has been proposed to occur through the proteins’ cysteine and lysine residues,38,39 with the lysine residues also serving as the major sites of glycation.40 Although the mechanism for the conjugation of these amino acids to GNPs remains unclear, to date, two mechanisms, one for cysteine 39 and one for lysine,38,41 have been proposed. The interaction between cysteine residues and GNPs has been speculated to ensue through ligand exchange reactions, whereas those with lysine are suggested to depend on electrostatic forces.38,39,41 The electrostatic forces between lysine and GNPs are suggested to occur from ionic bridges formed between the positively charged lysine residues on the protein and the negatively charged citrate on GNPs, which generate a carboxylate-ammonium type of salt.37–39 The combined interactions of cysteine and lysine residues are believed to contribute to the GNPs stability and prevent the GNPs from precipitating out of solution.37,38 In the case of lysine, its binding with GNPs is also suggested to mask its positive charges, preventing the protein from participating in glycation reactions.9,10
In summary, our results demonstrate that the addition of GNPs to BSA and D-ribose reduced the formation of AGEs and appeared to inhibit the glycation process. Particle size and particle concentration allowed variations in the total surface area of the colloidal suspensions influencing the extent modification of BSA with D-ribose. For example, the observation was made that colloidal suspensions of highest total surface area yielded the lowest levels of glycation, whereas those with the lowest total surface area least inhibited the formation of AGEs. Combined with these observations was also the finding that colloidal suspensions of the same total surface areas caused similar levels of glycation in incubation mixtures containing BSA and D-ribose with GNPs.
The correction between total surface area and the extent of glycation inhibition by GNPs is speculated to be related to the amount of binding sites on the surface of GNPs. As the GNPs in this study were coated with citrate, and as the binding of lysine to GNPs has been reported to occur through the formation of salt bridges,38,39 one would anticipate that GNPs with higher total surface area provided more negatively charged sites for the binding of BSA’s positively charged lysine residues. Henceforth, with lysine residues serving as the major glycation sites for the protein, this latter phenomenon may have contributed to the variation in the levels of AGE as they relate to GNP’s total surface area.
Considering that the in vivo formation of AGEs plays a significant role in the pathophysiology of diabetes, there has been an ongoing effort to seek agents that inhibit the glycation process.42–44 As GNPs can be used in vivo and can be readily prepared, a deeper understanding of their antiglycation potential may lead to novel therapeutic approaches for treating diseases whose complications relate to the formation of AGEs.
Acknowledgment
This research was made possible by the assistance of the Research and Bioinformatics Core Facilities supported jointly by NCRR/NIH Grant # P20 RR016457 and the Network institution.
Disclosure
The authors of this manuscript would like to assure that this research is original and does not create any conflicts of interest.
References
Peters T Jr. All About Albumin: Biochemistry, Genetics, and Medical Applications. San Diego: Academic Press; 1996. | ||
Quinlan GJ, Martin GS, Evans TW. Albumin: biochemical properties and therapeutic potential. Hepatology. 2005;41(6):1211–1219. | ||
Basta G, Schmidt AM, De Caterina R. Advanced glycation end products and vascular inflammation: implications for accelerated atherosclerosis in diabetes. Cardiovasc Res. 2004;63:582–592. | ||
Singh R, Barden A, Mori T, Beilin L. Advanced glycation end-products: a review. Diabetologia. 2001;44(2):129–146. | ||
Ahmed N. Advanced glycation endproducts – role in pathology of diabetic complications. Diabetes Res Clin Pract. 2005;67:3–21. | ||
Rahbar S, Figarola JL. Novel inhibitors of advanced glycation endproducts. Arch Biochem Biophys. 2003;419:63–79. | ||
Thornalley PJ. Use of aminoguanidine (Pimagedine) to prevent the formation of advanced glycation endproducts. Arch Biochem Biophys. 2003;419:31–40. | ||
Beisswenger P, Ruggiero-Lopez D. Metformin inhibition of glycation processes. Diabetes Metab. 2003;29:6S95–6S103. | ||
Seneviratne C, Narayanan R, Liu W, Dain JA. The in vitro inhibition effect of 2 nm gold nanoparticles on non-enzymatic glycation of human serum albumin. Biochem Biophys Res Commun. 2012;422:447–454. | ||
Singha S, Bhattacharya J, Datta H, Dasgupta AK. Anti-glycation activity of gold nanoparticles. Nanomedicine. 2009;5(1):21–29. | ||
Kim K, Hong C, Koo Y, Choi H, Lee K. Anti-glycation effect of gold nanoparticles on collagen. Biol Pharm Bull. 2012;35:260–264. | ||
Evans TW. Albumin as a drug-biological effects of albumin unrelated to oncotic pressure. Aliment Pharmacol Ther. 2002;16:6–11. | ||
Rondeau P, Bourdon E. The glycation of albumin: structural and functional impacts. Biochimie. 2011;93(4):645–658. | ||
Ledesma-Osuna AI, Ramos-Clamont G, Vazquez-Moreno L. Characterization of bovine serum albumin glycated with glucose, galactose and lactose. Acta Biochim Pol. 2008;55:491–497. | ||
Urbanowski JC, Cohenford MA, Dain JA. Nonenzymatic galactosylation of human serum albumin. In vitro preparation. J Biol Chem. 1982;257:111–115. | ||
Thorpe SR, Baynes JW. Maillard reaction products in tissue proteins: new products and new perspectives. Amino Acids. 2003;25(3–4):275–281. | ||
Thornalley PJ, Measurement of protein glycation, glycated peptides, and glycation free adducts. Periton Dialysis Int. 2005;25:522–533. | ||
DeGroot J. The AGE of the matrix: chemistry, consequence and cure. Curr Opin Pharmacol. 2004;:301–305. | ||
Peyroux J1, Sternberg M. Advanced glycation endproducts (AGEs): pharmacological inhibition in diabetes. Pathol Biol (Paris). 2006;54:405–419. | ||
Fu M, Requena JR, Jenkins AJ, Lyons TJ, Baynes JW, Thorpe SR. The advanced glycation end product, N-(Carboxymethyl) lysine, is a product of both lipid peroxidation and glycoxidation reactions. J Biol Chem. 1996;271:9982–9986. | ||
Liu W1, Cohenford MA, Frost L, Seneviratne C, Dain JA. Non-enzymatic glycation of melamine with sugars and sugar like compounds. Bioorg Chem. 2013;46:1–9. | ||
Dutta U, Cohenford MA, Guha M, Dain JA. In vitro nonenzymatic glycation of DNA nucleobases: an evaluation of advanced glycation end products under alkaline pH. Anal Bioanal Chem. 2006;386:1633–1640. | ||
Furth AJ. Glycated proteins in diabetes. Br J Biomed Sci. 1997;54:192–200. | ||
Ulrich P, Cerami A. Protein glycation, diabetes, and aging. Recent Prog Horm Res. 2001;56:1–21. | ||
Daniel MC, Astruc D. Gold nanoparticles: assembly, supramolecular chemistry, quantum-size-related properties, and applications toward biology, catalysis, and nanotechnology. Chem Rev. 2004;104:293–346. | ||
Ghoshmoulick R, Bhattacharya J, Mitra CK, Basak S, Dasgupta AK. Protein seeding of gold nanoparticles and mechanism of glycation sensing. Nanomedicine. 2007;3:208–214. | ||
Hahn A, Singh A, Sharma P, Brown S, Moudgil B. Nanoparticles as contrast agents for in-vivo bioimaging: current status and future perspectives. Anal Bioanal Chem. 2010;399:3–27. | ||
Arvizo R, Rana S, Miranda O, Bhattacharya R, Rotello V, Mukherjee P. Mechanism of anti-angiogenic property of gold nanoparticles: role of nanoparticle size and surface charge. Nanomedicine. 2011;7:580–587. | ||
Aggarwal P, Hall J, McLeland C, Dobrovolskaia M, McNeil S. Nanoparticle interaction with plasma proteins as it relates to particle biodistribution, biocompatibility and therapeutic efficacy. Adv Drug Deliver Rev. 2009;61:428–437. | ||
Ghosh P, Han G, De M, Kim CK, Rotello VM. Gold nanoparticles in delivery applications. Adv Drug Deliver Rev. 2008;60:1307–1315. | ||
Dutta U, Cohenford MA, Dain AJ. Monitoring the effect of glucosamine and glyceraldehyde glycation on the secondary structure of human serum albumin and immunoglobulin G: An analysis based on circular dichroism, thermal melting profiles and UV–fluorescence spectroscopy. Anal Chim Acta. 2006;558:187–194. | ||
Seneviratne C, Dombi GW, Liu W, Dain JA. In vitro glycation of human serum albumin by dihydroxyacetone and dihydroxyacetone phosphate. Biochem Biophys Res Commun. 2012;417:817–823. | ||
Cho SJ, Roman G, Yeboah F, Konishi Y. The road to advanced glycation end products: a mechanistic perspective. Curr Med Chem. 2007;14:1653–1671. | ||
Mendez DL, Jensen RA, McElroy LA, Pena JM, Esquerra RM. The effect of non-enzymatic glycation on the unfolding of human serum albumin. Arch Biochem Biophys. 2005;444:92–99. | ||
Shaklai N, Garlick RL, Bunn HF. Nonenzymatic glycosylation of human serum albumin alters its conformation and function. J Bio Chem. 1984;259:3812–3817. | ||
Schmitt A, Gasic-Milencovic J, Schmitt J. Characterization of advanced glycation end products: Mass changes in correlation to side chain modifications. Anal Biochem. 2005;346:101–106. | ||
Dominguez-Medina S, McDonough S, Swanglap P, Landes CF, Link S. In situ measurement of bovine serum albumin interaction with gold nanospheres. Langmuir. 2012;28:9131–9139. | ||
Brewer SH, Glomm WR, Johnson MC, Knag MK, Franzen S. Probing BSA binding to citrate-coated gold nanoparticles and surfaces. Langmuir. 2005;21:9303–9307. | ||
Tsai DH, DelRio FW, Keene AM, et al. Adsorption and conformation of serum albumin protein on gold nanoparticles investigated using dimensional measurements and in situ spectroscopic methods. Langmuir. 2011;27:2464–2477. | ||
Wa C, Cerny RL, Clarke WA, Hage DS. Characterization of glycation adducts on human serum albumin by matrix-assisted laser desorption/ionization time-of-flight mass spectrometry. Clin Chim Acta. 2007;385:48–60. | ||
Casals E, Pfaller T, Duschl A, Oostingh GJ, Puntes V. Time evolution of the nanoparticle protein corona. ACS Nano. 2010;4:3623–3632. | ||
Khalifaha RG, Baynesb JW, Hudsona BG. Amadorins: novel post-Amadori inhibitors of advanced glycation reactions. Biochem Biophys Res Commun. 1999;257:251–258. | ||
Peng X, Ma J, Chen F, Wang M. Naturally occurring inhibitors against the formation of advanced glycation end-products. Food Funct. 2010;2:289–301. | ||
Engelen L, Stehouwer CDA, Schalkwijk CG. Current therapeutic interventions in the glycation pathway: evidence from clinical studies. Diabetes Obes Metab. 2013;15:677–689. |
 © 2014 The Author(s). This work is published and licensed by Dove Medical Press Limited. The
full terms of this license are available at https://www.dovepress.com/terms.php
and incorporate the Creative Commons Attribution
- Non Commercial (unported, v3.0) License.
By accessing the work you hereby accept the Terms. Non-commercial uses of the work are permitted
without any further permission from Dove Medical Press Limited, provided the work is properly
attributed. For permission for commercial use of this work, please see paragraphs 4.2 and 5 of our Terms.
© 2014 The Author(s). This work is published and licensed by Dove Medical Press Limited. The
full terms of this license are available at https://www.dovepress.com/terms.php
and incorporate the Creative Commons Attribution
- Non Commercial (unported, v3.0) License.
By accessing the work you hereby accept the Terms. Non-commercial uses of the work are permitted
without any further permission from Dove Medical Press Limited, provided the work is properly
attributed. For permission for commercial use of this work, please see paragraphs 4.2 and 5 of our Terms.